Embed Size (px)
Citation preview

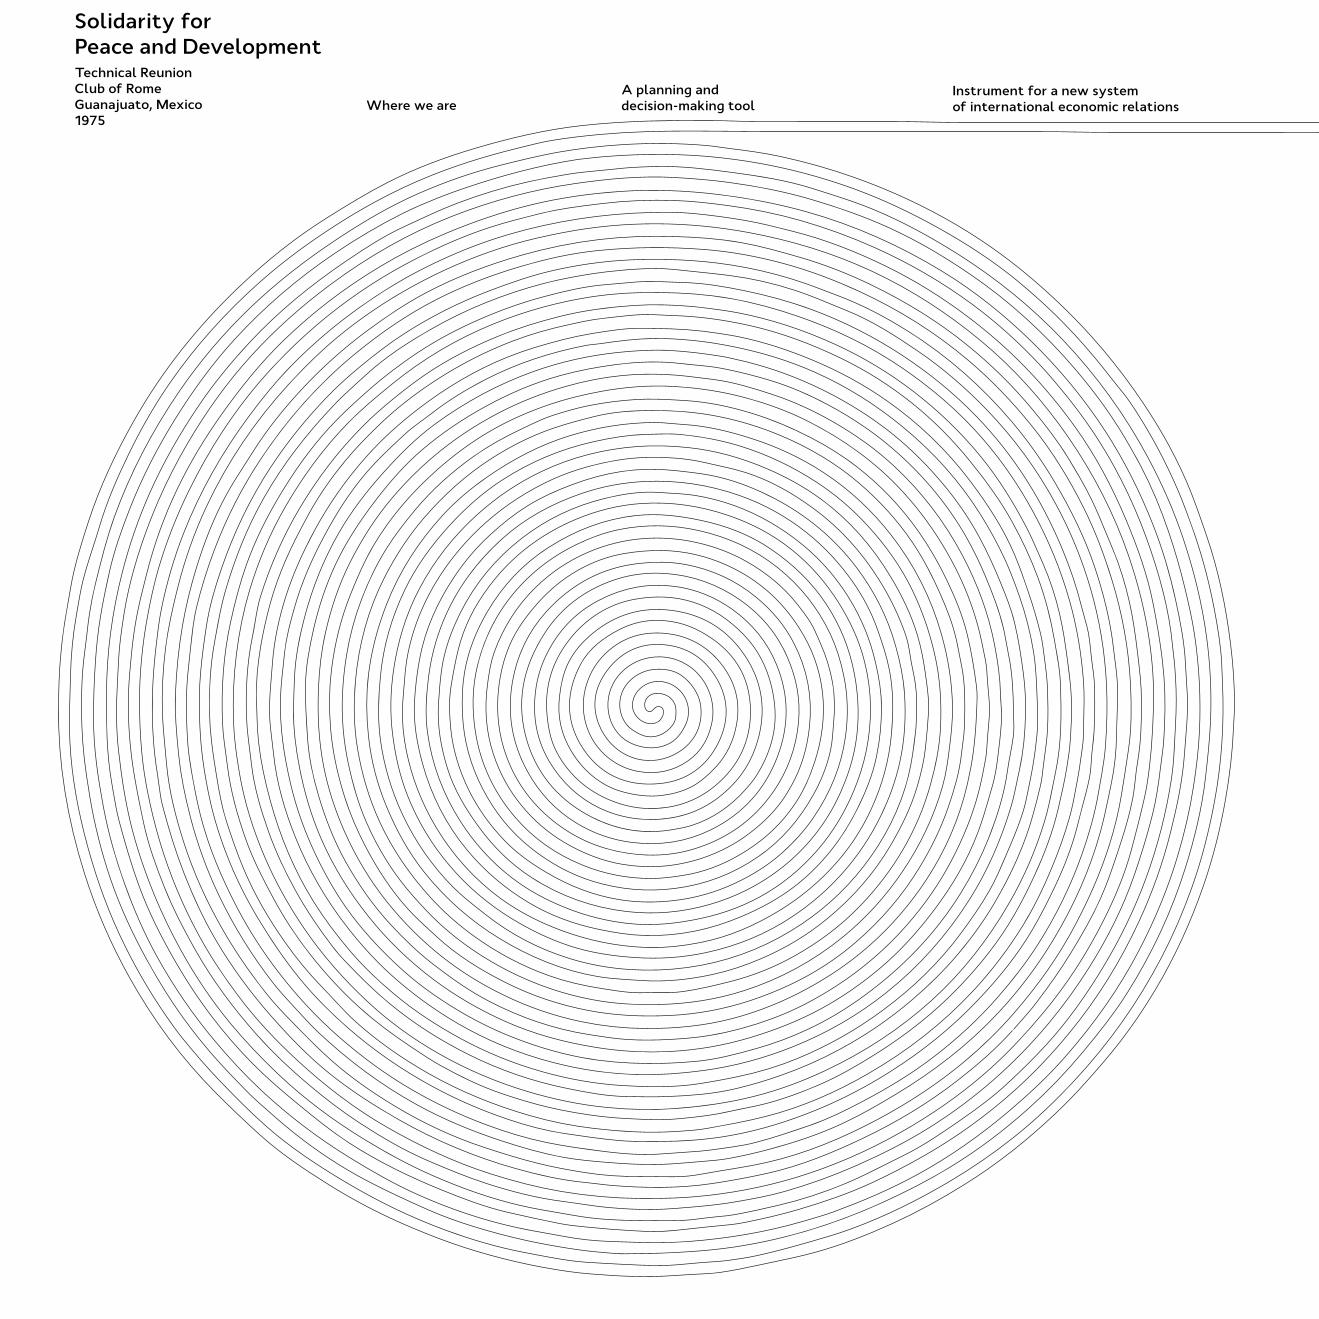
Where we areA planning anddecision-making tool
Instrument for a new systemof international economic relations
Solidarity forPeace and DevelopmentTechnical ReunionClub of RomeGuanajuato, Mexico1975
AngiospermsGimnospermsFernsChlorophytaAlgaeBacteriaSpongesEchinoideaTrilobitesArthropodsAmmonitesFishAmphibiansReptilesBirdsMammalsMan
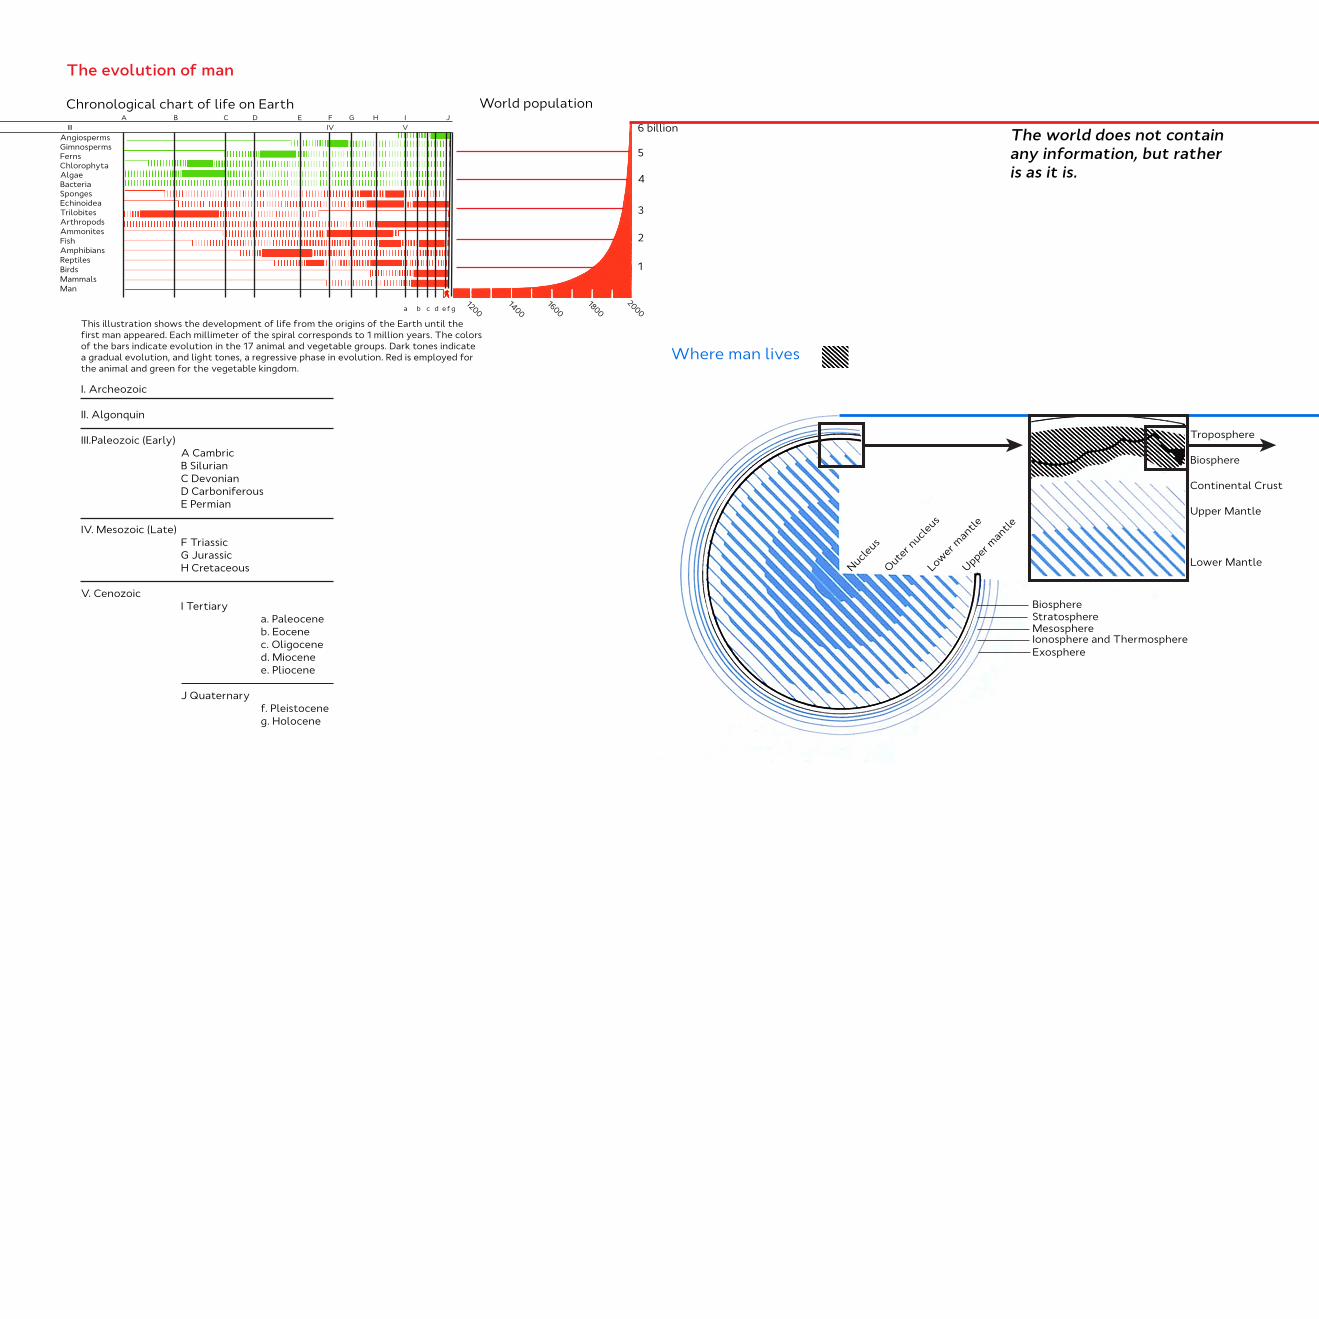
The evolution of man
World population
6 billion
5
4
3
2
1
12001600
18002000
This illustration shows the development of life from the origins of the Earth until the first man appeared. Each millimeter of the spiral corresponds to 1 million years. The colors of the bars indicate evolution in the 17 animal and vegetable groups. Dark tones indicate a gradual evolution, and light tones, a regressive phase in evolution. Red is employed for the animal and green for the vegetable kingdom.
III IV VThe world does not contain any information, but rather is as it is.
Where man lives
Troposphere
Biosphere
Continental Crust
Upper Mantle
Lower MantleNucleus
Outer n
ucleus
Lower mantle
Upper mantle
I. Archeozoic
II. Algonquin
III.Paleozoic (Early) A Cambric B Silurian C Devonian D Carboniferous E Permian
IV. Mesozoic (Late) F Triassic G Jurassic H Cretaceous
V. Cenozoic I Tertiary a. Paleocene b. Eocene c. Oligocene d. Miocene e. Pliocene J Quaternary f. Pleistocene g. Holocene
B C D E F G H IA
a b c d e f g
BiosphereStratosphereMesosphereIonosphere and ThermosphereExosphere
Chronological chart of life on EarthJ
1400
Surprisingly, the population will find obvious what up until now has been evident only toa few; that the entire economic organization channeled into a better life has become thegreatest enemy of social wellbeing.
80 years706050
40
302010
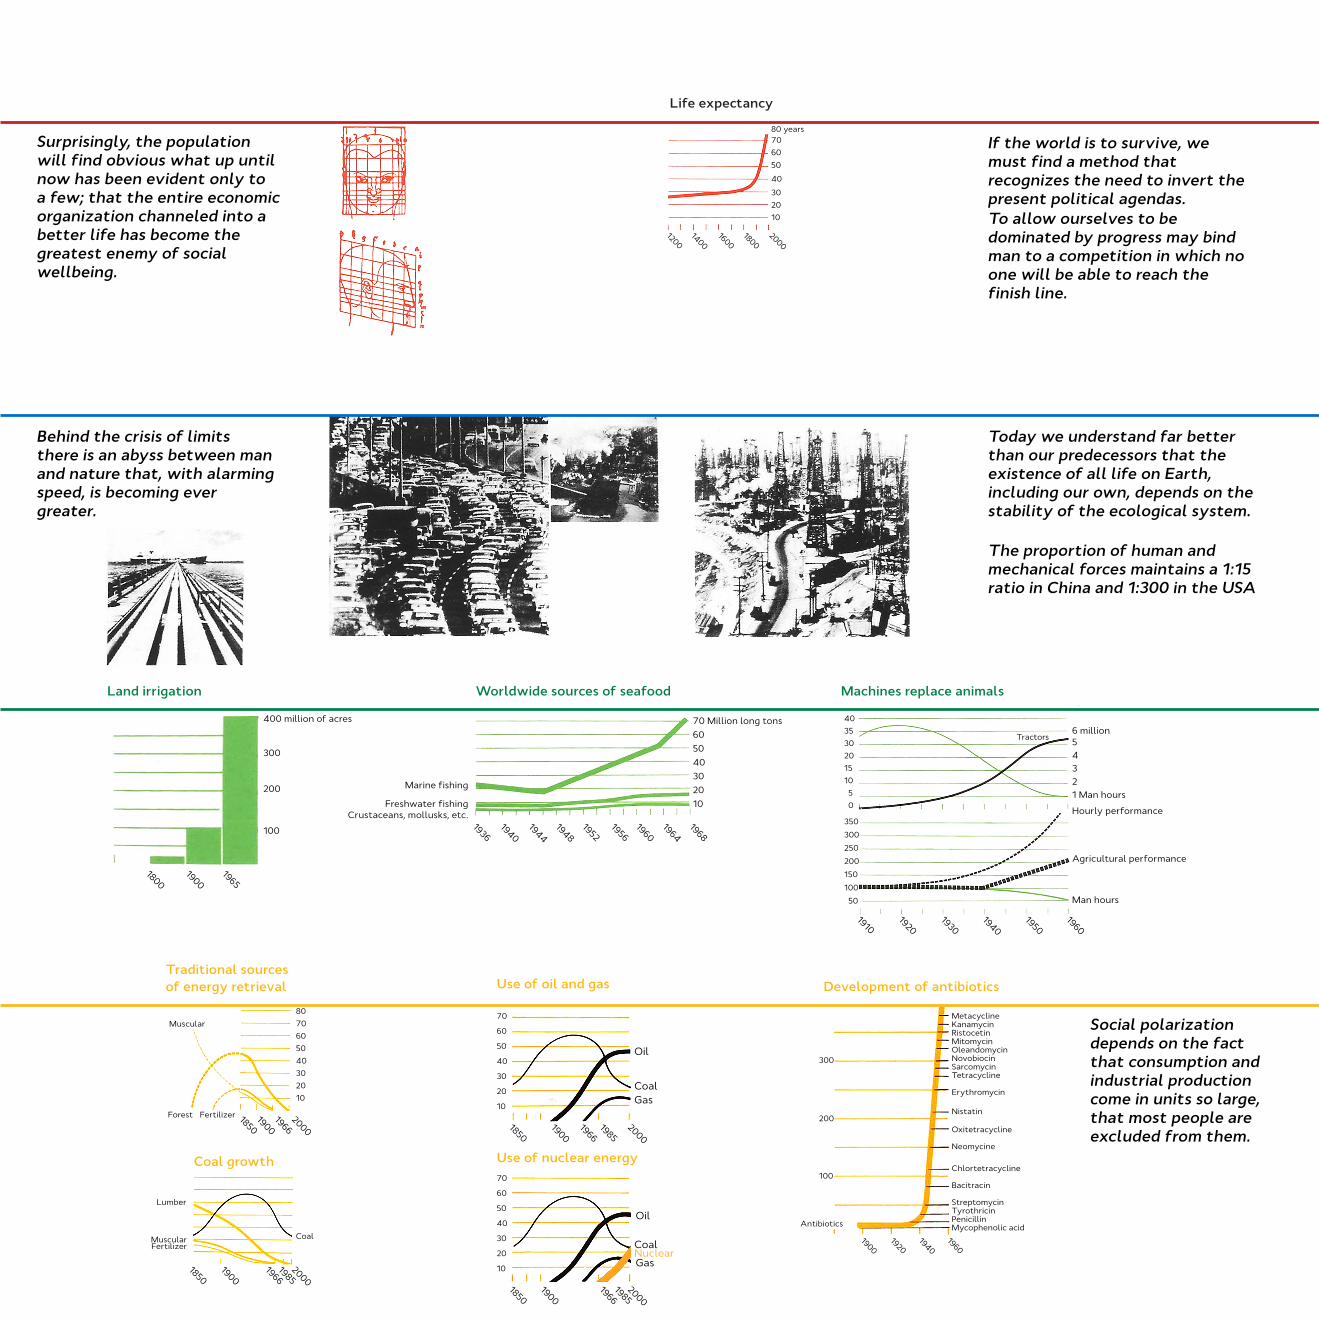
Life expectancy
12001400
16001800
2000
If the world is to survive, we must find a method that recognizes the need to invert the present political agendas.To allow ourselves to be dominated by progress may bind man to a competition in which no one will be able to reach the finish line.
Behind the crisis of limits there is an abyss between man and nature that, with alarming speed, is becoming ever greater.
Today we understand far better than our predecessors that the existence of all life on Earth, including our own, depends on the stability of the ecological system.
The proportion of human and mechanical forces maintains a 1:15 ratio in China and 1:300 in the USA
100
70 Million long tons605040302010
403530201510 5 0
Land irrigation
18001900
1965
400 million of acres
300
200
Worldwide sources of seafood
Marine fishing
Freshwater fishingCrustaceans, mollusks, etc.
19361940
19441948
19521956
19601964
1968
Machines replace animals
350
300
250
200
150
100
50
19101920
19301940
19501960
Man hours
6 million54321 Man hours
Hourly performance
Agricultural performance
Coal growth
Traditional sourcesof energy retrieval
8070605040302010
MetacyclineKanamycinRistocetinMitomycinOleandomycinNovobiocinSarcomycinTetracycline
Erythromycin
Nistatin
Oxitetracycline
Neomycine
Chlortetracycline
Bacitracin
StreptomycinTyrothricinPenicillinMycophenolic acid
Social polarization depends on the fact that consumption and industrial production come in units so large, that most people are excluded from them.
Use of oil and gas
Use of nuclear energy
Development of antibiotics
70
60
50
40
30
20
10
70
60
50
40
30
20
10
18501900
19661985
2000
Nuclear
Oil
CoalGas
Oil
Coal
Gas
Antibiotics
19001920
19401960
100
200
300
Coal
Lumber
MuscularFertilizer
18501900
19662000
Muscular
Forest Fertilizer
Tractors
18501900
19661985
2000
18501900
19662000
1985
17001750
18001850
1900
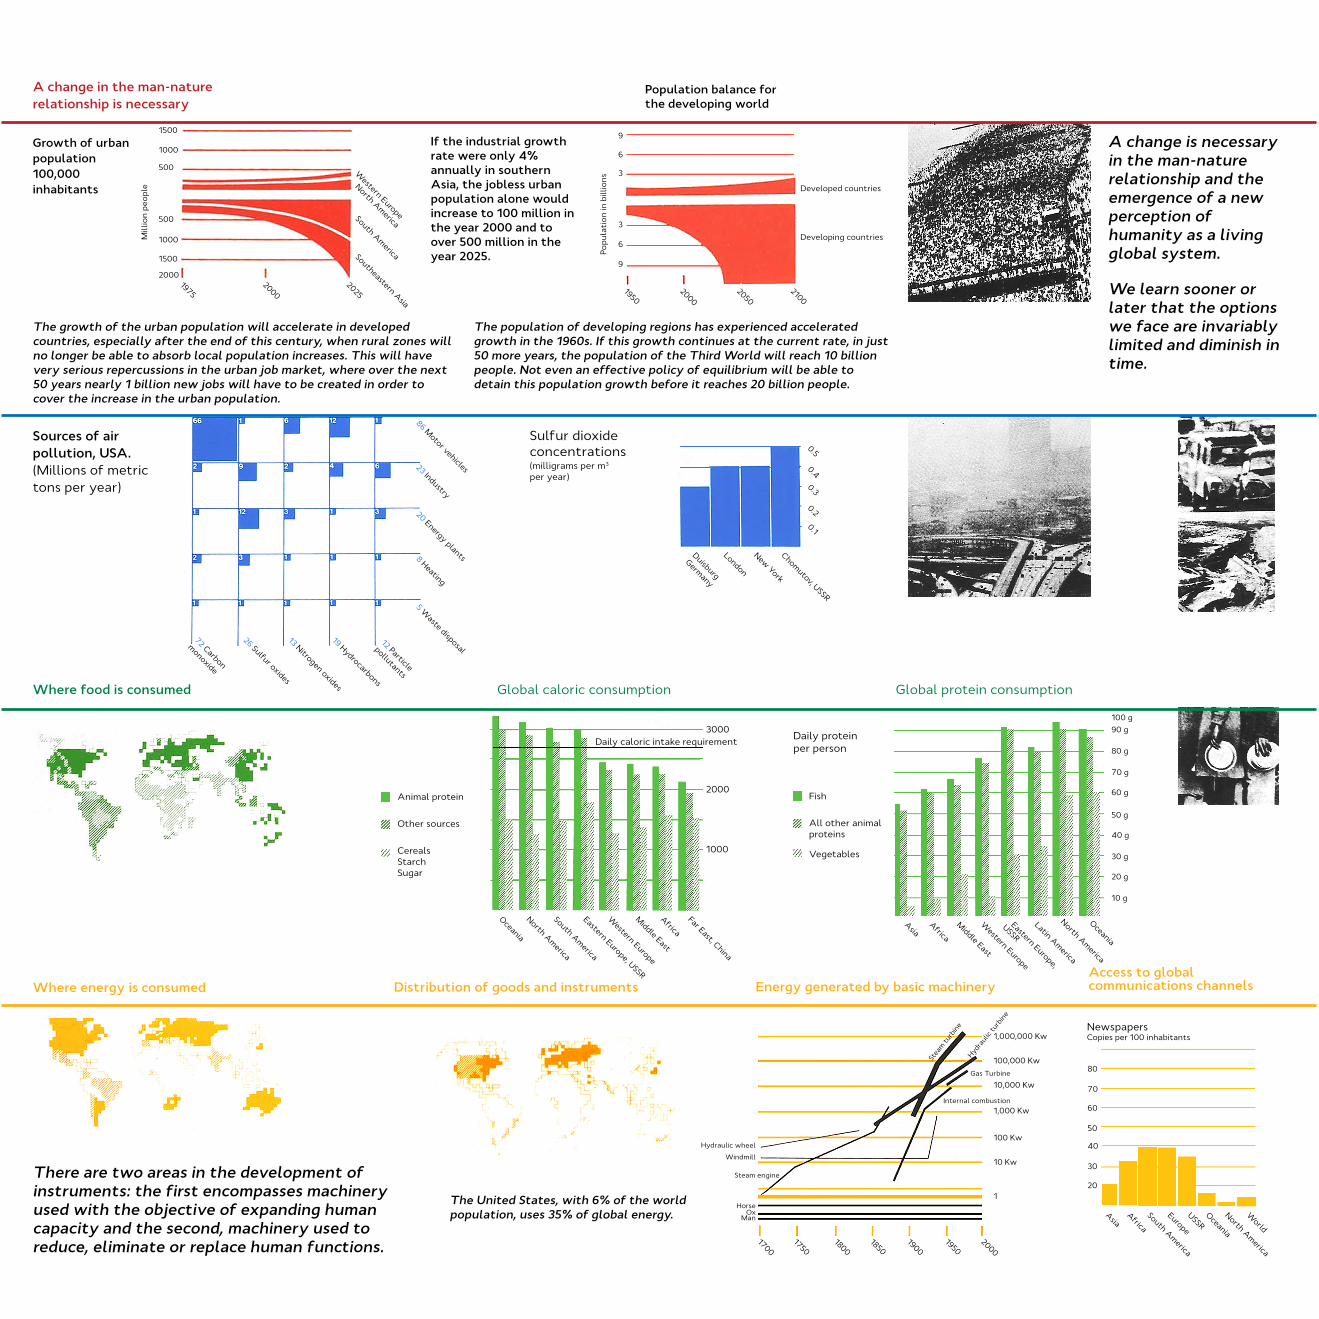
A change in the man-naturerelationship is necessary
Growth of urbanpopulation100,000inhabitants
The growth of the urban population will accelerate in developed countries, especially after the end of this century, when rural zones will no longer be able to absorb local population increases. This will have very serious repercussions in the urban job market, where over the next 50 years nearly 1 billion new jobs will have to be created in order to cover the increase in the urban population.
If the industrial growth rate were only 4% annually in southern Asia, the jobless urban population alone would increase to 100 million in the year 2000 and to over 500 million in the year 2025.
Population balance forthe developing world
The population of developing regions has experienced accelerated growth in the 1960s. If this growth continues at the current rate, in just 50 more years, the population of the Third World will reach 10 billion people. Not even an effective policy of equilibrium will be able to detain this population growth before it reaches 20 billion people.
A change is necessary in the man-nature relationship and the emergence of a new perception of humanity as a living global system.Po
pula
tion
in b
illio
ns
9
6
3
3
6
9
19502000
20502100
Developed countries
Developing countriesMill
ion
peop
le
1500
1000
500
2000
1500
1000
19752000
2025
Western Europe
North AmericaSouth AmericaSoutheastern Asia
Sources of airpollution, USA.(Millions of metrictons per year)
86 Motor vehicles23 Industry
20 Energy plants8 Heating
5 Waste disposal
72 Carbon
monoxide
26 Sulfur oxides
13 Nitrogen oxides
19 Hydrocarbons
12 Particle
pollutants
Sulfur dioxide concentrations
Duisburg
Germany
London
New York
Chomutov, USSR
0.1
0.2
0.3
0.4
0.5
(milligrams per m3 per year)
Where food is consumed
Animal protein
Other sources
CerealsStarchSugar
Global caloric consumption
Oceania
North America
South America
Eastern Europe, USSR
Western Europe
Middle East
Africa
Far East, China
3000Daily caloric intake requirement
2000
1000
Fish
All other animal proteins
Vegetables
Daily proteinper person
Asia Africa
Middle East
Western Europe
Eastern Europe,
USSR
Latin America
North America
Oceania
100 g90 g
80 g
70 g
60 g
50 g
40 g
30 g
20 g
10 g
Where energy is consumed
There are two areas in the development of instruments: the first encompasses machinery used with the objective of expanding human capacity and the second, machinery used to reduce, eliminate or replace human functions.
Distribution of goods and instruments
The United States, with 6% of the world population, uses 35% of global energy.
Energy generated by basic machinery
Steam engine
Hydraulic wheel
Windmill
1,000,000 Kw
100,000 Kw
10,000 Kw
1,000 Kw
100 Kw
10 Kw
1
19502000
HorseOx
Man
Stea
m tu
rbin
e
Hydraulic
turb
ine
Gas Turbine
Internal combustion
Access to globalcommunications channels
80
70
60
50
40
30
20
Copies per 100 inhabitants
AsiaAfrica
South America
Europe
USSROceania
North America
World
500
We learn sooner or later that the options we face are invariably limited and diminish in time.
Global protein consumption
Newspapers
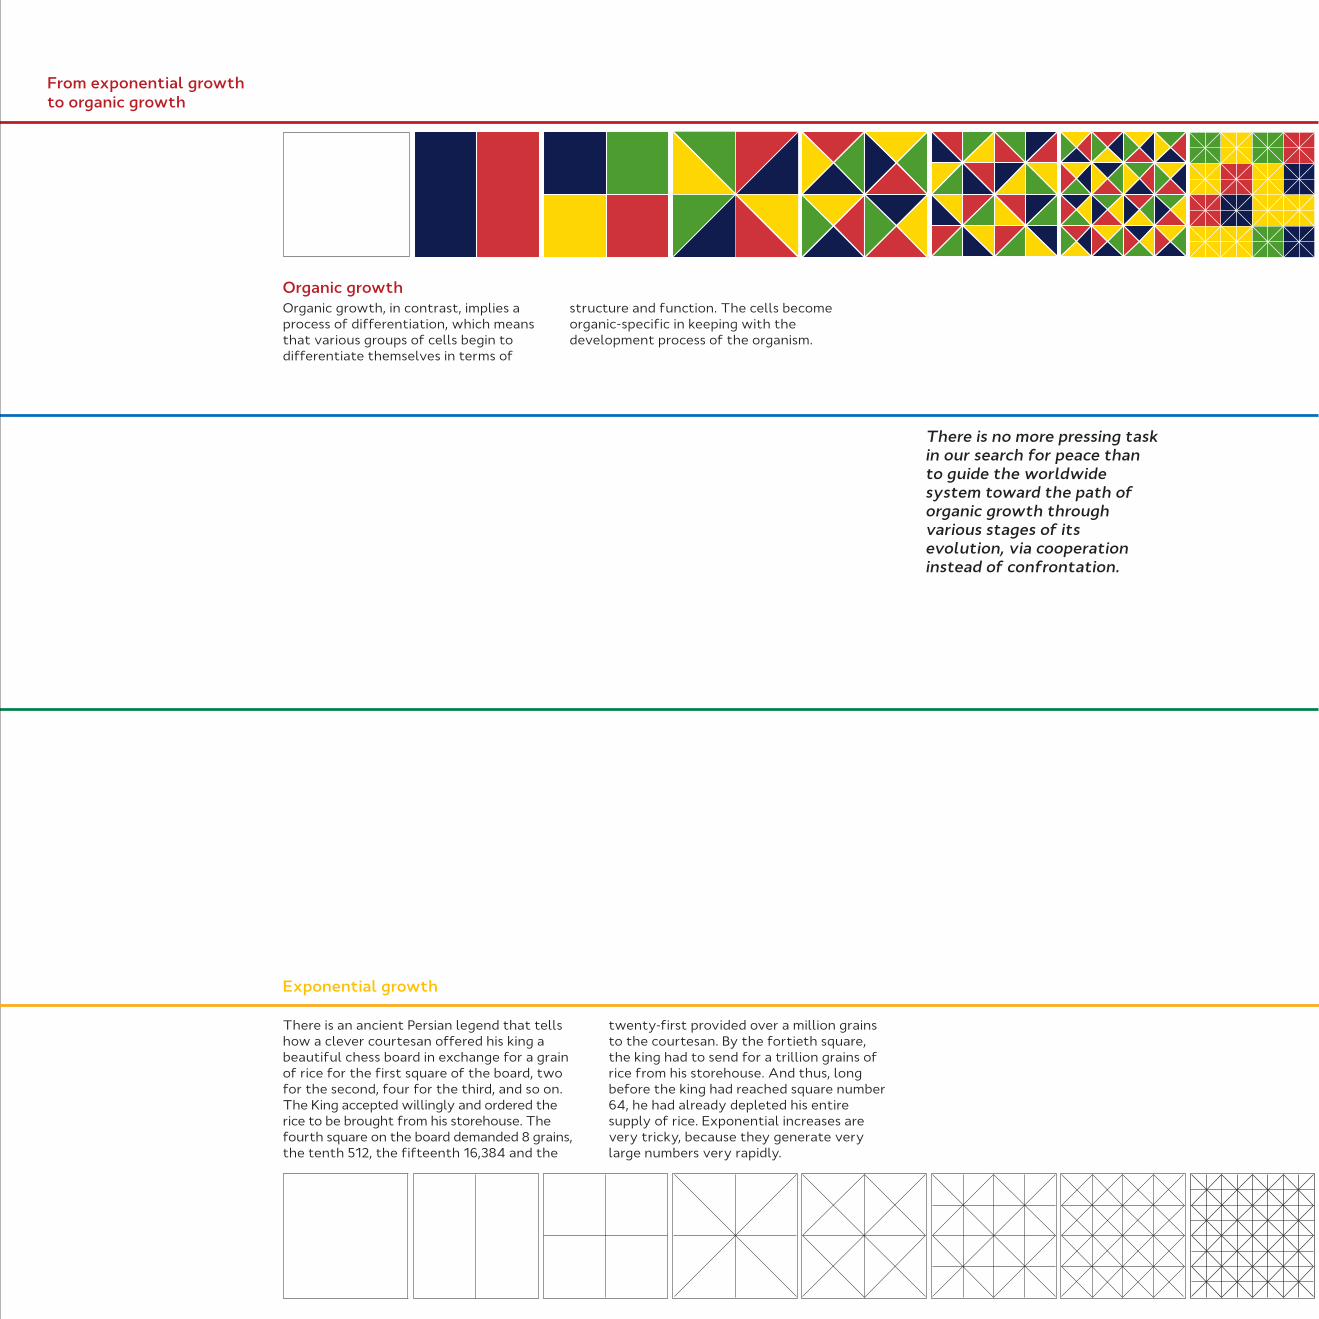
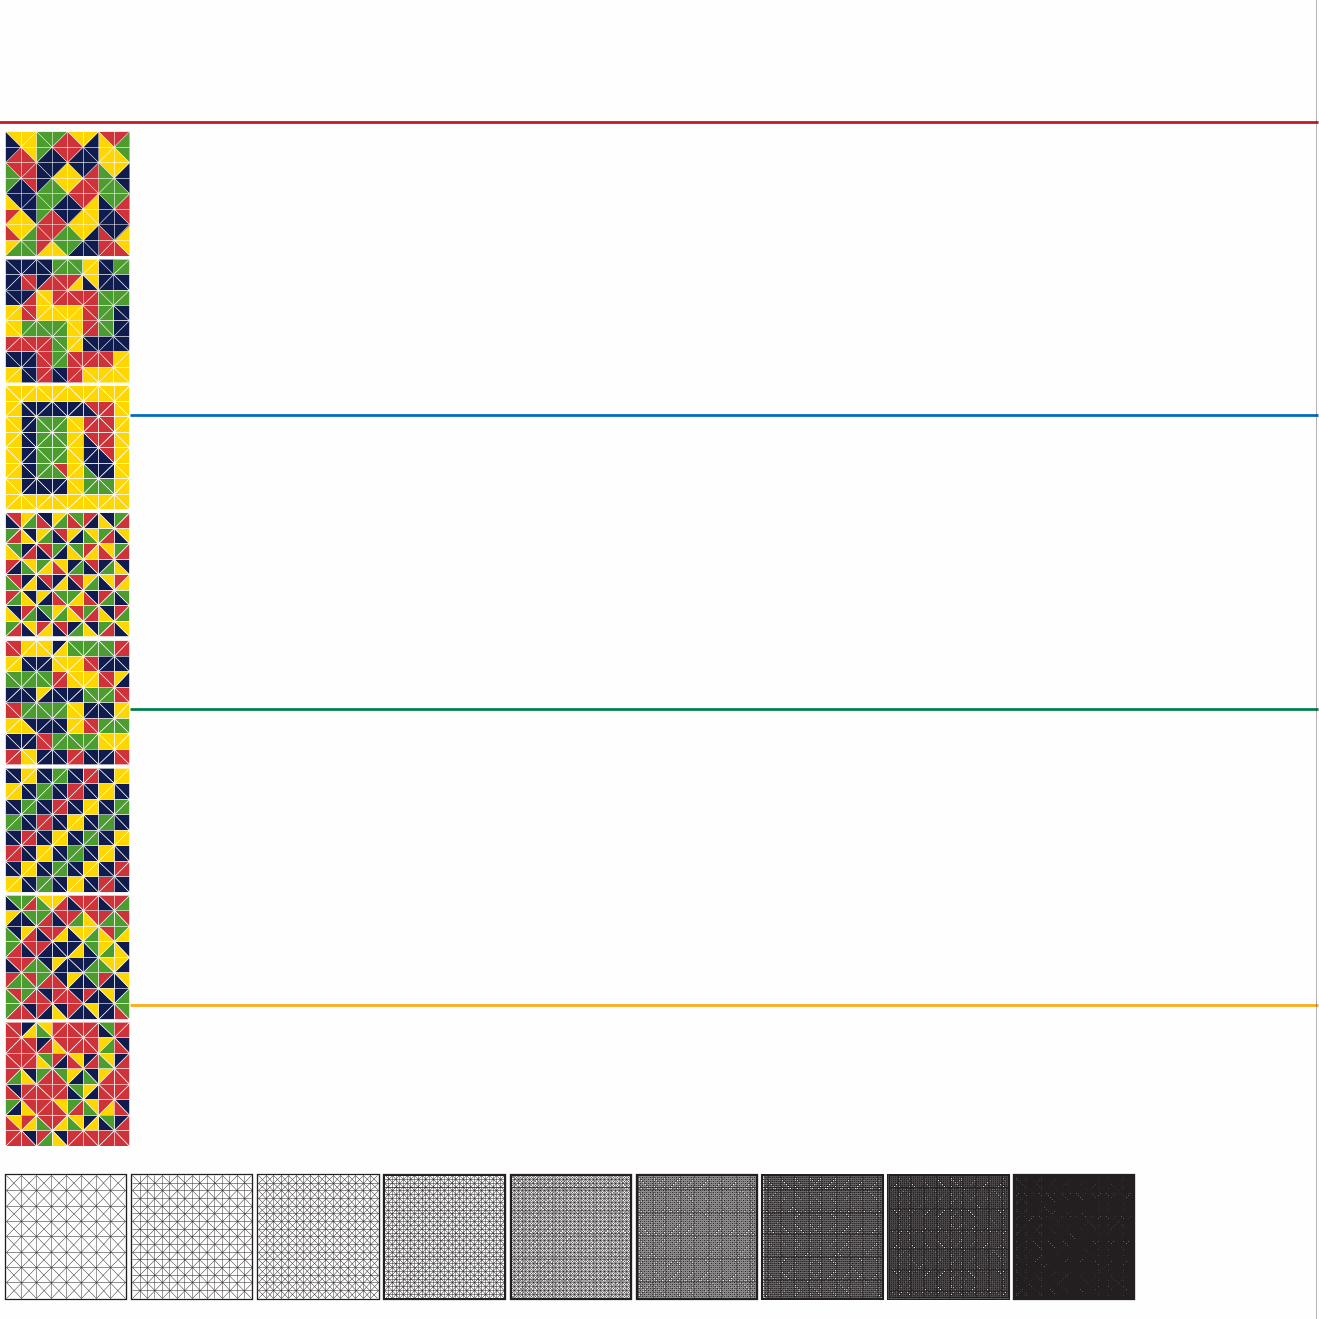
From exponential growthto organic growth
Organic growth, in contrast, implies a process of differentiation, which means that various groups of cells begin to differentiate themselves in terms of
There is no more pressing task in our search for peace than to guide the worldwide system toward the path of organic growth through various stages of its evolution, via cooperation instead of confrontation.
Organic growth
Exponential growth
There is an ancient Persian legend that tells how a clever courtesan offered his king a beautiful chess board in exchange for a grain of rice for the first square of the board, two for the second, four for the third, and so on. The King accepted willingly and ordered the rice to be brought from his storehouse. The fourth square on the board demanded 8 grains, the tenth 512, the fifteenth 16,384 and the
twenty-first provided over a million grains to the courtesan. By the fortieth square, the king had to send for a trillion grains of rice from his storehouse. And thus, long before the king had reached square number 64, he had already depleted his entire supply of rice. Exponential increases are very tricky, because they generate very large numbers very rapidly.
structure and function. The cells become organic-specific in keeping with the development process of the organism.
Charter of Economic Rightsand Duties of States.
We believe in a new international economic order
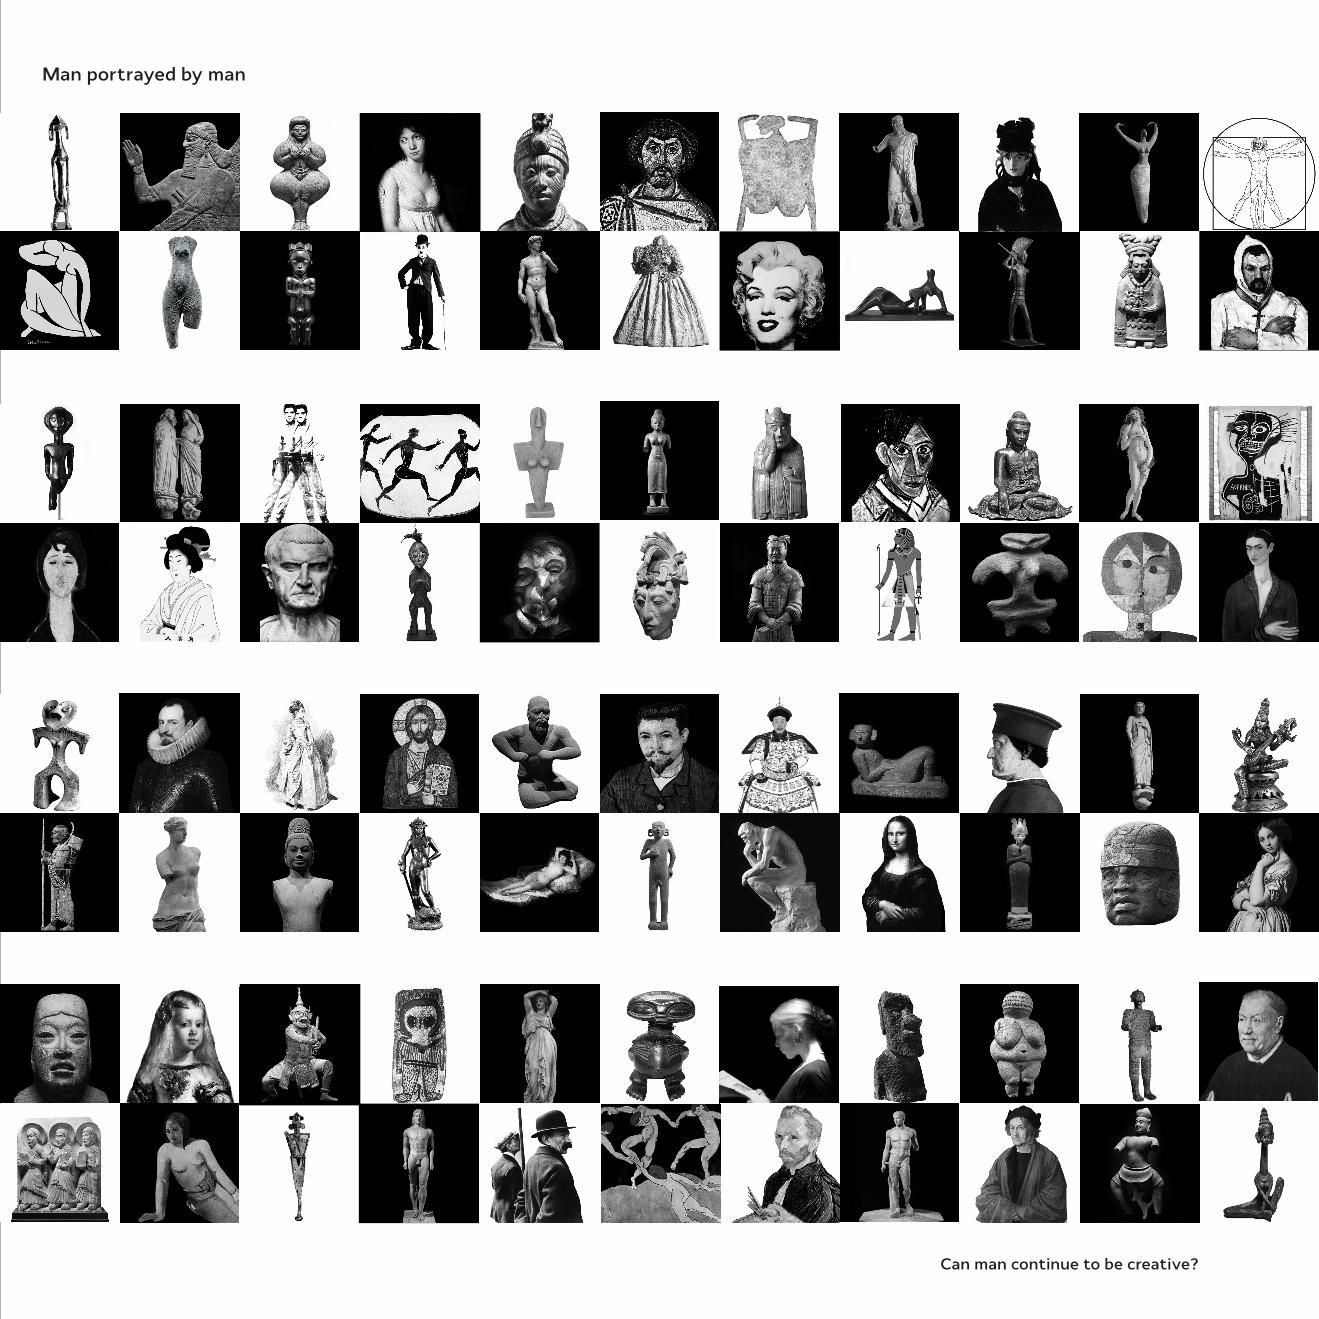
Man portrayed by man
Can man continue to be creative?