Embed Size (px)
Citation preview

cf. city flows
Till Nagel & Christopher Pietsch
A comparative visualization of urban bike mobility
MapTime Berlin, 28 June 2016

Nat
iona
l Geo
grap
hic
Meandering design process
Urban data visualizations Our previous work

Touching Transport
Shanghai Metro Flow
Isoscope
LiquiData


Concept General idea of the project

cf. city flows is a visualization of urban bike mobility.

cf. city flows is a visualization of urban bike mobility designed to help citizens analyze bike-sharing system.

cf. city flows is a visualization of urban bike mobility designed to help citizens casually analyze bike-sharing systems in the context of a public exhibition space.

cf. city flows is a visualization environment of urban bike mobility designed to help citizens casually analyze bike-sharing systems in the context of a public exhibition space. Large screens show the space of flows in bike sharing.

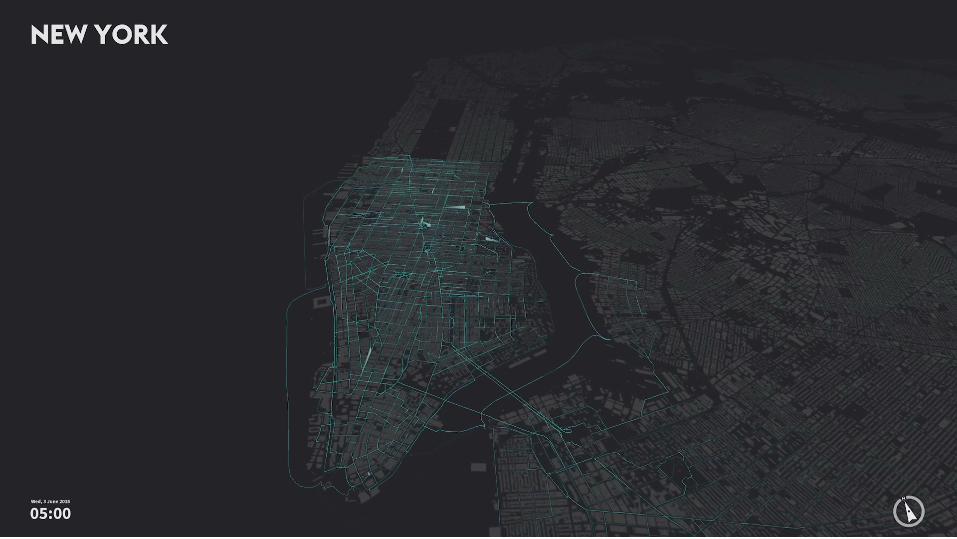
cf. city flows is a comparative visualization environment of urban bike mobility designed to help citizens casually analyze three bike-sharing systems in the context of a public exhibition space. Multiple large screens show the space of flows in bike sharing for three selected cities: New York, Berlin, and London.

cf. city flows is a comparative visualization environment of urban bike mobility designed to help citizens casually analyze three bike-sharing systems in the context of a public exhibition space. Multiple large screens show the space of flows in bike sharing for three selected cities: New York, Berlin, and London. Bike journeys are represented in three geospatial visualizations.

cf. city flows is a comparative visualization environment of urban bike mobility designed to help citizens casually analyze three bike-sharing systems in the context of a public exhibition space. Multiple large screens show the space of flows in bike sharing for three selected cities: New York, Berlin, and London. Bike journeys are represented in three geospatial visualizations designed to be progressively more analytical, from animated trails to small-multiple glyphs.


Bike Sharing Data Collecting, processing, and analyzing data sets
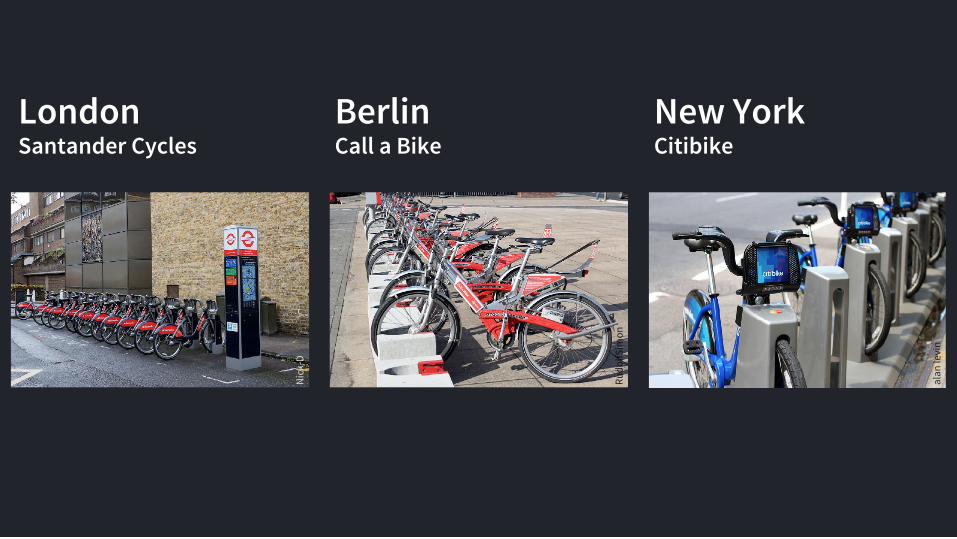
London Santander Cycles
Berlin Call a Bike
New York Citibike
alan
levi
n
Rudo
lfSim
on
Nic
k-D

London Santander Cycles
Berlin Call a Bike
New York Citibike
20° C
3 June 2015
21° C 21° C
alan
levi
n
Rudo
lfSim
on
Nic
k-D

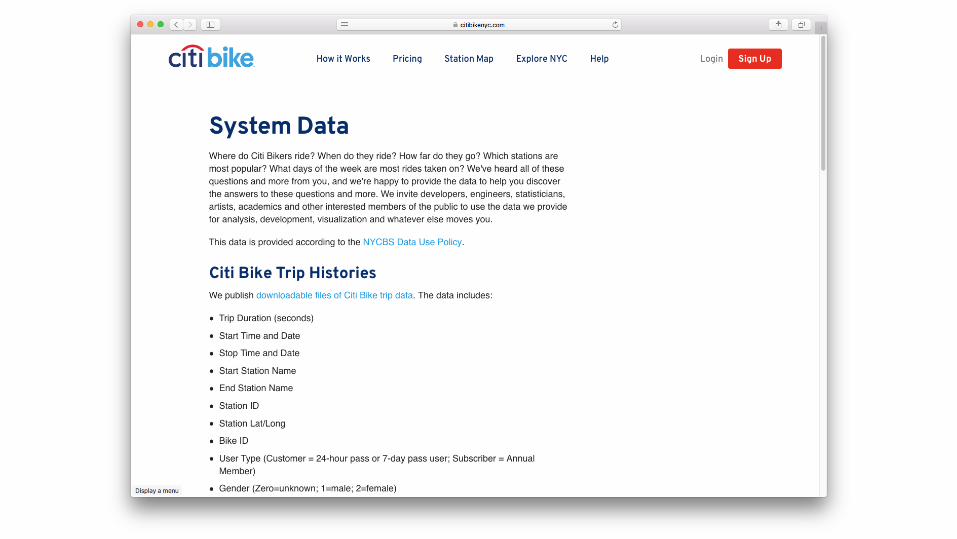


Raw data

Visual Experiments Digging into the data


HER
E Ro
utin
g AP
I


Design Considerations Comparing vastly different cities

Basemap
Till
Nag
el

Comparing cities
The
Star
, grid
by
Robi
n Ch
ubb
Euro
stat


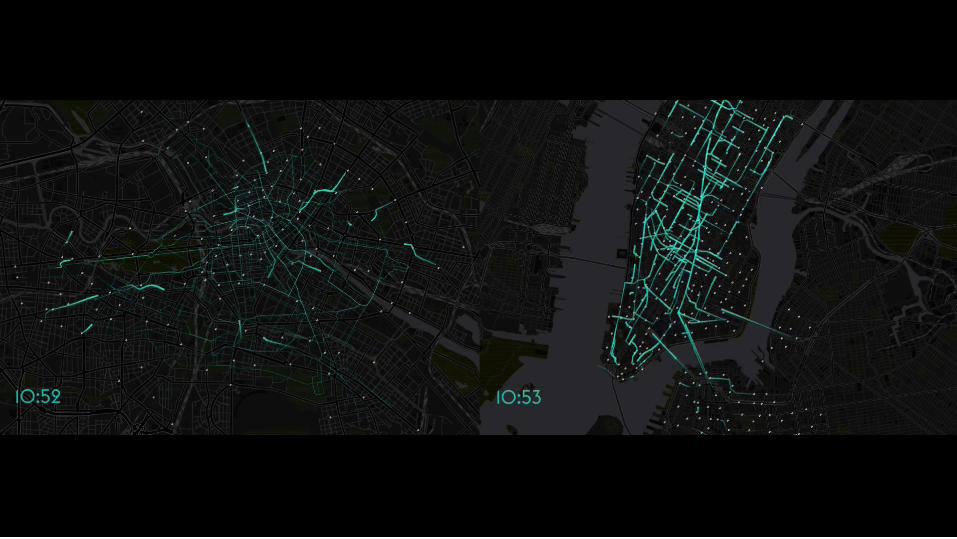
Scaling maps
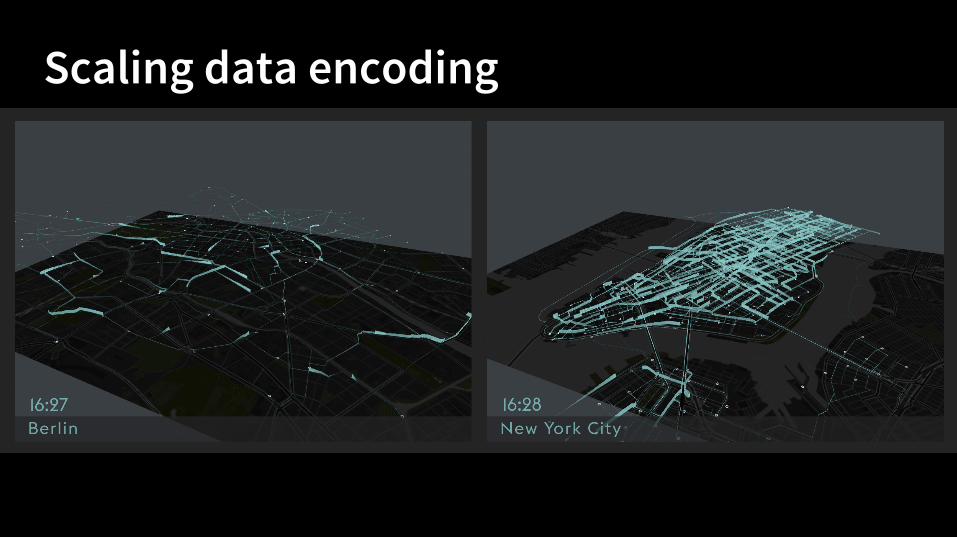
Scaling data encoding

Three viewing modes Different levels of spatial and temporal granularity
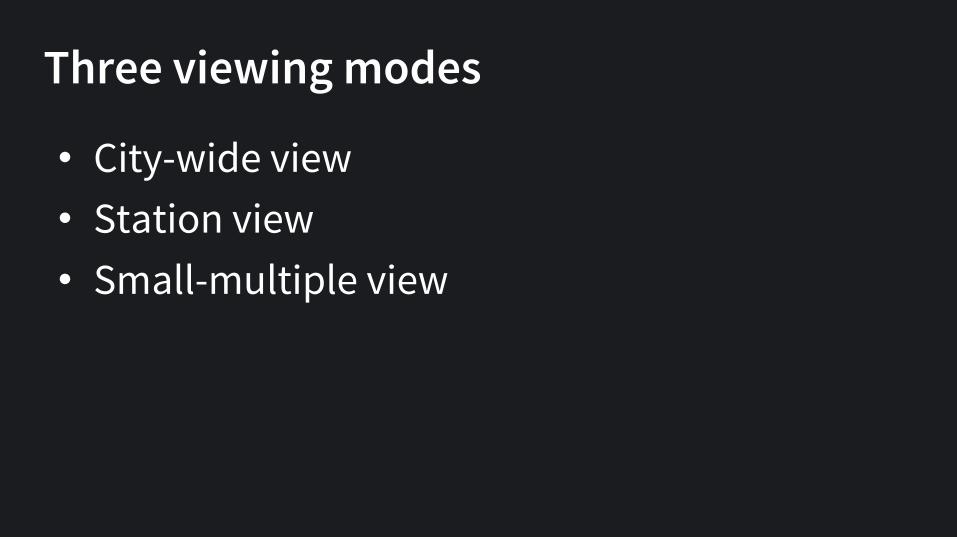
• City-wide view • Station view • Small-multiple view
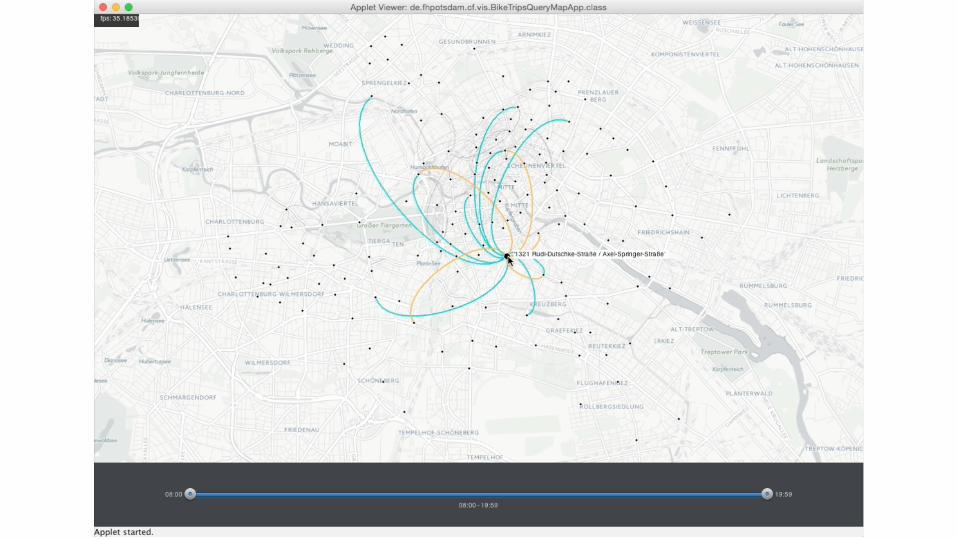
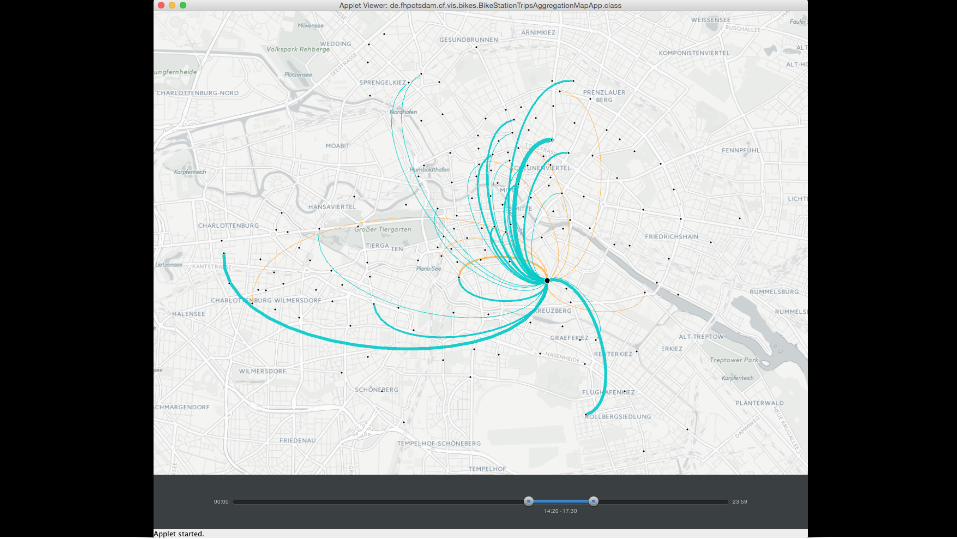
Three viewing modes
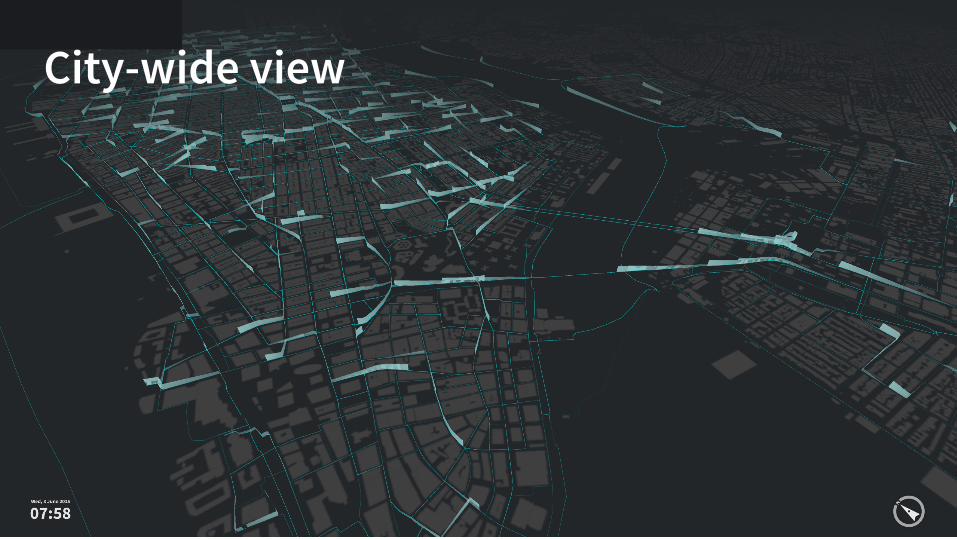
City-wide view

Station view

Small-multiple view

Staged Analysis From Evocative to Comparative Visualizations


Transitions

Guide through visualizations

Exhibition Streams & Traces

Web
site
: Ph
illip
Kor
tlang
& C
hris
Mag
iera

Prod
uct d
esig
n: S
amira
Akh
avan
, And
rea
Bied
erm
ann,
Chr
istia
n M
ünch


Observations Feedback and Insights

Phot
o: S
teph
anie
Neu
man
n
Comparisons as conversation starters

Challenging complexity

Südd
euts
che
Zeitu
ng

Thank you.
http://tillnagel.com – twitter: @tillnm Dr. Till Nagel & Christopher Pietsch Urban Complexity Lab, FH Potsdam