Embed Size (px)
Citation preview
IN's Infographic HackA 7 minute insider infosession
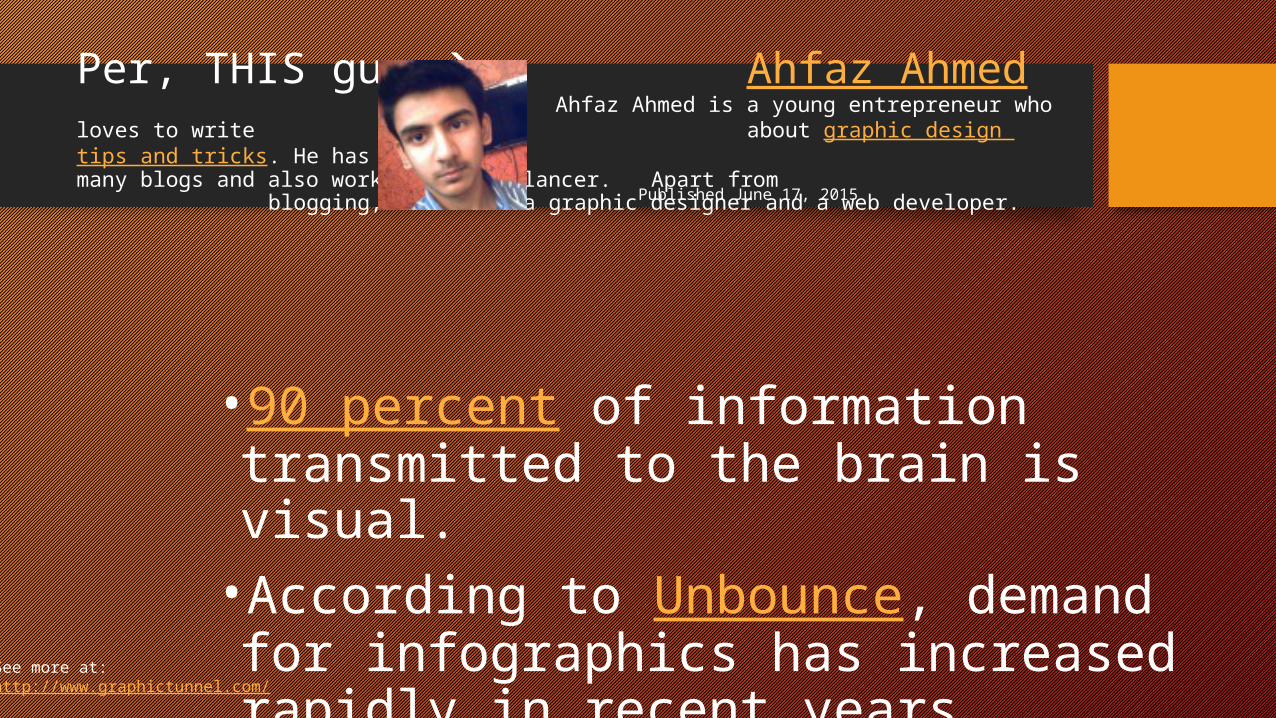
Per, THIS guy Ahfaz Ahmed Ahfaz Ahmed is a young entrepreneur who loves to write about graphic design tips and tricks. He has worked on many blogs and also works as a Freelancer. Apart from blogging, he’s also a graphic designer and a web developer.
•90 percent of information transmitted to the brain is visual.•According to Unbounce, demand for infographics has increased rapidly in recent years.
Published June 17, 2015
See more at: http://www.graphictunnel.com/
Per, THIS guy Ahfaz Ahmed Ahfaz Ahmed is a young entrepreneur who loves to write about graphic design tips and tricks. He has worked on many blogs and also works as a Freelancer. Apart from blogging, he’s also a graphic designer and a web developer.Published June 17, 2015
See more at: http://www.graphictunnel.com/
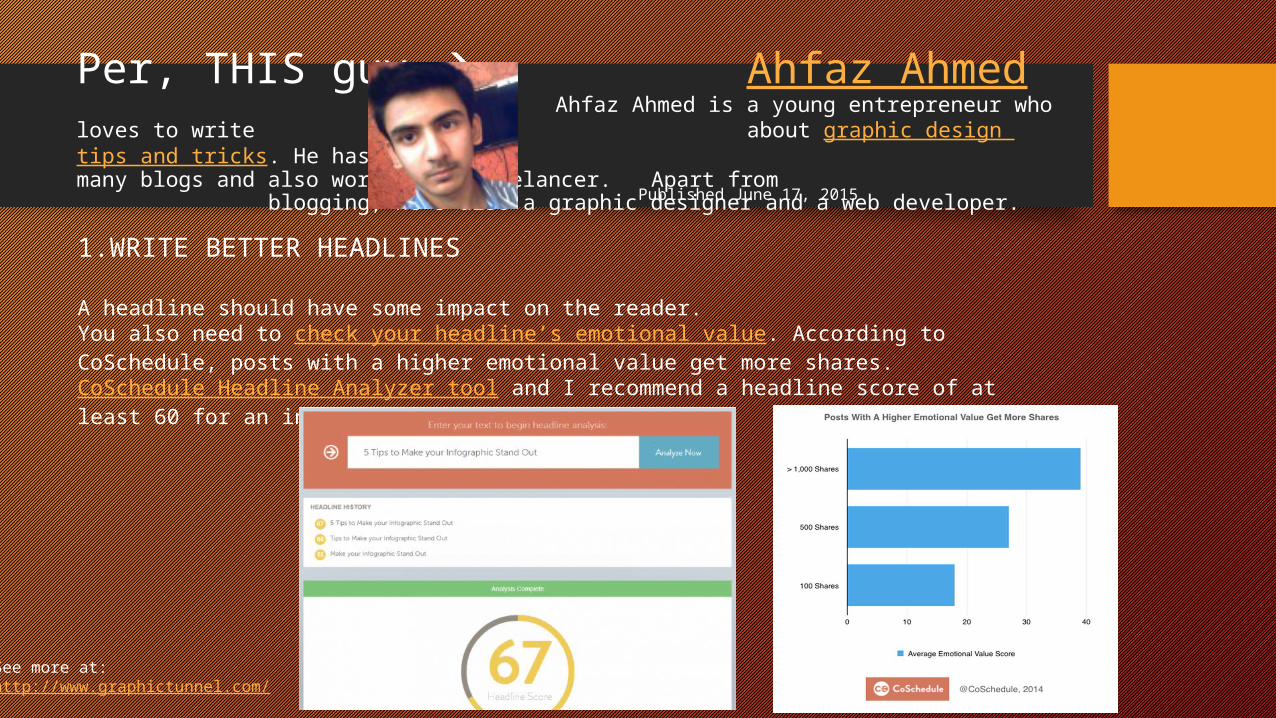
1.WRITE BETTER HEADLINES
A headline should have some impact on the reader. You also need to check your headline’s emotional value. According to CoSchedule, posts with a higher emotional value get more shares.CoSchedule Headline Analyzer tool and I recommend a headline score of at least 60 for an infographic.
Per, THIS guy Ahfaz Ahmed Ahfaz Ahmed is a young entrepreneur who loves to write about graphic design tips and tricks. He has worked on many blogs and also works as a Freelancer. Apart from blogging, he’s also a graphic designer and a web developer.Published June 17, 2015
See more at: http://www.graphictunnel.com/
3. CHOOSE A GOALWithout a specific, pre-defined goal, your infographic will be ineffective.
No matter how cool your design is or how much data you have compiled, your infographic will not serve its purpose if it doesn’t revolve around a relevant and interesting theme.
And, with a specific goal in mind, it becomes easier to segment and target your intended audience.
Per,THIS guy Ahfaz Ahmed Ahfaz Ahmed is a young entrepreneur who loves to write about graphic design tips and tricks. He has worked on many blogs and also works as a Freelancer. Apart from blogging, he’s also a graphic designer and a web developer.Published June 17, 2015
See more at: http://www.graphictunnel.com/
4. SHAREABILITYYou didn’t put all the time and effort into research and design of your infographic, just to have it sit idle on a webpage, did you?
Use the word “Infographic” in the blog post that hosts the infographic. This attracts readers and increases social shares because infographics are inherently easier to consume than paragraphs of text.
Tweet it to influencers in your niche and ask them to help spread the message.
Always include a call to action at the end of your infographic.
Consider writing a social media release if your infographic is truly share-worthy.
Per, THIS guy
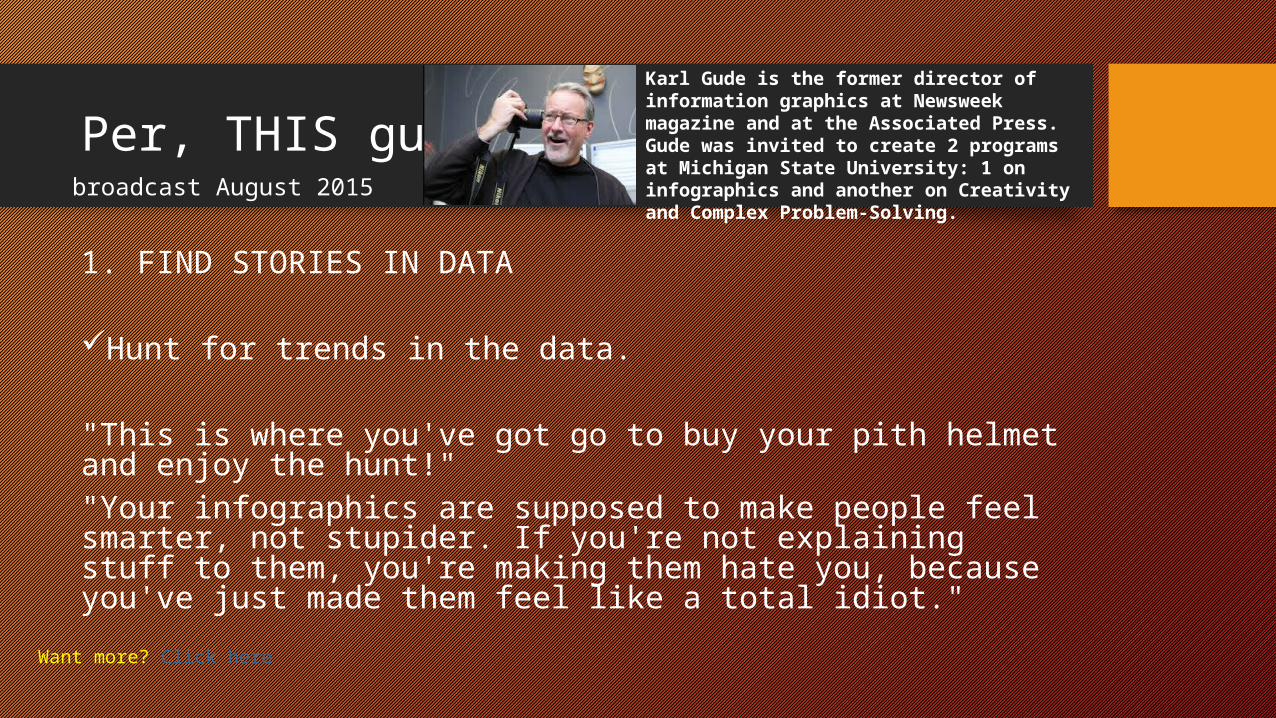
1. FIND STORIES IN DATA
Hunt for trends in the data.
"This is where you've got go to buy your pith helmet and enjoy the hunt!" "Your infographics are supposed to make people feel smarter, not stupider. If you're not explaining stuff to them, you're making them hate you, because you've just made them feel like a total idiot."
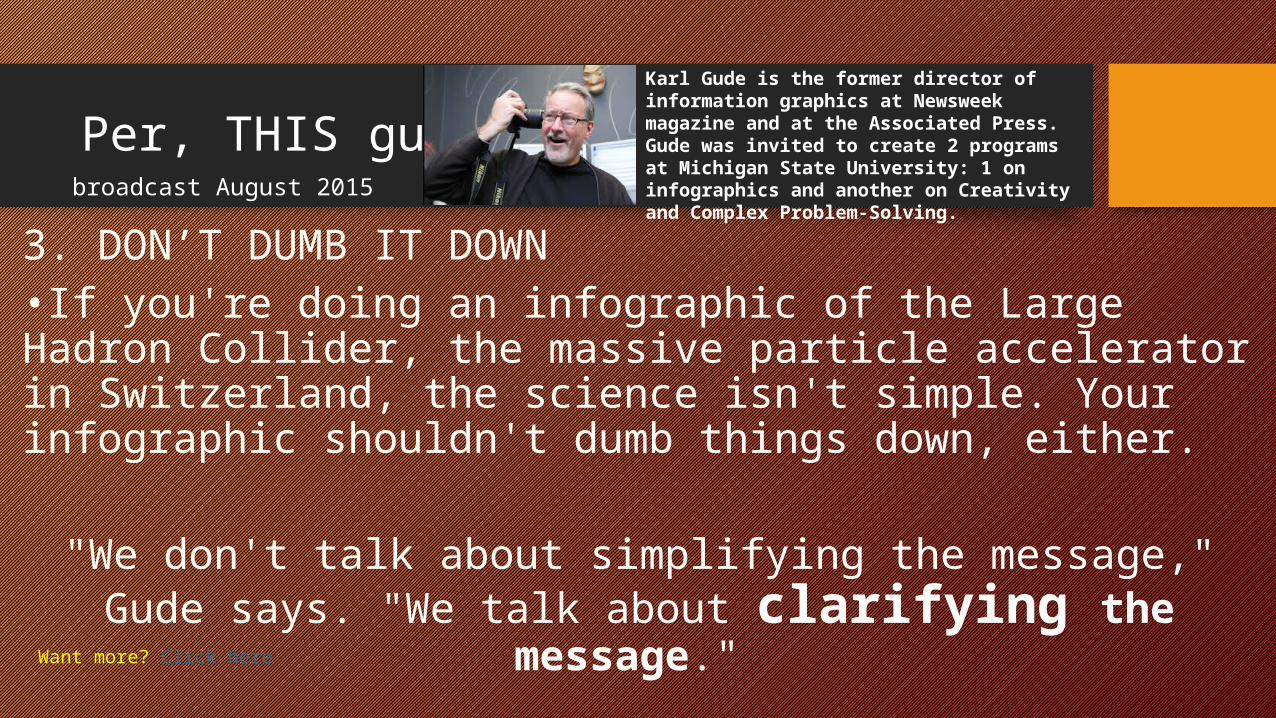
broadcast August 2015
Karl Gude is the former director of information graphics at Newsweek magazine and at the Associated Press. Gude was invited to create 2 programs at Michigan State University: 1 on infographics and another on Creativity and Complex Problem-Solving.
Want more? Click here
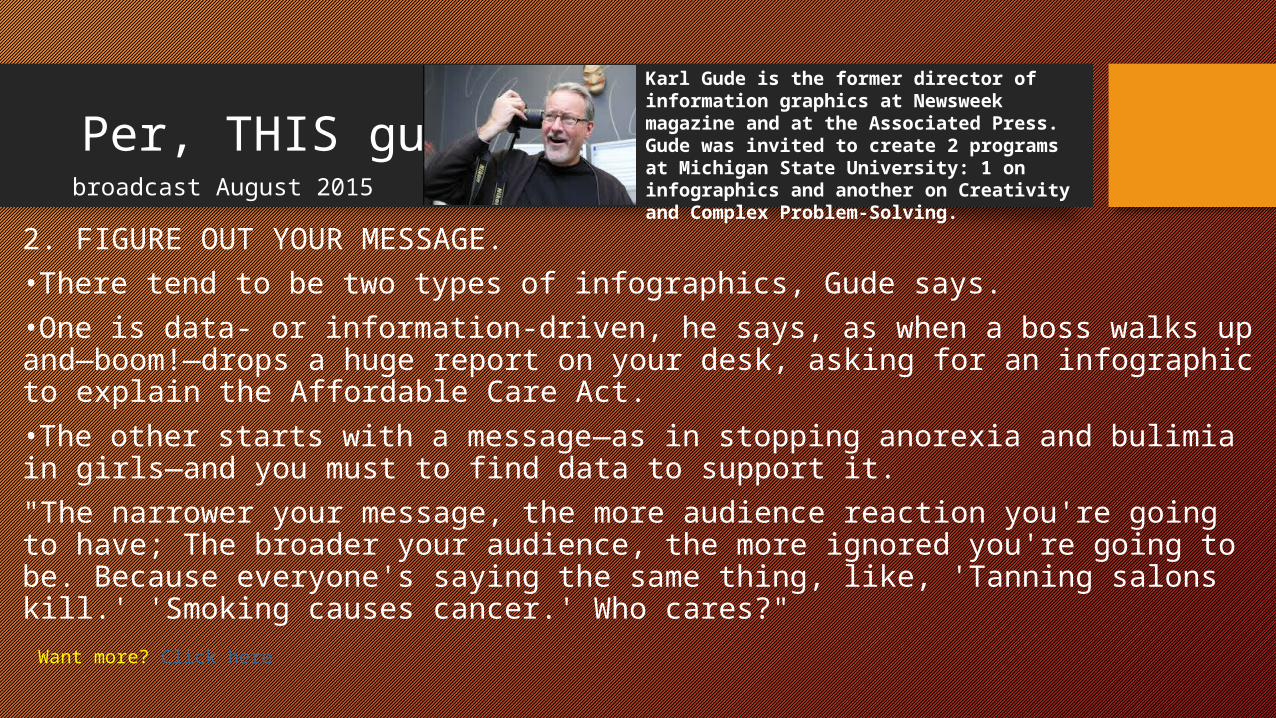
Per, THIS guy 2. FIGURE OUT YOUR MESSAGE.•There tend to be two types of infographics, Gude says. •One is data- or information-driven, he says, as when a boss walks up and—boom!—drops a huge report on your desk, asking for an infographic to explain the Affordable Care Act. •The other starts with a message—as in stopping anorexia and bulimia in girls—and you must to find data to support it. "The narrower your message, the more audience reaction you're going to have; The broader your audience, the more ignored you're going to be. Because everyone's saying the same thing, like, 'Tanning salons kill.' 'Smoking causes cancer.' Who cares?"
broadcast August 2015
Karl Gude is the former director of information graphics at Newsweek magazine and at the Associated Press. Gude was invited to create 2 programs at Michigan State University: 1 on infographics and another on Creativity and Complex Problem-Solving.
Want more? Click here
Per, THIS guy
3. DON’T DUMB IT DOWN•If you're doing an infographic of the Large Hadron Collider, the massive particle accelerator in Switzerland, the science isn't simple. Your infographic shouldn't dumb things down, either.
"We don't talk about simplifying the message," Gude says. "We talk about clarifying the message."
broadcast August 2015
Karl Gude is the former director of information graphics at Newsweek magazine and at the Associated Press. Gude was invited to create 2 programs at Michigan State University: 1 on infographics and another on Creativity and Complex Problem-Solving.
Want more? Click here
Per, THIS guy
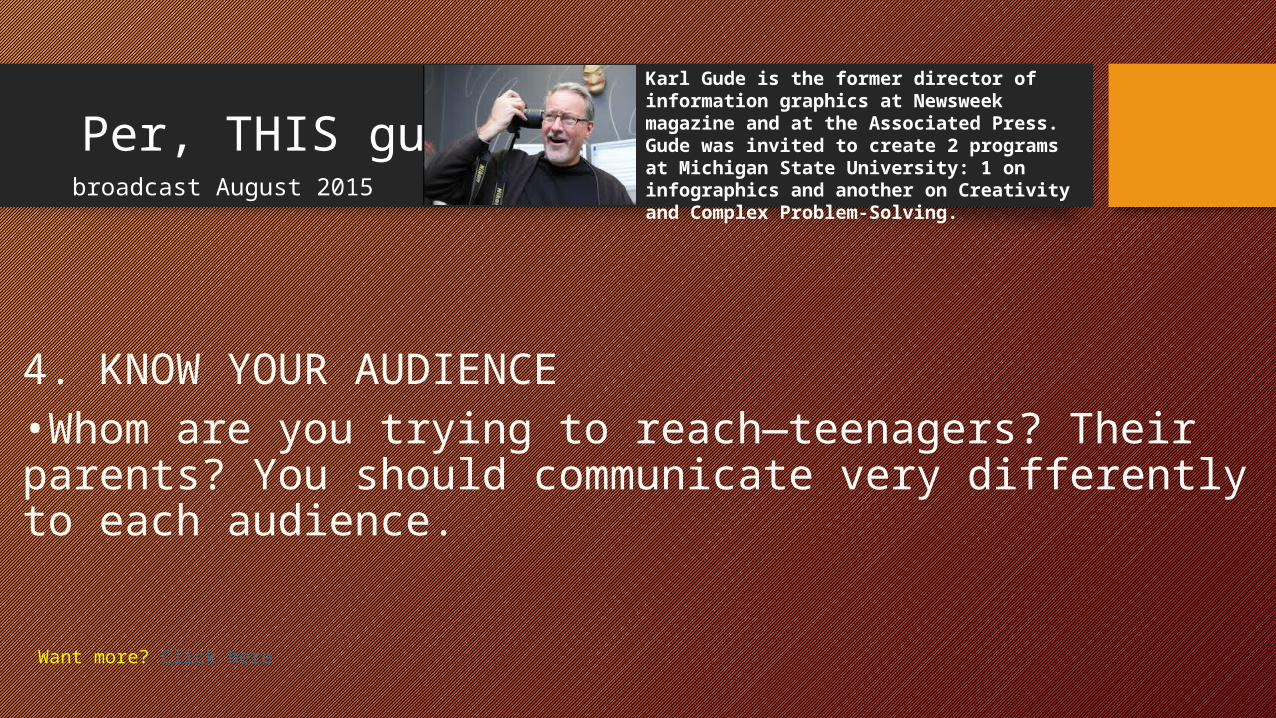
4. KNOW YOUR AUDIENCE•Whom are you trying to reach—teenagers? Their parents? You should communicate very differently to each audience.
broadcast August 2015
Karl Gude is the former director of information graphics at Newsweek magazine and at the Associated Press. Gude was invited to create 2 programs at Michigan State University: 1 on infographics and another on Creativity and Complex Problem-Solving.
Want more? Click here
Per, THIS guy
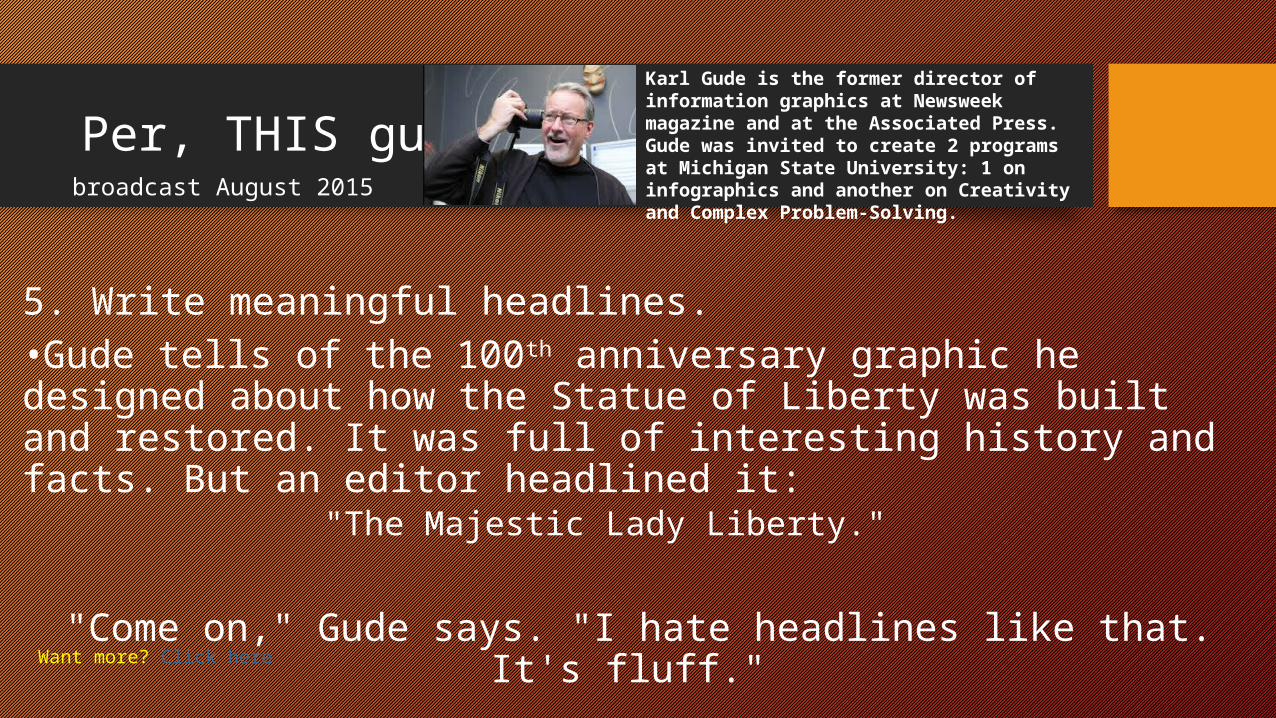
5. Write meaningful headlines. •Gude tells of the 100th anniversary graphic he designed about how the Statue of Liberty was built and restored. It was full of interesting history and facts. But an editor headlined it:
"The Majestic Lady Liberty."
"Come on," Gude says. "I hate headlines like that. It's fluff."
broadcast August 2015
Karl Gude is the former director of information graphics at Newsweek magazine and at the Associated Press. Gude was invited to create 2 programs at Michigan State University: 1 on infographics and another on Creativity and Complex Problem-Solving.
Want more? Click here
Per, THIS guy
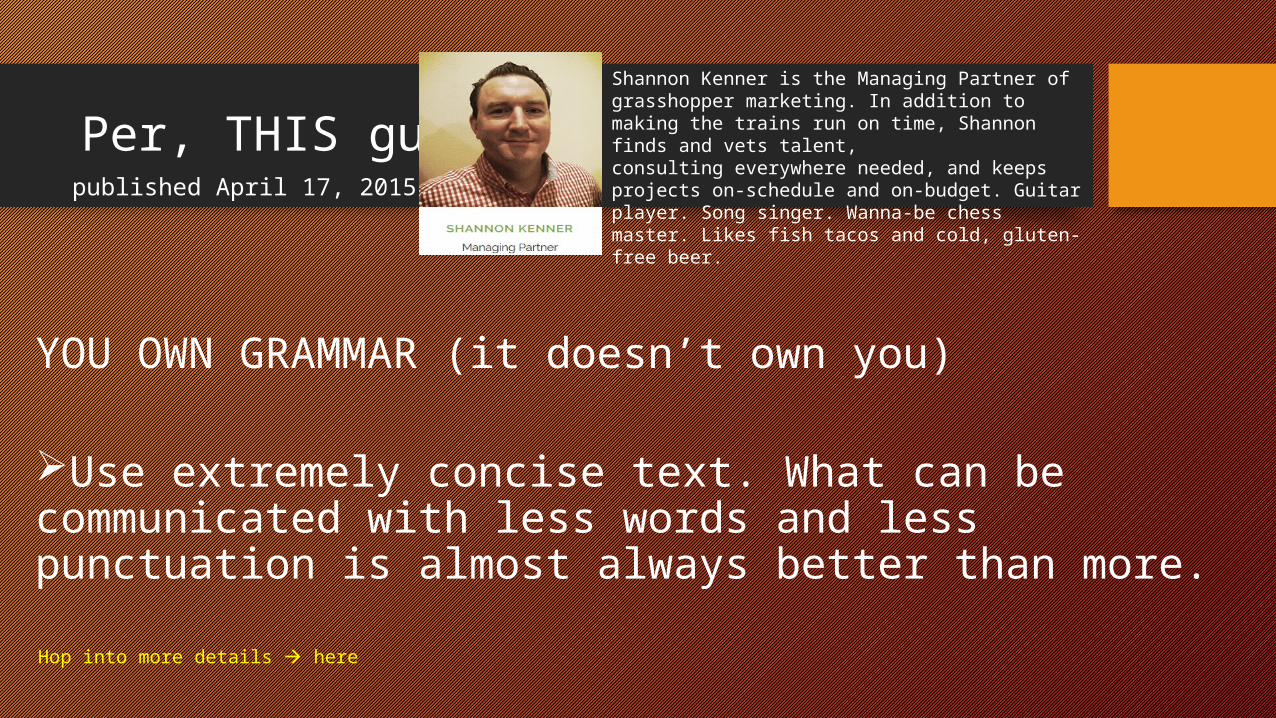
YOU OWN GRAMMAR (it doesn’t own you)
Use extremely concise text. What can be communicated with less words and less punctuation is almost always better than more.
published April 17, 2015
Shannon Kenner is the Managing Partner of grasshopper marketing. In addition to making the trains run on time, Shannon finds and vets talent, consulting everywhere needed, and keeps projects on-schedule and on-budget. Guitar player. Song singer. Wanna-be chess master. Likes fish tacos and cold, gluten-free beer.
Hop into more details here
Per, THIS guy published April 17, 2015
Shannon Kenner is the Managing Partner of grasshopper marketing. In addition to making the trains run on time, Shannon finds and vets talent, consulting everywhere needed, and keeps projects on-schedule and on-budget. Guitar player. Song singer. Wanna-be chess master. Likes fish tacos and cold, gluten-free beer.
Hop into more details here
Per, THIS gal published November 23, 2015
Kristin Currin-Sheehan is an Editor with the Sovereign Health Group’s Digital Newsroom. She has a background in radio, television & web publications. She’s a poet and blogger. Creativity is her middle name. Literally.
Thank you San Clemente!