Embed Size (px)
Citation preview

1
VISUALIZING MACHINE LEARNING
PYCON 2017, DELHI

INCREASINGLY, OUR BEST MODELS ARE BLACK-BOX

3
TELECOM CHURN
“Churn of customers is a
particularly severe problem in
the telecom industry.
The challenge is to identify
the propensity of churn up to
a month in advance, even
before a customer moves out,
so that proactive
interventions can begin”

4
OK
WASTED
Marketing cost
Rs 40
MISSED
Acquisition cost
Rs 80OK
No churn Churn
No
ch
urn
Ch
urn
Prediction
Act
ual
8.3% 0.0%
MISSED WASTED
6.61
COST PER CUST.
0.0%
IMPROVEMENT
Base
MODELS
5
Outgoing call
0 0 - 4 15+5-14
1
RECHARGE
AMT > $20
01
YN
> 1
RECHARGE
0
N Y
3.2% 3.6%
MISSED WASTED
4.0
COST PER CUST.
39%
IMPROVEMENT
Decision Tree
MODELS

60.6% 2.5%
MISSED WASTED
2.21
COST PER CUST.
66%
IMPROVEMENT
SVM
MODELS
OK
WASTED
Marketing
cost
$1.8
MISSED
Acquisition
cost
$4.1
OK
No churn ChurnN
o c
hu
rnC
hu
rnPrediction
Act
ual
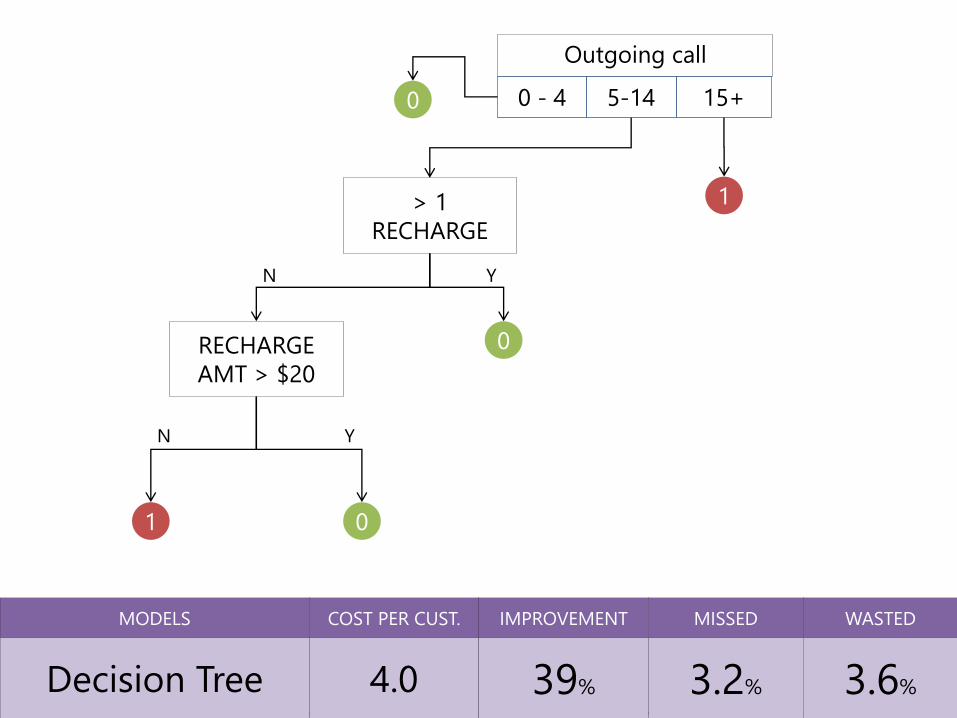
PRICE FORECASTING FOR AN
ASIAN AGRICULTURAL ENTERPRISE
Problem Approach Outcome
A Gramener Advanced Analytics Case Study
A leading agricultural
enterprise wanted price
forecasts for their products in
order to plan inventory
release to optimise revenue.
Incorrect timing was leading
either to loss of revenue or
unsold inventory.
Gramener applied a suite of
price forecasting models
based on internal and
external factors.
The models were evaluated
on multiple test datasets to
select one that minimised
median absolute deviation.
The model was able to
forecast the price to an
accuracy of 88%.
Within the first quarter of
deploying the model, the
revenue uplift attributable
directly to pricing was +3.2%.
8
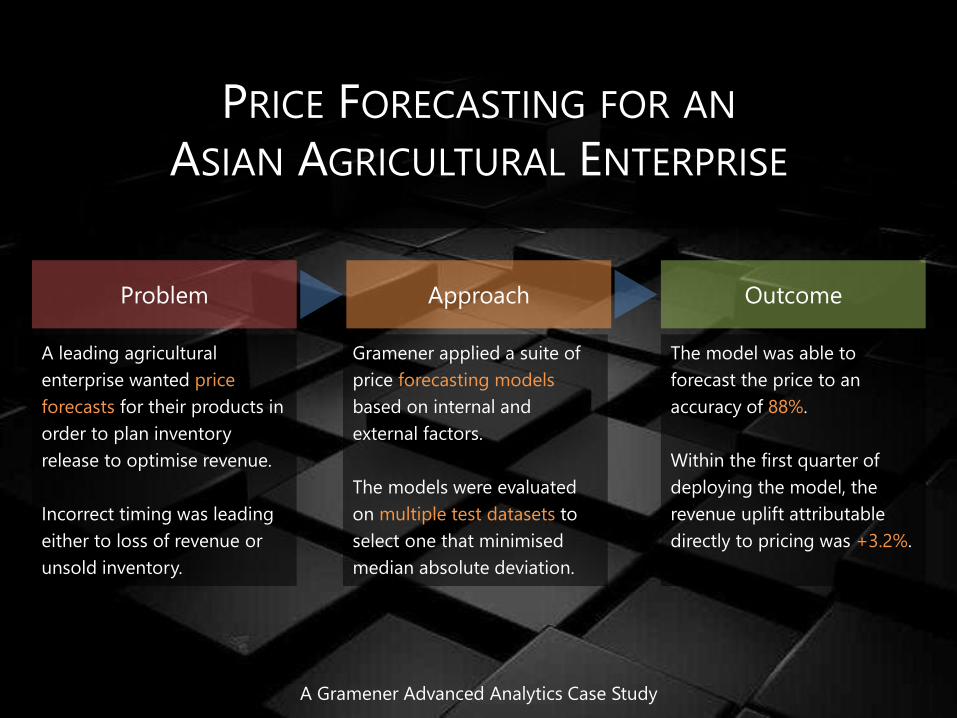
A COMPARISON OF PRICE FORECAST ACCURACY OF PURE
MODELS
ProductMoving Average
Auto-regression
Exponential Smoothing
ARIMAExponential Smoothing
Over State SpaceHybridModel
Neural Network
Multi-Linear Regression
Product 1 65.13 54.13 65.98 66.16 71.67 73.24 78.96 70.46
Product 2 66.89 56.66 66.74 68.12 74.41 74.65 89.15 73.87
Product 3 37.53 9.84 44.55 42.28 50.49 46.86 61.35 53.03
Product 4 37.16 4.92 50.22 43.50 52.19 53.40 68.63 53.15
Product 5 68.83 71.24 68.38 68.12 75.58 71.47 90.80 72.69
Product 6 69.41 69.60 69.24 70.16 77.55 75.75 80.41 75.09
Product 7 69.27 64.76 68.61 69.21 73.39 74.06 82.10 75.20
Product 8 64.54 52.50 63.93 64.41 68.31 70.82 79.70 70.78
Product 9 57.97 52.64 57.40 58.53 63.90 63.15 78.80 63.04
Product 10 53.61 55.90 54.54 56.47 59.78 58.63 90.28 61.96
Product 11 52.02 26.49 54.92 53.65 60.80 63.89 78.40 52.23
Product 12 45.83 28.50 53.59 49.43 56.09 53.63 85.34 48.33
Product 13 41.30 28.98 40.51 38.88 50.84 47.57 63.76 50.55
Product 14 41.14 17.41 41.51 38.05 45.95 48.69 71.55 44.10
Product 15 86.40 84.00 86.58 87.29 88.80 90.78 99.91 88.04
Product 16 85.76 83.83 85.66 85.59 85.30 88.43 91.76 78.59

WE NEED A WAY OF
UNDERSTANDING BLACK-BOX MODELS

LET’S EXPLORE ONE BLACK-BOX
MODELK-MEANS CLUSTERING

WE UNDERSTAND THROUGH
VISUAL SUMMARIES

12
SEGMENTING INDIA’S DISTRICTS BASED ON BEHAVIOUR
Previously, the client was treating contiguous regions as a
homogenous entity, from a channel content perspective.
To deliver targeted content, we divided India into 6
clusters based on their demographic behaviour.
Specifically, three composite indices were created based
on the economic development lifecycle:
• Education (literacy, higher education) that leads to...
• Skilled jobs (in mfg or services) that leads to...
• Purchasing power (higher income, asset ownership)
Districts were divided (at the average cut-off) by:
Offering targeted content to these clusters will reach a
more homogenous demographic population.
Skilled
Poorer Richer
Unskilled Skilled
Uneducated Educated Uneducated Educated
Unskilled
Purchasing power
Skilled jobs
Education
Poor Breakout Aspirant Owner Business Rich
PoorRural, uneducated agri
workers. Young population
with low income and asset
ownership. Mostly in Bihar,
Jharkhand, UP, MP.
BreakoutRural, educated agri workers
poised for skilled labour.
Higher asset ownership. Parts
of UP, Bihar, MP.
AspirantRegions with skilled labour
pools but low purchasing
power. Cusp of economic
development. Mostly WB,
Odisha, parts of UP
OwnerRegions with unskilled labour
but high economic prosperity
(landlords, etc.) Mostly AP,
TN, parts of Karnataka,
Gujarat
BusinessLower education but working
in skilled jobs, and
prosperous. Typical of
business communities. Parts
of Gujarat, TN, Urban UP,
Punjab, etc
RichUrban educated
population
working in skilled
jobs. All metros,
large cities, parts
of Kerala, TN
The 6 clusters are

13
How to classify clients by behaviour
Using customers’ ad spend patterns, categories of
purchase, periodicity, price points and impact,
Gramener accurately classified clients to
1. Offer personalised deals
2. Create new products
Big buyers across categories at
low price points
P&GCadbury
Reckitt
HUL1
Big buyers across categories
with better price & viewership
Godrej L’OrealITC GSK J&J
Amazon Coke
2
Mid-buyers across categories
with avg price & viewership
4
Heinz AppleFuture GroupLIC Ford Amul
Large clientsMedium clientsSmall clientsTiny clients
Size legend
Each box contains a
cluster of advertisers
with similar behaviour
FMCG
Auto
Telecom
E-commerce
Electronics
Retail
BFSI
Infrequent Hindi Movie ads in
regular slots at high price
5
Getit TVS QuickrLenovo HPAircelAxis MRFMicrosoft ICICI Ceat
Motorola
Infrequent Hindi GEC advts
with high TVR/ very low price
6
Saavn Voltas PNB
Birla SunlifeJivraj Tea Pitambari
Summercool Home Appliances
Frequent regional channel ads
with low viewership
7PepperfryShoppers Stop
Bank of Maharashtra
Raja Biscuits
Cookme Spices
Pran Foods
Dipros
Metro Dairy
Koel Fashions
Meghbela
Big buyers across categories
with low regional advertising
3
NestleMaruti AirtelOLX Samsung
Dabur
Occasional Hindi GEC advts at
moderate price points
United Biscuits8
Expedia
BigBasketSulekha
Union Bank
Yes Bank Piaggio
BMW
Hitachi
Occasional regional and Hindi
GEC ads at high price
9
PayTMFranklin Templeton
Duroflex
Mother’s Recipe
Anchor Electricals
AdvertiserClustering
Transform variables to
minimize correlation
Cluster customers to
minimise overlap
Profile clusters to interpret
their characteristics

WE UNDERSTAND BY
ABSTRACTIONS

15

16
LET’S EXAMINE CURRENCY FORECASTS

17
68% correlation
between AUD & EUR
Plot of 6 month daily
AUD - EUR values
Block of correlated
currencies
… clustered
hierarchically

WHAT YOU SHOULD TAKE AWAY
BLACK-BOX MODELS ARE
INCREASINGLY ACCURATE
BLACK-BOX MODELS NEED
INTERPRETATION (EVEN
MORE)
BUILD VISUAL SUMMARIES TO
EXPLAIN MODELS
MOVE UP & DOWN THE
LADDER OF ABSTRACTION
TOOLS ARE LESS IMPORTANT THAN TECHNIQUE
19
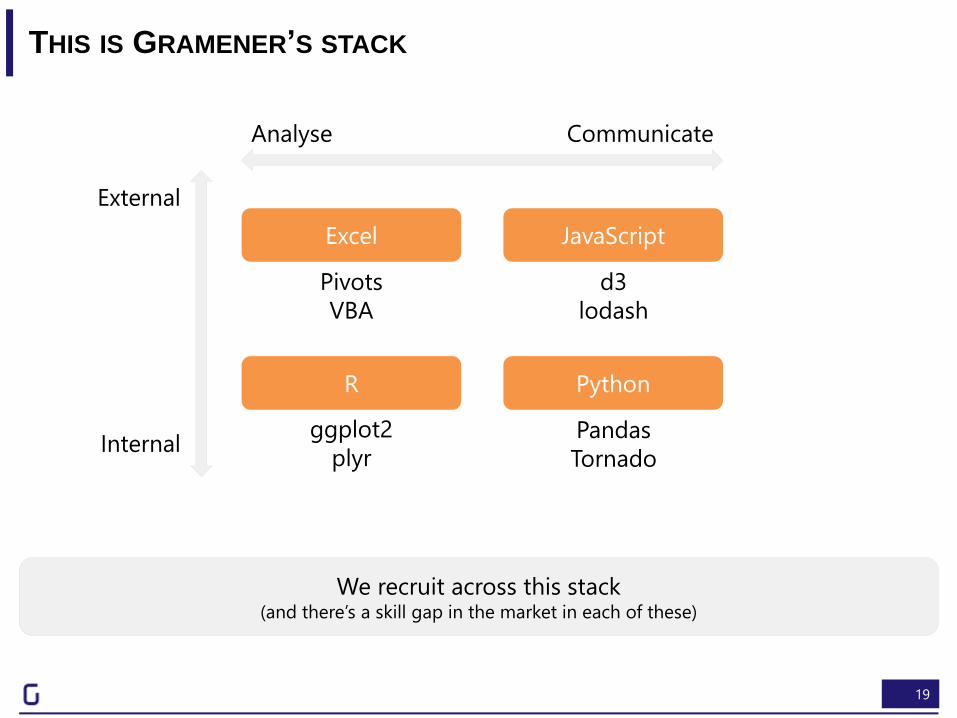
THIS IS GRAMENER’S STACK
PythonR
JavaScriptExcel
Pandas
Tornado
d3
lodash
Pivots
VBA
ggplot2
plyr
Analyse Communicate
External
Internal
We recruit across this stack(and there’s a skill gap in the market in each of these)