Embed Size (px)
Citation preview

VisualizationAnalytics:
Shiny Framework
Olga Scrivner
Course Info
ReactiveFramework
Shiny App
Practice
Visualization Analytics:Shiny Framework
Olga Scrivner

VisualizationAnalytics:
Shiny Framework
Olga Scrivner
Course Info
ReactiveFramework
Shiny App
Practice
What You Will Learn
DAY 1 Introduction to Visual Analytics
DAY 2 Visualization Methods, Design, and Tools
DAY 3 Working with Unstructured Data
DAY 4 Working with Structured Data
DAY 5 Advanced Interactive Visualization withShiny

VisualizationAnalytics:
Shiny Framework
Olga Scrivner
Course Info
ReactiveFramework
Shiny App
Practice
Our Materials - Web Site - Day 5
http:
//obscrivn.wixsite.com/visualization

VisualizationAnalytics:
Shiny Framework
Olga Scrivner
Course Info
ReactiveFramework
Shiny App
Practice
What We Need
I R library shiny
I Download zip file from Syllabus Day 5

VisualizationAnalytics:
Shiny Framework
Olga Scrivner
Course Info
ReactiveFramework
Shiny App
Practice
What We Need
I R library shiny
I Download zip file from Syllabus Day 5

VisualizationAnalytics:
Shiny Framework
Olga Scrivner
Course Info
ReactiveFramework
Shiny App
Practice
Quick Overview: Visual Analytics and Linguistics
“ Language is a system of relatively arbitrary symbols”(Baker-Shenk and Cokely, 1980)
http://www.tableaufit.com/tableau-conference-linguistics-data-visualization/

VisualizationAnalytics:
Shiny Framework
Olga Scrivner
Course Info
ReactiveFramework
Shiny App
Practice
Visual Analytics (and Corpus Linguistics)
1. Exploration (Queries)
2. Comprehension (Analysis)
3. Communication (Presentation)
VisualizationAnalytics:
Shiny Framework
Olga Scrivner
Course Info
ReactiveFramework
Shiny App
Practice
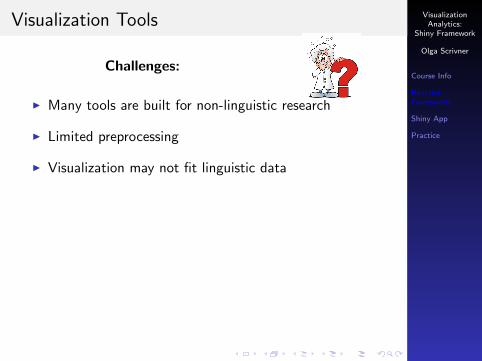
Visualization Tools
Challenges:
I Many tools are built for non-linguistic research
I Limited preprocessing
I Visualization may not fit linguistic data
Solution: Reactive Framework
I Interactive and web-based
I Research-driven customization
I Build your own tool!

VisualizationAnalytics:
Shiny Framework
Olga Scrivner
Course Info
ReactiveFramework
Shiny App
Practice
Reactive Web Framework
“Reactive Systems are highly responsive, giving userseffective interactive feedback”
http://www.reactivemanifesto.org/
http://littleactuary.github.io/blog/Web-application-framework-with-Shiny/

VisualizationAnalytics:
Shiny Framework
Olga Scrivner
Course Info
ReactiveFramework
Shiny App
Practice
Reactive Architecture

VisualizationAnalytics:
Shiny Framework
Olga Scrivner
Course Info
ReactiveFramework
Shiny App
Practice
Reactive Framework and Data Science
“The impact of data scientists’ work depends on how wellothers can understand their insights to take further actions”
Benefit 1: Interactive display and manipulation of data
Benefit 2: No installation required
Benefit 3: Easy to develop and share with clients andproject teams
Benefit 4: Open source library
http://datascience.ibm.com/blog/shiny-a-data-scientist-best-friend/
VisualizationAnalytics:
Shiny Framework
Olga Scrivner
Course Info
ReactiveFramework
Shiny App
Practice
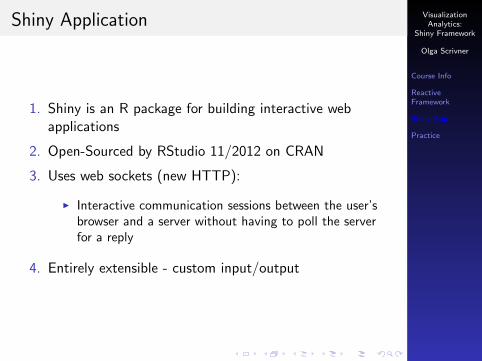
Shiny Application
1. Shiny is an R package for building interactive webapplications
2. Open-Sourced by RStudio 11/2012 on CRAN
3. Uses web sockets (new HTTP):
I Interactive communication sessions between the user’sbrowser and a server without having to poll the serverfor a reply
4. Entirely extensible - custom input/output

VisualizationAnalytics:
Shiny Framework
Olga Scrivner
Course Info
ReactiveFramework
Shiny App
Practice
Shiny Library
http://littleactuary.github.io/blog/Web-application-framework-with-Shiny/
VisualizationAnalytics:
Shiny Framework
Olga Scrivner
Course Info
ReactiveFramework
Shiny App
Practice
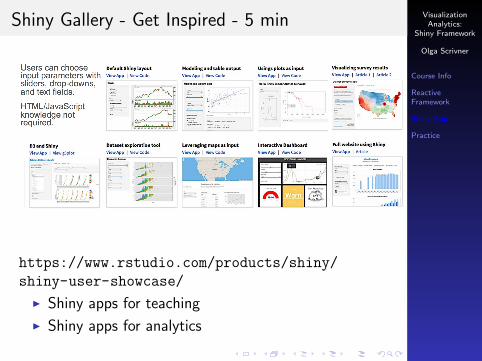
Shiny Gallery - Get Inspired - 5 min
https://www.rstudio.com/products/shiny/
shiny-user-showcase/
I Shiny apps for teaching
I Shiny apps for analytics

VisualizationAnalytics:
Shiny Framework
Olga Scrivner
Course Info
ReactiveFramework
Shiny App
Practice
Show me Shiny - Get Inspired - 5 min
https:
//www.rstudio.com/products/shiny/
shiny-user-showcase/
I Select one or two applications, examine the app and thecode

VisualizationAnalytics:
Shiny Framework
Olga Scrivner
Course Info
ReactiveFramework
Shiny App
Practice
Workshop Materials
1. Rstudio
2. Install and activate shiny library
3. Materials:
Zip file - shinyworkshopfileshttps:
//github.com/Jivitesh-Poojary/CNS-Shiny-Apps

VisualizationAnalytics:
Shiny Framework
Olga Scrivner
Course Info
ReactiveFramework
Shiny App
Practice
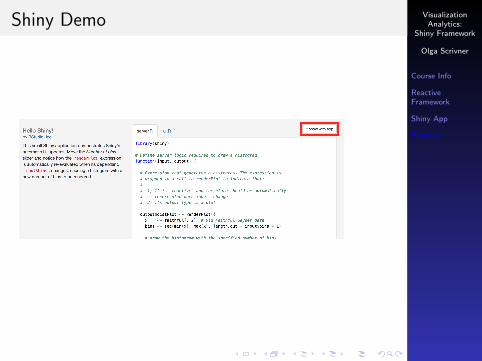
Shiny Demo
I In the console - left bottom window - typerunExample(“01 hello”)
I Click enter/return
runExample(“01 hello”)
VisualizationAnalytics:
Shiny Framework
Olga Scrivner
Course Info
ReactiveFramework
Shiny App
Practice
Shiny Demo

VisualizationAnalytics:
Shiny Framework
Olga Scrivner
Course Info
ReactiveFramework
Shiny App
Practice
Shiny Demo
VisualizationAnalytics:
Shiny Framework
Olga Scrivner
Course Info
ReactiveFramework
Shiny App
Practice
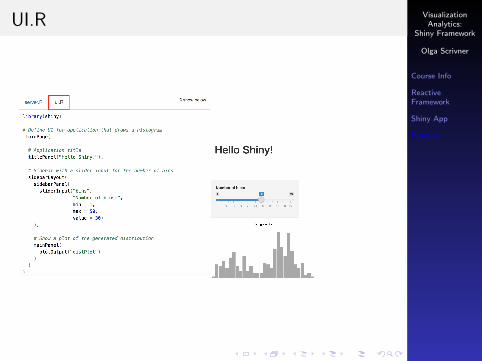
UI.R

VisualizationAnalytics:
Shiny Framework
Olga Scrivner
Course Info
ReactiveFramework
Shiny App
Practice
Reactive Input/Output
I Input - things user can toggle
I Output - R objects that user can see, often depend oninputs

VisualizationAnalytics:
Shiny Framework
Olga Scrivner
Course Info
ReactiveFramework
Shiny App
Practice
Closing App

VisualizationAnalytics:
Shiny Framework
Olga Scrivner
Course Info
ReactiveFramework
Shiny App
Practice
Step 1 - Create New Web Shiny App
Place new shiny directory inside your zip file directory, nameit myshiny

VisualizationAnalytics:
Shiny Framework
Olga Scrivner
Course Info
ReactiveFramework
Shiny App
Practice
Step 2 - Run App

VisualizationAnalytics:
Shiny Framework
Olga Scrivner
Course Info
ReactiveFramework
Shiny App
Practice
UI
shinyUI( fluidPage(
titlePanel(“Old Faithful Geyser Data”),
sidebarLayout(
sidebarPanel(
sliderInput(“bins”,
“Number of bins:”,
min = 1,
max = 50,
value = 30)

VisualizationAnalytics:
Shiny Framework
Olga Scrivner
Course Info
ReactiveFramework
Shiny App
Practice
UI
shinyUI( fluidPage(
titlePanel(“Old Faithful Geyser Data”),
sidebarLayout(
sidebarPanel(
sliderInput(“bins”,
“Number of bins:”,
min = 1,
max = 50,
value = 30)

VisualizationAnalytics:
Shiny Framework
Olga Scrivner
Course Info
ReactiveFramework
Shiny App
Practice
Modifying UI - Practice
I Change slider’s label:Number of bins → Choose a number
I Change slider’s values: max and value
I Save
I RunApp

VisualizationAnalytics:
Shiny Framework
Olga Scrivner
Course Info
ReactiveFramework
Shiny App
Practice
HTML
The UI script simply creates HTML

VisualizationAnalytics:
Shiny Framework
Olga Scrivner
Course Info
ReactiveFramework
Shiny App
Practice
HTML - 5 min
HTML tags:
http:
//shiny.rstudio.com/articles/tag-glossary.html
I h1() = header1
I br() = line break
I p() = paragraph
I hr() = line

VisualizationAnalytics:
Shiny Framework
Olga Scrivner
Course Info
ReactiveFramework
Shiny App
Practice
Adding HTML Tags to UI.R - Practice
shinyUI( fluidPage(
titlePanel(“My Title”),
h3(“My subtitle”),
p(“This is my first app!”),
br(),
hr(),

VisualizationAnalytics:
Shiny Framework
Olga Scrivner
Course Info
ReactiveFramework
Shiny App
Practice
Layout - 5 min
http:
//shiny.rstudio.com/articles/layout-guide.html

VisualizationAnalytics:
Shiny Framework
Olga Scrivner
Course Info
ReactiveFramework
Shiny App
Practice
mainPanel
mainPanel( plotOutput(”distPlot”))
Let’s add 3 tab panels: Plot, Summary, Table

VisualizationAnalytics:
Shiny Framework
Olga Scrivner
Course Info
ReactiveFramework
Shiny App
Practice
tabsetPanel
mainPanel(
tabsetPanel(
tabPanel(“Plot”, plotOutput(“distPlot”)),
tabPanel(“Summary”),
tabPanel(“Table”)
)
)

VisualizationAnalytics:
Shiny Framework
Olga Scrivner
Course Info
ReactiveFramework
Shiny App
Practice
Input Data

VisualizationAnalytics:
Shiny Framework
Olga Scrivner
Course Info
ReactiveFramework
Shiny App
Practice
Input Data
1. Zip Folder - shinyworkshopfiles - movie metadata.csv
2. Place it into the directory myshiny

VisualizationAnalytics:
Shiny Framework
Olga Scrivner
Course Info
ReactiveFramework
Shiny App
Practice
New Input in UI.R
I Let’s look at the fileInput() function from ShinyReference page
I Type in your browser: fileInput Shiny
I or go to the Shiny Reference page -https://shiny.rstudio.com/reference/shiny/
latest/fileInput.html

VisualizationAnalytics:
Shiny Framework
Olga Scrivner
Course Info
ReactiveFramework
Shiny App
Practice
New Input in UI.R
I Scroll down to Examples
I We will add fileInput function inside sidebarPanel
I Copy fileInput function

VisualizationAnalytics:
Shiny Framework
Olga Scrivner
Course Info
ReactiveFramework
Shiny App
Practice
New Input in UI.R
I Paste it after slider
NB: commas are important!

VisualizationAnalytics:
Shiny Framework
Olga Scrivner
Course Info
ReactiveFramework
Shiny App
Practice
Reactive Function in Sever.R
Reactive - it changes every time the user uploads new data
I Create a function that reads csv file
I myfile() is a function that will read and return csv files

VisualizationAnalytics:
Shiny Framework
Olga Scrivner
Course Info
ReactiveFramework
Shiny App
Practice
Render - Reactive Data

VisualizationAnalytics:
Shiny Framework
Olga Scrivner
Course Info
ReactiveFramework
Shiny App
Practice
Function summary in Server.R
output$summary <- renderPrint({
summary(myfile())
})

VisualizationAnalytics:
Shiny Framework
Olga Scrivner
Course Info
ReactiveFramework
Shiny App
Practice
New Output Function table in Server.R
output$table <- renderDataTable({
myfile()
})

VisualizationAnalytics:
Shiny Framework
Olga Scrivner
Course Info
ReactiveFramework
Shiny App
Practice
Linking summary and table with UI.R
tabsetPanel(
tabPanel("Plot", plotOutput("distPlot")),
tabPanel("Summary", verbatimTextOutput("summary")),
tabPanel("Table", dataTableOutput("table"))
)
RunApp

VisualizationAnalytics:
Shiny Framework
Olga Scrivner
Course Info
ReactiveFramework
Shiny App
Practice
Linking summary and table with UI.R
tabsetPanel(
tabPanel("Plot", plotOutput("distPlot")),
tabPanel("Summary", verbatimTextOutput("summary")),
tabPanel("Table", dataTableOutput("table"))
)
RunApp

VisualizationAnalytics:
Shiny Framework
Olga Scrivner
Course Info
ReactiveFramework
Shiny App
Practice
Testing CSV Upload

VisualizationAnalytics:
Shiny Framework
Olga Scrivner
Course Info
ReactiveFramework
Shiny App
Practice
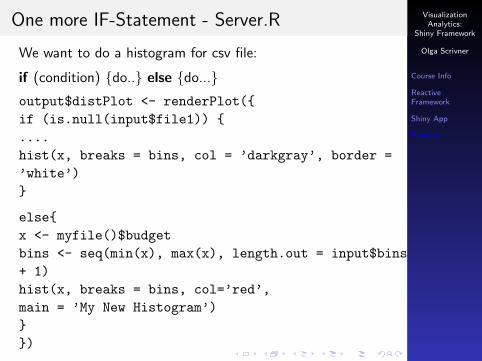
One more IF-Statement - Server.R
We want to do a histogram for csv file:
if (condition) {do..} else {do...}
output$distPlot <- renderPlot({
if (is.null(input$file1)) {
....
hist(x, breaks = bins, col = ’darkgray’, border =
’white’)
}
else{
x <- myfile()$budget
bins <- seq(min(x), max(x), length.out = input$bins
+ 1)
hist(x, breaks = bins, col=’red’,
main = ’My New Histogram’)
}
})

VisualizationAnalytics:
Shiny Framework
Olga Scrivner
Course Info
ReactiveFramework
Shiny App
Practice
One more IF-Statement - Server.R
We want to do a histogram for csv file:
if (condition) {do..} else {do...}output$distPlot <- renderPlot({
if (is.null(input$file1)) {
....
hist(x, breaks = bins, col = ’darkgray’, border =
’white’)
}
else{
x <- myfile()$budget
bins <- seq(min(x), max(x), length.out = input$bins
+ 1)
hist(x, breaks = bins, col=’red’,
main = ’My New Histogram’)
}
})

VisualizationAnalytics:
Shiny Framework
Olga Scrivner
Course Info
ReactiveFramework
Shiny App
Practice
RunApp

VisualizationAnalytics:
Shiny Framework
Olga Scrivner
Course Info
ReactiveFramework
Shiny App
Practice
Server - Recap
VisualizationAnalytics:
Shiny Framework
Olga Scrivner
Course Info
ReactiveFramework
Shiny App
Practice
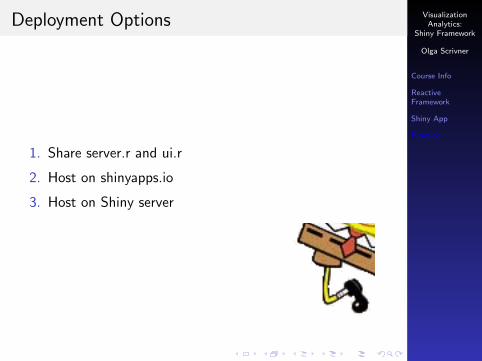
Deployment Options
1. Share server.r and ui.r
2. Host on shinyapps.io
3. Host on Shiny server

VisualizationAnalytics:
Shiny Framework
Olga Scrivner
Course Info
ReactiveFramework
Shiny App
Practice
Deploy with shinyapps.io
I www.shinyapps.io
I sign up for an account.
I Publish Application button in RStudio and followinstructions

VisualizationAnalytics:
Shiny Framework
Olga Scrivner
Course Info
ReactiveFramework
Shiny App
Practice
Deploy with shinyapps.io

VisualizationAnalytics:
Shiny Framework
Olga Scrivner
Course Info
ReactiveFramework
Shiny App
Practice
My shinyapps.io

VisualizationAnalytics:
Shiny Framework
Olga Scrivner
Course Info
ReactiveFramework
Shiny App
Practice
My shinyapps.io

VisualizationAnalytics:
Shiny Framework
Olga Scrivner
Course Info
ReactiveFramework
Shiny App
Practice
Future of Visualization Tools: CNS
Cyberinfrastructure for Network Science Center at IndianaUniversity - http://cns.iu.edu/
Our current project on Shiny Framework (team OlgaScrivner and Jivitesh Poojary)
I Build Shiny templates for Data Visualization: stage I
https:
//github.com/Jivitesh-Poojary/CNS-Shiny-Apps
I Create user-friendly customizable Shiny dashboards:stage II
I Develop preprocessing plugins for Shiny templates:stage III

VisualizationAnalytics:
Shiny Framework
Olga Scrivner
Course Info
ReactiveFramework
Shiny App
Practice
Create Your Own Shiny
Select one of the application from Zip files:
I Word cloud with the library wordcloud2
I Network graph with the library igraph
I Streamgraph with the library streamgraphStreamgraph is not available through installYou will need to install first the library devtools
Run:
library(devtools)
devtools::install github("hrbrmstr/streamgraph")
library(streamgraph)

VisualizationAnalytics:
Shiny Framework
Olga Scrivner
Course Info
ReactiveFramework
Shiny App
Practice
Useful resources
1. Shiny official tutorial -http://shiny.rstudio.com/tutorial
2. Cheat sheet - http://shiny.rstudio.com/images/shiny-cheatsheet.pdf
3. Publish your app free - http://www.shinyapps.io
4. Examples -http://www.showmeshiny.com/
5. Tutorial by Dean Attali - http://deanattali.com/blog/building-shiny-apps-tutorial/

VisualizationAnalytics:
Shiny Framework
Olga Scrivner
Course Info
ReactiveFramework
Shiny App
Practice
Thank you!
My email: [email protected]

VisualizationAnalytics:
Shiny Framework
Olga Scrivner
Course Info
ReactiveFramework
Shiny App
Practice
References
Borner, Katy. 2015. Atlas of Knowledge: Anyone Can Map. TheMIT PressCollins, Christopher. 2012. Bridging the Linguistic VisualizationDivide. LingVis/UNCLH WorkshopGrolemund, Garrett. 2017. How to start with Shiny, Part 1.Workshop
VisualizationAnalytics:
Shiny Framework
Olga Scrivner
Course Info
ReactiveFramework
Shiny App
Practice
Credits
http:
//deanattali.com/blog/building-shiny-apps-tutorial/
http://scimaps.org/mapdetail/stream_of_scientific_128
https://github.com/IBMDataScience/dsx-shiny-apps
http://www.slideshare.net/SarahAerni/
data-science-as-a-commodity-use-madlib-r-other-oss-tools-for-data-science-from-pivotal-open-source-hub-meetup
http://www.unixstickers.com/image/data/stickers/
react/badge/React-JS.sh.png
https://github.com/rstudio/shiny/issues/250
http://www.slideshare.net/ilio-catallo/
spring-mvc-the-basics