Embed Size (px)
Citation preview
To Investigate Role of Impulsivity, Reward and Loss of
Sensitivity in Decisions Making during a Gambling Task:
An Empirical Study
GYAN PRAKASH (3570810095)
In partial fulfillment for the award of the degree
BACHELOR OF ENGINEERING
COMPUTER SCIENCE AND SOFTWARE ENGINEERING
Department of Humanities and Social Sciences,
Indian Institute of Technology Bombay
To Investigate Role of Impulsivity, Reward and Loss of
Sensitivity in Decisions Making during a Gambling Task:
An Empirical Study
A PROJECT REPORT
Submitted by
GYAN PRAKASH (3570810095)
In partial fulfillment for the award of the degree
BACHELOR OF ENGINEERING
In
COMPUTER SCIENCE AND SOFTWARE ENGINEERING
At
At
Prepared at
2012
JJJiiiiii
July 2012
Psychophysiology Lab,
Department of Humanities and Social Sciences,
Indian Institute of Technology Bombay
To Investigate Role of Impulsivity, Reward and Loss of
Sensitivity in Decisions Making during a Gambling Task:
COMPUTER SCIENCE AND SOFTWARE ENGINEERING
ww
w.n
eevi
aPDF.
com
BONAFIDE CERTIFICATE
Certified that this project report titled
Sensitivity in Decisions Making during a Gambling Task: An Empirical Study
bonafide work of Gyan Prakash
Engineering to the Vinayaka Missions University, Aarupadai Veedu Institute of Technology,
OMR Paiyanoor-603104, Kancheepuram, Distt(Tamilnadu) who carried out the project work
under my supervision.
Place: Mumbai
Date: 04/07/2012
BONAFIDE CERTIFICATE
Certified that this project report titled To Investigate Role of Impulsivity, Reward and Loss of
Decisions Making during a Gambling Task: An Empirical Study
bonafide work of Gyan Prakash ( Reg No. 3570810095) B.E, Computer Science & Software
to the Vinayaka Missions University, Aarupadai Veedu Institute of Technology,
603104, Kancheepuram, Distt(Tamilnadu) who carried out the project work
Dr. Azizuddin Khan
Project Supervisor
Assistant Professor
Psychophysiology Lab,
Department of Humanities and Social Sciences,
Indian Institute of Technology, Bombay,
Powai-400076, Mumbai
II
To Investigate Role of Impulsivity, Reward and Loss of
Decisions Making during a Gambling Task: An Empirical Study is the
B.E, Computer Science & Software
to the Vinayaka Missions University, Aarupadai Veedu Institute of Technology,
603104, Kancheepuram, Distt(Tamilnadu) who carried out the project work
Dr. Azizuddin Khan
Project Supervisor
Assistant Professor
Psychophysiology Lab,
Department of Humanities and Social Sciences,
Indian Institute of Technology, Bombay,
400076, Mumbai
ww
w.n
eevi
aPDF.
com

ACKNOWLEDGEMENT
Dedicating this project to the Almighty God whose abundant grace and mercies enabled
its successful completion, we would like to express our profound gratitude to The Dean
(Research & Development), Dr. Prof. Rangan Banerjee of Industrial Research and
Consultancy Center of Indian Institute of Technology Bombay who gave me an opportunity to
make this project a success.
It has been an honor for me to work under the extremely able guidance of Dr. Azizuddin
Khan, Assistant Professor. It goes beyond saying that his gregarious knowledge, guidance,
living interest, constructive criticism and kind consideration were instrumental during the entire
course of my project work and its successful completion.
Words fail to express my gratitude to our Project Mentor Miss Mohita Junnarkar, for
helping and supporting me with valuable suggestions and timely advices throughout the tenure of
our project work. In pursuit of this academic endeavor I feel that I have been especially fortunate
as she has been my inspiration and a proper guidance.
I am also very thankful to Miss Madhura Sohani Research assisstant for her unswerving
assistance and suggestions which helped me during my project and gives it a better finish.
I would like to take the opportunity to thank Mrs. Purnima Bajre for her constant
encouragement and support throughout, which always inspired me.
We would like to express my gratitude to our Principal Dr. N.R. ALAMELU for
providing me with all the required facilities without which the project would not have
been possible.
We wish to express our sincere thanks to our Head of Department, Prof. P.T.
SIVASANKAR for providing an opportunity to undertake this project & granting his
kind consents for carrying out our suggested project.
We extend our deep sense of gratitude to our Faculty Advisor Prof. R.
VISALATCHI Senior Lecturers of Computer Science and Engineering Department for
their valuable guidance as well as timely advice, which helped us a lot in completing the
project successfully.
III ww
w.n
eevi
aPDF.
com
ABSTRACT
Objective: The aim of the current study is to understand impulsivity, reward and loss sensitivity
in decision making using Iowa Gambling Task and investigate how impulsivity affects decision-
making using BIS/BAS scale. We investigate how the personality trait determines decision
making using NEO-FFI scale. Method: We assessed 130 participants for conducting two types
of experiment (1) Choice behavior Test is conducted with the help of Iowa Gambling Task (IGT)
on the computer screen.(2) Personality Test is conducted with the help of Behavior Inhibition
system and Behavior Approach System (BIS/BAS), NEO-FFI( NEO-Five Factor Inventory)
scale and Rational Experiential Inventory (REI) .Results The result indicated that participants
who were low on impulsivity fared worst on IGT task compared to the participants who were
high on impulsivity. Similar results were demonstrated for personality traits and information
processing styles. The results imply that personality traits determine decision making process.
Similarly information processing styles evaluate preferences for information processing that
determine the decisions making and Impulsivity affects decision making.
Keywords- Decisions Making, Impulsivity, Iowa Gambling Task, Personality and Information
Processing Style.
.
IVww
w.n
eevi
aPDF.
com
CHAPTER NO TABLE OF CONTENTS PAGE NO
TITLE I
BONAFIDE II
ACKNOWLEDGEMENT III
ABSTRACT IV
LIST OF FIGURES VI
LIST OF ABBREVIATIONS
1 INTRODUCTION 1
2 LITERATURE REVIEW 5
3 METHODLOGY 10
4 RESULT AND DISCUSSIONS 18
5 COCLUSIONS 26
6 REFFERENCES 27
7 APPENDIX
A. DESCRIPTIVE ANALYSIS WITH BLOCK WISE 29
B. DESCRIPTIVE ANALYSIS WITH DECK WISE 31
V ww
w.n
eevi
aPDF.
com
LIST OF FIGURES PAGE NO.
Iowa Gambling Task Screenshot 13
Relation between BIS/BAS, NEO-V & REI Scale with Block Wise 22
Relation between BIS/BAS, NEO-V & REI Scale with Deck Wise 23
LIST OF TABLES PAGE NO.
Correlation Analysis 19
LIST OF ABBREVATIONS
IGT-Iowa Gambling Task
BIS-Behavior Inhibition System
BAS-Behavior Approach System
NEO-V –NEO-Five Factor Inventory Scale
REI-Rational Experiential Inventory Scale
VI ww
w.n
eevi
aPDF.
com
1
CHAPTER 1
INTRODUCTION
1.1 GENERAL:
Decision Making:
In day to day life, an individual has to decide between options that have immediate
consequences and delayed consequences. The decision to opt for immediate or delayed
reward is strongly related to professional success in life. For example; one student might
decide to go for a party on a given day, or stay at home to study for exam that is scheduled
next day. In order to function effectively, one has to postpone immediate, in favor of long
term positive outcomes in the future.
Decision making involves the outcome of cognitive processes leading to a choice between
alternative courses of action. Poor decision making has been described as “deciding against
one's best interests and inability to learn from previous mistakes, with repeated decisions
leading to negative consequences” (Bechara and Damasio, 2005).
Impulsivity and Decisions Making:
Impulsivity is a personality trait of an individual to initiate behavior without adequate
forethought and lack of foresightedness for momentary gains at a particular point of time.
Impulsivity tends to risk-taking, lack of planning, and making up one's mind quickly. There
are 3-factor model according to impulsivity Attentional ("getting easily bored"), motor
("going into action") and cognitive ("inability to plan") factors. Impulsive individuals have
increased reward sensitivity and reduced punishment sensitivity, reflected by their lowered
negativity during loss and enhanced positivity during win.
Impulsive decision-makers are those who operate on the far end of the decision-making
continuum. Impulsivity has been found to be related to a variety of antisocial behaviors,
delinquency, and a lack of social adjustment. High impulsivity shows weakness in learning of
reward and punishment association, in order to make appropriate decisions. This hyperactive ww
w.n
eevi
aPDF.
com
2
BAS and hypoactive BIS may result into disadvantageous and risky decision making,
concentrating more on prospective rewards than punishments. .
The system mediates anxiety, and it is activated by goal conflicts of all kinds paradigmative
between approach and avoidance is re-offered as the Behavioral Inhibition System. BIS is the
conceptual substrate for sensitivity to secondary aversive stimuli, and is the proposed causal
basis of anxiety. It is sensitive to: (a) conditioned stimuli associated with punishment, and the
omission or termination of reward (frustrative non reward), (b) extreme novelty, (c) innate
fear stimuli (e.g. snakes, dead bodies, etc.), and (d) high-intensity stimuli.
The BIS mechanism is through as a comparator, continuously scans the environment. It
checks predicted events against actual events and is able to stop programmed motor activity
by other systems if they do not match. The BIS produce behavioral inhibition (i.e.
interruption of ongoing behavior) and an increase in level of arousal and attention. The
purpose of the BIS is to suppress behavior that is expected to lead to punishment. The system
also modulates the control of exploratory behavior by diversified attention toward threat or
novel stimulus.
Impulsivity has been variously defined as swift action without forethought or conscious
judgement (Hinslie, 1940) or behavior without adequate thought (Smith, 1952). Implicit in all
definitions of impulsivity are the two key features. First, impulsivity involves action. Second,
impulsivity involves lack of planning. The method of determining whether the action was
truly unplanned in two of the definitions above is to look at the outcome of the action, with
poor planning being associated with long-term losses in spite of short-term gains.
Personality and Decision Making:
Personality is commonly defined as “the sum total of all the behavioral and mental
characteristics by means of which an individual is rewarded as being unique”. Personality
type paradigm of the thinking (T) / and feeling (F) preference dichotomy has the most
significant influence on the decision making process. A preference for the thinking (T)
function constitutes an objective impersonal approach to decision making while a preference
for the feeling (F) function constitutes a subjective values driven approach. Sensing and
Thinking focus on past experience, and objective, tangible/ concrete data. The sensing (S)/
and intuition (N) preference dichotomy is the second factor that comes into play in the ww
w.n
eevi
aPDF.
com
3
decision making process. Individuals with a preference for sensing (S) focus on past
experience and tangible / concrete criteria when confronted with decision making and
problem solving while those with a preference for intuition (N) focus on future possibilities
and broad, general issues. Personality types with a preference for intuition (N) and thinking
(T) utilize objective criteria while focusing on future directed broad concepts and
possibilities. Personality types with a preference intuition (N) and feeling (F)
utilize subjective criteria and focus on future directed broad concepts and possibilities.
Individuals with a preference for the perceiving (P) attitude want to continue to take in
information and defer decision making in an effort to acquire additional information. While
those with a preference for judging (J) want to take in data and come to closure as quickly as
possible. Individuals with a preference for judging (J) are more at ease once a decision has
been made.
Information Processing Style and Decision Making:
Decision making is a fundamental process in organizations and the quality of the decisions
that managers make influences their effectiveness as managers. The effectiveness of
managers, in turn, impacts the success or failure of the organization. Rational models of
decision-making often ignore individual decision-maker characteristics and assume
individuals process information and arrive at a decision in a similar manner (Hambrick,
1987). These models ignore the actual decision process and how individual differences affect
that process (Bourgeois and Eisenhardt, 1988; Rajagopalan, Rasheed and Datta, 1993).
Observation of actual decision making situations indicates that decision-making behavior is
characterized by differences in many areas, including the number of criteria used, the type of
information search which is undertaken, sources of information used, the use of heuristics
and the number of alternatives generated (Eisenhardt and Zbaracki, 1992). An individual
characteristic which is often linked to differences in decision making behavior is the way in
which individuals process information, also termed as cognitive style. Cognitive style
depends on the way people process and organize information and arrive at judgments or
conclusions based on their observations (Hunt, Krzystofiak,Meindl and Yousry, 1989). These
styles are viewed as relatively stable dispositions which lead to differences in behavior in the
decision-making process (Shipman and Shipman, 1985).
ww
w.n
eevi
aPDF.
com
4
1.2 OBJECTIVE
The aim of the current study is to understand impulsivity, reward and loss sensitivity in
decision making using Iowa Gambling Task and investigate how impulsivity affects decision-
making using BIS/BAS scale. We investigate how the personality trait determines decision
making using NEO-FFI scale.
1.3 SCOPE
This project aims to investigate the reward and loss sensitivity in decisions making which
will be helpful to persons who are in financial investment for different long and short term
gains. It can also be used for academic areas while introducing different educational
programs keeping in mind the progress of the country. This work will also be useful to
differentiate between the decisions making process of normal individual and individual with
some abnormalities.
ww
w.n
eevi
aPDF.
com
5
CHAPTER 2
LITERATURE VIEW
Decisions Making:
The Iowa gambling task is a psychological task thought to simulate real-life decision making.
The Iowa Gambling Task is widely used in research of cognition and emotion. IGT is an
experimental design which is used for measurement of decisions making. A key feature of
this task is that participant has to forgo short term benefit for long term profit. A correlation
has been found between successful IGT performance and development of somatic marker
signal in healthy control participants. The SMH purpose that somatic marker signal biasing
from the body represented and regulated in emotion circuitry of the brain. Role of SMH is the
process of decisions making which is measured by performance on the IGT. It provides a
descriptive, non critical account of resolution of SMH and support IGT. It examines the
psychological component of the SMH critical approaches the extent to which IGT data can
validate the SMH. It raises and evaluates some further conceptual concerns about novelty and
parsimony of SMH.
Impulsivity and Decision making:
Impulsivity is a personality trait (quality of person) which is characterized by the inclination
of an individual to initiate behavior without adequate forethought and resultant action is the
consequence of momentary decision. In the psychological literature authors have defined
impulsivity as “the tendency to act with less forethought than do most individuals of equal
ability and knowledge” (Dickman, 1993 & Goudriaan et al., 2005), ‘‘choice of a small, short
term gain at the expense of a large, long term loss’’ (Ainslie, 1974) or “a predisposition
towards rapid, unplanned reactions to internal or external stimuli without regard to the
negative consequences of these reactions to the impulsive individual or to others while
BIS/BAS is measurement scale which measures the impulsivity. Impulsivity tends to risk-
taking, lack of planning, and making up one's mind quickly while The BIS and BAS exerts
two effects that are facilitators(careful planning) and other antagonist(to work against). Some
researchers have proposed a 3-factor model according to impulsivity; attentional ("getting easily
bored”)factors. While BIS produces behavioral inhibition (i.e. interruption of ongoing
behavior) and an increase in level of attention. When person shows impulsive behavior they
perform Positive urgency and Negative urgency while BIS and BAS reflected on ww
w.n
eevi
aPDF.
com
6
electrochemical responses elicited by positive and negative feedback signals during a
learning task. In impulsivity as a personality trait, impulsivity is part of normal behavior as it
contributes to adaptive functioning while BIS/BAS has been purposed for understanding how
behavior and regulation mechanisms relate to personality and psychological dysfunction.
Impulsive decision-makers are those who operate on the far end of this decision-making
continuum while BIS/BAS people perform more risk and safe decisions making. Impulsive
decisions maker perform inclination of individual to initiate behavior as without
consequences of their actions in acting moment while BIS/BAS perform impulsivity in
appetitive stimuli and anxiety in aversive stimuli. High impulsivity shows weakness in
learning of reward and punishment association in order to make appropriate decisions the
high BAS and low BIS group made the most risky decisions. High impulsive subject display
overall deflect in their decisions making compare than low impulsive subject while High
BAS/Low BIS display more risk decisions compare than Low BAS/High BIS. Several
theorists have argued that two general motivational systems underlie behavior. A behavioral
approach system (BAS) is believed to regulate appetitive motives, in which the goal is to
move toward something desired. A behavioral avoidance (or inhibition) system (BIS) is said
to regulate aversive motives, in which the goal is to move away from something unpleasant.
This system mediates fear is activated by threatening stimuli and that need not be faced but
can simply avoided and has been referred to as Fight Fligh Freeze System (FFFS).This
second System which is activated by appetitive stimuli, mediates the emotion of anticipatory
pleasure, is referred as Behavioral Approach System This general goal of the study is to
differentiate the functions of BIS and BAS in human term of their underlying Cognitive
electro cortical mechanisms. The BIS and BAS have the potential to influence punishment
mediated and reward mediated behavior. BIS and BAS sensitivity has facilates the validation
of RST derived hypothesis to study of human behavior. Thus general goal is to differentiate
between the function of BIS and BAS in humans in terms of their underlying cognitive and
electro cortical mechanisms. Mainly we sought to evaluate how individual difference in BIS
and BAS reflected on electrochemical responses elicited by positive and negative feedback
signals during a learning task. The function of BIS and BAS has been purposed within
neuropsychological framework for understanding how behavior and regulation mechanisms
relate to personality and psychological dysfunctions. The BIS and BAS exerts two effects that
are facilitators and antagonist. BAS facilates where as BIS antagonize the process of reward ww
w.n
eevi
aPDF.
com
7
Stimuli. High BAS/LOW BIS individual should display the highest appetitive response and
positive emotions of these stimuli. Similarly BIS facilates BAS antagonize the process of
punishment Stimuli. High BIS /Low BAS individual should show the highest aversive
response and negative emotions to these stimuli. General factor of personality is Correlating
with measures of the behavioral Inhibition System (BIS), Behavioral Activation System
(BAS), generalized expectancies of reward and punishment.
Personality and Decisions Making:
Personality, defined as .the relatively stable behavioral patterns and attitudes of a given
individual (Costa and McCrae, 1985), is likely to play an important role in decision making.
While personality was briefly alluded to in Lazarus and Folkman’s (1984) transactional stress
model as a determinant of primary appraisal, more attention needs to be given to the types of
personality dispositions that make some people more vulnerable to certain stressors and
others less so. Personality is a wide-reaching concept and it is possible that only some
dimensions are likely to be relevant.
The Five Factor Model of personality (Costa and McCrae, 1987) describes personality as
containing five factors, defined as dimensions of individual differences that consistently show
themselves in actions, thoughts and emotions. The five factors are extroversion, neuroticism,
Openness to experience, conscientiousness and agreeableness. Extroversion is the tendency
towards positive feelings, excitement and friendliness. Neuroticism is another personality
factor and it is the tendency to experience negative emotions such as anxiety, emotional
stability and Impulse control.Research generally agrees that neuroticism has a negative
correlation with IQ scores (Furnham et al, 2007; Ackerman and Heggestad, 1997). Openness
to experience is the disposition to pay attention to beauty, abstract ideas, and liberalism.
Baker and Bichsel (2006) found that openness to experience correlates with intellectual
abilities at different stages of life. Other research has confirmed the positive relationship
between intellectual abilities and openness to experience (Furnham et al, 2007; Ackerman
and Heggestad, 1997). Conscientiousness involves self-discipline, achievement-striving, and
cautiousness. An extensive metanalysis showed that conscientiousness has no correlation
with measures of general intelligence, but that it does correlate negatively with measures of
math and general knowledge (Ackerman and Heggestad, 1997). Other researchers have found ww
w.n
eevi
aPDF.
com
8
that non conscientious tend to do better in IQ tests (Furnham et al). Lastly, agreeableness
refers to qualities such as altruism, trust and compliance.
The meta analysis mentioned earlier found absolutely no correlation between agreeableness
and any measure of intellectual ability (Ackerman and Heggestad, 1997). In summary, it is
generally agreed that extroversion has an existing relationship with intellectual abilities, but
its direction seems to depend on the kind of test being used. Openness to experience is
generally positively correlated with intellectual abilities, while neuroticism is negatively
correlated with IQ. The relationship with conscientiousness is generally negative or non-
existing, and the relationship with agreeableness is non-existing. The review of articles shows
that there is an existing relationship between personality and intellectual abilities. Yet, no one
can tell which personality traits allow a person to behave more intelligently (or engage in
useful behavior) as opposed to score higher on IQ tests.
This study will examine the mediating or moderating effect of personality (particularly
conscientiousness, neuroticism and openness to experience) in the relationship between
intellectual abilities and intelligent behavior. Indeed, these scales have been used to show that
the Five-Factors are relatively enduring, evident in a wide range of behaviors, present across
age, gender, race, culture and language, and are possibly biologically and hereditarily based
(Costa and McCrae, 1992a). Further, support for the Big-Five has come from researchers of a
variety of theoretical orientations, and links have been established with major personality
instruments (Buss, 1996).
GFP occupies the apex of the hierarchy in a similar way as general factor of mental ability
occupies the apex in the organization of cognitive abilities. A GFP has now been extracted
from inter-scale correlations of several sets of the Big Five Inventory (BFI). It found high
score on GFP were related to self-esteem and positive effect and low score to negative effect.
BIS is the aversive motivational system that controls the experience of anxiety and negative
feelings such as Fear, Frustrations, and Sadness, and is sensitive to signals of punishment,
and novelty. BAS is the behavioral activation system causing movement towards goals and
result in feelings such as Hope, Elation and Happiness. GFP will correlate positively with
measures of BAS, self-esteem, positive affect and generalized expectancy of reward, and
correlate negatively with measures of BIS, negative effect, and generalized expectancy of ww
w.n
eevi
aPDF.
com
9
punishment. The GFP was measured using the Big Five Inventory (BFI) is such as BIS/BAS
scale, Generalized Reward and Punishment Expectancy Scales, Single-Item Self-Esteem
Scale; Positive and Negative Affect Schedule (PANAS).
Information processing Style and Decisions Making:
A great deal of the Artificial Intelligence literature on autonomous artificial agents concerns
the representation and properties of several motivational states (e.g., goals, intentions and
commitments) and relate them to the agent’s overt behavior (Cohen and Levesque, 1990),
(Rao and Georgeff, 1991), (Singh, 1991), (Konolige and Pollack, 1993). However, the
mentioned literature doesn’t address the relationship between motivation and information
processing. This constitutes a serious drawback since agents built or defined within this
approach have no easy way of saying "That’s enough of processing!” If they have a large
body of cognitive structures relevant to some decision problem, they are committed to use
them all - they can’t escape.
The relationship between motivation and information processing has been one of the major
concerns in the literature on cognitive social psychology (Srull and Wyer, 1986),
(Pyszczynski and Greenberg, 1987), (Forgas, 1994), (Baumeister and Newman, 1994). It is
even becoming a central issue in neurology (Damásio, 1994). Nevertheless, this relationship
has not been explained with the computational level of detail required for Artificial
Intelligence purposes.
Hence, there is still a lot to be done along the integration of motivational factors within
cognitive models of information processing.. The extended model is called COMINT
(Cognition and Motivation Integration model of decision making). Traditionally, motivation
is viewed as a conscious and volitional process. COMINT represents an hypothesis regarding
possible automatic aspects of motivate
ww
w.n
eevi
aPDF.
com
10
CHAPTER 3
METHODLOGY
Participants:
Sample:
One hundred Thirty (130) participants visited the Psychophysiology Laboratory at IIT
Bombay individually to take part in the experiment. There were 101 males and 29 females
participants in this study. The mean age of male participants (Mean age=25.14 years,
SD=4.52 years) and female participants (Mean age=27.00 years, SD=6.87 years). The
participants educational level was three percent (5%) undergraduate (student had a high
school diploma or some college), thirty percent (33%) graduate (had a bachelor’s degree and
sixty seven percent (62%) post-graduate (had Master degree or pursing PhD).
Design:
5 (Block: Block1 (Trials 1-20) v/s Block2 (Trials 21-40) v/s Block3 (Trials 41-60) v/s Block4
(Trials 61-80) v/s Block5 (Trials 81-100)) X 2 (Impulsivity: High v/s Low) X 5 (Personality:
Neuroticism v/s Extroversion v/s Openness v/s Agreeableness v/s Conscientiousness) X 2
(Rational v/s Experiential)
Materials:
Iowa Gambling Task:
The Iowa Gambling Task (IGT) was originally developed as a card game by Bechara et al.
(1994). Here, we used a computerized version 1.00(1.00.029). There are four decks of cards
namely; A, B, C, and D. There were 100 trials in this task that lasted for 12 minutes. Here
two types of indicator bar such as green bar which indicates subject winning and losing
condition and red bar indicates borrow amount means how much money borrow subject for
performing task Subjects have to develop a long-term and profitable monetary scenario in a
situation of uncertainty and a conflict between the chance of encountering an immediate
reward. No information was given prior to the task on the task features, task duration or the
number of trials except for the task objective is win much more money as much possible and
avoid losing money.
ww
w.n
eevi
aPDF.
com
11
Performance on the IGT was operationalized in three ways: Advantageous deck,
Disadvantageous deck, and NET score. The advantageous deck was calculated by summation
of Deck A and B (A+B) in overall 100 trials and disadvantageous deck was calculate by
summation of Deck C and D (C+D) in overall 100 trials.
Net score was calculated as the difference between advantageous deck and disadvantageous
decks, with the latter being subtracted from the former. Net score can be thought of as a
measure of overall performance, integrating sensitivity to gains and losses. Thus, if a
participant were presented with advantageous decks (Decks C or D) on 20 trials during
Block1 and chose to play 3rd times Deck A, 4
th times Deck B , 8th times Deck C and 5th
Times Deck D , his or her Advantageous Deck play Score would be 13. If the same
participant were presented with the disadvantageous decks (Decks A or B) on 20 trials during
the same Block1 3rd times Deck A, 4
th times Deck B, 8th times Deck C and 5th Times Deck
D, his or her Advantageous Deck play Score would be 7. The net score for this participant
would be percentage Advantageous Deck plays (13), Disadvantageous Deck play (7),
yielding a net score of 6 for 20 trials in Block 1. The Net Score is calculate as [Deck(C+D)-
(A+B)]. The Net score was calculated for 20 trials for all five blocks as well.
Behavioral Inhibition System/Behavioral Approach System Scale (BIS/BAS):
Behavior Inhibition System/Behavioral Activation System Scale (Carver, C. and White, T.,
1994) is used for assess the individual differences in the sensitivity of these systems. A behavioral
avoidance (or inhibition) system (BIS) is said to regulate aversive motives, in which the goal is
to move away from something unpleasant. BIS/BAS Scale is 20-item questionnaire which
scales are classified in four type subscales such as BAS Drive, BAS Fun Seeking, BAS
Reward Responsiveness, and BIS or Punishment Sensitivity. Its Alpha coefficient (ά=0.67).
Each item of this questionnaire is a statement that a person may either agree with or disagree
with. For each item, the participants were requested to indicated how much you agree or
disagree with the item. It is a four point Likert type scale. The participants had to rate their
response from “very true for me =1” to “very false for me = 4”. It has potential influence
punishment mediated and reward mediated behavior. BAS is activated by appetitive stimuli
and mediates the emotion of anticipatory pleasure is referred as Behavioral Approach System
BAS is the conceptual substrate for sensitivity to secondary appetitive stimuli, and is the
proposed causal basis of impulsivity. It is sensitive to: (a) conditioned stimuli associated with ww
w.n
eevi
aPDF.
com
12
reward, and (b) conditioned stimuli associated with the termination/omission of punishment.
The purpose of the BAS is to initiate exploratory, approach behavior that brings the organism
closer to final biological reinforces (e.g. food, sexual partners, etc.). Individuals with an
overactive BAS are more susceptible to impulsivity.
The BIS and BAS have the potential to influence punishment mediated and reward mediated
behavior. The BIS and BAS exert two effects that are facilitators and other antagonist. More
particular BAS facilates BIS antagonize the process of reward Stimuli. High BAS/LOW BIS
individual should display the highest appetitive response and positive emotions of these
stimuli. Similarly BIS facilates BAS antagonize the process of punishment Stimuli. High BIS
/Low BAS individual should show the highest aversive response and negative emotions to
these stimuli. Mainly we sought to evaluate how individual difference in BIS and BAS
reflected on electrochemical responses elicited by positive and negative feedback signals
during a learning task. Several theorists have argued that two general motivational systems
underlie behavior. A behavioral approach system (BAS) is believed to regulate appetitive
motives, in which the goal is to move toward something desired. A behavioral avoidance (or
inhibition) system (BIS) is said to regulate aversive motives, in which the goal is to move
away from something unpleasant. Several theorists have argued that two general motivational
systems underlie behavior. A behavioral approach system (BAS) is believed to regulate
appetitive motives, in which the goal is to move toward something desired. A behavioral
avoidance (or inhibition) system (BIS) is said to regulate aversive motives, in which the goal
is to move away from something unpleasant.
BAS subscale: there are three aspects of BAS that were tapped in this scale; namely BAS
Drive, BAS Fun Seeking and BAS Reward Responsiveness.
• BAS Drive Subscale: This scale includes 4 items that focus on the pursuit of desired
goals. Its Alpha coefficient (ά= 0.51). Statements such as “I go out of my way to get
things I want” and “When I go after something I use a "no holds barred" approach”
tapped this measure.
• BAS Fun Seeking: This scale has 4 items focusing on a desire for new rewards and a
willingness to approach a potentially rewarding event on the spur of the moment. Its
Alpha coefficient (ά= 0.34). Statements such as “I'm always willing to try something ww
w.n
eevi
aPDF.
com
13
new if I think it will be fun” and “I crave excitement and new sensations” tapped this
measure.
• BAS Reward Responsiveness: This scale has 5 items pertaining to positive responses
to the anticipation or occurrence of reward. Its Alpha coefficient (ά= 0.63).
Statements such as “When I'm doing well at something I love to keep at it” and
“When I see an opportunity for something I like I get excited right away.” tapped this
measure.
BIS or Punishment Sensitivity Subscale: This scale has 7 items referencing reactions to the
anticipation of punishment. Its Alpha coefficient (ά= 0.42). Statements such as “Even if
something bad is about to happen to me, I rarely experience fear or nervousness” and “I feel
pretty worried or upset when I think or know somebody is angry at me” tapped this measure.
NEO-Five Factor Inventory (NEO-FFI) Scale:
NEO-Five Factor Inventory (NEO-FFI) scales (Costa, P. T., and McCrae, R. R., 1992) is a
self-report inventory scale. The NEO-FFI can help you understand an individual's basic
emotional, interpersonal, experiential, attitudinal, and motivational styles. It also can help you
quickly develop rapport with the examinee, provide meaningful feedback and insight that will
help your client develop a greater self-understanding, enable you to anticipate the course of
therapy, and help you select the optimal treatment based on his or her personality.
NEO-FFI Scale is 60- item questionnaire (ά=0.51) that has subscales such as Neuroticism,
Extroversion, Openness, Agreeableness, and Conscientiousness. The participants could agree
with or disagree with each statement. For each statement, the participants could indicate how
much they agreed or disagreed with statement on a 5 point Likert type scale. The participants
had to rate their response from “Strongly Agree =5” to “Strongly Disagree= 1”.
• Neuroticism Subscale (ά=0.70): This scale included 12-items that tapped the
negative affect and self-reproach. Statements such as “I am not a worrier.”, and “I
often feel tense and jittery.” tapped this measure
• Extraversion Subscale (ά=0.54): This scale has included 12-items which are
characterized by positive affect, sociability and activity. Statements such as “I laugh
easily.”, “I usually prefer to do things alone.” and “My life is fast-paced.” tapped this
measure. ww
w.n
eevi
aPDF.
com
14
• Openness subscale (ά= 0.43): This scale has included 12-items which are
characterized by aesthetic interest, intellectual interest, unconventionality and
activity. It is referred to as Culture because of its emphasis on intellectualism, polish,
and independence of mind and Intellect because of its emphasis on intelligence,
sophistication, and reflection. Statements such as “Poetry has little or no effect on
me”, “I usually prefer to do things alone”, “I have a lot of intellectual curiosity”, “I
believe letting students hear controversial speakers can only confuse and mislead
them” and “I often try new and foreign foods” tapped this measure.
• Agreeableness Subscale (ά=0.58): This scale has included 12-items which are
characterized by nonantagonistic orientation and prosocial orientation. It can also be
seen as a combination of friendliness and compliance. Statements such as “I often get
into arguments with my family and co-workers” and “Most people I know like me”
tapped this measure.
• Conscientiousness subscale (ά=0.76): This scale has included 12-items which are
characterized by orderliness, responsibility, and dependability. Statements such as “I
keep my belongings clean and neat”, “I have a clear set of goals and work toward
them in an orderly fashion” and “Sometimes I’m not as dependable or reliable as I
should be” tapped this measure.
Rational Experiential Inventory (REI Scale)
REI Scale (Pacini, and Epstein, 1999) is a self-report inventory that assesses rational and
experiential thinking styles. The rational scale measures engagement in and favorability of
cognitive activities and corresponds to rational analytic thinking. The rational scale has been
found to be positively associated with openness, conscientiousness and favorable basic
beliefs, and negatively associated with neuroticism and conservatism (Pacini and Epstein,
1999). The experiential scale measures engagement in and favorability of intuitive activities
and corresponds to experiential-intuitive thinking. The Experiential Scale has been found to
be positively associated with extraversion, agreeableness and emotional expressivity, and
negatively associated with categorical thinking and intolerance.
ww
w.n
eevi
aPDF.
com
15
REI Scale is 24- item questionnaire that has two subscales namely; Rational Subscale and
Experiential Subscale. Its Alpha coefficient was (ά=0.50). Each item of this questionnaire is a
statement that a person may either agree or disagree with. For each item, the participants
indicated how much they agreed or disagreed with the item. The statements were rated on a 5
point Likert type rating scale with gradations of “Definitely False = 1” to “Definitely True =
5”. The two subscales are discussed in detail below:
• Rational Subscale (ά=0.47): This scale included 12-items that measures engagement
in and favorability of cognitive activities and corresponds to rational-analytic
thinking. The rational scale was found to be positively associated with openness,
conscientiousness and favorable basic beliefs, and negatively associated with
neuroticism and conservatism. Statements such as “I have a logical mind”, “I am not
very good at solving problems that require careful logical analysis” and “I try to avoid
situations that require thinking in depth about something” tapped this measure.
• Experiential Subscale (ά= 0.41): This scale included 12-items that measured
engagement in and favorability of intuitive activities and corresponds to experiential-
intuitive thinking. The experiential scale has been found to be positively associated
with extraversion, agreeableness and emotional expressivity, and negatively
associated with categorical thinking and intolerance. It is experiential processing is
affective, heuristic, and holistic. Statements such as “I often go by my instincts when
deciding on a course of action”, “I believe in trusting my hunches” and “I think there
are times when one should rely on one's intuition” tapped this measure.
Procedure:
The students from Indian Institute of Technology Bombay participated voluntarily in this
study. There were 130 student participants. The participants were tested individually in the
Psychophysiology laboratory. On arrival the participants were informed that the experiment
consisted of two parts namely a computerized test and a paper pencil test. The computerized
task consisted of Iowa Gambling Task and the paper pencil test consisted of the various
questionnaires namely, NEO-FFI, REI and BIS/BAS scales. The computerized and paper
pencil tasks were counterbalanced during administration.
ww
w.n
eevi
aPDF.
com
16
The participants were briefed about the nature of the experiment. The participants were
comfortably seated in front of the computer screen. The participants who were administered
the computerized task were instructed as “In front of you on the screen, there 4 decks of cards
A, B, C, and D. If you want to you select one card at a time, by clicking on the card, from
any deck you choose. Each time you select a card, the computer will tell you that you won
some money. I don’t know how much money you will win. You will find out as we go along.
Every time you win, the green bar gets bigger, every so often, however, when you click on
card, the computer tells you that you won some money, but then it says that you lost some
money too. I don’t know when you will lose, or how much you will lose. You will find out as
we go along. Every time you lose, the green bar gets smaller. You are absolutely free to
switch from one deck to the other at any time, and as often as you wish. The goal of the game
is to win as much money as possible, and if you can’t win avoid losing money as much as
possible. You won’t know when the game will end. You must keep on playing until the
computer stops. I am going to give you this $ 2000 credit, the green bar, to start the game.
The red bar here is a reminder of how much money you borrowed to play the game, and how
much money you have to pay back before we see how much you won or lost. It is important to
know that just like in real card game; the computer does not change the order of the cards
after the game starts. You may not be able to figure out exactly when you will lose money, but
the game is fair. The computer does not make you lose money at random, or make you lose
money based on the last card you picked. Also, each deck contains an equal number of cards
of each color, so the color of the reds does not tell you which decks are better in this game.
So you must not try to figure out what the computer is doing. All I can say is that some decks
are worse than the others. You may find all of them bad, but some are worse than the others.
No matter how much you find yourself losing, you can still win if you stay away from the
worst decks. Please treat the play money in this game as real money, and any decisions on
what to do with it should be made as if you were using your own money”. The participants
entered their demographic details on the computer screen and subsequently started with the
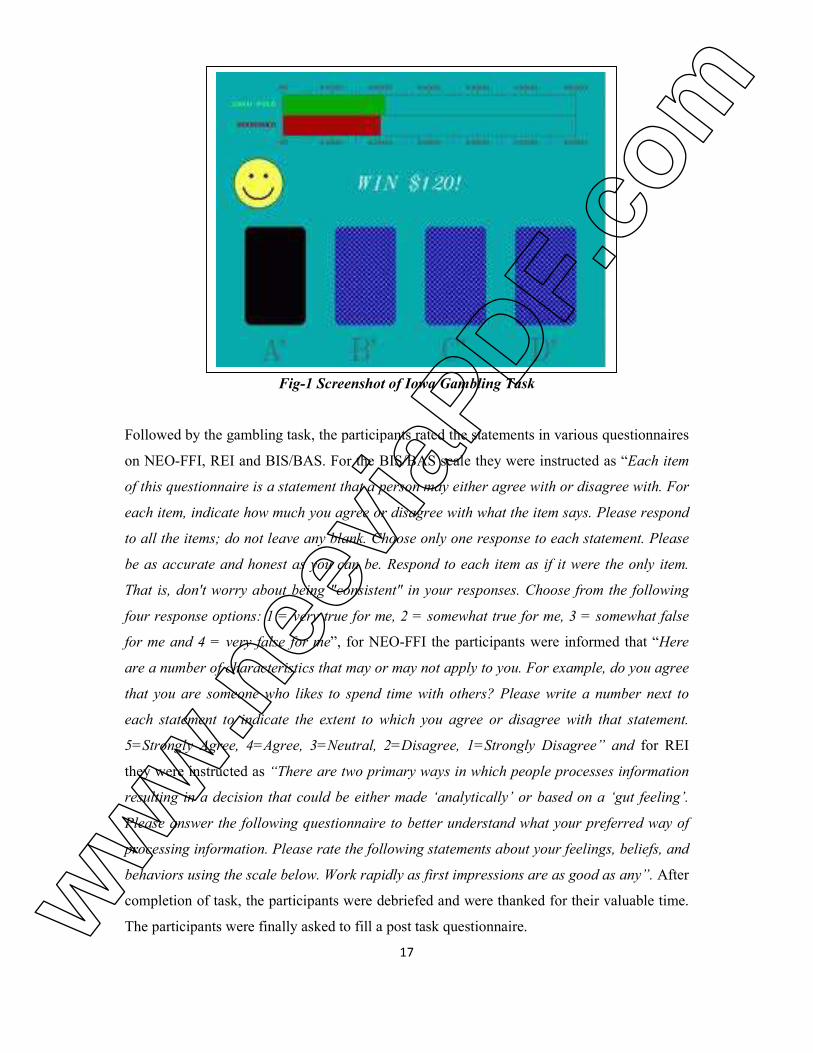
gambling task. The screenshot of IGT is shown in Fig. 1.
ww
w.n
eevi
aPDF.
com
17
Fig-1 Screenshot of Iowa Gambling Task
Followed by the gambling task, the participants rated the statements in various questionnaires
on NEO-FFI, REI and BIS/BAS. For the BIS/BAS scale they were instructed as “Each item
of this questionnaire is a statement that a person may either agree with or disagree with. For
each item, indicate how much you agree or disagree with what the item says. Please respond
to all the items; do not leave any blank. Choose only one response to each statement. Please
be as accurate and honest as you can be. Respond to each item as if it were the only item.
That is, don't worry about being "consistent" in your responses. Choose from the following
four response options: 1 = very true for me, 2 = somewhat true for me, 3 = somewhat false
for me and 4 = very false for me”, for NEO-FFI the participants were informed that “Here
are a number of characteristics that may or may not apply to you. For example, do you agree
that you are someone who likes to spend time with others? Please write a number next to
each statement to indicate the extent to which you agree or disagree with that statement.
5=Strongly Agree, 4=Agree, 3=Neutral, 2=Disagree, 1=Strongly Disagree” and for REI
they were instructed as “There are two primary ways in which people processes information
resulting in a decision that could be either made ‘analytically’ or based on a ‘gut feeling’.
Please answer the following questionnaire to better understand what your preferred way of
processing information. Please rate the following statements about your feelings, beliefs, and
behaviors using the scale below. Work rapidly as first impressions are as good as any”. After
completion of task, the participants were debriefed and were thanked for their valuable time.
The participants were finally asked to fill a post task questionnaire.
ww
w.n
eevi
aPDF.
com
18
CHAPTER 4
RESULT & DISCUSSIONS
Result:
The results focus on the role of impulsivity, Personality and information processing styles in
decision making. The result indicated that participants who were low on impulsivity fared
worst on IGT task compared to the participants who were high on impulsivity. Similar results
were demonstrated for personality traits and information processing styles. The results imply
that personality traits determine decision making process. Similarly information processing
styles evaluate preferences for information processing that determine the decisions making and
Impulsivity affects decision making.
Correlation Analysis:
As shown in Table 1, the model that best fit the data is the model that includes the interaction
between the Extroversion and Neuroticism scales (Pearson correlation r = -0.198, p < 0.05),
Agreeableness and Neuroticism scales (Pearson correlation r=-0.22, p<0.05) and
Conscientiousness and Neuroticism (Pearson correlation r=-0.201, p<0.05) and
Conscientiousness and Extroversion scale (Pearson correlation r=0.299, p<0.001) because
they are internally correlated to each others. This table shows the interaction between BAS
and Openness scale (Pearson correlation r=-0.201, p<0.05), BAS and Extroversion scale
(Pearson correlation r=-0.472, p<0.001). It happens as Extraversion primarily implies an
approach tendency towards BAS & Conscientiousness scales (Pearson correlation r=-0.190,
p<0.01) is negatively associated with BAS. This table shows interaction between BIS and
Neuroticism scale (Pearson correlation r=-0.445, p<0.001) which is negatively associated
with BIS. This table shows correlation between Rational and Extroversion scale (Pearson
correlation r=0.176, p<0.05), Rational and Conscientiousness scale (0.383, p<0.001) and
Rational and BAS scale (Pearson correlation r=-0.189, p<0.05) because the rational scale was
found to be positively associated with openness, conscientiousness and favorable basic
beliefs. This table shows the correlation between experiential and extroversion scale (Pearson
correlation r= 0.177, P<0.05) and Experiential and BAS scale(Pearson correlation r=-0.189,
p<0.05) because experiential scale has been found to be positively associated with ww
w.n
eevi
aPDF.
com
19
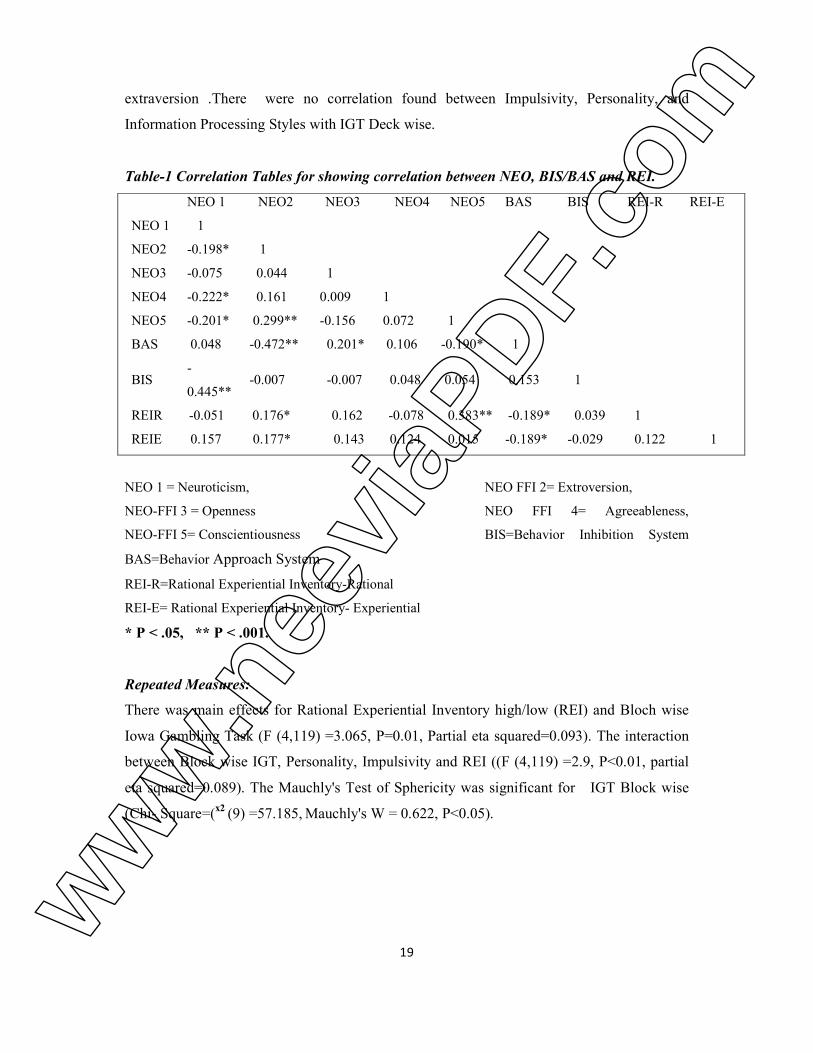
extraversion .There were no correlation found between Impulsivity, Personality, and
Information Processing Styles with IGT Deck wise.
Table-1 Correlation Tables for showing correlation between NEO, BIS/BAS and REI.
NEO 1 NEO2 NEO3 NEO4 NEO5 BAS BIS REI-R REI-E
NEO 1 1
NEO2 -0.198* 1
NEO3 -0.075 0.044 1
NEO4 -0.222* 0.161 0.009 1
NEO5 -0.201* 0.299** -0.156 0.072 1
BAS 0.048 -0.472** 0.201* 0.106 -0.190* 1
BIS -
0.445** -0.007 -0.007 0.048 0.054 0.153 1
REIR -0.051 0.176* 0.162 -0.078 0.383** -0.189* 0.039 1
REIE 0.157 0.177* 0.143 0.124 0.015 -0.189* -0.029 0.122 1
NEO 1 = Neuroticism, NEO FFI 2= Extroversion,
NEO-FFI 3 = Openness NEO FFI 4= Agreeableness,
NEO-FFI 5= Conscientiousness BIS=Behavior Inhibition System
BAS=Behavior Approach System
REI-R=Rational Experiential Inventory-Rational
REI-E= Rational Experiential Inventory- Experiential
* P < .05, ** P < .001.
Repeated Measures:
There was main effects for Rational Experiential Inventory high/low (REI) and Bloch wise
Iowa Gambling Task (F (4,119) =3.065, P=0.01, Partial eta squared=0.093). The interaction
between Block wise IGT, Personality, Impulsivity and REI ((F (4,119) =2.9, P<0.01, partial
eta squared=0.089). The Mauchly's Test of Sphericity was significant for IGT Block wise
(Chi- Square=(x2 (9) =57.185,
Mauchly's W = 0.622, P<0.05).
ww
w.n
eevi
aPDF.
com
20
There was main effects for Behavior Inhibition System/ Behavior Approach System high/low
(BIS/BAS) and NEO-V high/Low with Deck wise Iowa Gambling Task (F (3,120) =2.727,
P<0.05, Partial eta squared=0.064). The Mauchly's Test of Sphericity was significant for
IGT Deck wise (Chi- Square=(x2 (5) =6.149,
Mauchly's W = 0.950, P<0.05).
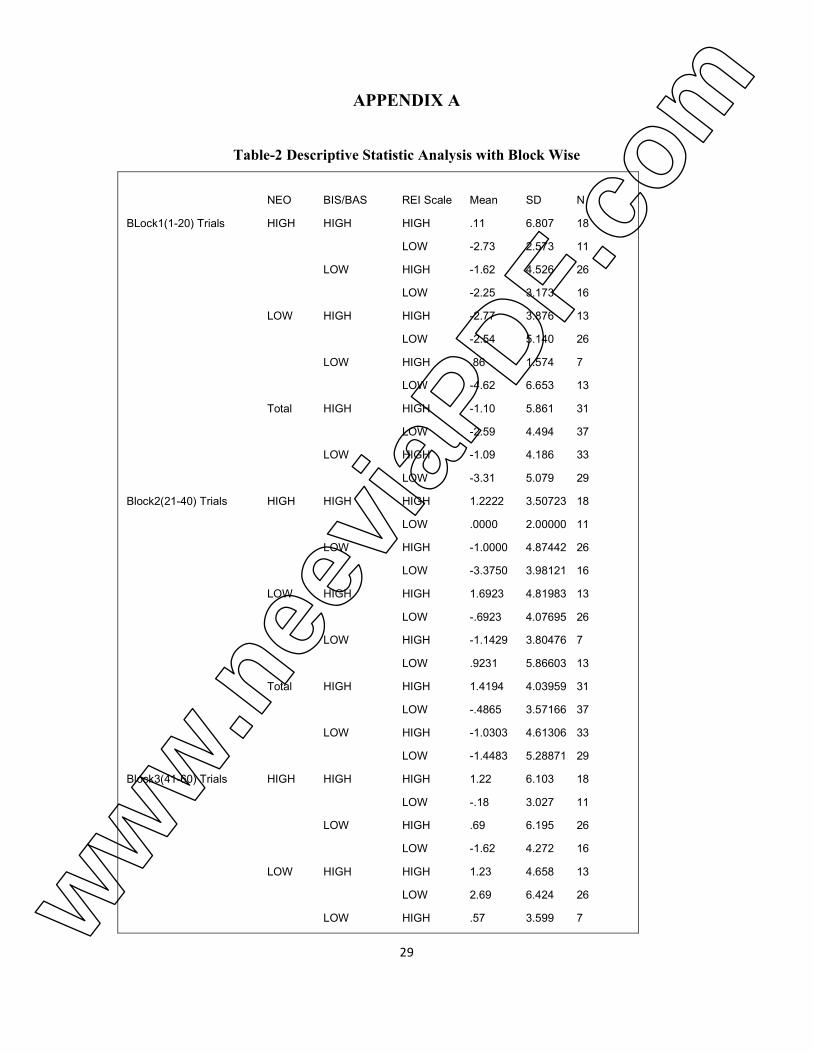
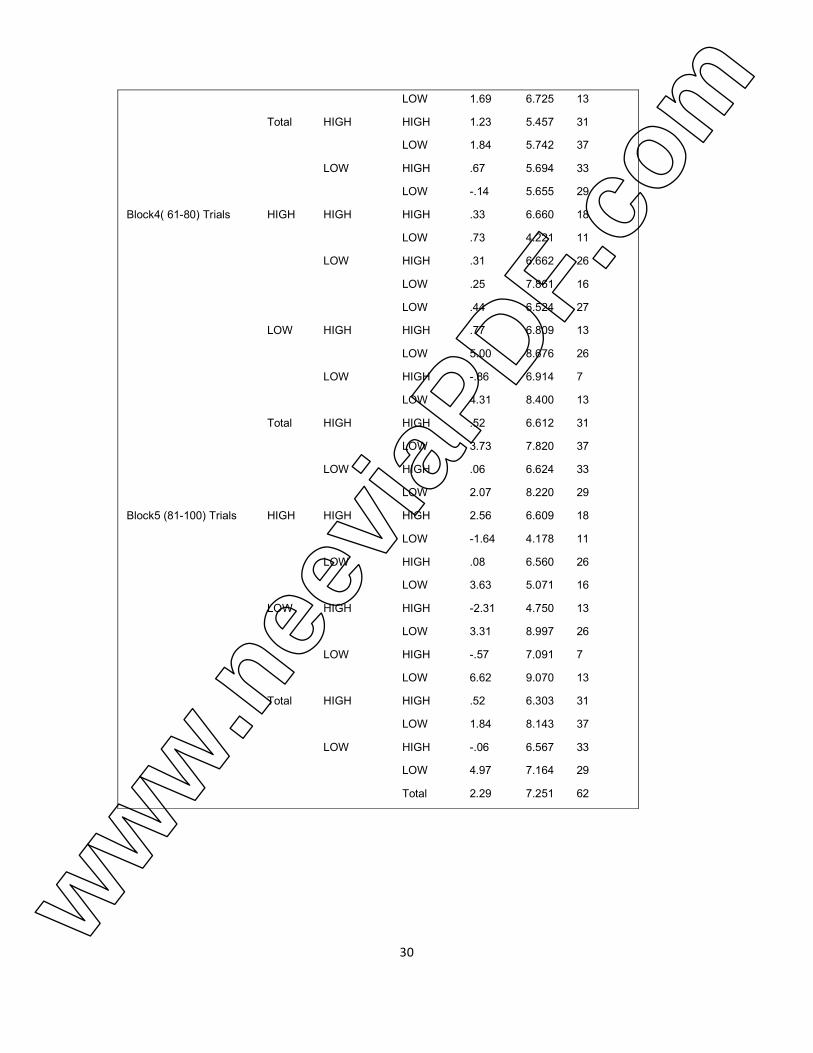
Descriptive Statistical Analysis:
Descriptive statistical analysis was conducted to check the relation between Iowa Gambling
Task Block wise and high/low BIS/BAS, NEO-V and REI scales. Accordingly, in the two
versus, high and low, the statistical comparison in the BIS/BAS scale with Block1, the mean
for high was -1.91 in case of the BIS/BAS with Block1 the mean was; the mean obtained in
case of the low was -2.13. In next NEO-V scale with Block1, the mean obtained for the case
of high was -1.49; the mean obtained for the low was -2.64; in the last REI scale with Block1
the mean obtained for the case of high was –1.09; the mean obtained in the case of the low
was -2.91.Similarly the statistical comparison in the BIS/BAS scale with Block2, the mean
for high was 0.38 in case of the BIS/BAS with Block2 the mean was; the mean obtained in
case of the low was -1.22. In next NEO-V scale with Block2, the mean obtained for the case
of high was 0.82; the mean obtained for the low was 0.14. In the last REI scale with Block2
the mean obtained for the case of high was 1.56; the mean obtained in the case of the low was
-0.91. Similarly the statistical comparison in the BIS/BAS scale with Block3, the mean for
high was 1.56 in case of the BIS/BAS with Block3 the mean was; the mean obtained in case
of the low was 0.29. In next NEO-V scale with Block3, the mean obtained for the case of
high was 0.17; the mean obtained for the low was 1.9. In the last REI scale with Block3 the
mean obtained for the case of high was 0.94; the mean obtained in the case of the low was
0.97. Similarly the statistical comparison in the BIS/BAS scale with Block4, the mean for
high was 2.26 in case of the BIS/BAS with Block4 the mean was; the mean obtained in case
of the low was 1.00. In next NEO-V scale with Block4, the mean obtained for the case of
high was 0.37; the mean obtained for the low was 3.22. In the last REI scale with Block4 the
mean obtained for the case of high was 0.28; the mean obtained in the case of the low was
3.00. A descriptive statistical analysis was done in order to check the relation between IGT
Block wise and high/low BIS/BAS, NEO-V and REI scales. Similarly the statistical
comparison in the BIS/BAS scale with Block5, the mean for high was 1.24 in case of the
BIS/BAS with Block5 the mean was; the mean obtained in case of the low was 2.29. In next ww
w.n
eevi
aPDF.
com
21
NEO-V scale with Block5, the mean obtained for the case of high was 1.24; the mean
obtained for the low was 2.34. In the last REI scale with Block4 the mean obtained for the
case of high was 0.22; the mean obtained in the case of the low was 3.21. A descriptive
statistical analysis was done in order to check the relation between IGT Block wise and
high/low BIS/BAS, NEO-V and REI scales. The type of IGT Descriptive statistical analysis
with Block wise was referred as (Table2 in appendix).
Descriptive statistical analysis was conducted to check the relation between Iowa Gambling
Task Deck wise and high/low BIS/BAS, NEO-V and REI scales. Accordingly, in the two
versus, high and low, the statistical comparison in the BIS/BAS scale with DeckA, the mean
for high was 20.69 in case of the BIS/BAS with DeckA the mean was; the mean obtained in
case of the low was 20.89. In next NEO-V scale with DeckA, the mean obtained for the case
of high was 21.27; the mean obtained for the low was 20.20. In the last REI scale with
DeckA the mean obtained for the case of high was 21.58; the mean obtained in the case of the
low was 20.02. Similarly the statistical comparison in the BIS/BAS scale with DeckB, the
mean for high was 27.57 in case of the BIS/BAS with DeckB the mean was; the mean
obtained in case of the low was 29.29. In next NEO-V scale with DeckB, the mean obtained
for the case of high was 29.31; the mean obtained for the low was 27.29. In the last REI scale
with DeckB the mean obtained for the case of high was 28.55; the mean obtained in the case
of the low was 28.24. Similarly the statistical comparison in the BIS/BAS scale with DeckC,
the mean for high was 25.40 in case of the BIS/BAS with DeckC the mean was; the mean
obtained in case of the low was 23.00. In next NEO-V scale with DeckC, the mean obtained
for the case of high was 23.18; the mean obtained for the low was 25.54. In the last REI scale
with DeckC the mean obtained for the case of high was 24.17; the mean obtained in the case
of the low was 24.43. Similarly the statistical comparison in the BIS/BAS scale with DeckD,
the mean for high was 26.49 in case of the BIS/BAS with DeckD the mean was; the mean
obtained in case of the low was 27.32. In next NEO-V scale with DeckD, the mean obtained
for the case of high was 26.66; the mean obtained for the low was 27.15. In the last REI scale
with DeckD the mean obtained for the case of high was 26.33; the mean obtained in the case
of the low was 27.42. A descriptive statistical analysis was done in order to check the
relation between IGT Deck wise and high/low BIS/BAS, NEO-V and REI scales. The type of
IGT Descriptive statistical analysis with Deck wise was referred as (Table3 in appendix).
ww
w.n
eevi
aPDF.
com
22
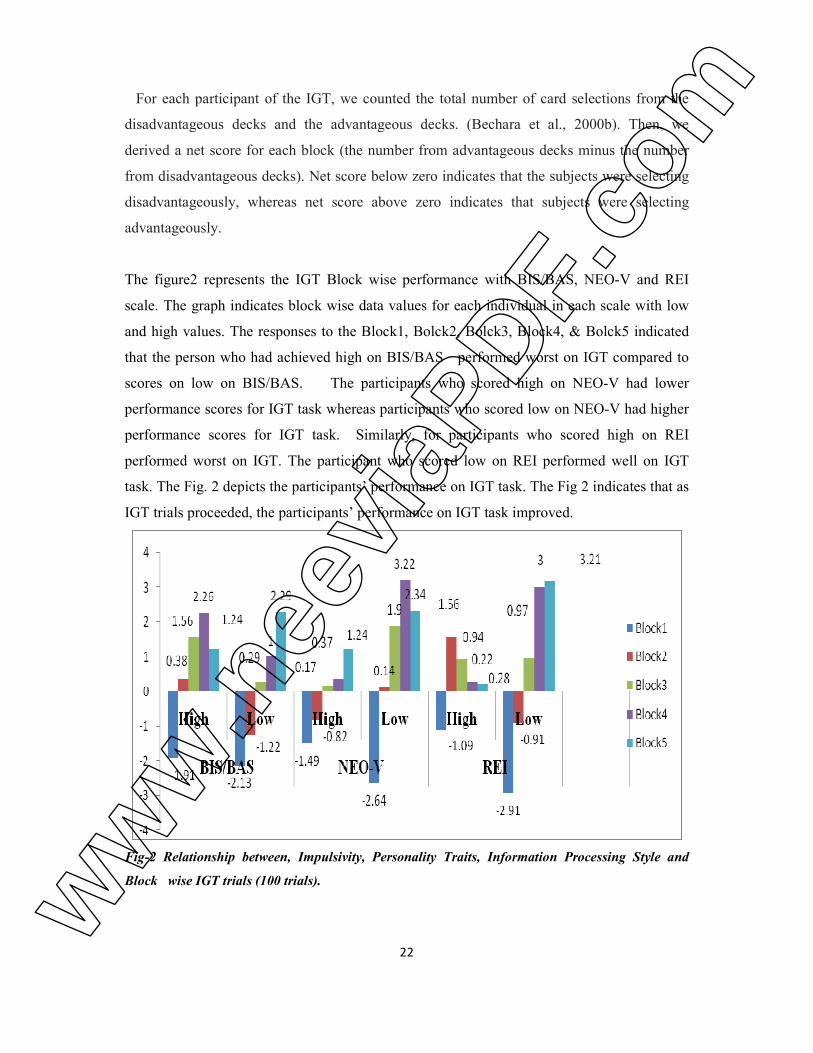
For each participant of the IGT, we counted the total number of card selections from the
disadvantageous decks and the advantageous decks. (Bechara et al., 2000b). Then, we
derived a net score for each block (the number from advantageous decks minus the number
from disadvantageous decks). Net score below zero indicates that the subjects were selecting
disadvantageously, whereas net score above zero indicates that subjects were selecting
advantageously.
The figure2 represents the IGT Block wise performance with BIS/BAS, NEO-V and REI
scale. The graph indicates block wise data values for each individual in each scale with low
and high values. The responses to the Block1, Bolck2, Bolck3, Block4, & Bolck5 indicated
that the person who had achieved high on BIS/BAS performed worst on IGT compared to
scores on low on BIS/BAS. The participants who scored high on NEO-V had lower
performance scores for IGT task whereas participants who scored low on NEO-V had higher
performance scores for IGT task. Similarly, for participants who scored high on REI
performed worst on IGT. The participant who scored low on REI performed well on IGT
task. The Fig. 2 depicts the participants’ performance on IGT task. The Fig 2 indicates that as
IGT trials proceeded, the participants’ performance on IGT task improved.
Fig-2 Relationship between, Impulsivity, Personality Traits, Information Processing Style and
Block wise IGT trials (100 trials).
ww
w.n
eevi
aPDF.
com
23
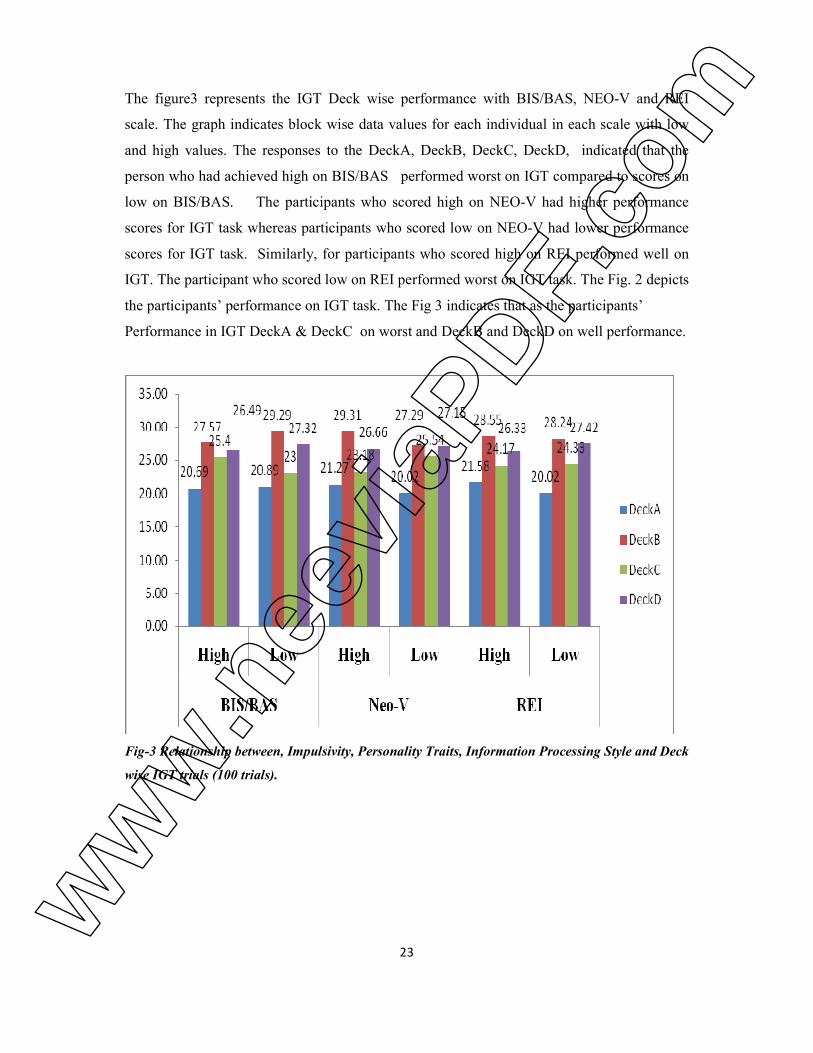
The figure3 represents the IGT Deck wise performance with BIS/BAS, NEO-V and REI
scale. The graph indicates block wise data values for each individual in each scale with low
and high values. The responses to the DeckA, DeckB, DeckC, DeckD, indicated that the
person who had achieved high on BIS/BAS performed worst on IGT compared to scores on
low on BIS/BAS. The participants who scored high on NEO-V had higher performance
scores for IGT task whereas participants who scored low on NEO-V had lower performance
scores for IGT task. Similarly, for participants who scored high on REI performed well on
IGT. The participant who scored low on REI performed worst on IGT task. The Fig. 2 depicts
the participants’ performance on IGT task. The Fig 3 indicates that as the participants’
Performance in IGT DeckA & DeckC on worst and DeckB and DeckD on well performance.
Fig-3 Relationship between, Impulsivity, Personality Traits, Information Processing Style and Deck
wise IGT trials (100 trials).
ww
w.n
eevi
aPDF.
com
24
Discussions:
We discussed about performance on the IGT was operationalised in three ways:
Advantageous deck, Disadvantageous deck, and NET score. The advantageous deck was
calculated by summation of Deck A and B (A+B) in overall 100 trials and disadvantageous
deck was calculate by summation of Deck C and D (C+D) in overall 100 trials.
In result we found relationship between IGT block wise and impulsivity, personality and
information processing style with the help of high/low. In both samples, the structure of the
BIS/BAS scales turned out to be four-dimensional: one dimension for the BIS scale and one
for each of the three BAS scales. These results were confirmed by differential relations of the
BIS scale and the three BAS scales with the Big- Five scales. Also Carver & White (1994),
Heubeck et al. (1998), Jorm et al. (1999), Leone et al. (2001) and Ross et al. (2002) found
that four dimensions are needed. The fact that we found the expected four-dimensional
structure for the translated BIS/BAS questionnaire also supports the validity of the
translation. Sometimes, BAS activity is measured as the sum of the three BAS scales (e.g.
Harmon- Jones, 2003, Gable et al., 2000, Gomez & Gomez, 2002, Gomez & McLaren, 1997,
O’Gorman & Baxter, 2002). This was confirmed by the differential relational pattern of the
BIS/BAS latent variables with the Big-Five personality dimensions. Several authors assume,
although sometimes implicitly, that BIS/BAS underlies part of the surface of personality as
described for example by the Big-Five (e.g. Corr, 2001; Gray, 1970; Matthews & Gilliland,
1999). However, the relation between Neuroticism and Extraversion of the BIS/BAS scale. In
accordance with our hypotheses and earlier findings, Neuroticism is highly positively related
with BIS and negatively with several BAS measures, but they can nevertheless shed light on
the meaning of the personality factor Neuroticism. In the literature Neuroticism is defined in
different ways: as emotional control (Fiske, 1949), negative emotionality, as negative affect
and as emotional (in) stability (Guilford, 1975; Hofstee, Raad, & Goldberg, 1992; Lorr,
1986).
In relation to information factor, the result shows that there was a significant relationship
between information and rational decision making style. Participants had higher field of
expertise, knowledge and decision-making skill. They believed in their judgment and relied
on their working experiences and intuition to make decision. Sometimes, respondents would
face situations of limited information; they had never encountered similar cases from the past ww
w.n
eevi
aPDF.
com
25
and would deal with the complicated information. Similarly, risk factor had a significant
effect on intuitive decision-making style. The result of this study is aligned with the study of
Harteis and Gruber (2008); they stated that individuals with risk-taking readiness would tend
to use intuition to make decision. Finally, the findings show that there was no significant
relationship between uncertainty and time with intuitive decision-making style of academic
staffs. The two factors were not significantly affecting intuition decision making, therefore it
is urged to gather more and adequate data to support these two factors.
ww
w.n
eevi
aPDF.
com

26
CHAPTER 5
CONCLUSIONS
The results imply personality traits determine decision making process and information
processing styles evaluate preferences for information processing for determines the decisions
making. Impulsivity affects decision making. The responses to the Block1, Bolck2, Bolck3,
Block4, & Bolck5 indicated that the person who had achieved high on BIS/BAS performed
worst on IGT compared to scores on low on BIS/BAS. The participants who scored high on
NEO-V had lower performance scores for IGT task whereas participants who scored low on
NEO-V had higher performance scores for IGT task. Similarly, for participants who scored
high on REI performed worst on IGT. The participant who scored low on REI performed well
on IGT task. The result indicated that as IGT trials proceeded, the participants’ performance
on IGT task improved. The responses to the DeckA, DeckB, DeckC, DeckD, indicated that
the person who had achieved high on BIS/BAS performed worst on IGT compared to scores
on low on BIS/BAS. The participants who scored high on NEO-V had higher performance
scores for IGT task whereas participants who scored low on NEO-V had lower performance
scores for IGT task. Similarly, for participants who scored high on REI performed well on
IGT. The participant who scored low on REI performed worst on IGT task. The result
indicates that as the participants’ performance in IGT DeckA & DeckC on worst and DeckB
and DeckD on well performance.
We are used IGT For each participants, we counted the total number of card selections from
the disadvantageous decks, and the total number of card selections from the advantageous
decks for each block of 20 cards. Then, we derived a net score for each block (the number
from advantageous decks minus the number from disadvantageous decks); net scores below
zero indicate that the subjects were selecting disadvantageously, whereas net scores above
zero indicate that subjects were selecting advantage.
ww
w.n
eevi
aPDF.
com
27
REFERENCES
Anton Aluja, Oscar Garc, J_er^ome Rossier, Luis F. Garc(2005),”Comparison of the NEO-
FFI, the NEO-FFI-R and an alternative short version of the NEO-PI-R (NEO-60) in
Swiss and Spanish samples” Personality and Individual Differences, vol- 38, pp
591–604.
Andreu Vigil-Colet (2007). ”Impulsivity and decision making in the balloon analogue risk-
taking task”, Personality and Individual Differences vol-43, pp 37–45,
doi:10.1016/j.paid.2006.11.005.
Anouk Scheres and Alan G Sanfey(2006 )”Individual differences in decision making: Drive
and reward responsiveness affect strategic bargaining in economic games”,
Behavioral and Brain Functions , 2:35 doi:10.1186/1744-9081-2-35 pp 1-8( (page
number not for citation purposes).
Bechara,H. Domasio, D. Tranel & A.R. Domasio (2005) “ The Iowa Gambling Task & the
somatic marker hypothesis: Some questions and answers” cognitive science,
vol.9 N0.4 page 159-162.
Carver, C. & White, T. (1994). “Behavioral Activation, and affective response to impending
reward and punishment: The BIS/BAS Scales”, Journal of Personality and Social
Psychology, 67(2), 319-333.
Costa, P.T., Jr, P. T. & McCrae, R.R. (1992). “NEO-Five Factor Scale”, Journal of
Personality, 60(2), 175-215.
Costa, P.T., Jr, P. T., & McCrae, R.R. (1992),” Four ways five factors are basic. Personality
and Individual Differences”, Journal of Personality, 13 (6), 653-665.
DIRK J. M. SMITS and P. D. BOECK (2006),” From BIS/BAS to the Big Fivey “European
Journal of Personality Eur. J. Pers. 20: 255–270 (2006) Published online in Wiley
InterScience (www.interscience.wiley.com). DOI: 10.1002/per.583.
Elizabeth Cauffman, and Elizabeth P. Shulman, Laurence Steinberg, Eric Claus, and Marie
T. Banich , Sandra Graham and Jennifer Woolard(2007) “Age Differences in
Affective Decision Making as Indexed by Performance on the Iowa Gambling
Task”, Developmental Psychology 2010, Vol. 46, No. 1, pp 193–207.
ww
w.n
eevi
aPDF.
com
28
Huam Hon Tat, Pooi Sun Hooi, Amran Md Rasli, Thoo Ai Chin, Rosman Md Yusoff,(2010)”
The Role ofIintuition in Decision Making: an empirical study on academic staff in a
Malaysian public university”, ICBI 2010 - University of Kelaniya, Sri Lanka pp 1-
13.
Ingmar H.A. Franken, Jan W. van Stirien & Peter Muris (2008) “Impulsivity is associated
with behavioral decisions-making deficits” Institute of Psychology, The
Netherlands, Psychiatry Research 158, pages 155-163.
Kimberly L. Kjome , Scott D. Lane, Joy M. Schmitz, Charles Green, Liangsuo Ma, Irshad
Prasla, Alan C. Swann, F. Gerard Moeller(2010)” Relationship between impulsivity
and decision making in cocaine dependence”, Psychiatry Research 178 , pp 299–
304, doi:10.1016/j.psychres.2009.11.024
L. de Vissera, L.J. van der Knaap, A.J.A.E. van de Loo,C.M.M., van der Weerd,
F. Ohl, R. van den Bos(2010), ”Trait anxiety affects decision-making differently in healthy
men and women: Towards gender-specific endophenotypes of anxiety”,
Neuropsychologia vol-48, pp1598–1606.
NANCY H. LEONARD1, RICHARD W. SCHOLL (1999), “Information processing style
and decision making”, AN Journal of Organizational Behavior J. Organiz. Behav.
Vol-20, pp 407-0 420.
Pacini and Epstein, (1999), Rational Experiential Scale”, Society of Judgments of Decision
Making, Vol.6 (4 ) pp. 295-305
Shahar Ayal¤ Guy Hochman† Dan Zakay(2011), “Two sides of the same coin: Information
processing style and reverse biases”, journal of Judgment and Decision Making,
Vol. 6, No. 4, June 2011, pp. 295–306.
Vilfredo De Pascalis, Vincenzo Varriale & Laura D’Antuono (2010),”Event Related
Components of the\ punishment & reward Senstivity”, Clinical Neurophysiology
vol. 121, pages 60-76.
ww
w.n
eevi
aPDF.
com
29
APPENDIX A
Table-2 Descriptive Statistic Analysis with Block Wise
NEO BIS/BAS REI Scale Mean SD
N
BLock1(1-20) Trials HIGH HIGH HIGH .11 6.807 18
LOW -2.73 2.573 11
LOW HIGH -1.62 4.526 26
LOW -2.25 3.173 16
LOW HIGH HIGH -2.77 3.876 13
LOW -2.54 5.140 26
LOW HIGH .86 1.574 7
LOW -4.62 6.653 13
Total HIGH HIGH -1.10 5.861 31
LOW -2.59 4.494 37
LOW HIGH -1.09 4.186 33
LOW -3.31 5.079 29
Block2(21-40) Trials HIGH HIGH HIGH 1.2222 3.50723 18
LOW .0000 2.00000 11
LOW HIGH -1.0000 4.87442 26
LOW -3.3750 3.98121 16
LOW HIGH HIGH 1.6923 4.81983 13
LOW -.6923 4.07695 26
LOW HIGH -1.1429 3.80476 7
LOW .9231 5.86603 13
Total HIGH HIGH 1.4194 4.03959 31
LOW -.4865 3.57166 37
LOW HIGH -1.0303 4.61306 33
LOW -1.4483 5.28871 29
Block3(41-60) Trials HIGH HIGH HIGH 1.22 6.103 18
LOW -.18 3.027 11
LOW HIGH .69 6.195 26
LOW -1.62 4.272 16
LOW HIGH HIGH 1.23 4.658 13
LOW 2.69 6.424 26
LOW HIGH .57 3.599 7 ww
w.n
eevi
aPDF.
com
30
LOW 1.69 6.725 13
Total HIGH HIGH 1.23 5.457 31
LOW 1.84 5.742 37
LOW HIGH .67 5.694 33
LOW -.14 5.655 29
Block4( 61-80) Trials HIGH HIGH HIGH .33 6.660 18
LOW .73 4.221 11
LOW HIGH .31 6.662 26
LOW .25 7.861 16
LOW .44 6.524 27
LOW HIGH HIGH .77 6.809 13
LOW 5.00 8.676 26
LOW HIGH -.86 6.914 7
LOW 4.31 8.400 13
Total HIGH HIGH .52 6.612 31
LOW 3.73 7.820 37
LOW HIGH .06 6.624 33
LOW 2.07 8.220 29
Block5 (81-100) Trials HIGH HIGH HIGH 2.56 6.609 18
LOW -1.64 4.178 11
LOW HIGH .08 6.560 26
LOW 3.63 5.071 16
LOW HIGH HIGH -2.31 4.750 13
LOW 3.31 8.997 26
LOW HIGH -.57 7.091 7
LOW 6.62 9.070 13
Total HIGH HIGH .52 6.303 31
LOW 1.84 8.143 37
LOW HIGH -.06 6.567 33
LOW 4.97 7.164 29
Total 2.29 7.251 62
ww
w.n
eevi
aPDF.
com
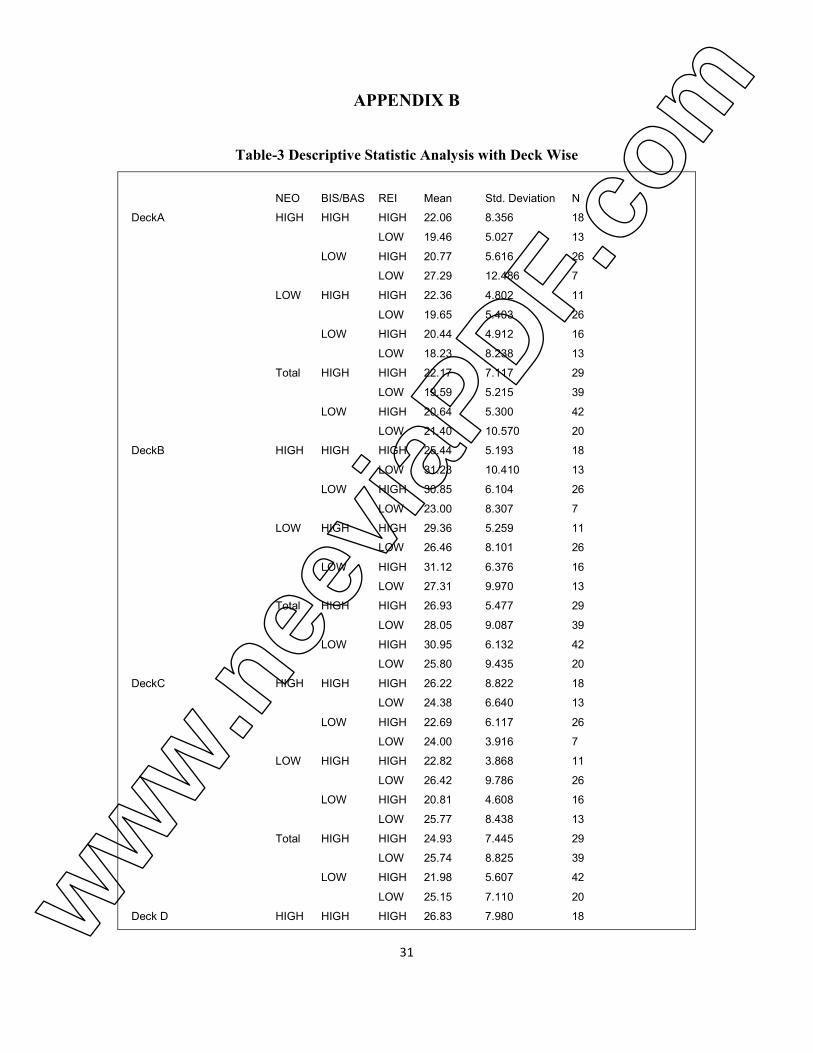
31
APPENDIX B
Table-3 Descriptive Statistic Analysis with Deck Wise
NEO BIS/BAS REI Mean Std. Deviation N
DeckA HIGH HIGH HIGH 22.06 8.356 18
LOW 19.46 5.027 13
LOW HIGH 20.77 5.616 26
LOW 27.29 12.486 7
LOW HIGH HIGH 22.36 4.802 11
LOW 19.65 5.403 26
LOW HIGH 20.44 4.912 16
LOW 18.23 8.238 13
Total HIGH HIGH 22.17 7.117 29
LOW 19.59 5.215 39
LOW HIGH 20.64 5.300 42
LOW 21.40 10.570 20
DeckB HIGH HIGH HIGH 25.44 5.193 18
LOW 31.23 10.410 13
LOW HIGH 30.85 6.104 26
LOW 23.00 8.307 7
LOW HIGH HIGH 29.36 5.259 11
LOW 26.46 8.101 26
LOW HIGH 31.12 6.376 16
LOW 27.31 9.970 13
Total HIGH HIGH 26.93 5.477 29
LOW 28.05 9.087 39
LOW HIGH 30.95 6.132 42
LOW 25.80 9.435 20
DeckC HIGH HIGH HIGH 26.22 8.822 18
LOW 24.38 6.640 13
LOW HIGH 22.69 6.117 26
LOW 24.00 3.916 7
LOW HIGH HIGH 22.82 3.868 11
LOW 26.42 9.786 26
LOW HIGH 20.81 4.608 16
LOW 25.77 8.438 13
Total HIGH HIGH 24.93 7.445 29
LOW 25.74 8.825 39
LOW HIGH 21.98 5.607 42
LOW 25.15 7.110 20
Deck D HIGH HIGH HIGH 26.83 7.980 18 ww
w.n
eevi
aPDF.
com

32
LOW 24.92 7.588 13
LOW HIGH 26.46 7.564 26
LOW 27.14 7.128 7
LOW HIGH HIGH 25.45 5.165 11
LOW 27.46 8.914 26
LOW HIGH 27.62 7.796 16
LOW 28.77 8.054 13
Total HIGH HIGH 26.31 6.975 29
LOW 26.62 8.481 39
LOW HIGH 26.90 7.580 42
LOW 28.20 7.592 20
ww
w.n
eevi
aPDF.
com