Embed Size (px)
Citation preview

TELEMETRY ONBOARDINGRoberto A. Vitillo, Mark Reid
1. What is Unified Telemetry?
2. Executive dashboards
3. Telemetry dashboards
4. Adding a probe
5. What is a ping
6. Data pipeline
7. Experiments
8. Offline processing
9. Stats
10. Privacy Policy
11. Data Collection Policy
• Measures how Firefox behaves in the real world [1].
• Collects non-personal information about performance, hardware, usage, errors, and customizations
• The data, used in aggregate,
‣ allows to identify new issues and regressions
‣ allows to conduct longitudinal studies and experiments
WHAT IS UNIFIED TELEMETRY?
[1] https://wiki.mozilla.org/Unified_Telemetry
• Classic Telemetry [1], designed to send performance and usage data
‣ enabled by default on pre-release channels and disabled by default on release
• Firefox Health Report [2] is a data source intended to be representative and support longitudinal study.
‣ enabled by default on release and pre-release[1] https://wiki.mozilla.org/Telemetry[2] https://wiki.mozilla.org/Firefox_Health_Report
UNIFIED?
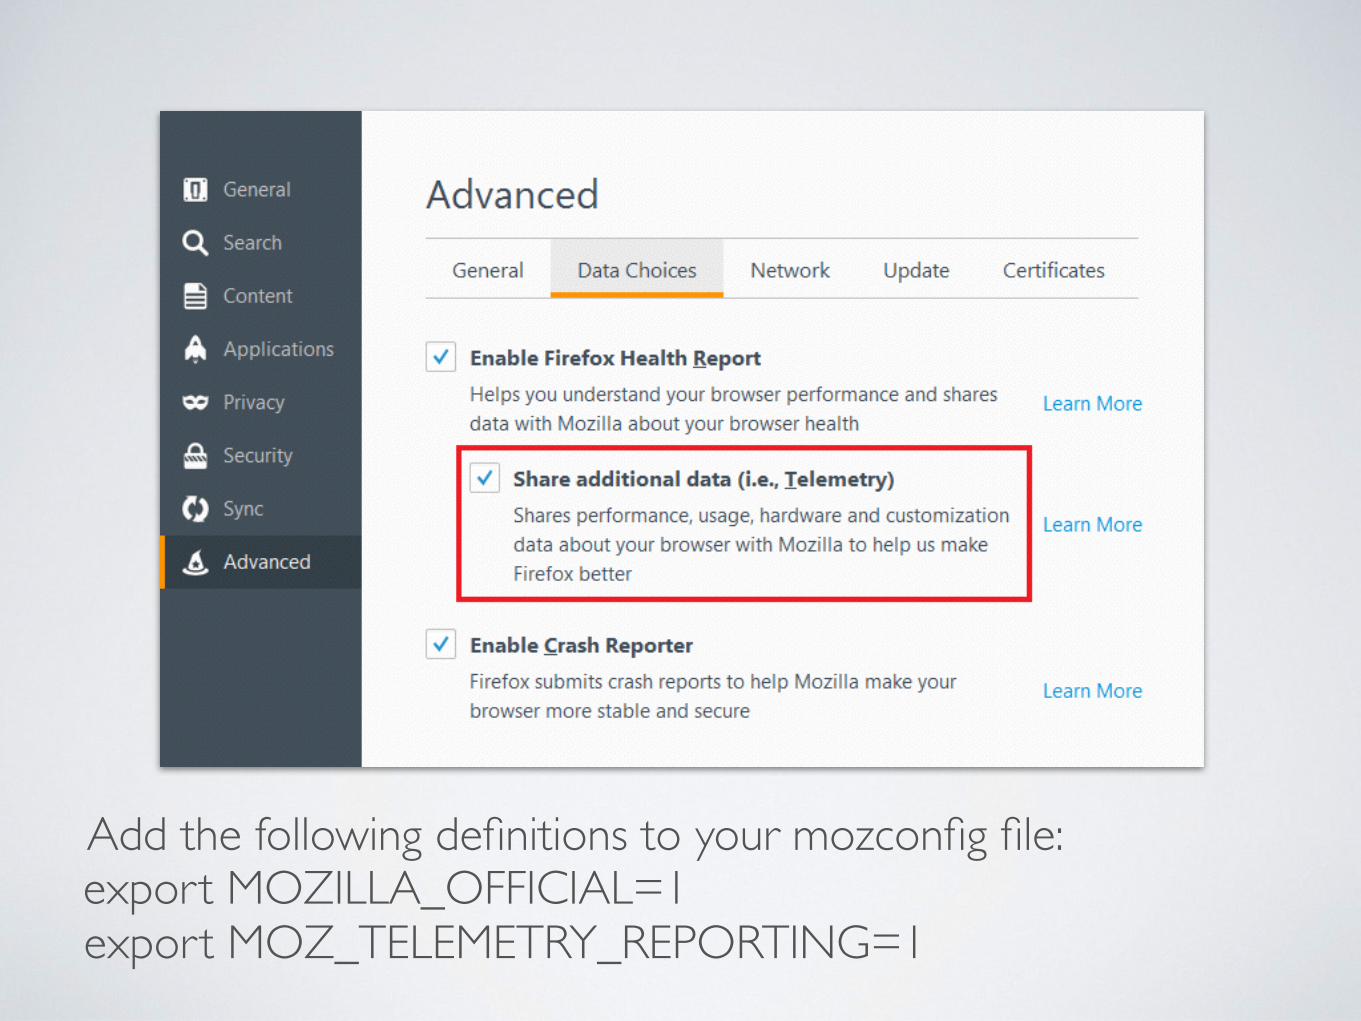
Add the following definitions to your mozconfig file: export MOZILLA_OFFICIAL=1export MOZ_TELEMETRY_REPORTING=1
REFERENCES
• https://wiki.mozilla.org/Unified_Telemetry
• https://wiki.mozilla.org/Telemetry
• https://wiki.mozilla.org/Firefox_Health_Report

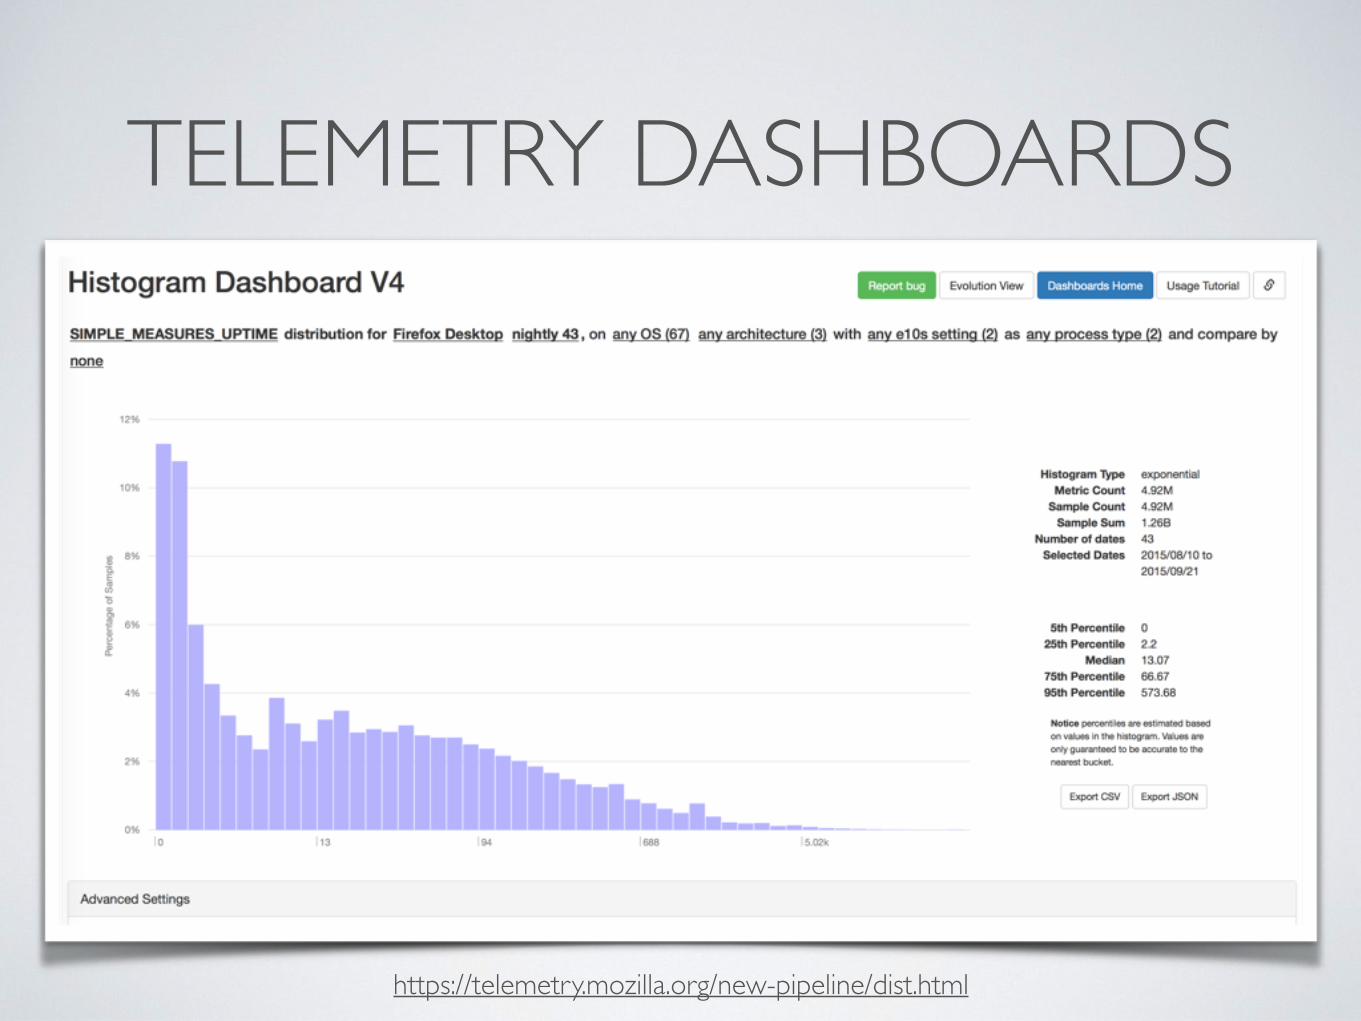
TELEMETRY DASHBOARDS
https://telemetry.mozilla.org/new-pipeline/dist.html
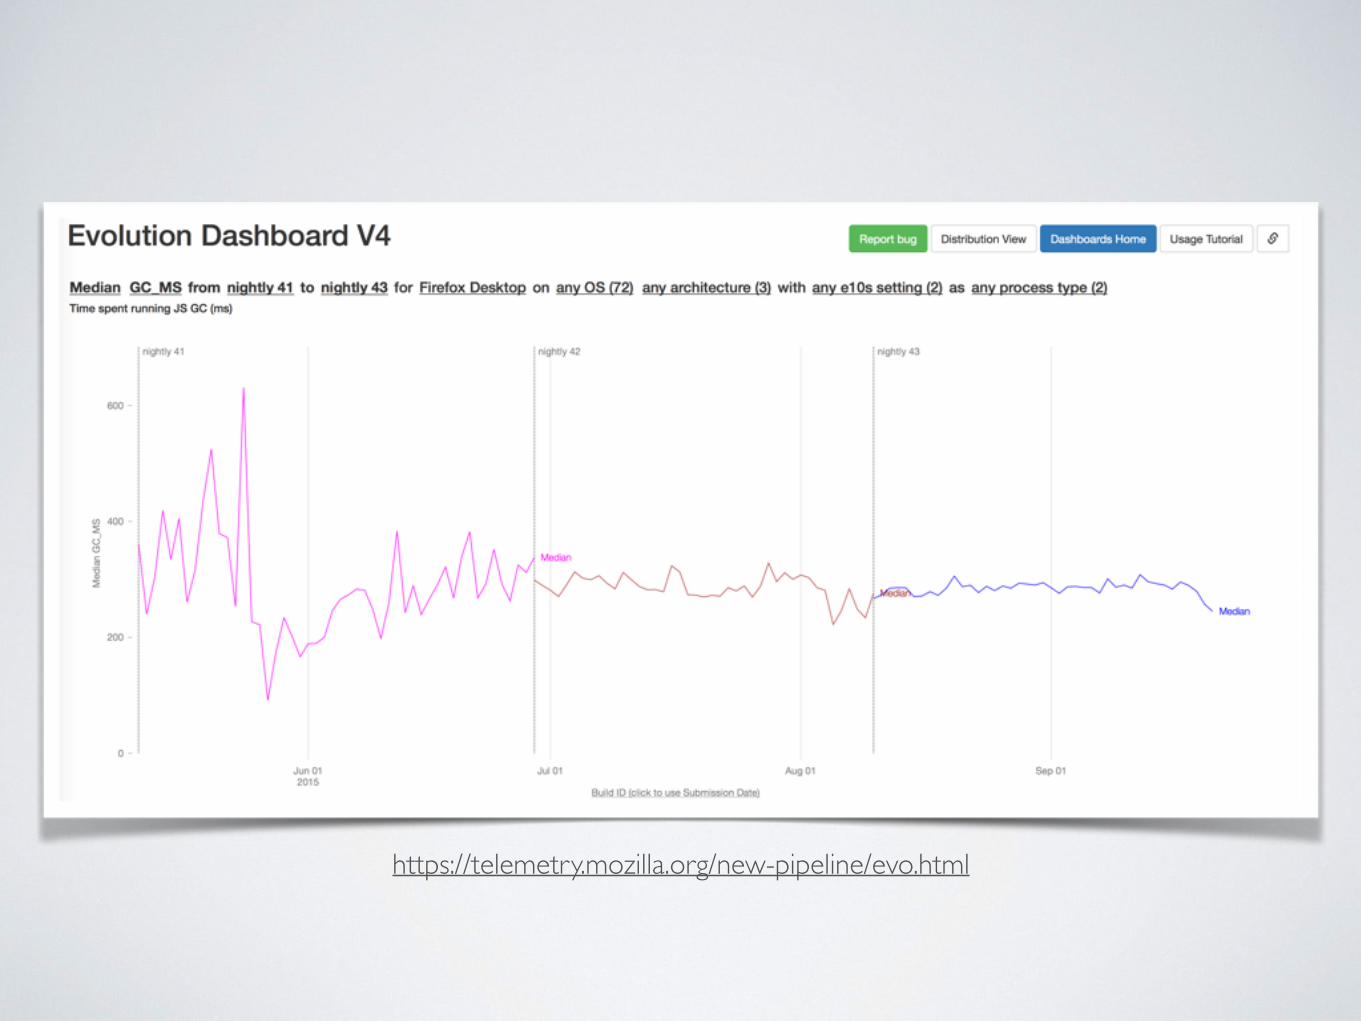
https://telemetry.mozilla.org/new-pipeline/evo.html
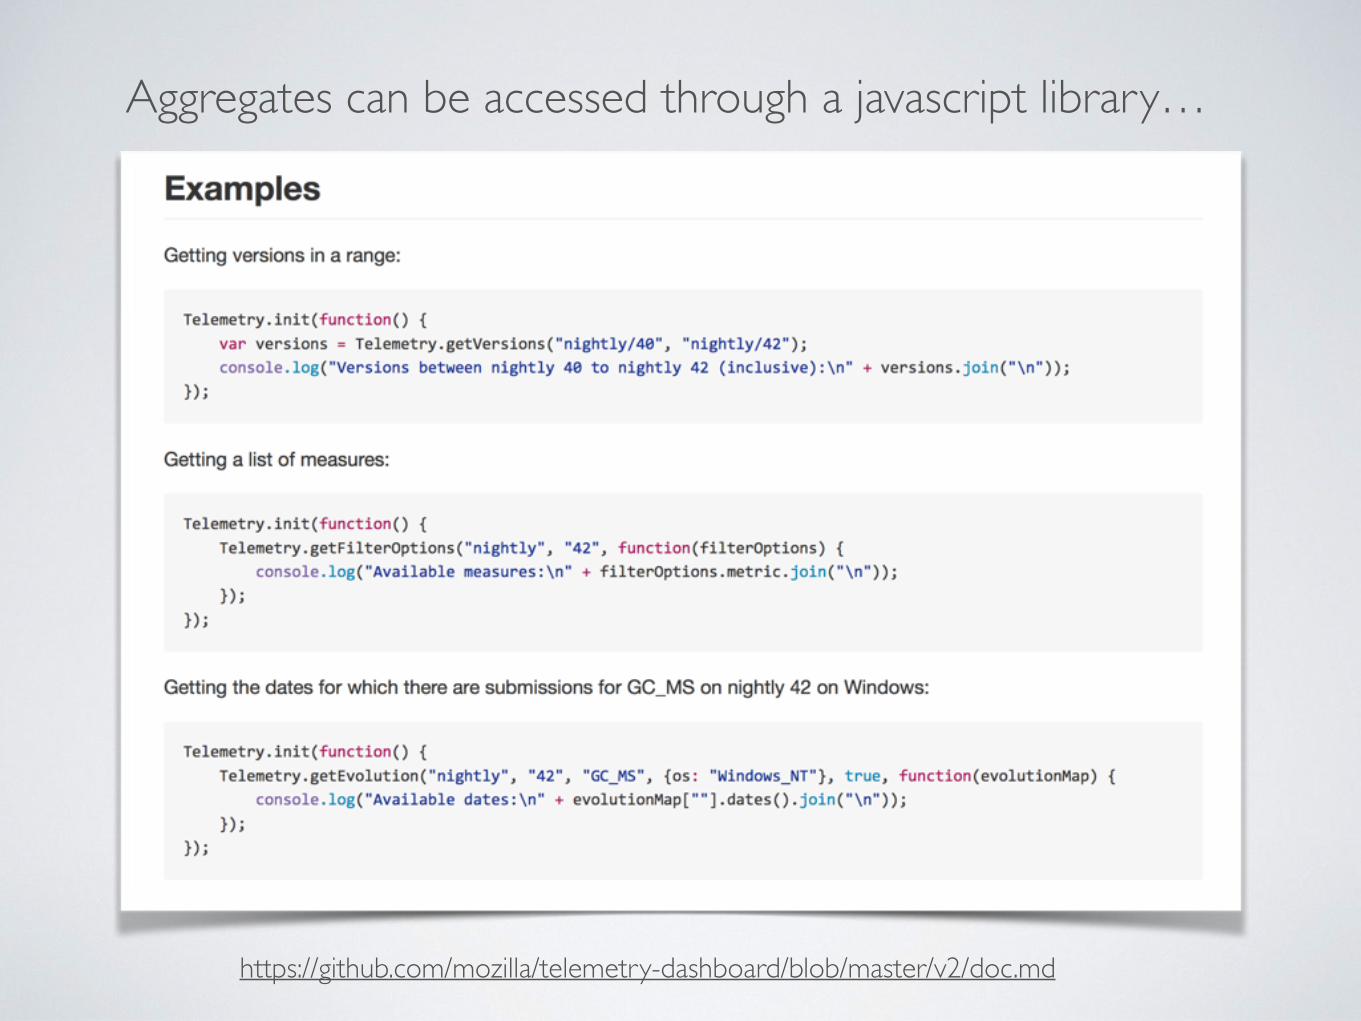
Aggregates can be accessed through a javascript library…
https://github.com/mozilla/telemetry-dashboard/blob/master/v2/doc.md
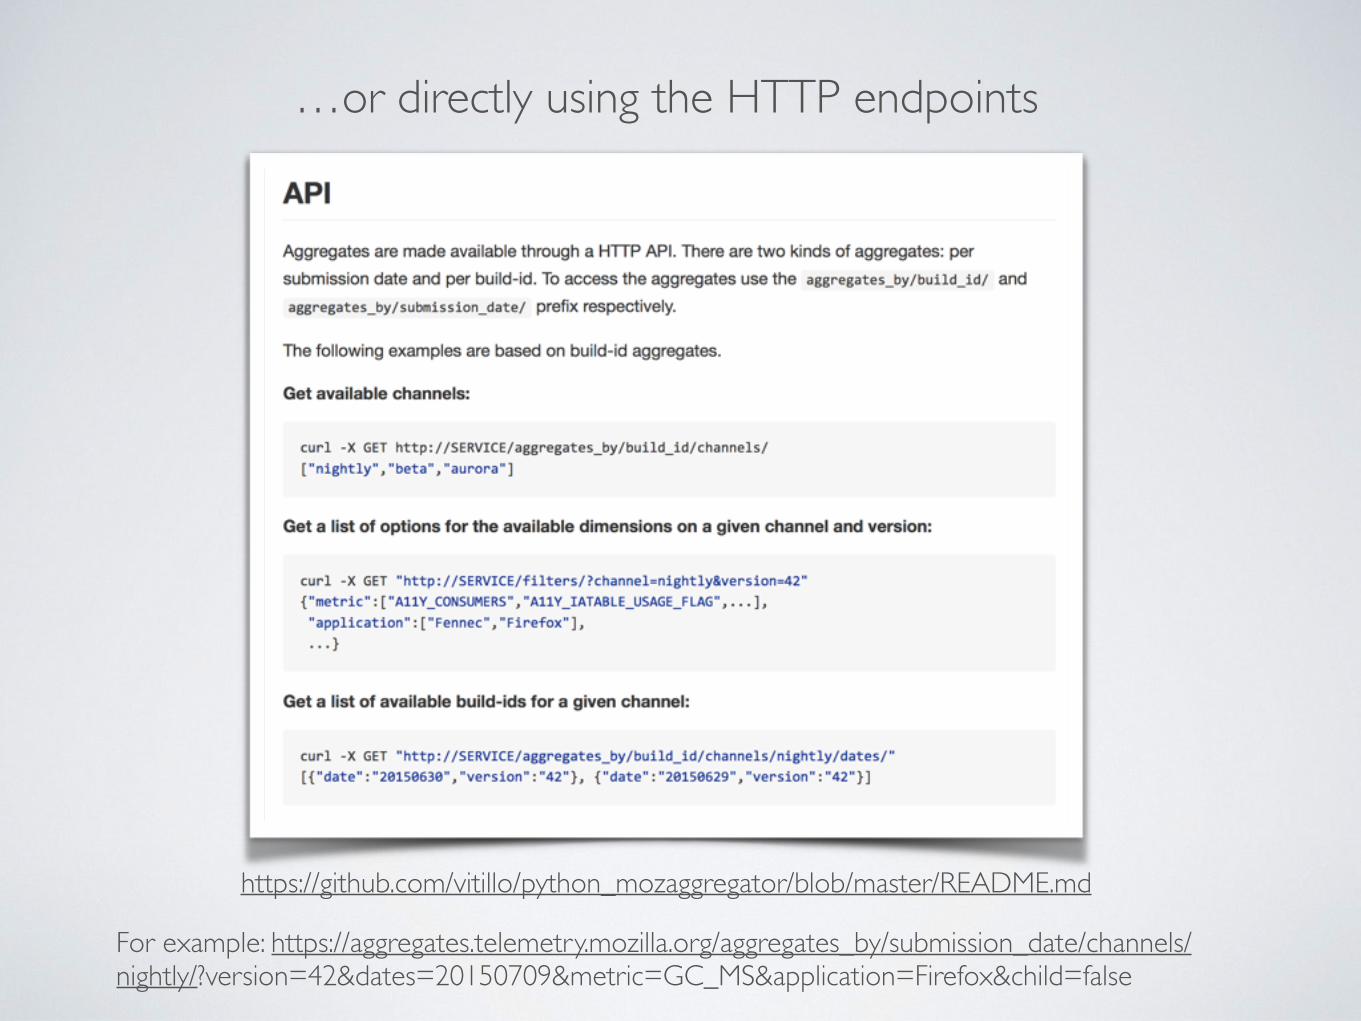
…or directly using the HTTP endpoints
https://github.com/vitillo/python_mozaggregator/blob/master/README.md
For example: https://aggregates.telemetry.mozilla.org/aggregates_by/submission_date/channels/nightly/?version=42&dates=20150709&metric=GC_MS&application=Firefox&child=false
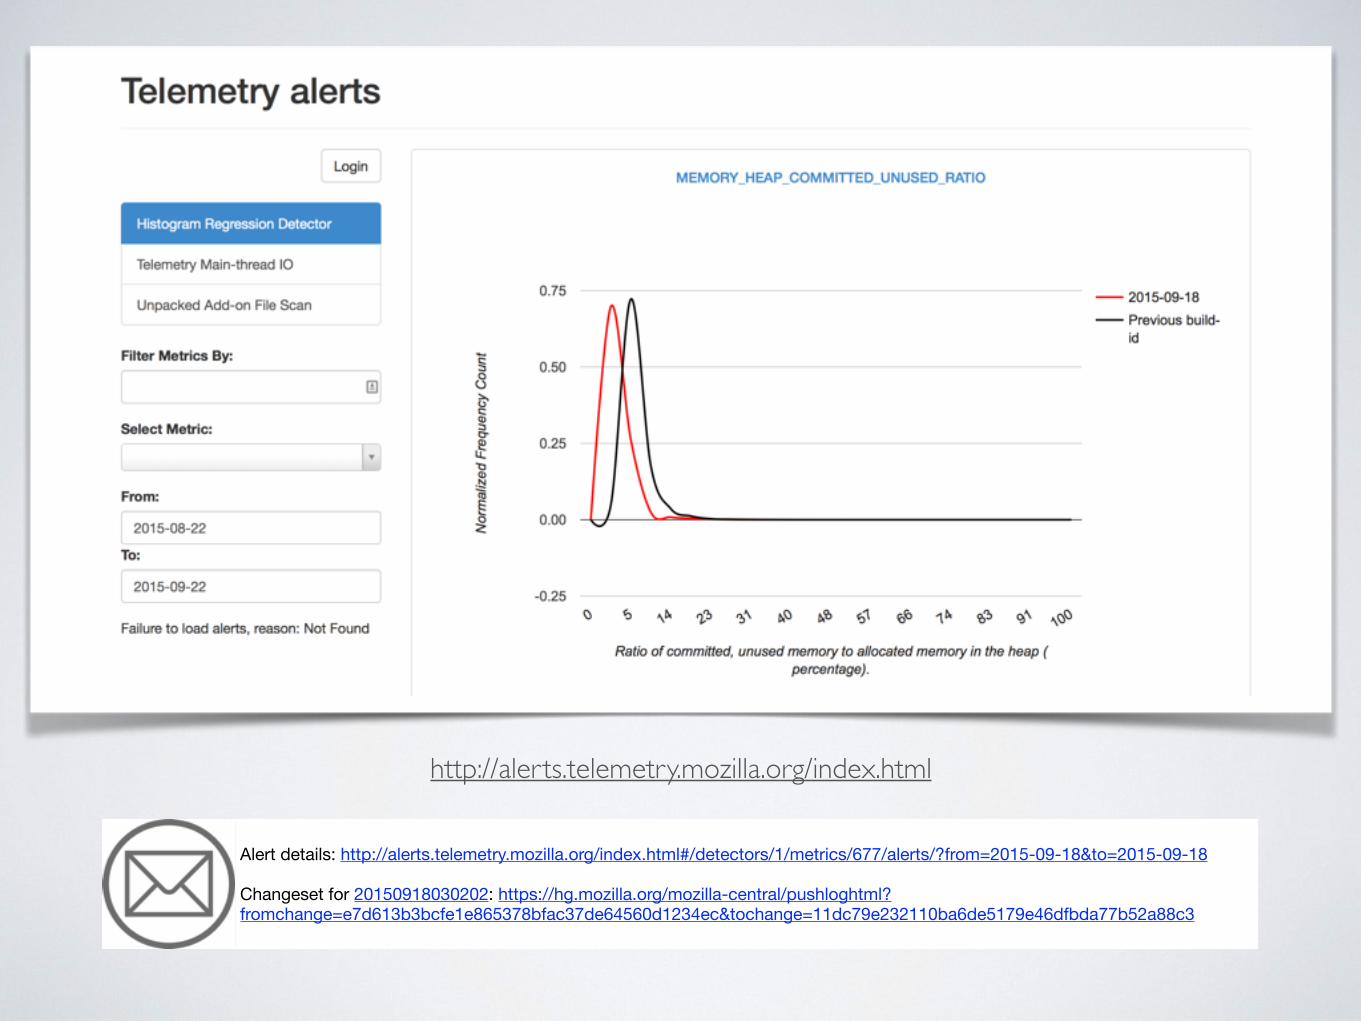
http://alerts.telemetry.mozilla.org/index.html
Alert details: http://alerts.telemetry.mozilla.org/index.html#/detectors/1/metrics/677/alerts/?from=2015-09-18&to=2015-09-18
Changeset for 20150918030202: https://hg.mozilla.org/mozilla-central/pushloghtml?fromchange=e7d613b3bcfe1e865378bfac37de64560d1234ec&tochange=11dc79e232110ba6de5179e46dfbda77b52a88c3
REFERENCES• http://robertovitillo.com/2015/07/02/telemetry-metrics-roll-ups/
• https://anthony-zhang.me/blog/telemetry-demystified/
• https://anthony-zhang.me/blog/telemetry-demystified/
• http://robertovitillo.com/2014/07/28/regression-detection-for-telemetry-histograms/
• https://telemetry.mozilla.org/
• https://metrics.services.mozilla.com/

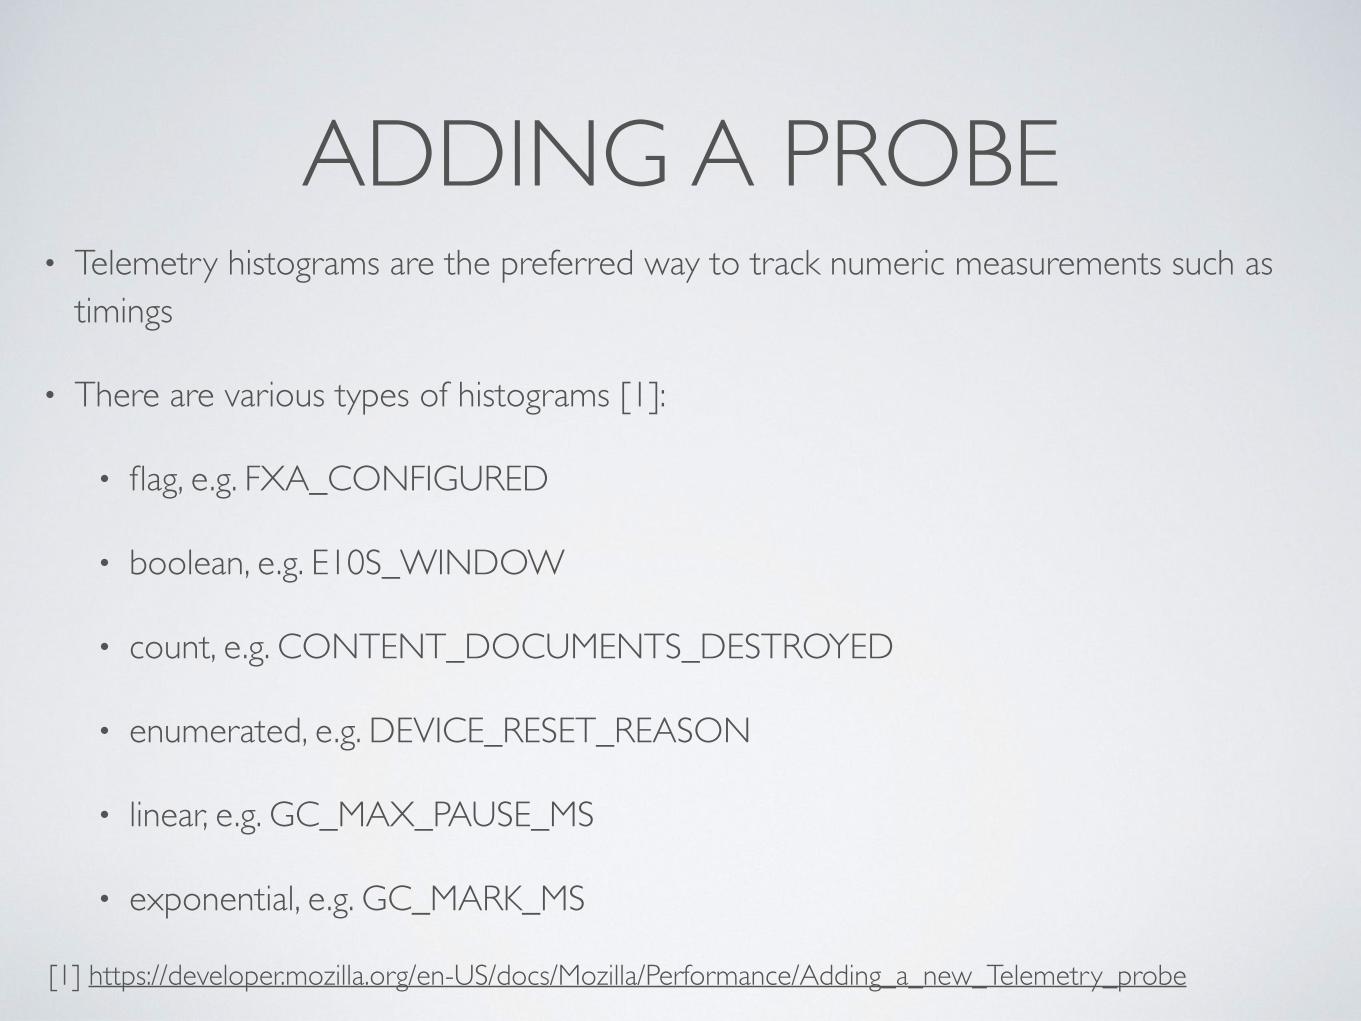
ADDING A PROBE• Telemetry histograms are the preferred way to track numeric measurements such as
timings
• There are various types of histograms [1]:
• flag, e.g. FXA_CONFIGURED
• boolean, e.g. E10S_WINDOW
• count, e.g. CONTENT_DOCUMENTS_DESTROYED
• enumerated, e.g. DEVICE_RESET_REASON
• linear, e.g. GC_MAX_PAUSE_MS
• exponential, e.g. GC_MARK_MS
[1] https://developer.mozilla.org/en-US/docs/Mozilla/Performance/Adding_a_new_Telemetry_probe
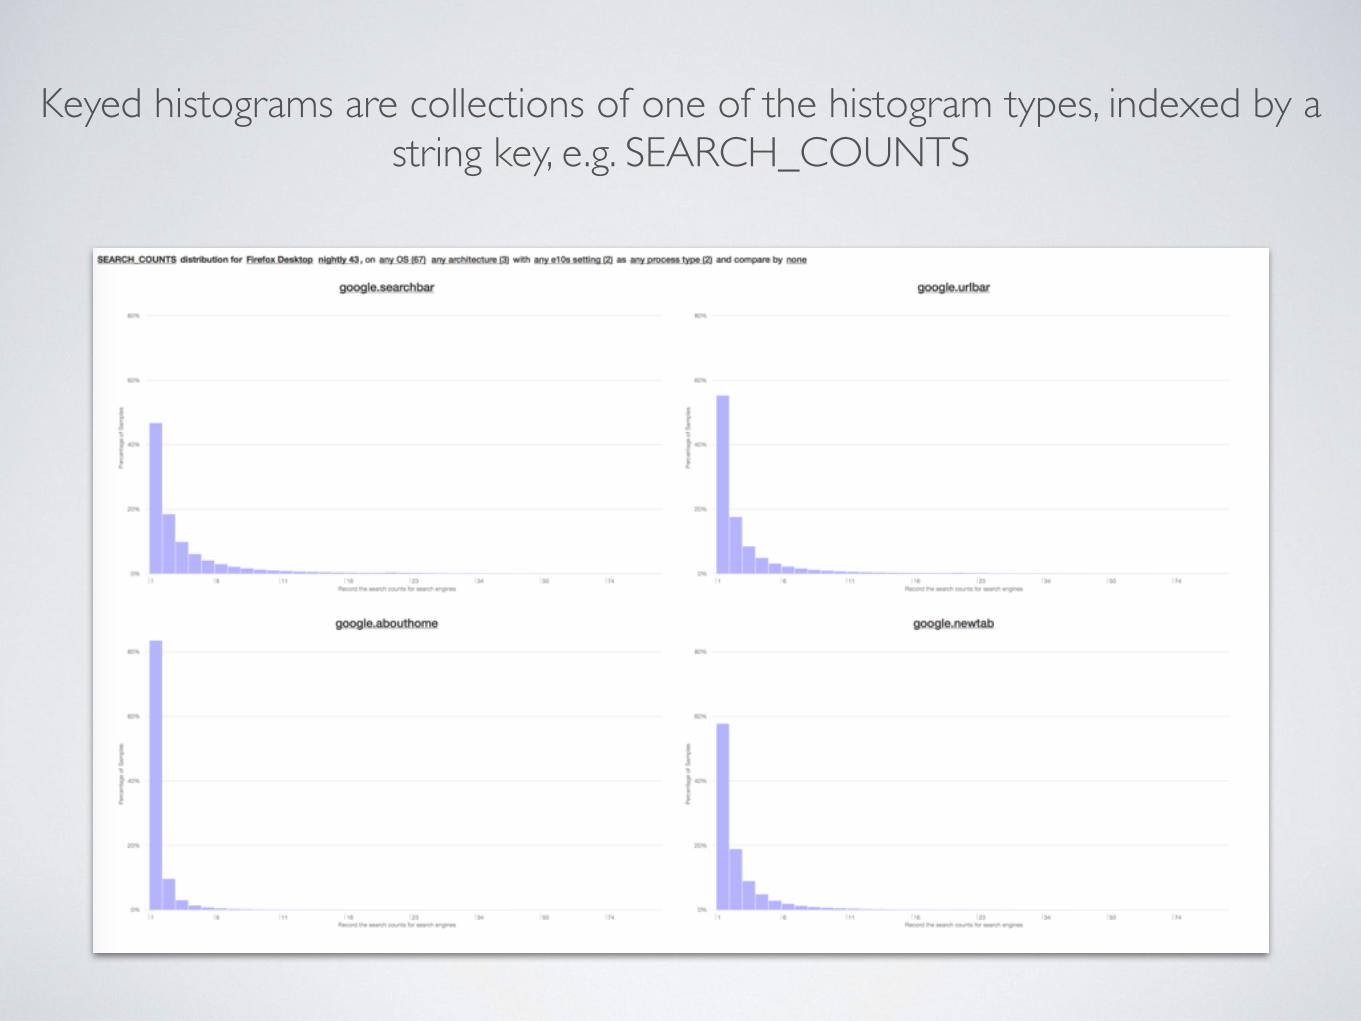
Keyed histograms are collections of one of the histogram types, indexed by a string key, e.g. SEARCH_COUNTS
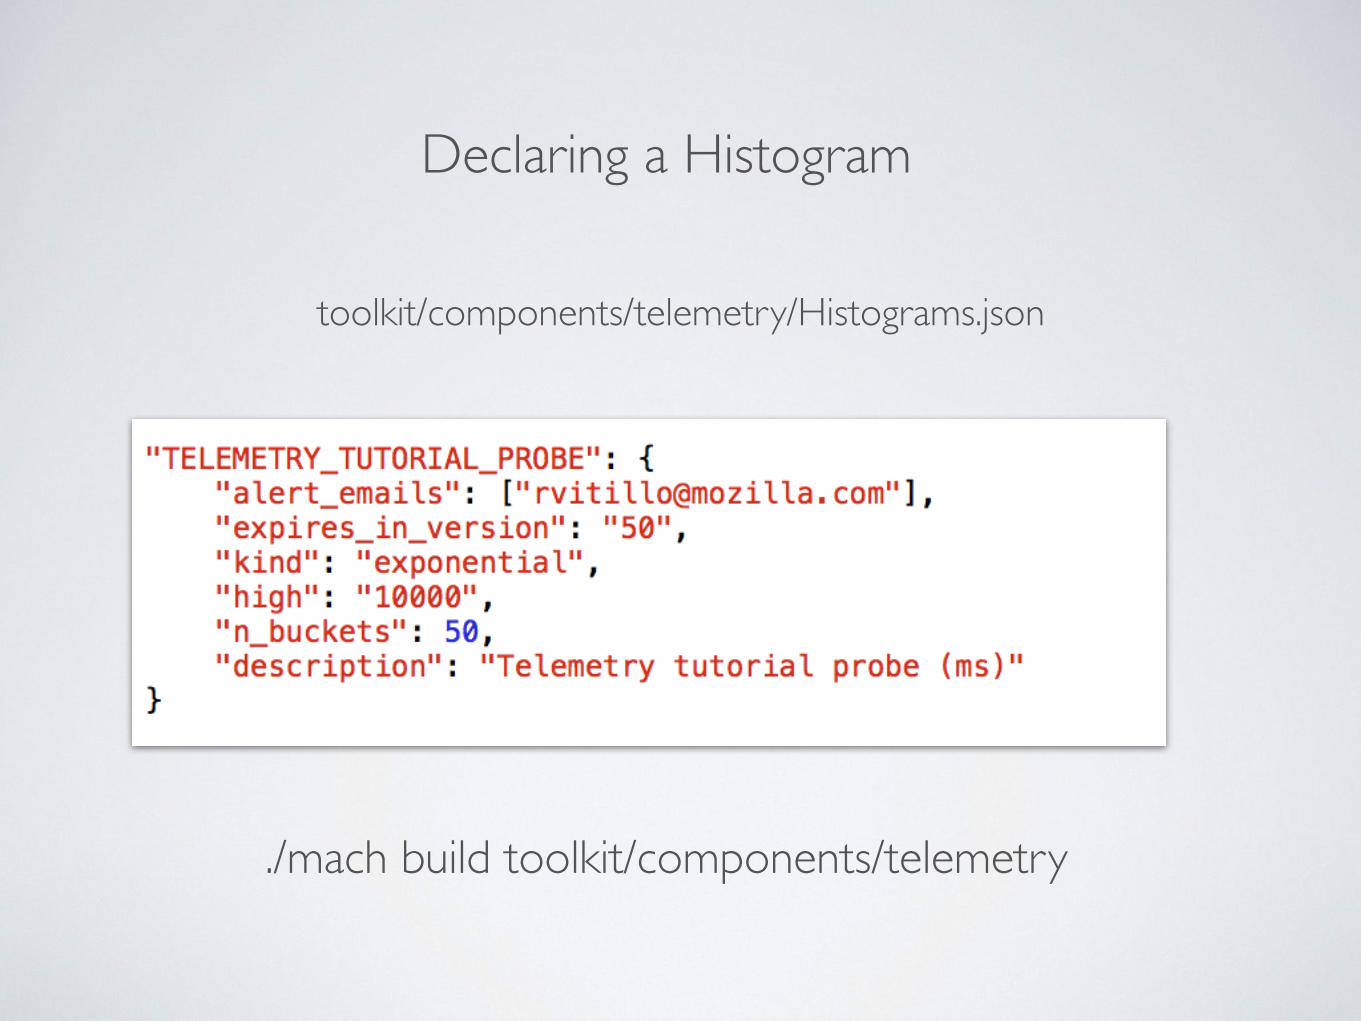
Declaring a Histogram
toolkit/components/telemetry/Histograms.json
./mach build toolkit/components/telemetry
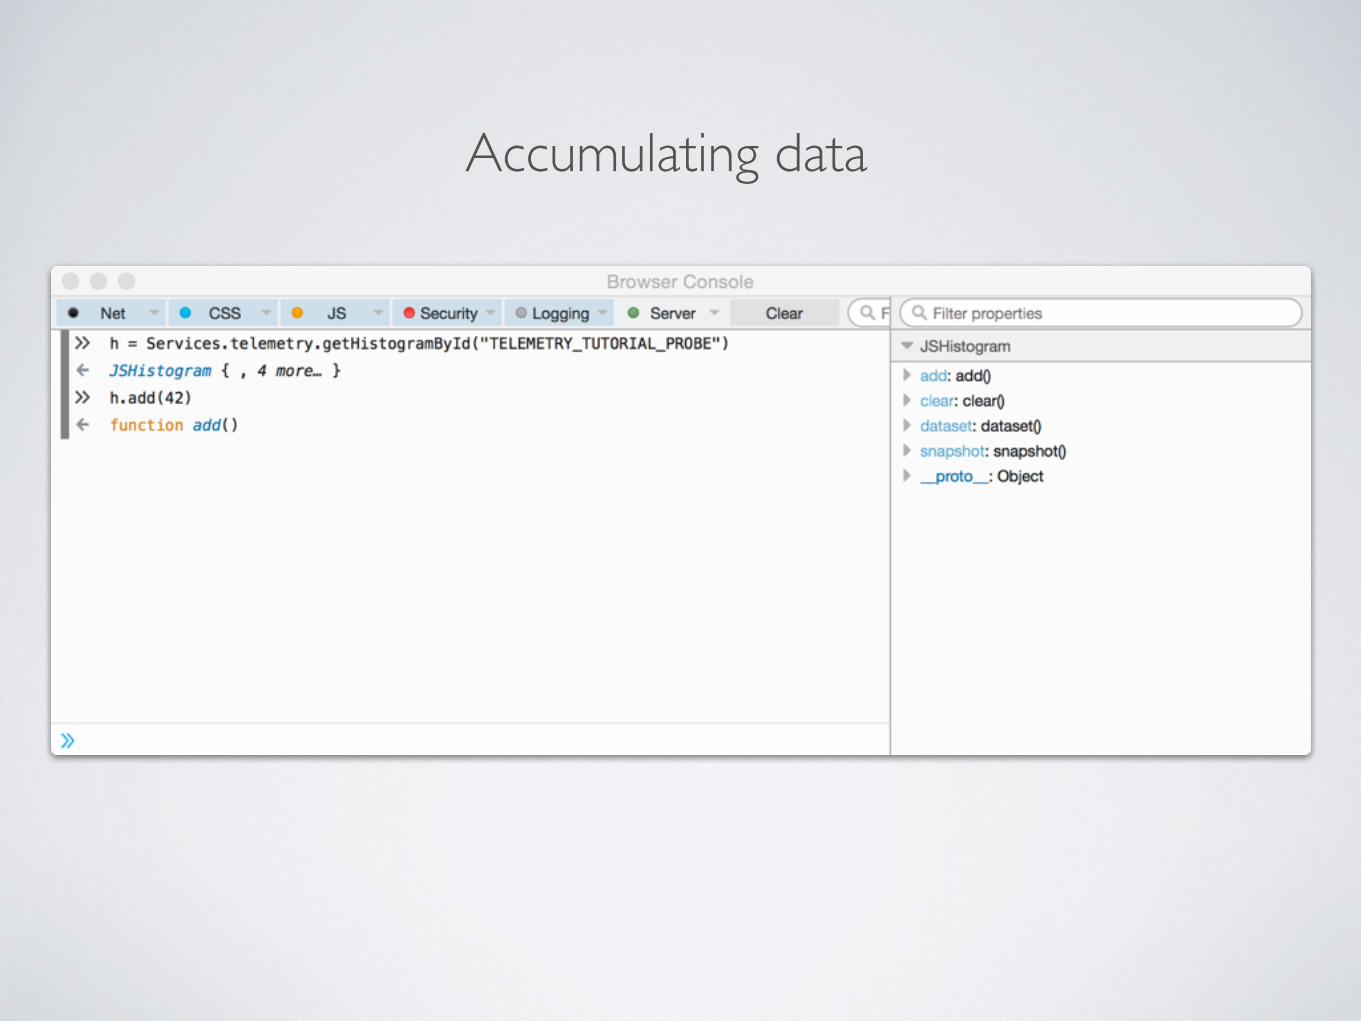
Accumulating data
REFERENCES
• https://developer.mozilla.org/en-US/docs/Mozilla/Performance/Adding_a_new_Telemetry_probe

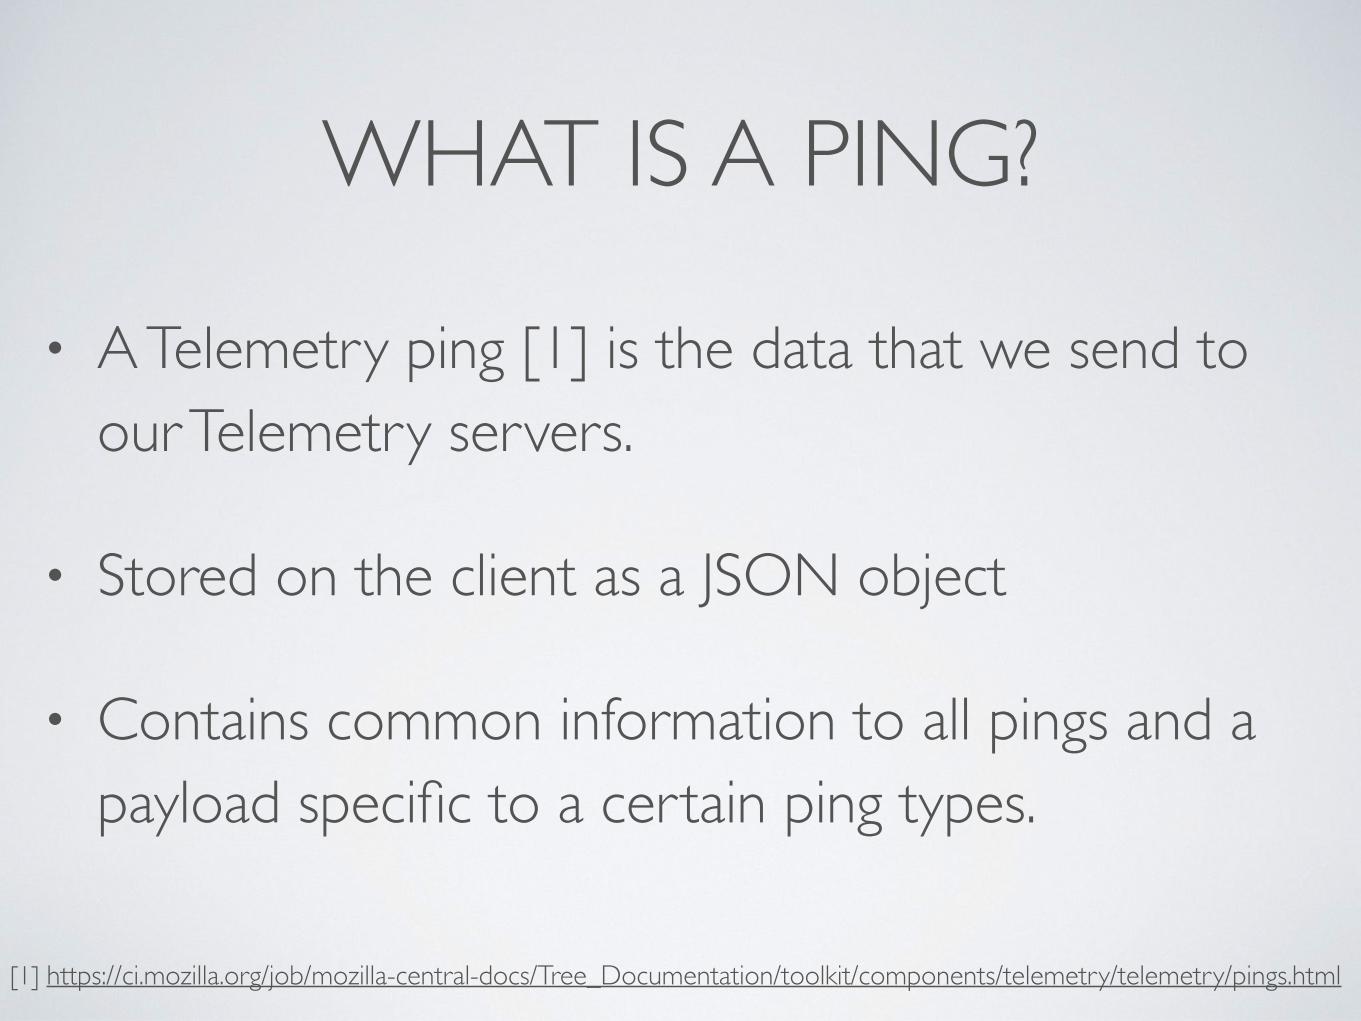
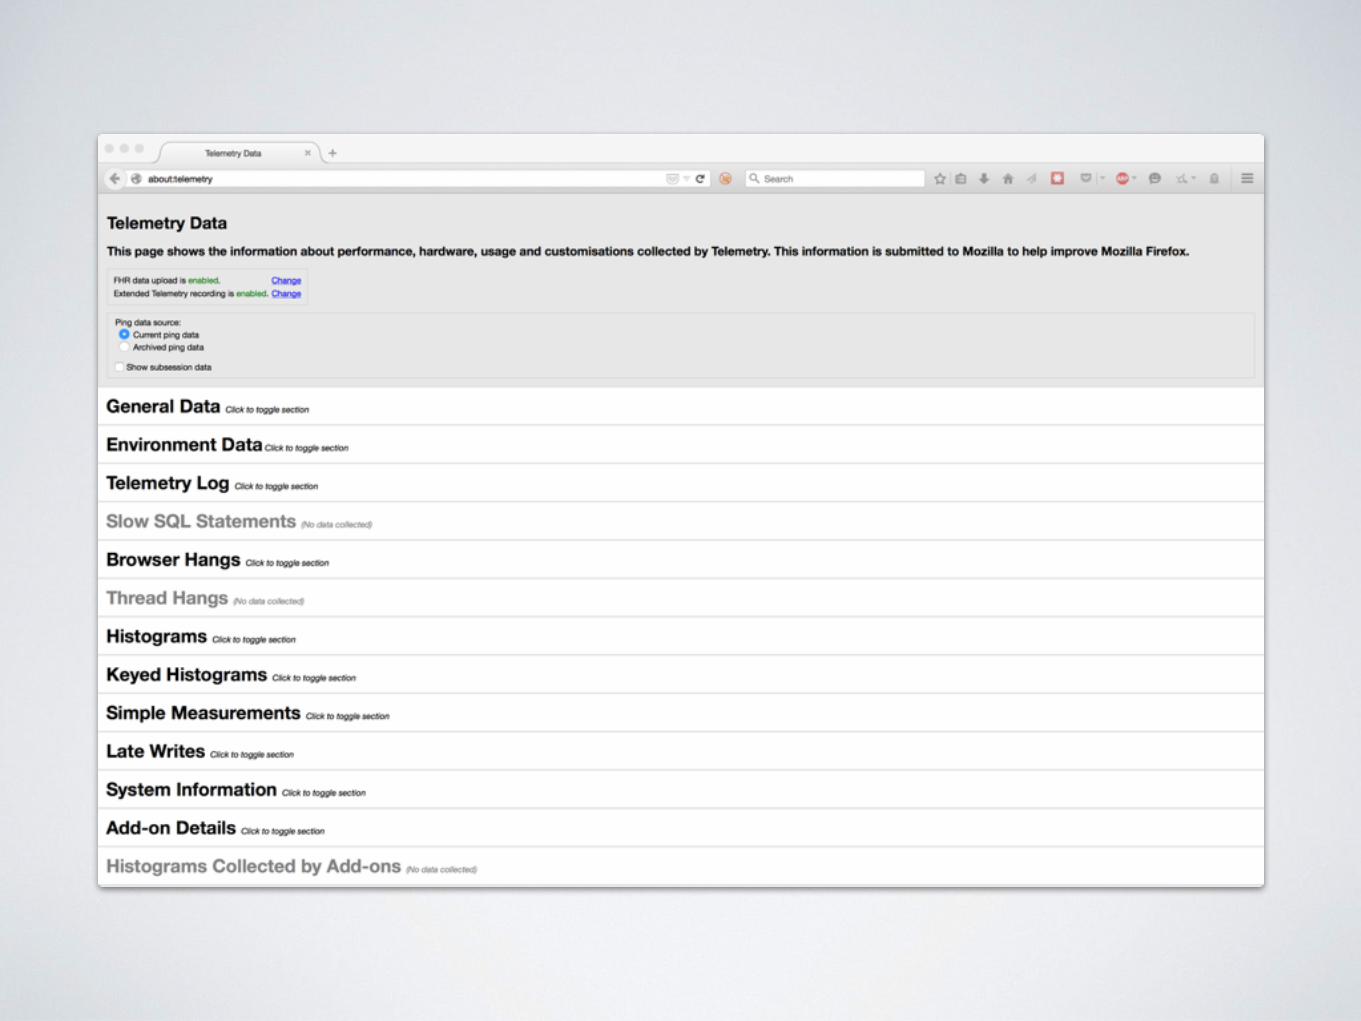
WHAT IS A PING?
• A Telemetry ping [1] is the data that we send to our Telemetry servers.
• Stored on the client as a JSON object
• Contains common information to all pings and a payload specific to a certain ping types.
[1] https://ci.mozilla.org/job/mozilla-central-docs/Tree_Documentation/toolkit/components/telemetry/telemetry/pings.html
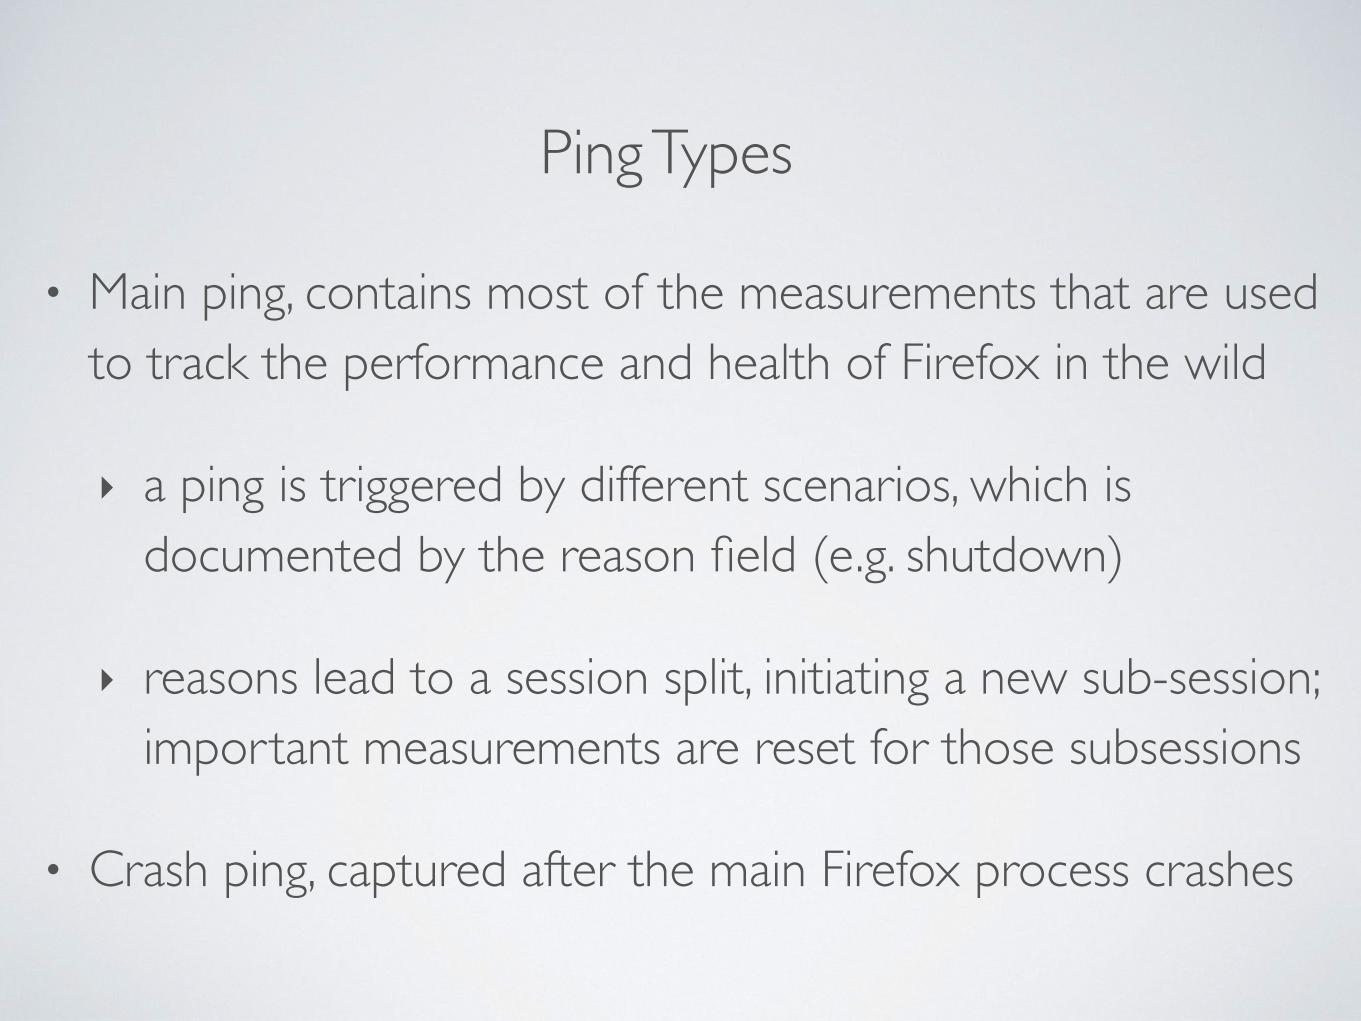
• Main ping, contains most of the measurements that are used to track the performance and health of Firefox in the wild
‣ a ping is triggered by different scenarios, which is documented by the reason field (e.g. shutdown)
‣ reasons lead to a session split, initiating a new sub-session; important measurements are reset for those subsessions
• Crash ping, captured after the main Firefox process crashes
Ping Types
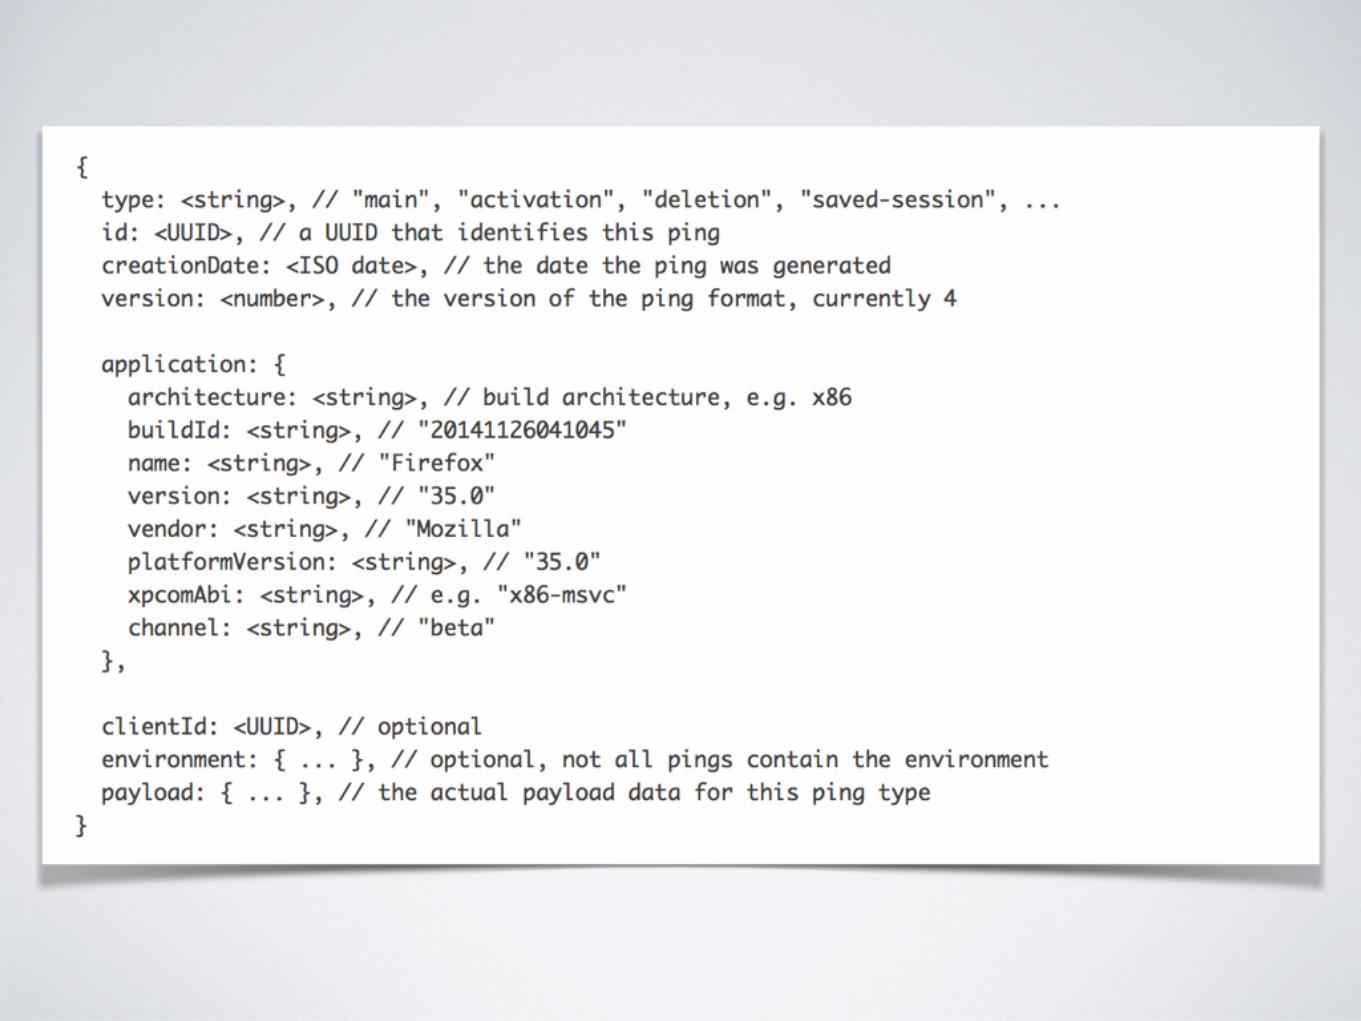
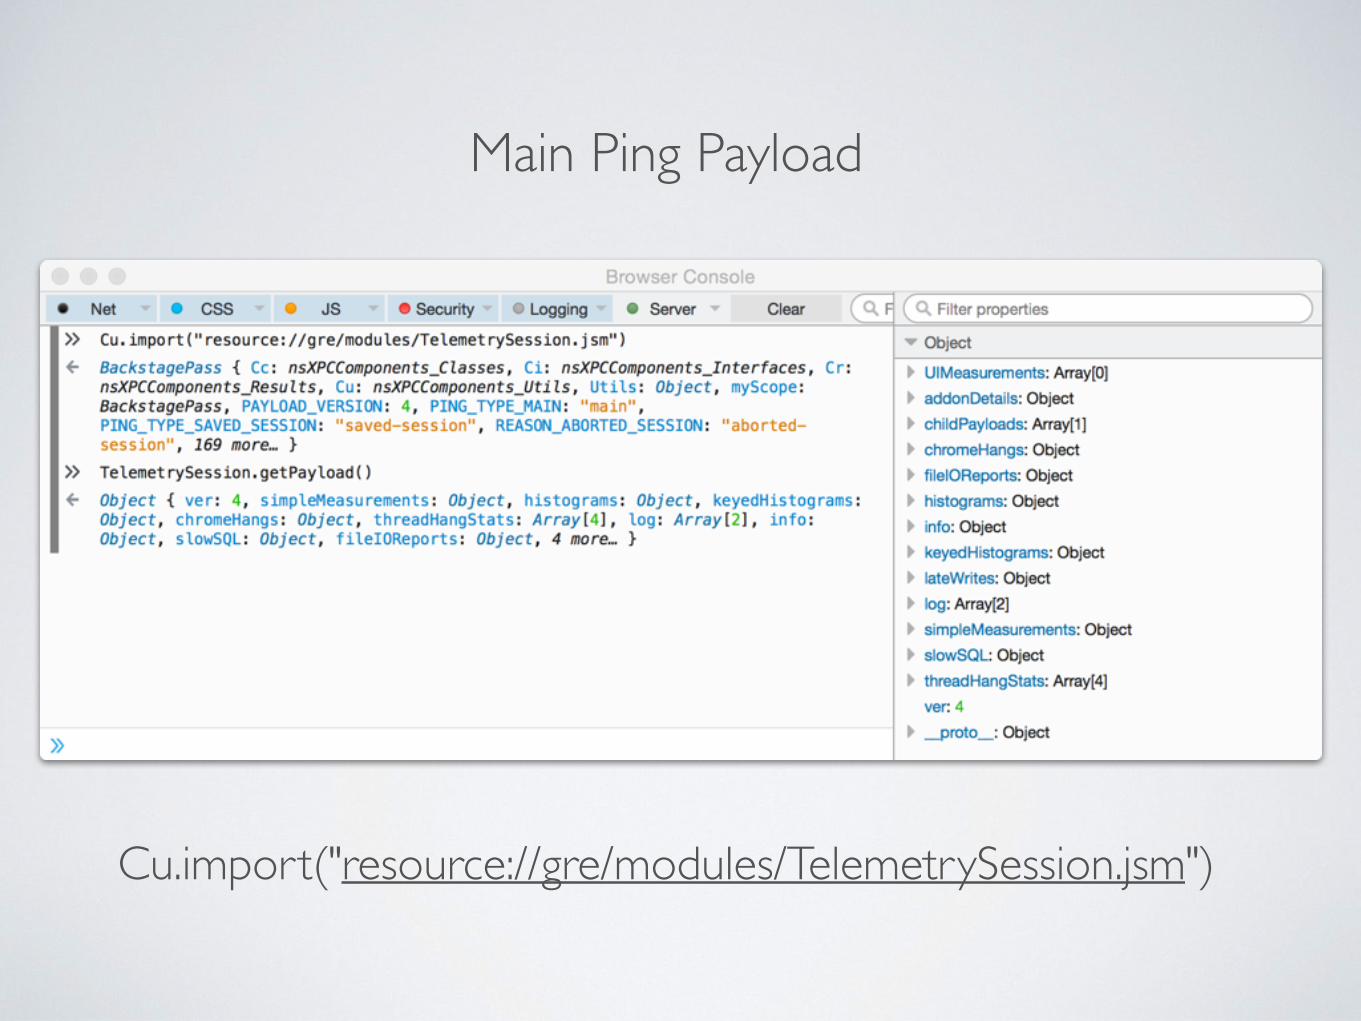
Main Ping Payload
Cu.import("resource://gre/modules/TelemetrySession.jsm")
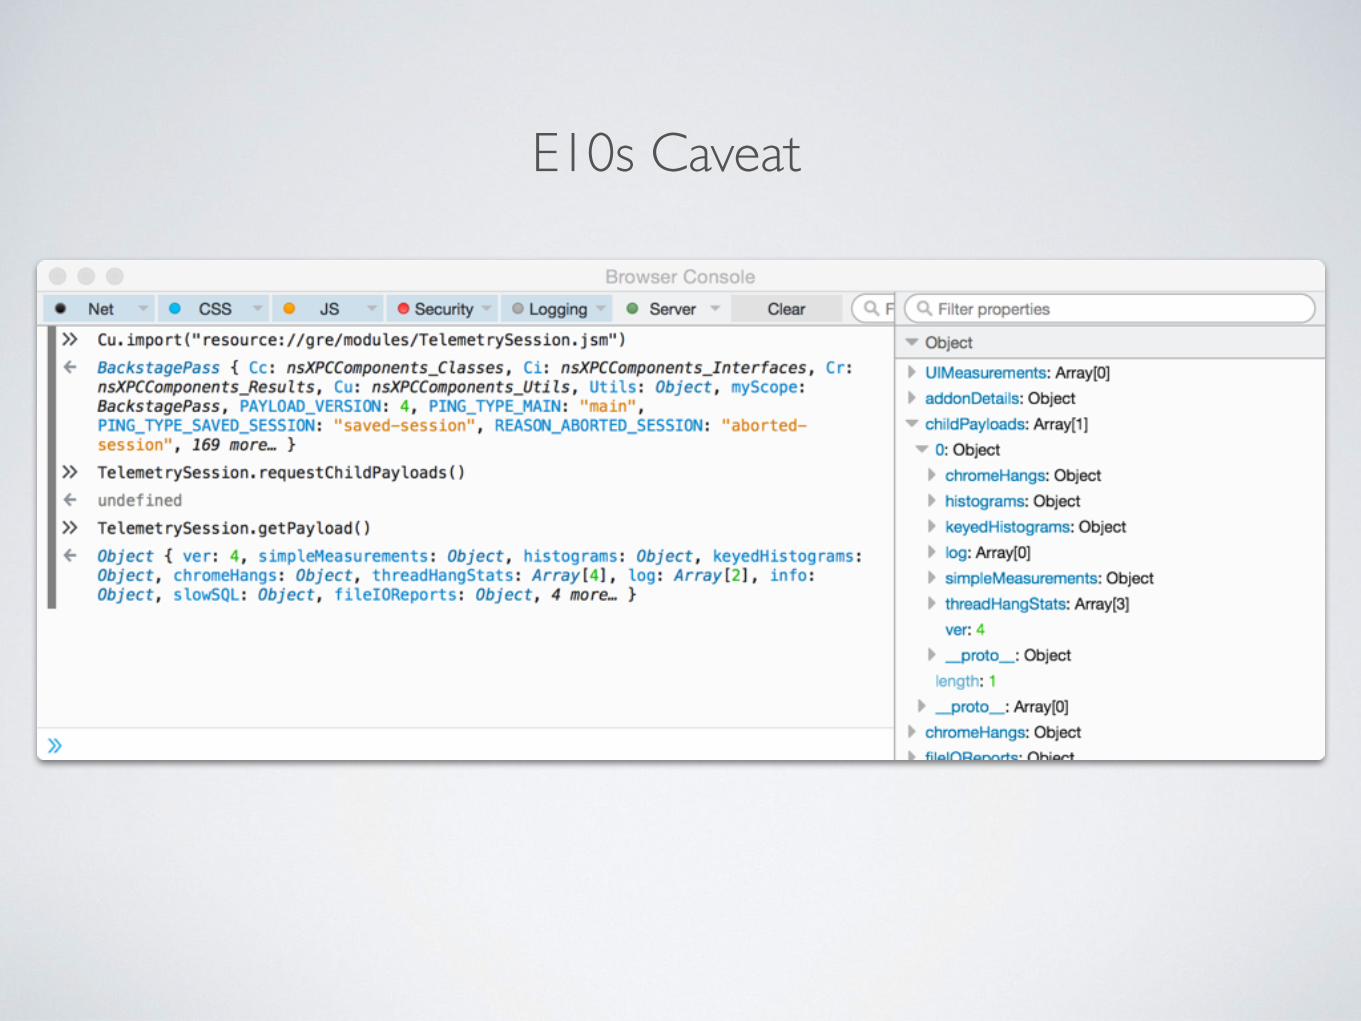
E10s Caveat
• Consists of data that is expected to be characteristic for performance and other behaviour and not expected to change too often (e.g. number of CPU cores)
• Changes to most of these data points are detected and lead to a session split in the “main” ping
Environment
REFERENCES
• https://ci.mozilla.org/job/mozilla-central-docs/Tree_Documentation/toolkit/components/telemetry/telemetry/pings.html

DATA PIPELINE• The data pipeline ingests, transforms, stores and analyzes data
• The endpoint is an HTTP server that:
‣ listens for POST/PUT from Firefox
‣ does some decoding / preprocessing
‣ makes the data available for streaming analyses (Heka)
‣ archives the data to S3 for further offline analyses (Spark)
[1] https://wiki.mozilla.org/CloudServices/DataPipeline
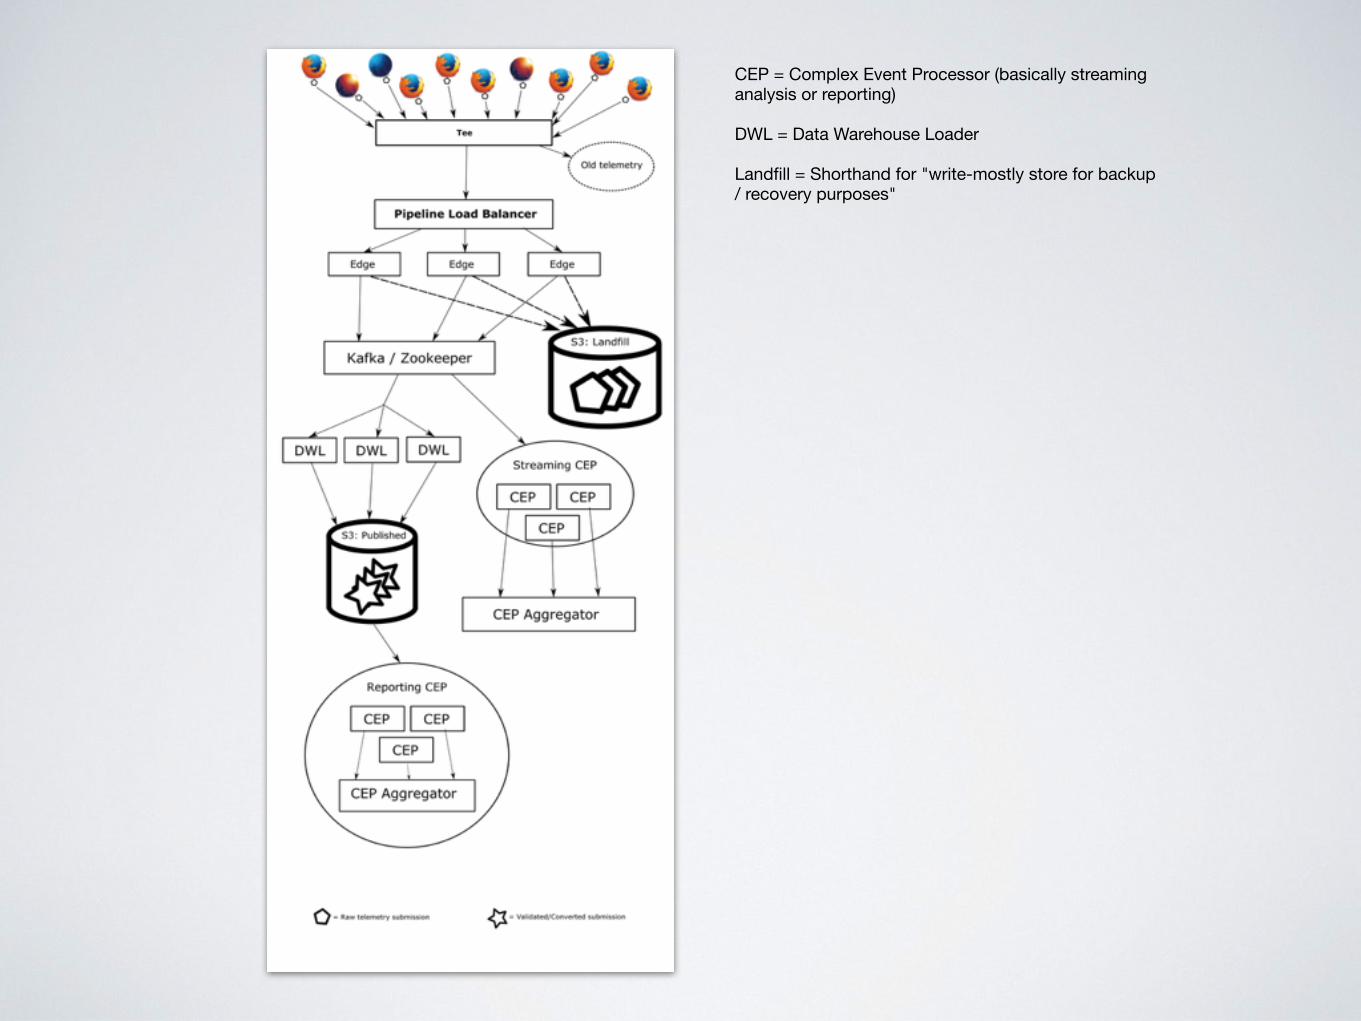
CEP = Complex Event Processor (basically streaming analysis or reporting)
DWL = Data Warehouse Loader
Landfill = Shorthand for "write-mostly store for backup / recovery purposes"
REFERENCES
• https://wiki.mozilla.org/CloudServices/DataPipeline
• https://github.com/mozilla-services/data-pipeline
• https://github.com/mozilla-services/heka
• https://github.com/apache/spark/


OFFLINE PROCESSINGIPYTHON, PANDAS & SPARK
https://github.com/vitillo/telemetry-onboarding/tree/master/notebooks

EXPERIMENTS• Telemetry Experiments is a feature that allows Firefox to automatically
download and run specially-designed restartless addons based on certain conditions
• Currently only available in desktop versions of Firefox
• Experiments can be targeted at various populations by specifying conditions in an experiment manifest
• Before building an experiment, contact a data-collection peer; additional privacy or security review might be required
• Product approval is required to run an experiment
[1] https://wiki.mozilla.org/Telemetry/Experiments
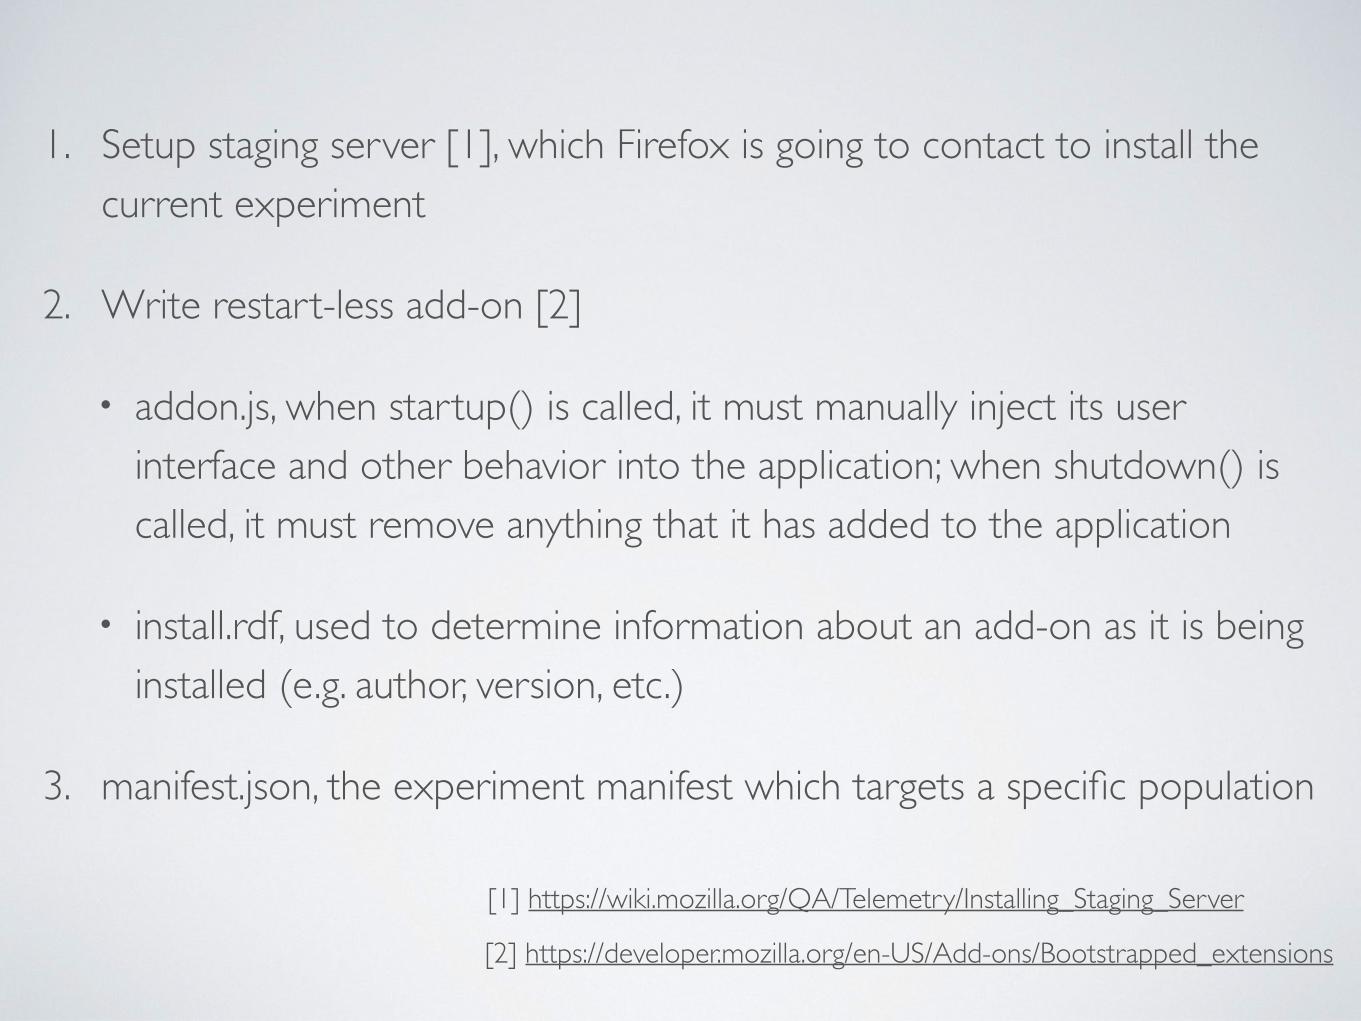
1. Setup staging server [1], which Firefox is going to contact to install the current experiment
2. Write restart-less add-on [2]
• addon.js, when startup() is called, it must manually inject its user interface and other behavior into the application; when shutdown() is called, it must remove anything that it has added to the application
• install.rdf, used to determine information about an add-on as it is being installed (e.g. author, version, etc.)
3. manifest.json, the experiment manifest which targets a specific population
[1] https://wiki.mozilla.org/QA/Telemetry/Installing_Staging_Server
[2] https://developer.mozilla.org/en-US/Add-ons/Bootstrapped_extensions
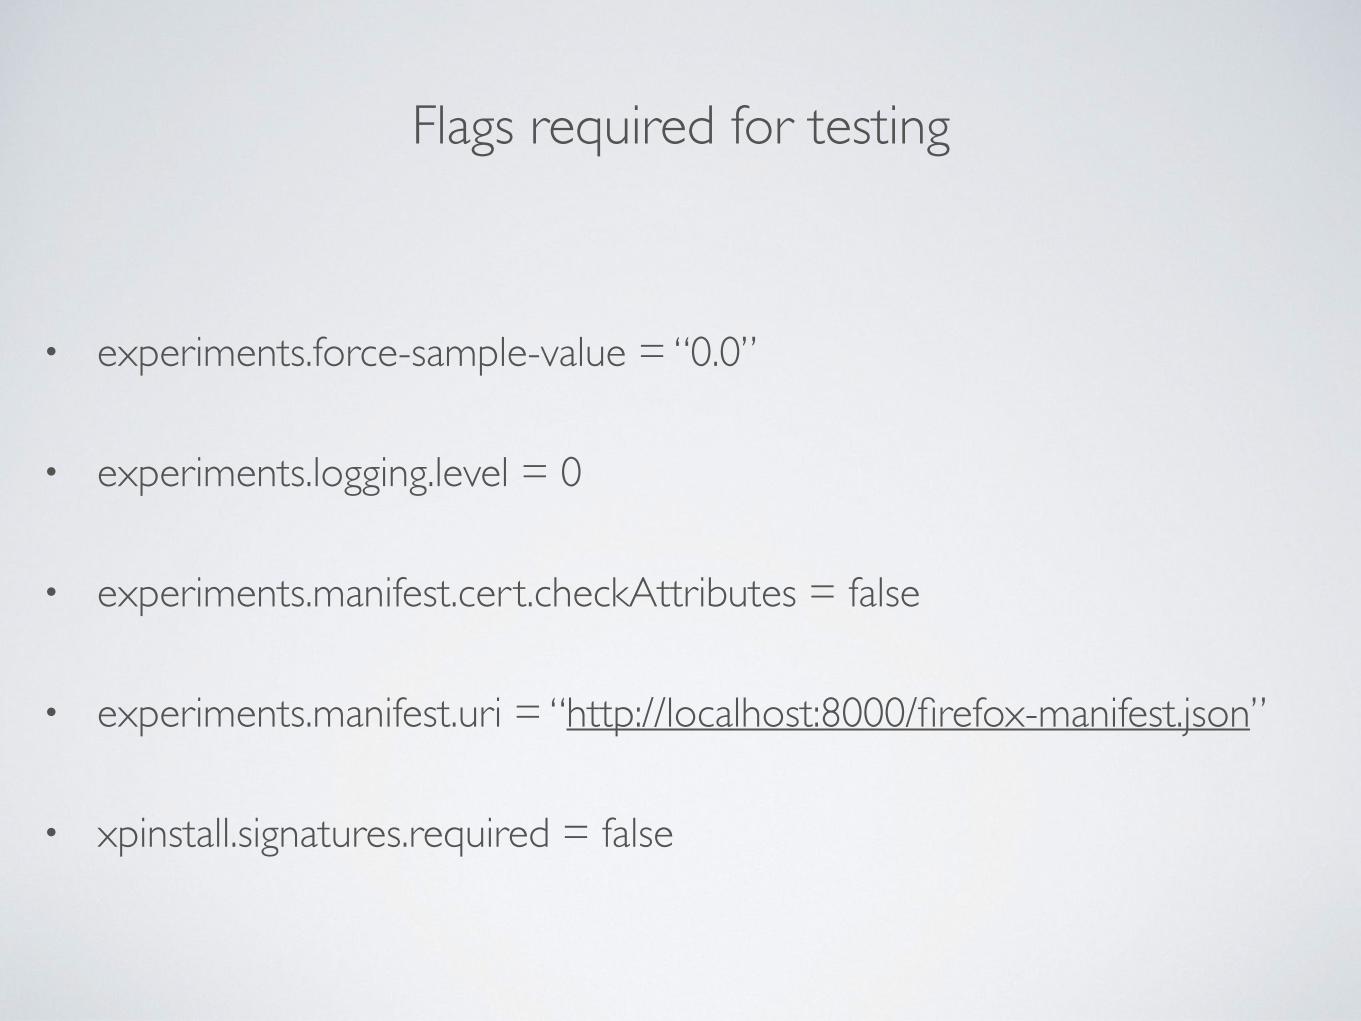
Flags required for testing
• experiments.force-sample-value = “0.0”
• experiments.logging.level = 0
• experiments.manifest.cert.checkAttributes = false
• experiments.manifest.uri = “http://localhost:8000/firefox-manifest.json”
• xpinstall.signatures.required = false
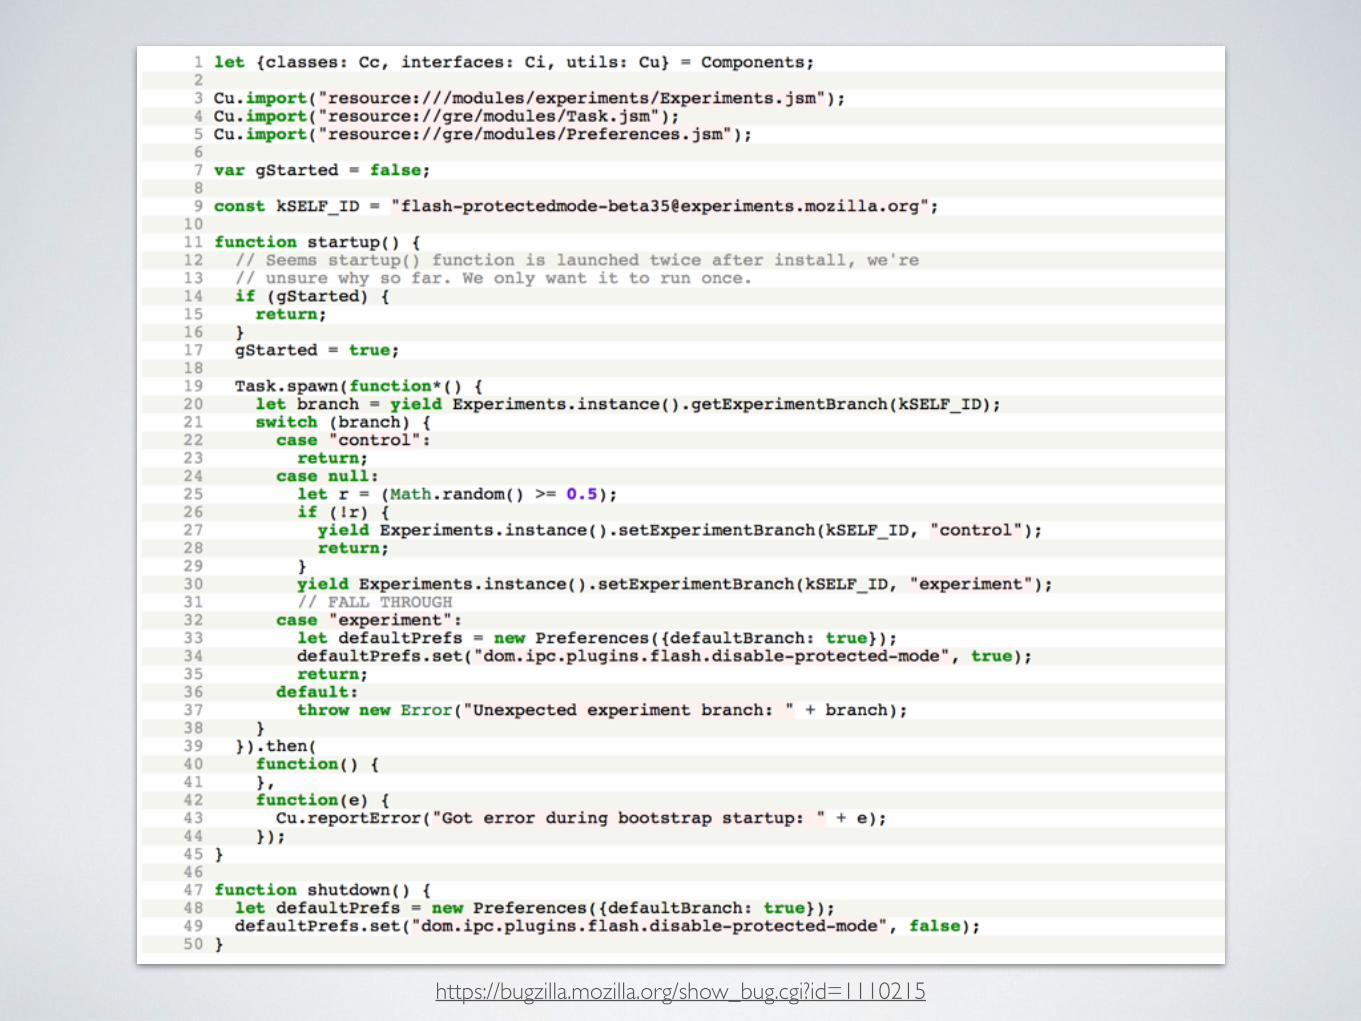
https://bugzilla.mozilla.org/show_bug.cgi?id=1110215
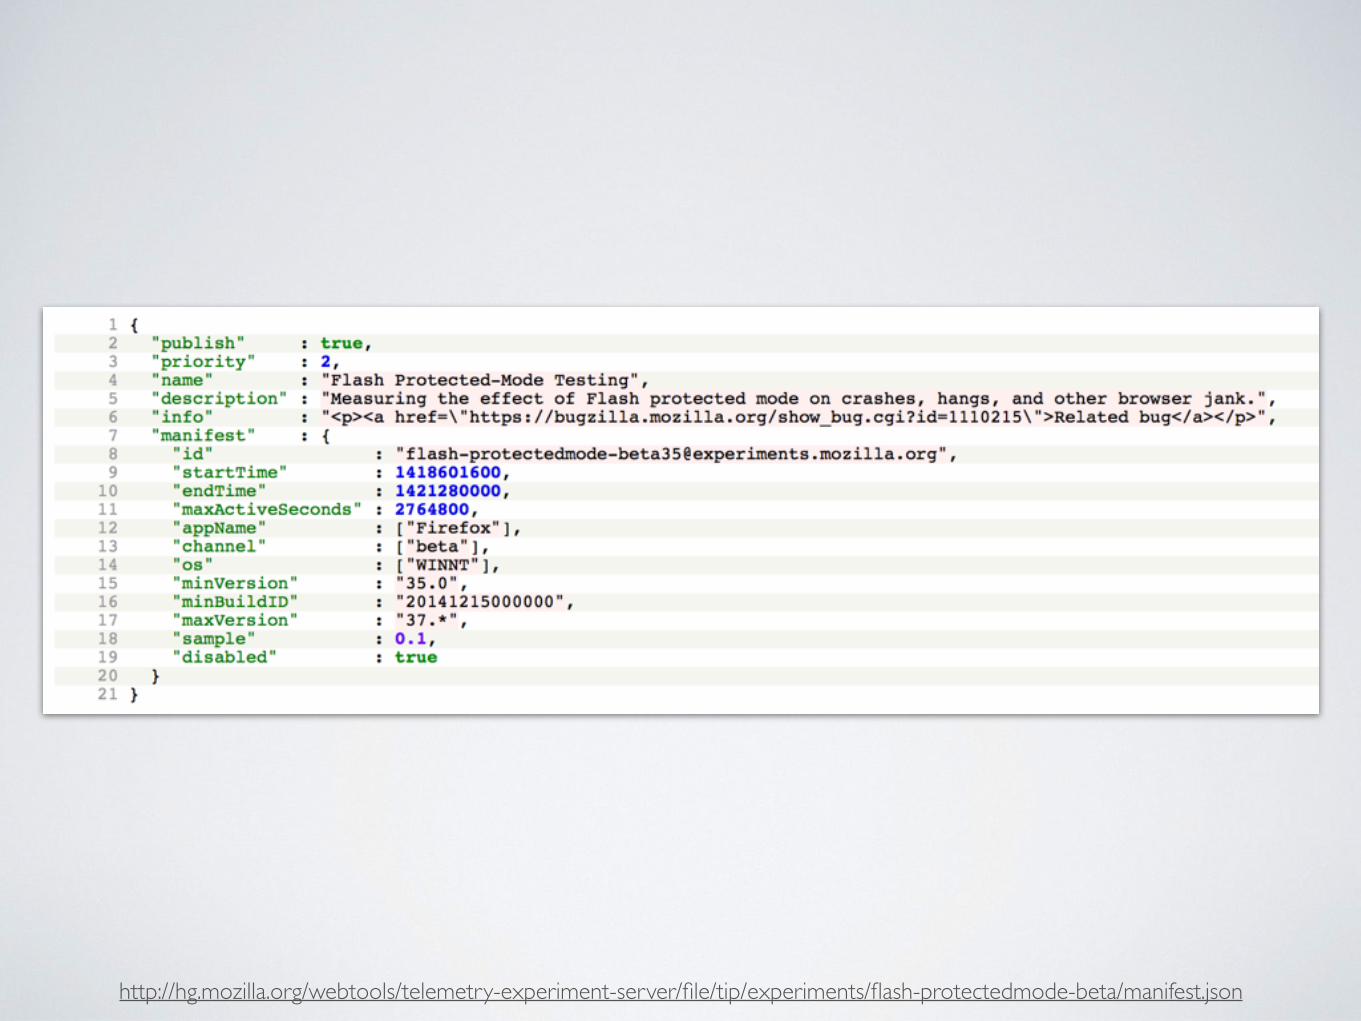
http://hg.mozilla.org/webtools/telemetry-experiment-server/file/tip/experiments/flash-protectedmode-beta/manifest.json
Bug 1111791 - Telemetry report: effect of the Flash protected-mode experiment
https://bugzilla.mozilla.org/show_bug.cgi?id=1111791
REFERENCES• https://wiki.mozilla.org/Telemetry/Experiments
• https://developer.mozilla.org/en-US/Add-ons/Bootstrapped_extensions
• https://wiki.mozilla.org/QA/Telemetry#Telemetry_Experiments.2FFHR_Documentation
• http://codefirefox.com/video/install-telmetry-experiment
• http://hg.mozilla.org/webtools/telemetry-experiment-server/file/tip/experiments
• https://bugzilla.mozilla.org/show_bug.cgi?id=1110215
• https://bugzilla.mozilla.org/show_bug.cgi?id=1111791


STATS
USE REPRESENTATIVE SAMPLES
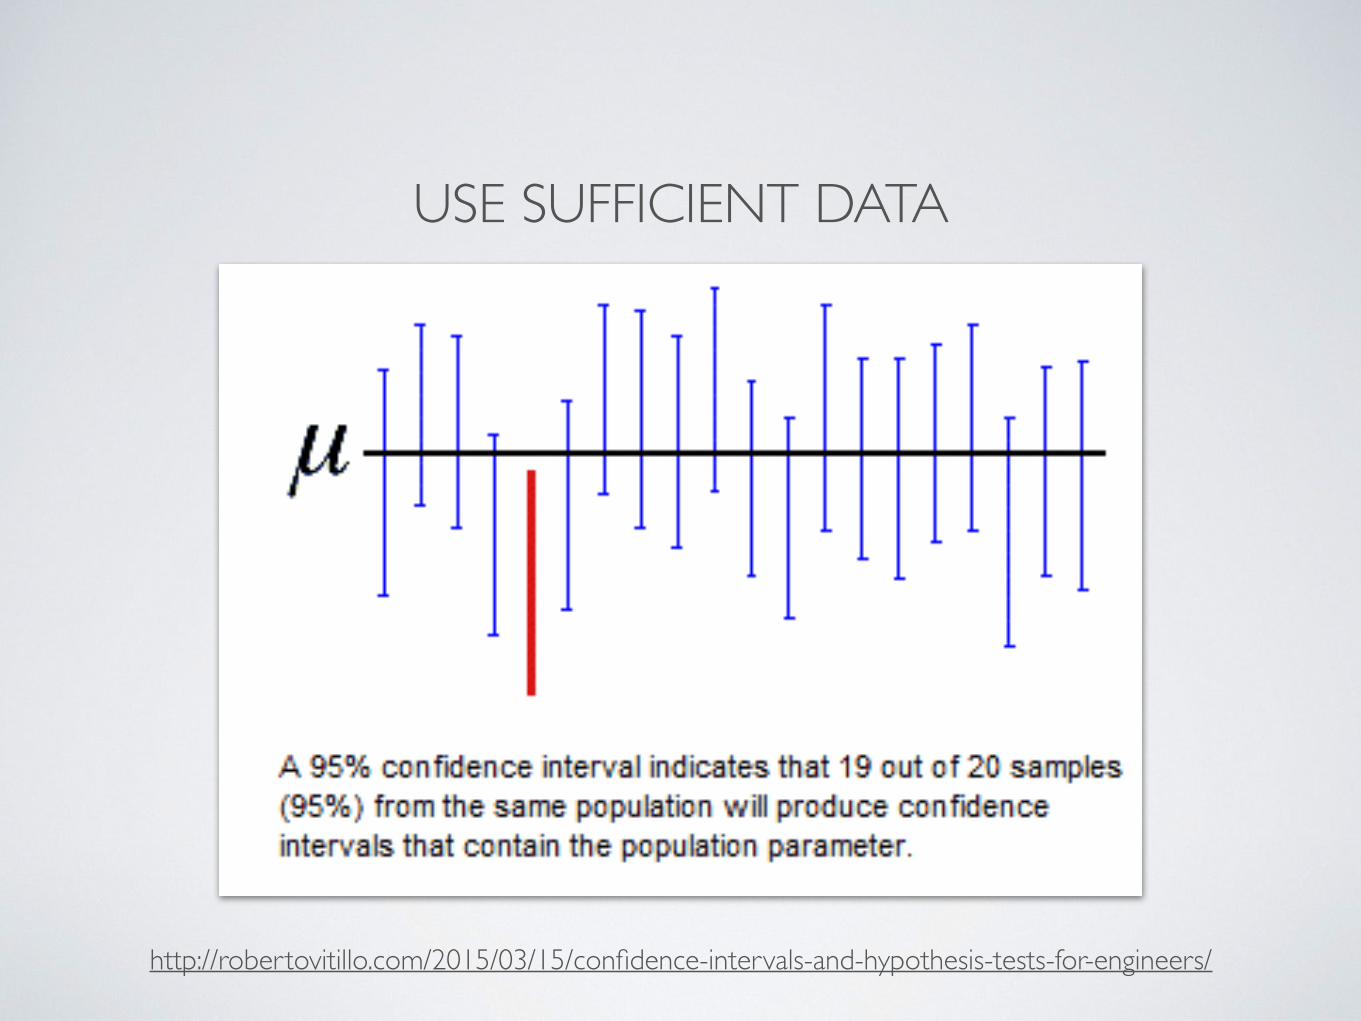
USE SUFFICIENT DATA
http://robertovitillo.com/2015/03/15/confidence-intervals-and-hypothesis-tests-for-engineers/
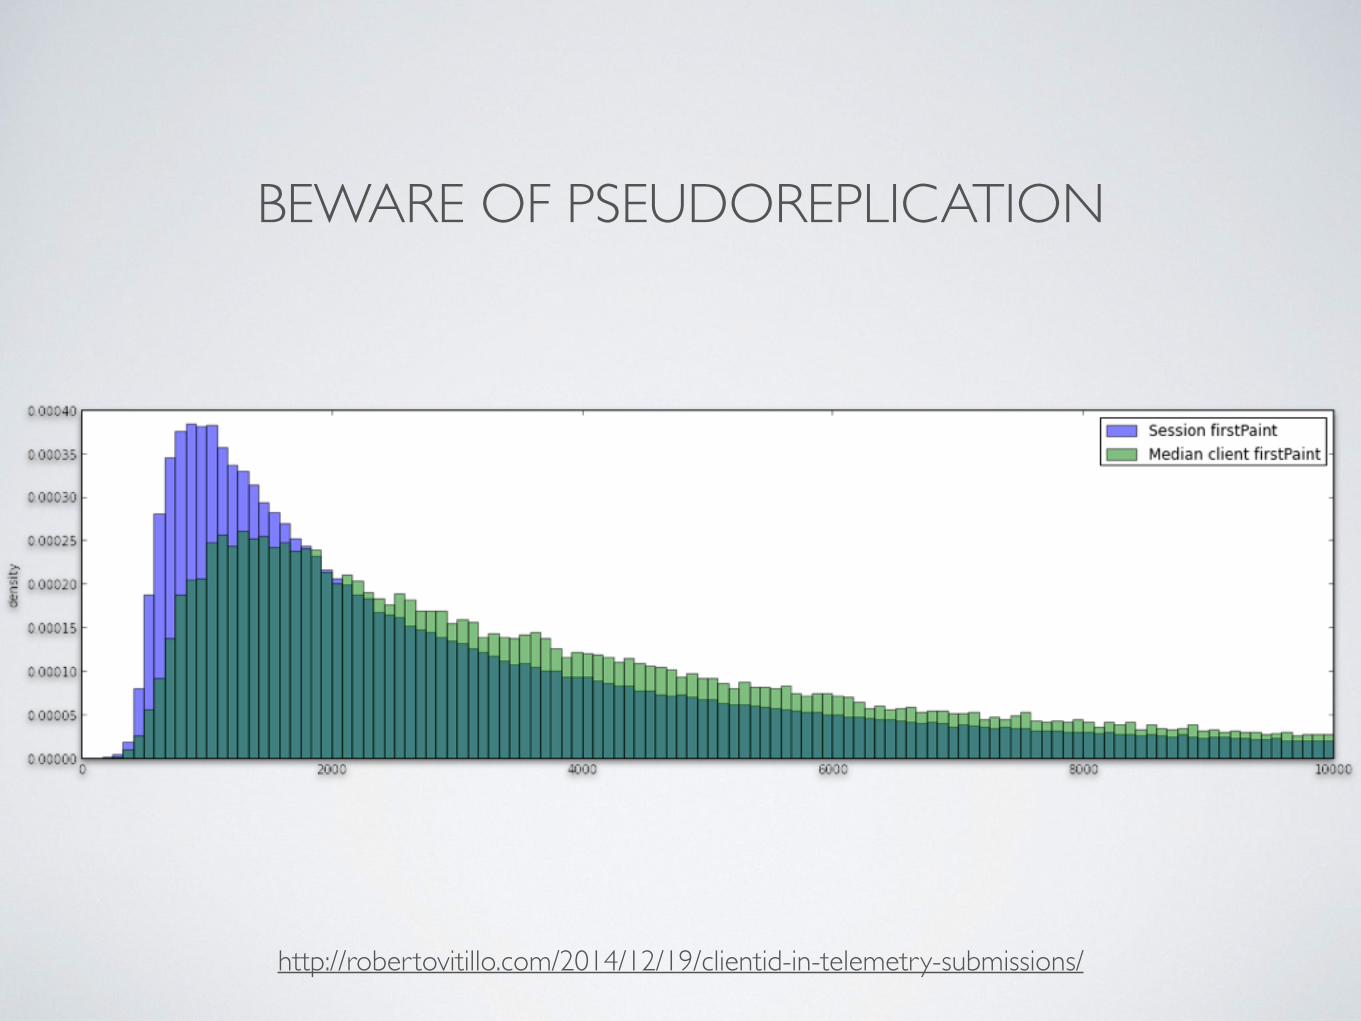
BEWARE OF PSEUDOREPLICATION
http://robertovitillo.com/2014/12/19/clientid-in-telemetry-submissions/
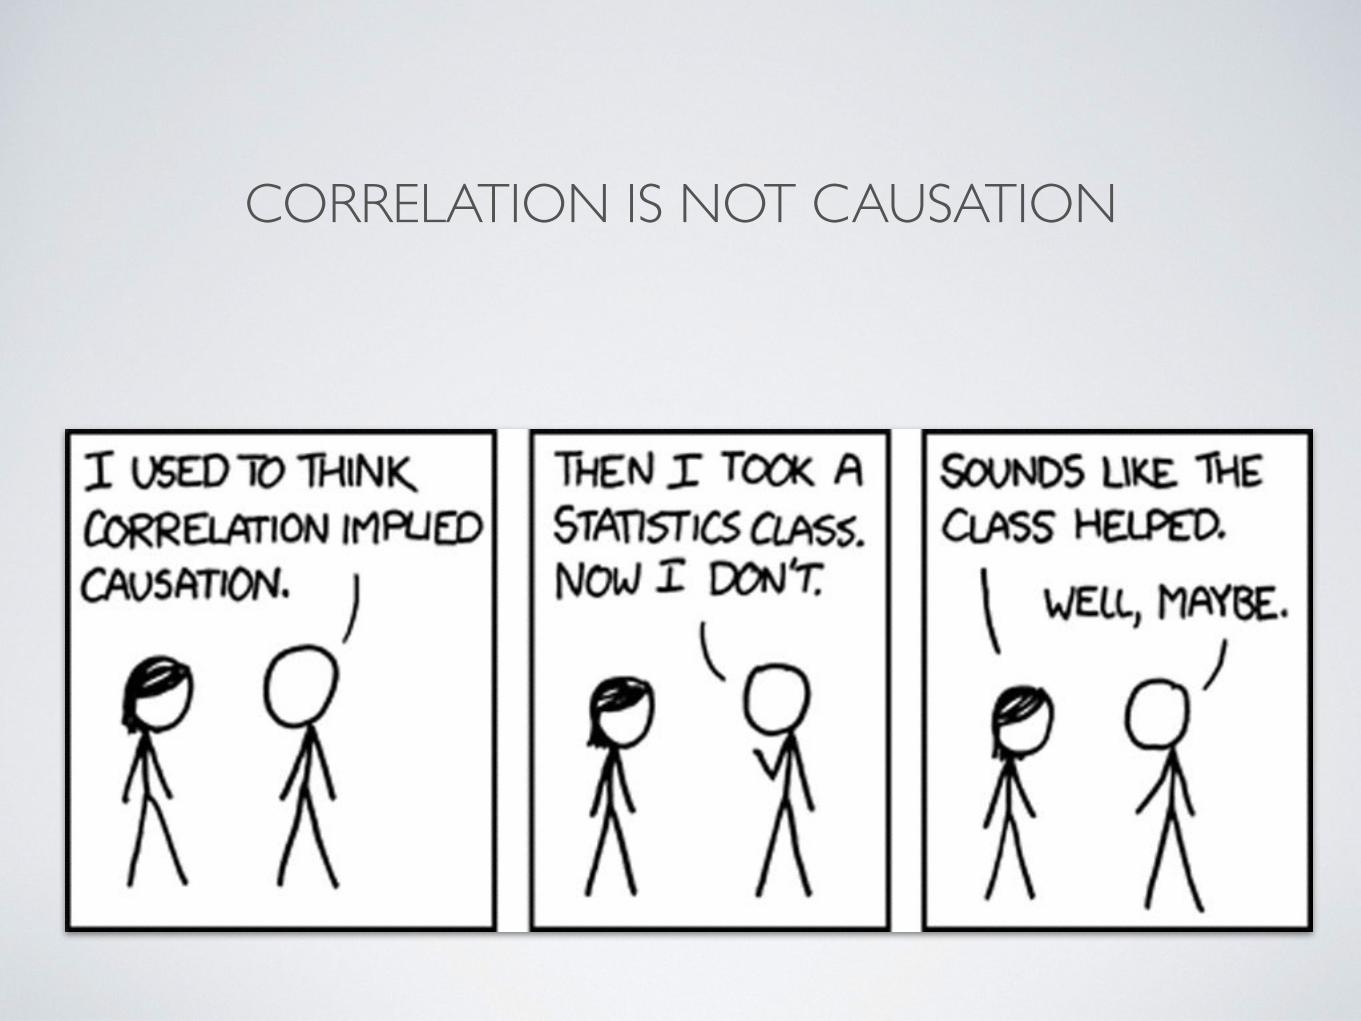
CORRELATION IS NOT CAUSATION

• Mean: add up the values, and divide by the number of values
• Median: the median is the 50th percentile; half the values are higher than the median, and half are lower
• Geometric mean: compute the logarithm of all values, compute the mean of the logarithms, and then take the antilog
• It is a better measure of central tendency when data follow a lognormal distribution (long tail).
USE THE RIGHT AVERAGE

CONTROL THE FALSE DISCOVERY RATE
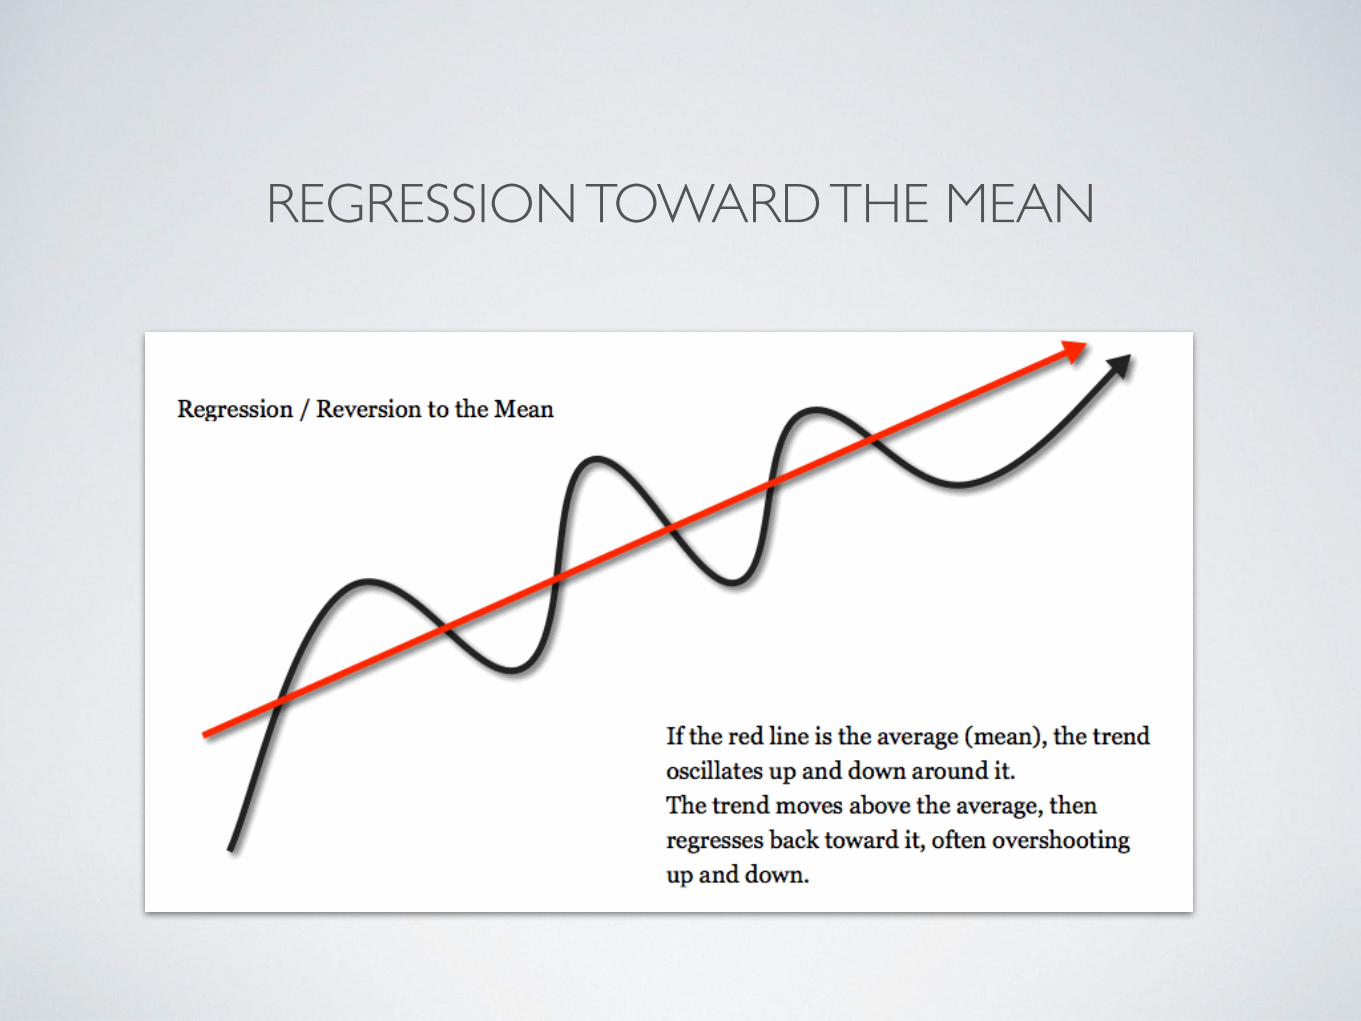
REGRESSION TOWARD THE MEAN
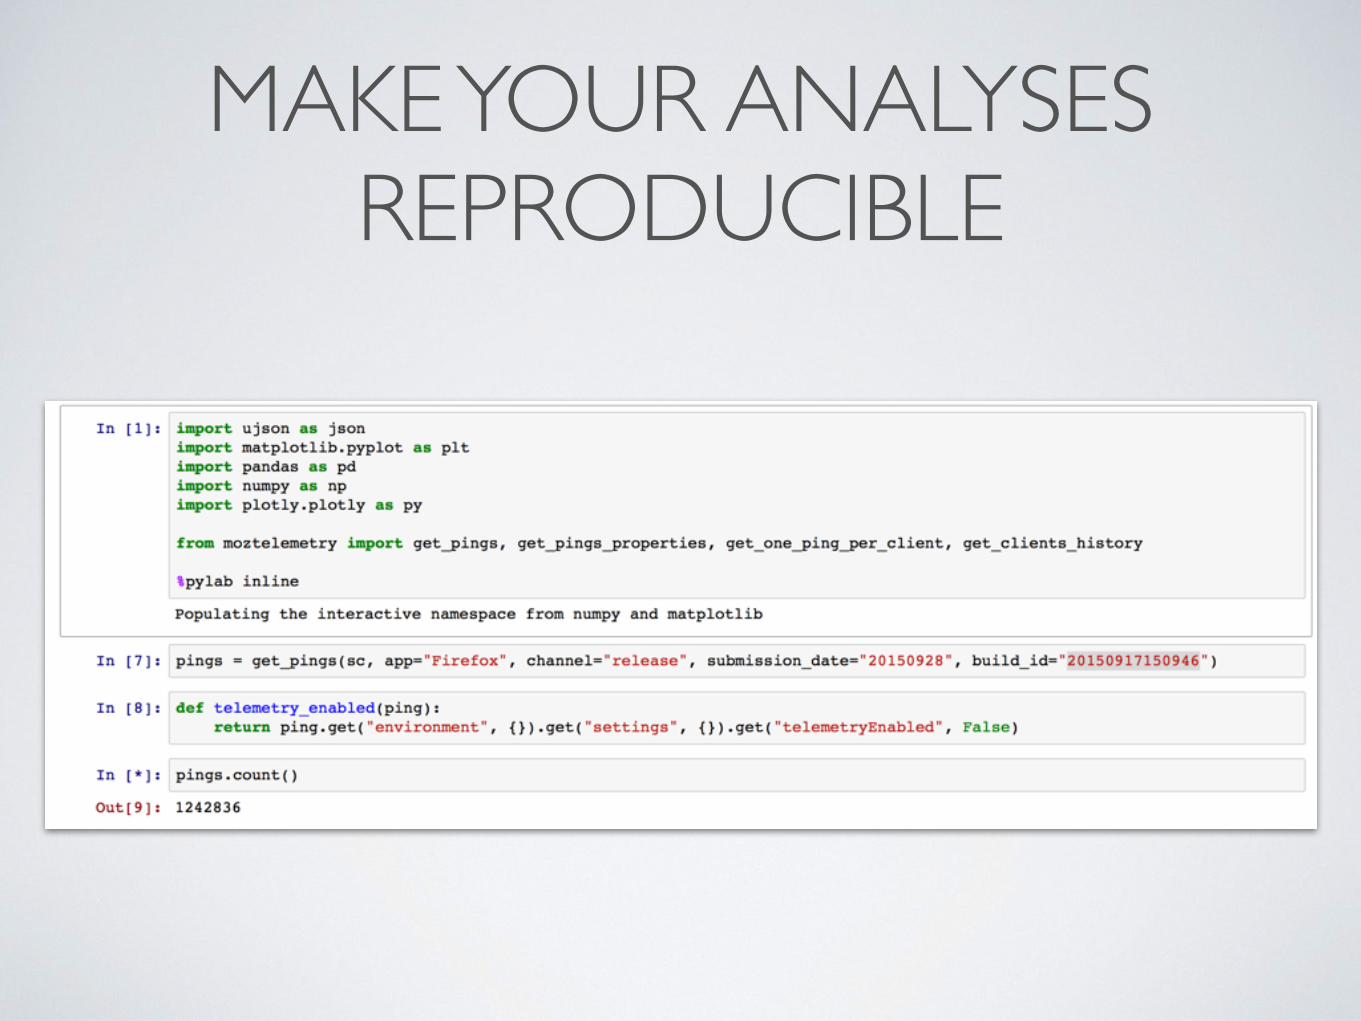
MAKE YOUR ANALYSES REPRODUCIBLE
REFERENCES
• http://www.statisticsdonewrong.com/data-analysis.html
• http://www.amazon.com/How-Lie-Statistics-Darrell-Huff/dp/0393310728
• http://www.slideshare.net/RobertoAgostinoVitil/all-you-need-to-know-about-statistics

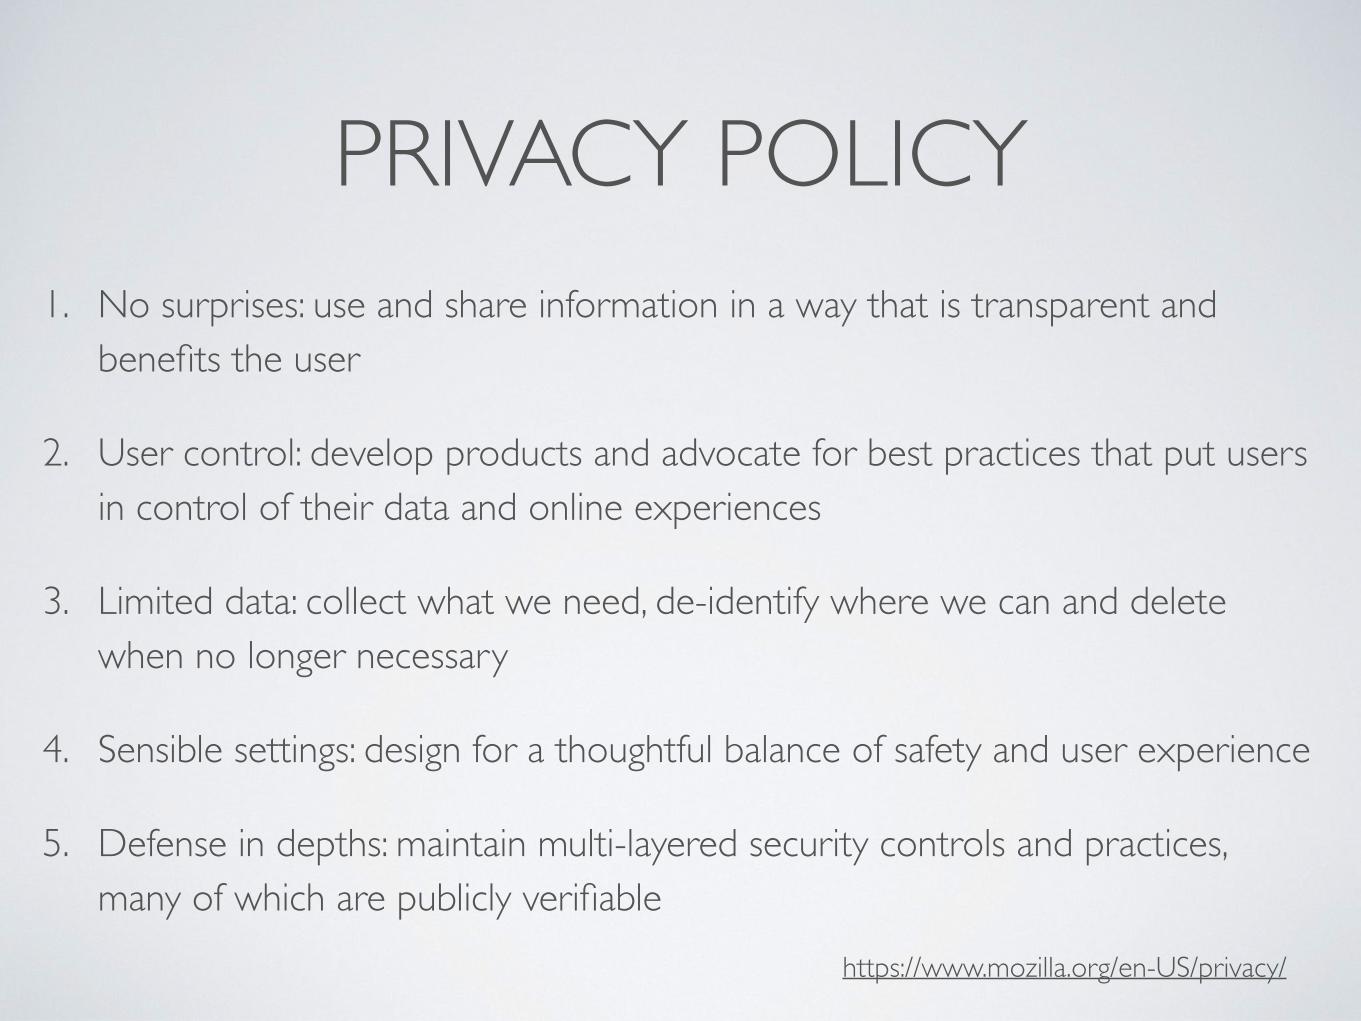
PRIVACY POLICY1. No surprises: use and share information in a way that is transparent and
benefits the user
2. User control: develop products and advocate for best practices that put users in control of their data and online experiences
3. Limited data: collect what we need, de-identify where we can and delete when no longer necessary
4. Sensible settings: design for a thoughtful balance of safety and user experience
5. Defense in depths: maintain multi-layered security controls and practices, many of which are publicly verifiable
https://www.mozilla.org/en-US/privacy/

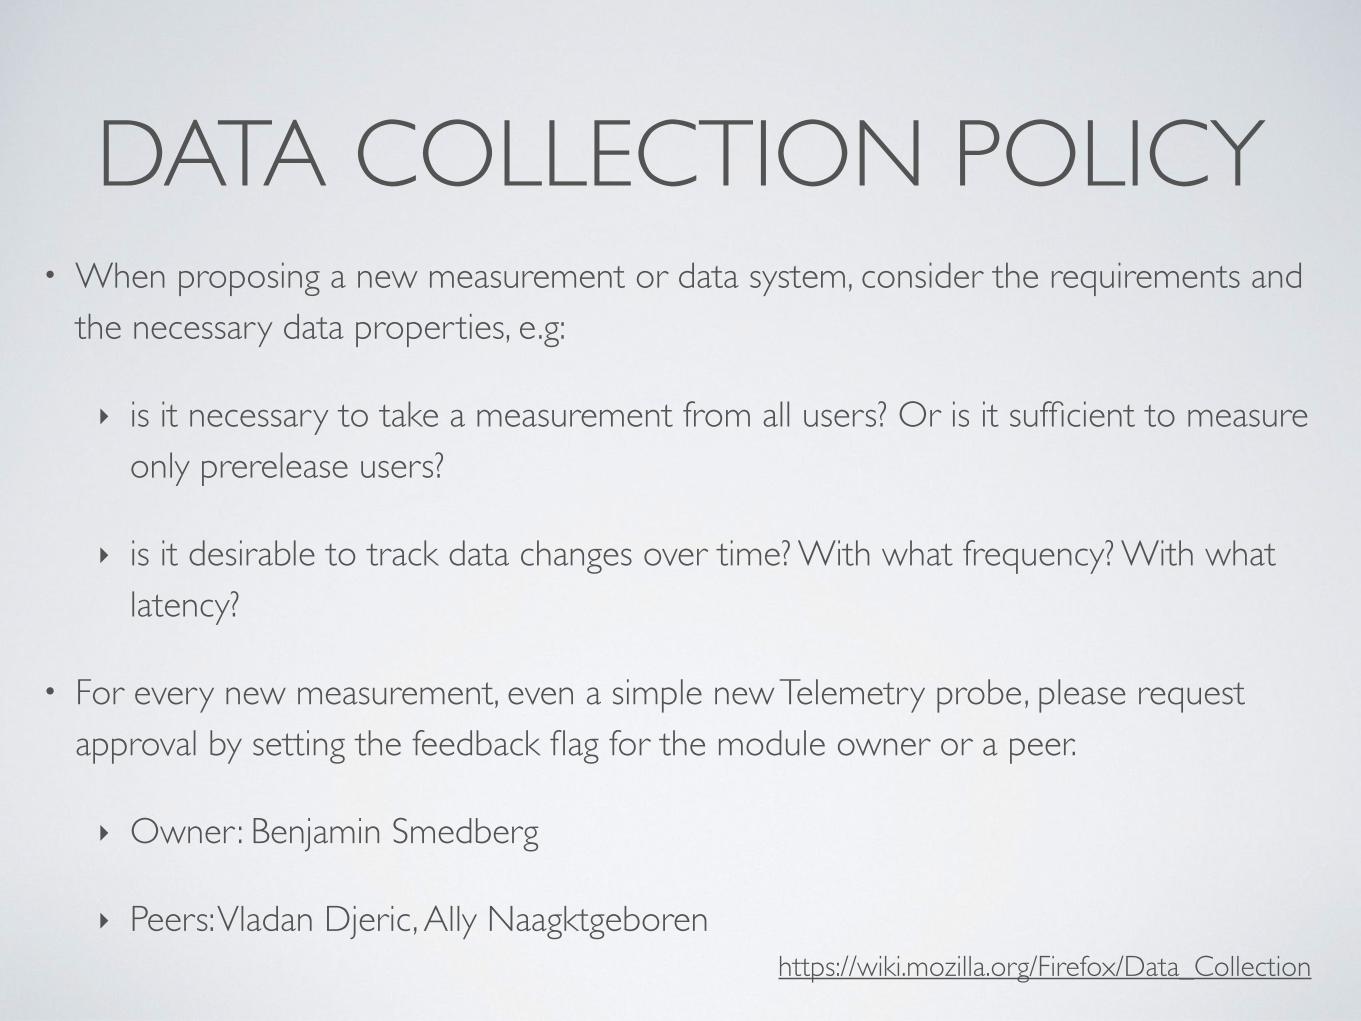
DATA COLLECTION POLICY• When proposing a new measurement or data system, consider the requirements and
the necessary data properties, e.g:
‣ is it necessary to take a measurement from all users? Or is it sufficient to measure only prerelease users?
‣ is it desirable to track data changes over time? With what frequency? With what latency?
• For every new measurement, even a simple new Telemetry probe, please request approval by setting the feedback flag for the module owner or a peer.
‣ Owner: Benjamin Smedberg
‣ Peers: Vladan Djeric, Ally Naagktgeboren https://wiki.mozilla.org/Firefox/Data_Collection