Embed Size (px)
Citation preview

TEEKAY TANKERSQ3-2016 EARNINGS PRESENTATIONNovember 3, 2016

Forward Looking Statements
This presentation contains forward-looking statements (as defined in Section 21E of the Securities Exchange Act of 1934,
as amended) which reflect management’s current views with respect to certain future events and performance, including
statements regarding: crude oil and refined product tanker market fundamentals, including the balance of supply and
demand in the tanker market, the amount of new orders for tankers, the estimated growth in the world tanker fleet, the
amount of tanker scrapping, estimated growth in global oil demand and supply, crude oil tanker demand, and the impact of
the new IMO convention on ballast water treatment; tanker fleet utilization and spot tanker rates, particularly in the
upcoming winter months, including the impact on the Company’s cash flows and balance sheet; the effect of changes in oil
prices and refinery throughput; the timing and impact of the Company’s lightering contracts; and vessel sales, including the
impact on the Company’s financial leverage. The following factors are among those that could cause actual results to differ
materially from the forward-looking statements, which involve risks and uncertainties, and that should be considered in
evaluating any such statement: a delay in, or failure to complete, the sale of the Hugli Spirit, Ganges Spirit and Yamuna
Spirit; changes in the production of, or demand for, oil or refined products; changes in trading patterns significantly affecting
overall vessel tonnage requirements; greater or less than anticipated levels of tanker newbuilding orders and deliveries and
greater or less than anticipated rates of tanker scrapping; changes in global oil prices; changes in applicable industry laws
and regulations and the timing of implementation of new laws and regulations; increased costs; and other factors discussed
in Teekay Tankers’ filings from time to time with the United States Securities and Exchange Commission, including its
Report on Form 20-F for the fiscal year ended December 31, 2015. The Company expressly disclaims any obligation or
undertaking to release publicly any updates or revisions to any forward-looking statements contained herein to reflect any
change in the Company’s expectations with respect thereto or any change in events, conditions or circumstances on which
any such statement is based.
2
3
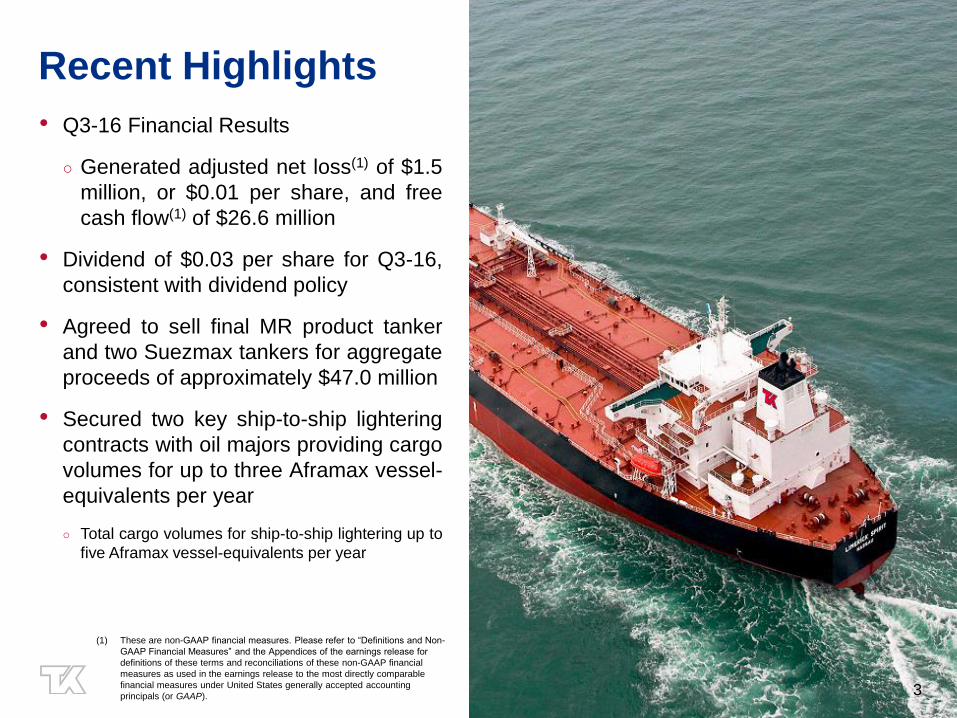
Recent Highlights
• Q3-16 Financial Results
○ Generated adjusted net loss(1) of $1.5
million, or $0.01 per share, and free
cash flow(1) of $26.6 million
• Dividend of $0.03 per share for Q3-16,
consistent with dividend policy
• Agreed to sell final MR product tanker
and two Suezmax tankers for aggregate
proceeds of approximately $47.0 million
• Secured two key ship-to-ship lightering
contracts with oil majors providing cargo
volumes for up to three Aframax vessel-
equivalents per year
○ Total cargo volumes for ship-to-ship lightering up to
five Aframax vessel-equivalents per year
(1) These are non-GAAP financial measures. Please refer to “Definitions and Non-
GAAP Financial Measures” and the Appendices of the earnings release for
definitions of these terms and reconciliations of these non-GAAP financial
measures as used in the earnings release to the most directly comparable
financial measures under United States generally accepted accounting
principals (or GAAP). 3
4
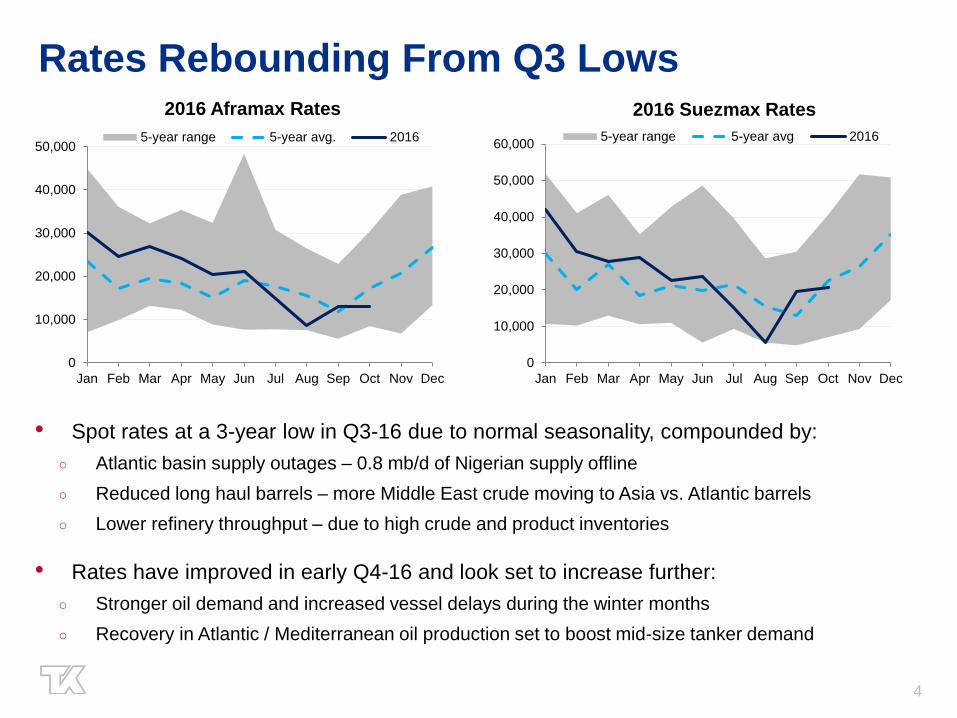
Rates Rebounding From Q3 Lows
• Spot rates at a 3-year low in Q3-16 due to normal seasonality, compounded by:
○ Atlantic basin supply outages – 0.8 mb/d of Nigerian supply offline
○ Reduced long haul barrels – more Middle East crude moving to Asia vs. Atlantic barrels
○ Lower refinery throughput – due to high crude and product inventories
• Rates have improved in early Q4-16 and look set to increase further:
○ Stronger oil demand and increased vessel delays during the winter months
○ Recovery in Atlantic / Mediterranean oil production set to boost mid-size tanker demand
0
10,000
20,000
30,000
40,000
50,000
Jan Feb Mar Apr May Jun Jul Aug Sep Oct Nov Dec
2016 Aframax Rates
5-year range 5-year avg. 2016
0
10,000
20,000
30,000
40,000
50,000
60,000
Jan Feb Mar Apr May Jun Jul Aug Sep Oct Nov Dec
2016 Suezmax Rates
5-year range 5-year avg 2016

5
Returning Atlantic Supply Supports Mid-Size Rates
0.0
0.2
0.4
0.6
0.8
1.0
1.2
1.4
1.6
Jan-13 Jan-14 Jan-15 Jan-16
MB
/D
Libyan Crude Oil Production
Source: IEA, Reuters
Libyan government
target by end-2016
0
5
10
15
20
25
30
35
40
45
0.0
0.1
0.2
0.3
0.4
0.5
0.6
0.7
0.8
0.9
Peak Q3Outages
RestartSept
RestartOct
RestartNov
RestartQ4
‘00
0 $
/da
y
MB
/D
Source: Clarksons, Reuters
Nigerian Outages Returning
Brass River Qua Iboe
Forcados Bonny Light
Suezmax Rates
• Nigerian production is recovering following pipeline attacks in 1H-2016
o Majority of the 0.8 mb/d in outages are expected to return by year-end
• Libya plans to increase crude exports from 250 kb/d to 950 kb/d by year-end
o First tanker since 2014 loaded crude from Ras Lanuf in Sept-16
• Kashagan field has started production, ramping up to 370 kb/d by end-2017
o Exports via Novorossiysk (Black Sea) and Ust-Luga (Baltic)

6
Headwinds in 2017…
• Above average mid-size tanker fleet growth
in 2017, but moderating to below average
levels again in 2018
o Low NB orders and increased scrapping
leads to lower fleet growth in 2018
o New environmental regulations may lead to
higher scrapping than forecast
• Diversity of supply sources is returning
o ~1 mb/d of new Atlantic / MED supply
expected to come online in 2017
o New Atlantic supply could offset the impact
of potential Middle East OPEC supply cuts,
which would be positive for tanker ton-mile
demand and mid-size demand in particular
• Global oil demand growth of 1.2 mb/d
expected in 2017
o Same growth as 2016
o In line with the long-term average
…But fundamentals point towards a more positive market in 2018
-8%
-6%
-4%
-2%
0%
2%
4%
6%
8%
10%
-160
-120
-80
-40
0
40
80
120
160
200
% F
leet
Gro
wth
Nu
mb
er
of
Vessels
Mid-Size Tanker Fleet Growth Forecast
Scrapping Scrapping @ 20yrs
Deliveries Delivery Forecast
Net Fleet Growth (%)
IEA Oil / Supply Demand Balance
$17,600
$14,900 $15,400
$19,800
$16,200
$8,600
$-
$10,000
$20,000
$30,000
Suezmax Aframax LR2
Q3-16 Actual Q4-16 to-date
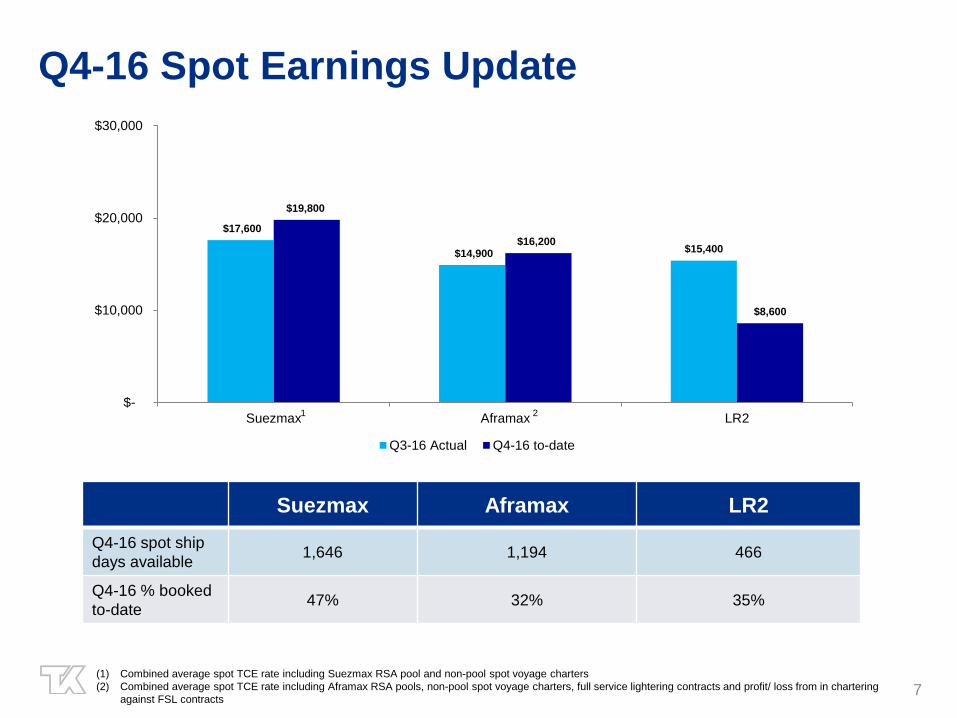
Q4-16 Spot Earnings Update
7
Suezmax Aframax LR2
Q4-16 spot ship
days available1,646 1,194 466
Q4-16 % booked
to-date47% 32% 35%
(1) Combined average spot TCE rate including Suezmax RSA pool and non-pool spot voyage charters
(2) Combined average spot TCE rate including Aframax RSA pools, non-pool spot voyage charters, full service lightering contracts and profit/ loss from in chartering
against FSL contracts
1 2
APPENDIX
8

9
Fleet Employment – In Charters
Q4-2016 Q1-2017 Q2-2017 Q3-2017 Q4-2017 Q1-2018 Q2-2018 Q3-2018 Q4-2018 Q1-2019 Q2-2019 Q3-2019 Q4-2019
Aframax Days 438 450 297 259 84 90 91 92 92 90 91 92 92
LR2 Days 92 90 50 - - - - - - - - - -
Aframax Rates 19,267 19,159 19,467 19,591 23,298 22,750 22,750 22,750 22,750 22,750 22,750 22,750 22,750
LR2 Rates 20,500 20,500 20,500 - - - - - - - - - -
-
50
100
150
200
250
300
350
400
450
Sh
ip D
ays
Aframax Days LR2 Days
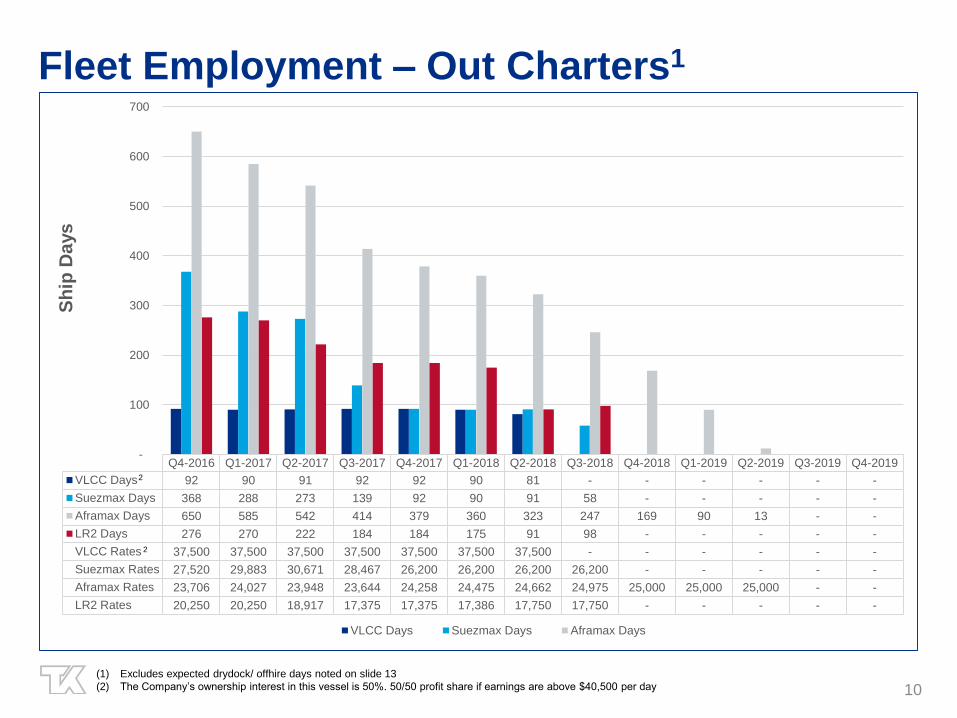
(1) Excludes expected drydock/ offhire days noted on slide 13
(2) The Company’s ownership interest in this vessel is 50%. 50/50 profit share if earnings are above $40,500 per day 10
Fleet Employment – Out Charters1
Q4-2016 Q1-2017 Q2-2017 Q3-2017 Q4-2017 Q1-2018 Q2-2018 Q3-2018 Q4-2018 Q1-2019 Q2-2019 Q3-2019 Q4-2019
VLCC Days 92 90 91 92 92 90 81 - - - - - -
Suezmax Days 368 288 273 139 92 90 91 58 - - - - -
Aframax Days 650 585 542 414 379 360 323 247 169 90 13 - -
LR2 Days 276 270 222 184 184 175 91 98 - - - - -
VLCC Rates 37,500 37,500 37,500 37,500 37,500 37,500 37,500 - - - - - -
Suezmax Rates 27,520 29,883 30,671 28,467 26,200 26,200 26,200 26,200 - - - - -
Aframax Rates 23,706 24,027 23,948 23,644 24,258 24,475 24,662 24,975 25,000 25,000 25,000 - -
LR2 Rates 20,250 20,250 18,917 17,375 17,375 17,386 17,750 17,750 - - - - -
-
100
200
300
400
500
600
700
Sh
ip D
ays
VLCC Days Suezmax Days Aframax Days
2
2
11
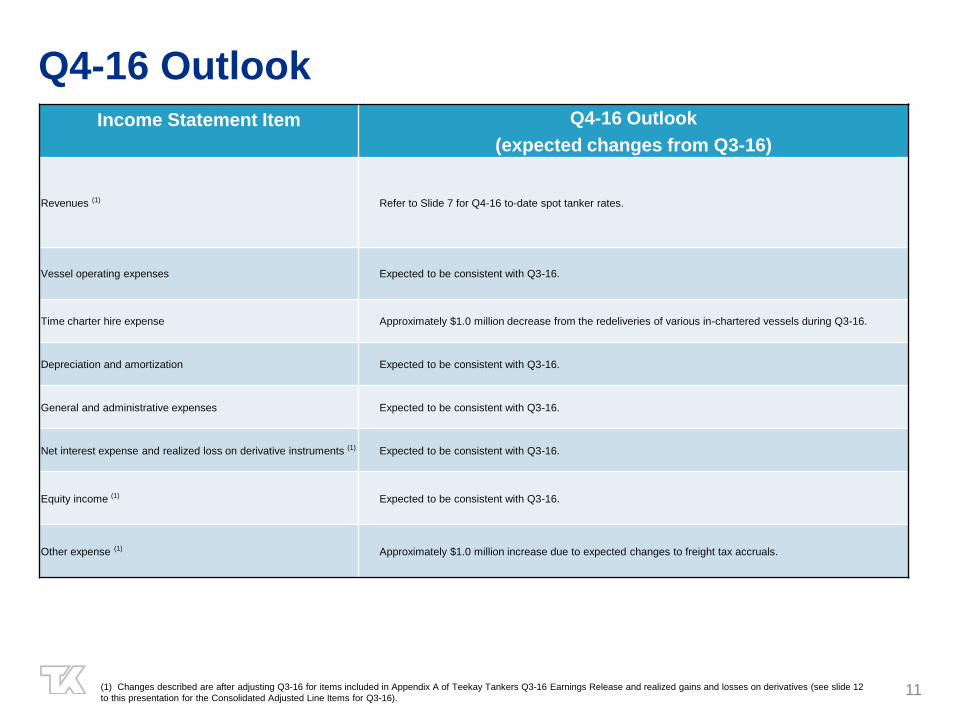
Q4-16 OutlookIncome Statement Item Q4-16 Outlook
(expected changes from Q3-16)
Revenues (1) Refer to Slide 7 for Q4-16 to-date spot tanker rates.
Vessel operating expenses Expected to be consistent with Q3-16.
Time charter hire expense Approximately $1.0 million decrease from the redeliveries of various in-chartered vessels during Q3-16.
Depreciation and amortization Expected to be consistent with Q3-16.
General and administrative expenses Expected to be consistent with Q3-16.
Net interest expense and realized loss on derivative instruments (1) Expected to be consistent with Q3-16.
Equity income (1) Expected to be consistent with Q3-16.
Other expense (1) Approximately $1.0 million increase due to expected changes to freight tax accruals.
(1) Changes described are after adjusting Q3-16 for items included in Appendix A of Teekay Tankers Q3-16 Earnings Release and realized gains and losses on derivatives (see slide 12
to this presentation for the Consolidated Adjusted Line Items for Q3-16).
12
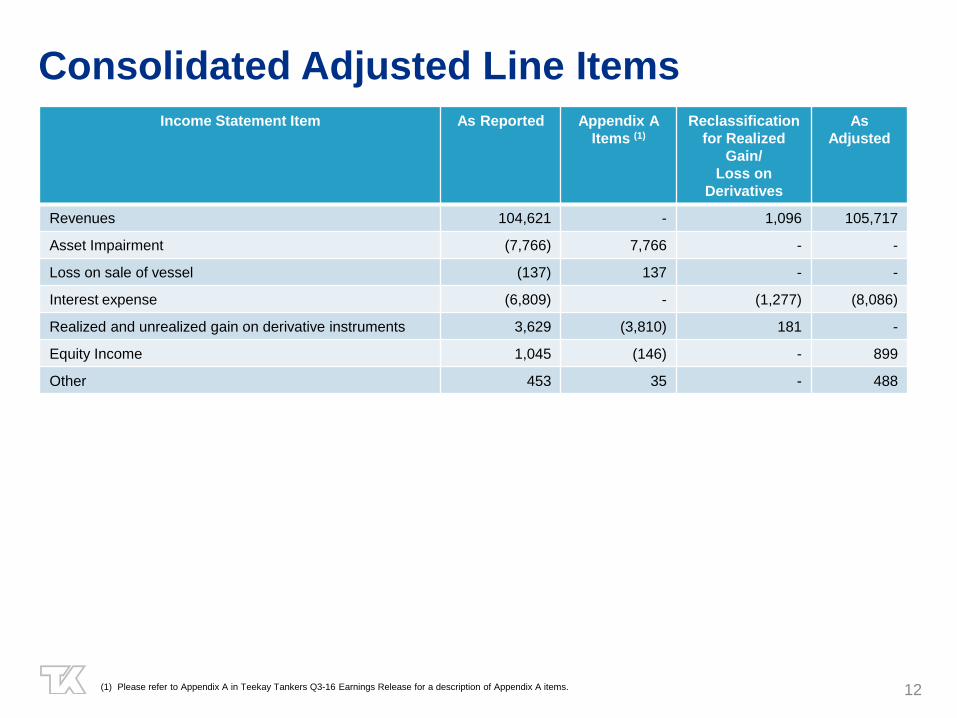
Consolidated Adjusted Line Items
(1) Please refer to Appendix A in Teekay Tankers Q3-16 Earnings Release for a description of Appendix A items.
Income Statement Item As Reported Appendix A
Items (1)
Reclassification
for Realized
Gain/
Loss on
Derivatives
As
Adjusted
Revenues 104,621 - 1,096 105,717
Asset Impairment (7,766) 7,766 - -
Loss on sale of vessel (137) 137 - -
Interest expense (6,809) - (1,277) (8,086)
Realized and unrealized gain on derivative instruments 3,629 (3,810) 181 -
Equity Income 1,045 (146) - 899
Other 453 35 - 488
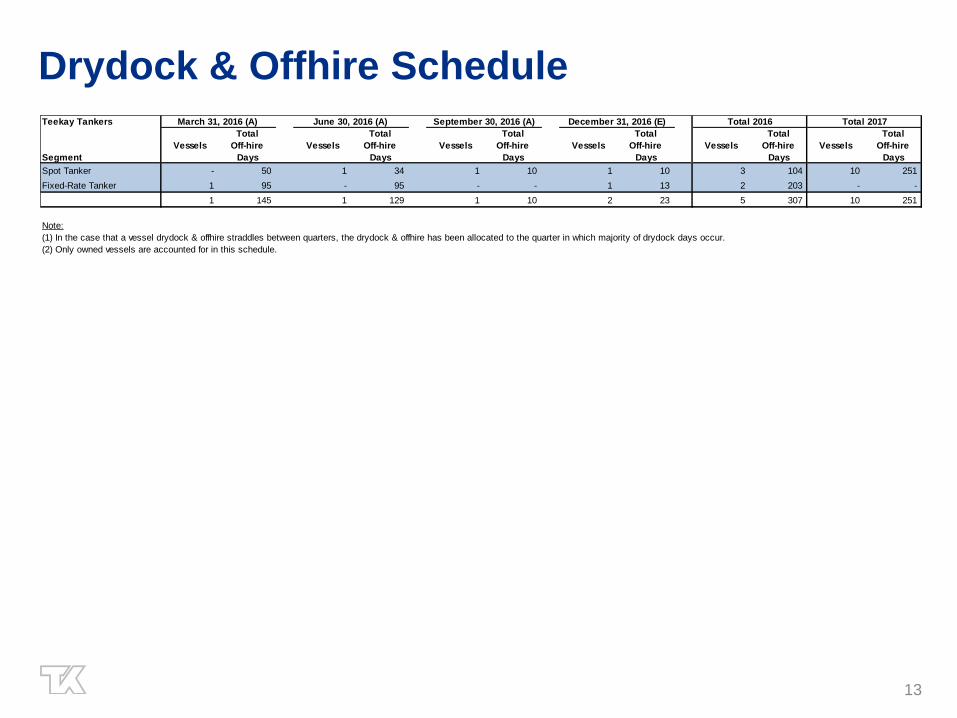
Drydock & Offhire Schedule
13
Teekay Tankers
Segment
Vessels
Total
Off-hire
Days
Vessels
Total
Off-hire
Days
Vessels
Total
Off-hire
Days
Vessels
Total
Off-hire
Days
Vessels
Total
Off-hire
Days
Vessels
Total
Off-hire
Days
Spot Tanker - 50 1 34 1 10 1 10 3 104 10 251
Fixed-Rate Tanker 1 95 - 95 - - 1 13 2 203 - -
1 145 1 129 1 10 2 23 5 307 10 251
Note:
(1) In the case that a vessel drydock & offhire straddles between quarters, the drydock & offhire has been allocated to the quarter in which majority of drydock days occur.
(2) Only owned vessels are accounted for in this schedule.
December 31, 2016 (E) Total 2016 Total 2017March 31, 2016 (A) June 30, 2016 (A) September 30, 2016 (A)