Embed Size (px)
Citation preview

Outline
1. Visualization by TDA
2. Insights Discovery & Feature Selection
3. Evaluate the Insights
22.01.2016 Kim Hee, “Topological Data Analysis and Use Cases” 2

Visualization
22.01.2016 Kim Hee, “Topological Data Analysis and Use Cases” 3
Raw Data
Filter/Filter&Metric
NodesDivision with Redundancy
Point Cloud
e f g hA 3 7 10 12
B 4 8 11 13
C 5 9 8 10
D 13 11 8 4
Network
Node A
Edge
Node BNode A
Node B
L2(A,B)= 4 𝒃𝒚 𝐴𝑏𝑠 3 − 4 2 + 𝐴𝑏𝑠 7 − 8 2 + 𝐴𝑏𝑠 10 − 11 2 + 𝐴𝑏𝑠 12 − 13 2
L2(A,C)= 16 𝒃𝒚 𝐴𝑏𝑠 3 − 5 2 + 𝐴𝑏𝑠 7 − 9 2 + 𝐴𝑏𝑠 10 − 8 2 + 𝐴𝑏𝑠 12 − 10 2
L2(A,D)= 180 𝒃𝒚 𝐴𝑏𝑠 4 − 13 2 + 𝐴𝑏𝑠 8 − 11 2 + 𝐴𝑏𝑠 11 − 8 2 + 𝐴𝑏𝑠 13 − 4 2
cos(∠AOB)=0.999 𝒃𝒚(𝟑×𝟒)+(𝟕×𝟖)+(𝟏𝟎×𝟏𝟏)+(𝟏𝟐×𝟏𝟑)
𝟑2+𝟕2+𝟏𝟎2+𝟏𝟐2 × 𝟒2+𝟖2+𝟏𝟏2+𝟏𝟑2=334
334.275
cos (∠AOC)=0.974 𝒃𝒚(𝟑×𝟓)+(𝟕×𝟗)+(𝟏𝟎×𝟖)+(𝟏𝟐×𝟏𝟎)
𝟑2+𝟕2+𝟏𝟎2+𝟏𝟐2 × 𝟓2+𝟗2+𝟖2+𝟏𝟎2=278
285.552
cos(∠AOD)= 0.757 𝒃𝒚(𝟒×𝟏𝟑)+(𝟖×𝟏𝟏)+(𝟏𝟏×𝟖)+(𝟏𝟑×𝟒)
𝟒2+𝟖2+𝟏𝟏2+𝟏𝟑2× 𝟏𝟑2+𝟏𝟏+𝟖2+𝟒2=280
370
Euclidean Distance, 𝐿2 𝑋, 𝑌
𝑖=1
𝑁
𝑋𝑖 − 𝑌𝑖2
CosineSimilarity, cos θ 𝑖=1𝑁 𝑋𝑖 × 𝑌𝑖
𝑖=1𝑁 𝑋𝑖
2 × 𝑖=1𝑁 𝑌𝑖
2
X, Y: data sample, Xi, Yi: each attribute, N: number of attributes
1. Visualization
2. Insights Discovery
3. Evaluation

Insights Discovery Case 1 – Titanic
22.01.2016 Kim Hee, “Topological Data Analysis and Use Cases” 4
1. Visualization
2. Insights Discovery
3. Evaluation

Insights Discovery Case 2 – Energy Consumption
Problem Domain
» Detect features that has correlation to the energy consumption
Data Description
» Energy consumption history data in U.K. given by power plant
» 1,096 rows * 8 attributes
» Label attribute is volume, other are weather/calendar events
Apply TDA →Discovered insights: Volume is correlated to day_type and school_holiday
1. Visualization
2. Insights Discovery
3. Evaluation
22.01.2016 Kim Hee, “Topological Data Analysis and Use Cases” 6
1. Visualization
2. Insights Discovery
3. Evaluation
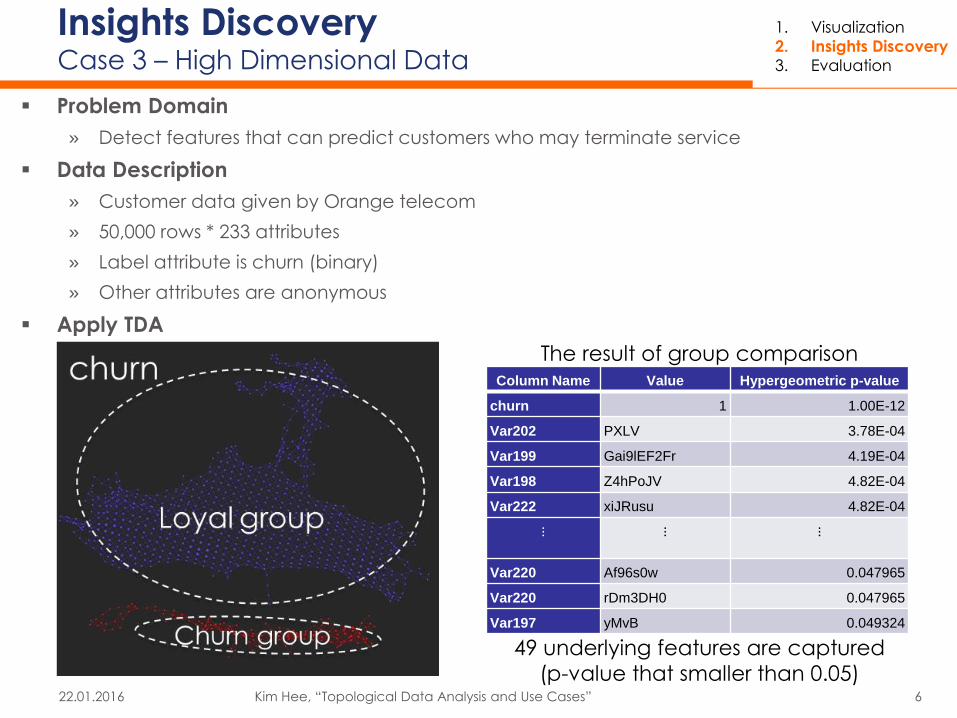
Insights Discovery Case 3 – High Dimensional Data
Problem Domain
» Detect features that can predict customers who may terminate service
Data Description
» Customer data given by Orange telecom
» 50,000 rows * 233 attributes
» Label attribute is churn (binary)
» Other attributes are anonymous
Apply TDA
Column Name Value Hypergeometric p-value
churn 1 1.00E-12
Var202 PXLV 3.78E-04
Var199 Gai9lEF2Fr 4.19E-04
Var198 Z4hPoJV 4.82E-04
Var222 xiJRusu 4.82E-04
⋮ ⋮ ⋮
Var220 Af96s0w 0.047965
Var220 rDm3DH0 0.047965
Var197 yMvB 0.049324
49 underlying features are captured
(p-value that smaller than 0.05)
The result of group comparison

Time to evaluate the insights…
22.01.2016 Kim Hee, “Topological Data Analysis and Use Cases” 7

Evaluation Framework
label
sample 1 Y
sample 2 N
sample 3 Y
sample 4 Y
sample 5 N
sample 6 Y
sample 7 Y
sample 8 Y
sample 9 N
sample 10 Y
MethodSelected Features
Reduction Accuracy
- all - 66%PCA 7 features 22.22% 0%RF 4 features 55.56% 33%
TDA 2 features 77.78% 100%
Sample Comparison Result
1. Visualization
2. Insights Discovery
3. Evaluation
prediction 1
label result
Y Y
N Y
Y Y
prediction 3prediction 2
Mo
de
ling
Ev
alu
atio
n
Decision Tree
Fe
atu
re S
ele
ctio
n
PCA TDAMRMR
Model 1 Model 2 Model 3 Model 4
label result
Y N
N Y
Y N
label result
Y N
N N
Y N
label result
Y Y
N N
Y Y
test data (30%)
Training data
(70%)
prediction 4

Energy Consumption
22.01.2016 Kim Hee, “Topological Data Analysis and Use Cases” 9
Evaluation1. Visualization
2. Insights Discovery
3. Evaluation
Modeling
Dimensional reduction All PCA MRMR TDA
Reduction rate
(no. of selected features)
0 %
(0)
92.70 %
(17)
57.08 %
(100/default)
83.26 %
(39)
Evaluation
(F1 Score)
Model by
Naïve Bayes0.147 0.005 0.146 0.147
Evaluation
(F1 Score)
Model by
Decision tree0.016 0.002 0.023 0.036
Modeling
Dimensional
reductionAll PCA MRMR TDA
Reduction rate 0 % 66.67 % 88.89 % 77.78 %
Selected features all
winter,
solar_rad,
temp
day_typeday_type,
sch_holiday
Evaluation (MAPE)
Model by
Neural Network3.0546 % 11.1026 % 5.7003 % 3.6406 %
Model by SVM 10.9843 % 11.0649 % 10.6166 % 10.7778 %
High Dimensional Data

References
Used tool: Ayasdi, http://www.ayasdi.com/
Open source: Mapper, http://danifold.net/mapper/
PCA: https://en.wikipedia.org/wiki/Principal_component_analysis
SVM: https://en.wikipedia.org/wiki/Support_vector_machine
MRMR: http://penglab.janelia.org/proj/mRMR/
MAPE: https://en.wikipedia.org/wiki/Mean_absolute_percentage_error
F1 Score: https://en.wikipedia.org/wiki/F1_score
22.01.2016 Kim Hee, “Topological Data Analysis and Use Cases” 10

Question?Kim Hee ([email protected])