Embed Size (px)
Citation preview

Kymberly Perry, MS Master of Science Candidate for Business Intelligence Data Mining Full Sail University

Tableau is blazing the trails as a front-runner for independent vendors that provide business intelligence solutions. In fact, it is one of the fastest growing technology companies in the world. Its mission is the help people see and understand their data. The Seattle based, software company was founded in 2003 by Christian Chabot and two Stanford computer scientists. It completed its successful initial public offering on the New York Stock Exchange in May of 2013, raising more than $250 million dollars. Tableau Software has more than 23,000 customer accounts located in over 100 countries, and it continues to propel itself as a top contender, with an 80 percent, year-over-year growth since 2013. Tableau touts itself as being a market defining company in the BI industry serving up five main products that offers professional software for data analysis, business intelligence and data visualization. These products include: Tableau Desktop, Tableau Server, Tableau Online, Tableau Public and Tableau Reader. Its mantra is that you can use Tableau to analyze any type of data no matter how small or how big. Its products are known for being easy to learn, easy to use without the need for writing code, scripts and wizards.
ABO
UT
source: tableau.com

Pro
du
cts
& S
erv
ices
Tableau continues to build momentum in the marketplace with its rich product offerings. It delivers a diverse mix of software products that will meet the need of any customer who wants to engage with their data sets, analyze them, and extrapolate meaningful, visual intelligence that allows the business users to solve immediate problems while creating beneficial value. The growing software company began its 2003 journey in Mountain View, CA. The initial vision was to commercialize data sets, researched and conducted at Stanford University. Out of this was the birth of the Polaris project, “an interface for exploring large multi-dimensional databases that extends the well-known Pivot Table interface” (Stolte and Hanraham 2000). Out of this project was the development of the innovative core technology, VizQL (Visual Query Language). Currently, Tableau offers four core products to users of diverse skill sets. ! Tableau Desktop - self-service analytics platform for any user with a data
set ! Tableau Server - business intelligence platform for organizations. ! Tableau Online - cloud-based, hosted version of Tableau Server. ! Tableau Public - free, cloud-based platform where any user can register
to analyze and share public data.

Des
kto
p C
apa
bili
ties
Tableau’s desktop is infamous for its easy-to-use drag and drop capabilities. The VizQL™ technology is a patented software language that was the breakthrough innovation that derived from the Stanford project. It is unique in the fact that it allows its users to translate their drag and drops into an optimized database query and then displays the database’s response graphically. There are five core principles that encompasses Tableau’s VizQL™ technology:
! Easy to use interfaces ! Easy data exploration ! Expressiveness ! Visual best practices ! Database independence
“We believe that VizQL represents a founda8onal advancement in the area of data analysis and visualiza8on…” Tableau

Des
kto
p Fe
atu
res
! Code-Free Visual Analysis - allow users to filter data, run in-depth cohort analysis and split trends across differentiating categories and easily double-click geographic fields and place data on a map.
! Data Dive - User can delve deeper into their existing data and derive new calculations
! Translatable Metadata - diverse set of capabilities that allow users to rename fields, modify number formats, combine and re-create data subsets while providing filtering ability.
Tableau’s desktop features are robust, intuitive and dominate by industry standards.

Tablea
u Serv
er
ENTERPRISE INTELLIGENCE If business users want to empower the entire organization with advanced data capabilities, then Tableau Server is the way to go. Server is designed for diverse technical skill sets. From the most technically advanced to a novice user, Tableau Server allows users to publish dashboards via browser or mobile based. Anyone in the organization can have access to insight wherever they are.
DATA ENGINE™ Shatter data silos and unleash the limitations of existing databases with Tableau’s Data Engine. It is designed to shift the curve between big data and fast analysis. Its an in-memory solution with a purpose to instantly run very large multi-dimensional files and complex (co-occurrence) queries.

Serv
er F
eatu
res ! It’s Flexible - Users can leverage their
data at will, via live data connections or in-memory, serving its users with speed and adaptability.
! It’s Scalable - users can rollout Tableau at department level or company-wide at their discretion. It comes with both the hardware and memory to support the enterprise.
! It’s Secure - Assign individual or security permissions at any level. The multi-tenancy features provides sites to separate both users and content.
! It’s Diverse - Once the user produces a dashboard, he can view it anywhere, on multiple devices. With the no-programming capabilities for mobile devices, it makes it seamless and easy to view and interact with data sets.
Tabl
eau
On
lin
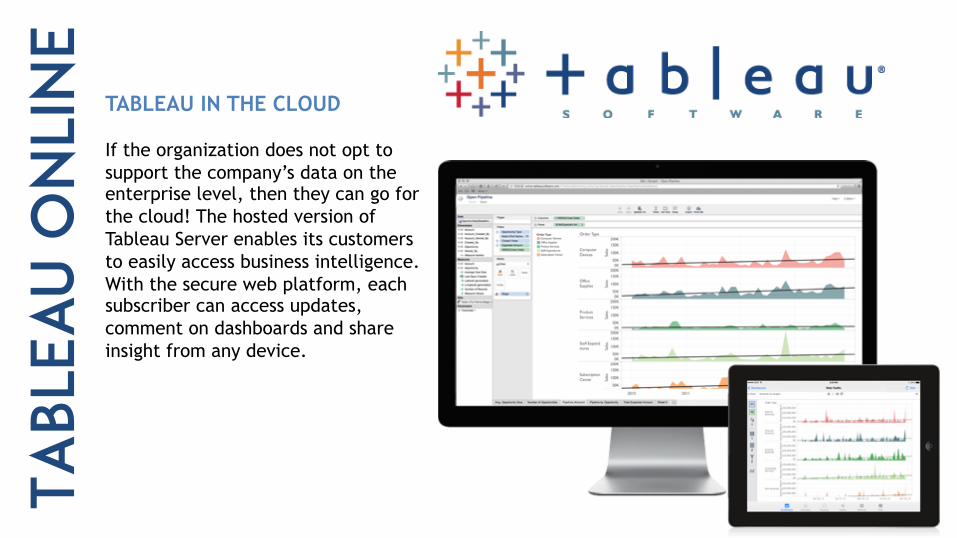
e TABLEAU IN THE CLOUD If the organization does not opt to support the company’s data on the enterprise level, then they can go for the cloud! The hosted version of Tableau Server enables its customers to easily access business intelligence. With the secure web platform, each subscriber can access updates, comment on dashboards and share insight from any device.

online Features ! Intelligent Connections - Connect with multiple data
sources such as Google BigQuery, Amazon Redshift, or organizational data. There are also capabilities to refresh Salesforce and Google Analytics. The alert features also keeps organizations in-tune with what’s going on at all times.
! Latest Developments - With Tableau Online there is no need for users to worry about updates. Online is automatically equipped with advanced functions to run the latest technology.
! Manageability - Streamline all of the organizational data to the cloud. Define users, connections and data sources all with a few simple clicks.
! Top-Notch Service - Customers have overall positive customer experience, rating Tableau above average for support, sales experience and performance*. This coupled with the enterprise-class architecture provides its users with the Tableau reliability.
*Magic Quadrant Report
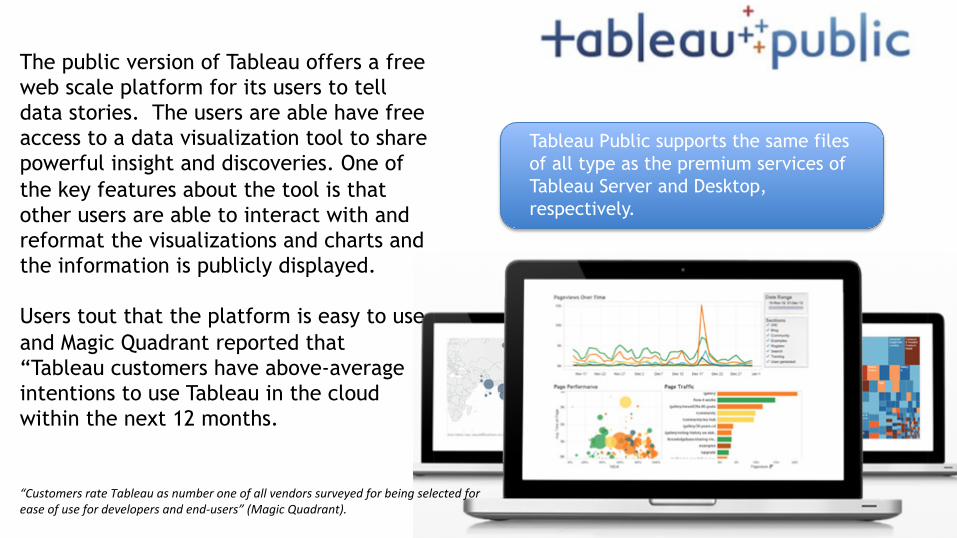
The public version of Tableau offers a free web scale platform for its users to tell data stories. The users are able have free access to a data visualization tool to share powerful insight and discoveries. One of the key features about the tool is that other users are able to interact with and reformat the visualizations and charts and the information is publicly displayed. Users tout that the platform is easy to use and Magic Quadrant reported that “Tableau customers have above-average intentions to use Tableau in the cloud within the next 12 months.
Tableau Public supports the same files of all type as the premium services of Tableau Server and Desktop, respectively.
“Customers rate Tableau as number one of all vendors surveyed for being selected for ease of use for developers and end-‐users” (Magic Quadrant).

TABL
EAU
TEC
H S
PEC
S Tableau has a broad range of support for direct query SQL and MDX data sources. Other technical features include: ! A large number of Hadoop distributions ! Columnar, in-memory data engine ! Tableau can be used as alternative to or in hybrid mode with its
direct query access. It enables fast performance on large and multi-score datasets and complex queries: ! For large multidimensional filters ! Complex co-occurrence or multi-pass queries
Source: Magic Quadrant Report

TABL
EAU
TEC
H F
EATU
RES
Tableau users have the visual ability to blend and analyze large, diverse datasets and auto detects relationships from multiple data sources. Some of the other highly regarded technical features include: ! Zero programming data mash-up capability ! In-memory database ! Tableau allows users to produce a series of interactive dashboards ! The interactive analysis can be shared as a web browser supported
report ! Tableau 8 enables users to build interactive reports, even from mobile
devices.

Revenue Sources Tableau’s revenue sources are through license fees and related maintenance and service fees. License feeds include: ! Perpetual, term and subscription feeds ! Perpetual - 90 percent of the license
revenue
The maintenance and service fees include: ! Fees from maintenance services ! Support and unspecified upgrades and
enhancements ! Training from professional services
Most revenue comes from maintenance agreements: ! Typically purchased with new licenses for
one year of service. ! Opportunity to purchase maintenance
service at an annual rate, thereafter. Financial Outlook: for maintenance and service
revenues to become a larger percentage of total revenues as customer base continues to grow.

! Revenue was $104.5 million, up 71% year over year ! License revenue was $69.8 million, up 66% year over year ! International revenue was up 115% year over year ! Added more than 2,500 new customer accounts. ! Closed 200 sales orders greater than $100,000, up 68% year over year ! Total revenue increased 71% to $104.5 million, from $61.1 million in the third
quarter 2013. ! License revenue was up 66% to $69.8 million, from $42 million in 3Q of 2013. ! International revenue grew to $24.1 million, up 115% year over year.
Tableau 2014 – Third Quarter Results In
th
e N
ews
According to Tableau 2014 third quarter report news release, it reported its first-ever quarter of more than $100 million in revenue, driven by strong customer growth and product adoption with the quarter ending September 30, 2014. Below are other 3Q highlights from the article.

Res
pon
den
t R
evie
ws
In the 2013 Gartner Magic Quadrant report for Business Intelligence and AnalyEcs PlaGorm it provided insight into which BI companies dominated the market. Below, I have provided a summary of respondent comments based on the use of Tableau’s soMware. ! Easy Set-‐Up -‐ Users report Tableau’s soMware among the lowest Emes to implement ! Blazing Speed -‐ The fastest report and dashboard development Emes across all levels
of complexity. ! SoMware AdopEon -‐ The highest percentage of business user authors of all users of
any vendor. ! Top Features -‐ Among the highest business benefit achieved ! Fun to Use -‐ ExcepEonal ease of use (described as “fun”) ! Top Notch -‐ Ability to conduct sophisEcated analysis

Competition In an October article published in Investor Business Daily, it cited that Tableau is facing tough rivalry with SalesForce.com and IBM respectively, with each company launching new products (Pete 2014).
IBM launched a beta version of Watson Analytics to compete in the data analytics and visualization space as “a powerful analytics solution that helps organizations aggregate, analyze and visualize massive amounts of information to expose unique insights. Watson Content Analytics helps organizations interpret and understand their enterprise information to validate what is known and reveal what is unknown” (ibm.com).

Rivalries Sales Force launched its version of a data analytics and visualization tool called SalesForce Analytics Cloud powered by Wave. “It is a mobile first analytics platform that lets everyone explore any data. Now anyone can ask any question, from anywhere, and act” (sfdcstatic.com).
Another technology company on Tableau’s tail is Qlik Technologies. Its strengths are in the overseas business. With this being said, Tableau is preparing for future gains in new products and offshore expansions.
Tableau isn’t too concerned about noise from existing or rivals, said Francois Ajenstat, the company’s senior director of product management. “Over the last four or five years most of the large enterprise vendors, SAP, Microsoft, IBM - have all been introducing products and capabilities that are trying to mimic what Tableau has done,” he told IBD. “They are playing catch-up in this market” (Pete 2014).

Competitive intelligence
“It is a great tool if you are looking for a very powerful BI product with a lot of op8ons. It is not good for those looking for a simple BI tool who have a short ramp-‐up 8me.”
“It really depends on the use case. If the need is simply to standardize repor8ng, MicroStrategy might meet or even exceed expecta8ons However, if the need is to guide execu8ve decision-‐making with agile ad hoc analy8cs, there are other tools that are much beNer suited to the task.”
“Birst is excellent for visualizing data, but not for data interac8on. If data input is required, Birst is not recommended.”
“In the area of Clinical Data tracking, SpoQire is an easy-‐to-‐learn, visually appealing and powerful repor8ng tool.”
“Key ques8on: who is the intended audience? Do you want your regular, non technical users to have report crea8on capabili8es? If so, then BO is a way to go.”
“We also looked at Tableau and ul8mately decided to go with them instead of GoodData because their performance was considerably beNer, we liked the mapping feature which GoodData did not offer, and the calculated fields were also easier to create and process.”
Source: Trustradius.Com
“People are recognizing that it is 8me for this industry," says Tableau CEO Chris8an Chabot. "We welcome the valida8on, but we didn't really need it.” (Konrad 2014)

Conclusion Tableau is emerging past its competition to be the own the data analytics and visualization BI market. It continues facilitate rapid adoption of products. The low up front costs to acquire licenses and collaborative capabilities with other software, aligns Tableau to remain in its top position. Tableau does have significant opportunities to to expand in the international space, and is currently offering products and support and eight languages. In summary, Tableau has positioned itself to remain a market defining company in the BI industry and is truly one of the fastest growing technologies companies in the world. The software giant really does, “help people see and understand their data” (Tableau.com).

References • Pete, B. (2014, October 3). Can Tableau Beat Salesforce.com In AnalyEcs?. Investors Business Daily. p.
A14. • Schlegel, K., et al (2013, February 5). Magic Quadrant for Business Intelligence and AnalyEcs PlaGorms.
Retrieved November 23, 2014. • Stotle, C., & Hanrahan, P. (2000, August 5). Polaris: A System for Query, Analysis and VisualizaEon of
MulE-‐dimensional RelaEonal Databases. Retrieved November 26, 2014, from hep://graphics.stanford.edu/papers/polaris/
• Tableau SoMware. (n.d.). Retrieved November 27, 2014, from hep://www.tableausoMware.com/ • Tableau Announces Record Revenue for Third Quarter 2014. (2014, November 5). Retrieved November
26, 2014, from hep://investors.tableausoMware.com/files/doc_news/Q3Y14/Q3-‐2014-‐Earnings-‐Release-‐(Final)_v001_g95jb6.pdfTableau Desktop CompeEtors. (n.d.). Retrieved November 26, 2014, from heps://www.trustradius.com/products/tableau-‐desktop/compeEtors
• Watson Content AnalyEcs. (n.d.). Retrieved November 25, 2014.hep://www2.sfdcstaEc.com/assets/pdf/datasheets/SFDC_WaveAnalyEcs__LicenseComparison.pdf?d=70130000000i2Tr
• Wave AnalyEcs Cloud Pricing ConfiguraEon Sheet. (n.d.). Retrieved November 25, 2014, from hep://www2.sfdcstaEc.com/assets/pdf/datasheets/SFDC_WaveAnalyEcs__LicenseComparison.pdf?d=70130000000i2Tr