Embed Size (px)
Citation preview
Building a Data Viz & Tableau Culture at Facebook
Andy Kriebel Data Viz Guru - Facebook Cincinnati Business Intelligence & Analytics Meetup August 19, 2014


A little bit about you…
How long have you been using Tableau?

How many meetups have you attended?

What do you want to know?

My first Tableau project


It started with a simple question

How are teams planning budgets vs. goals?

And we’d like to see a dashboard


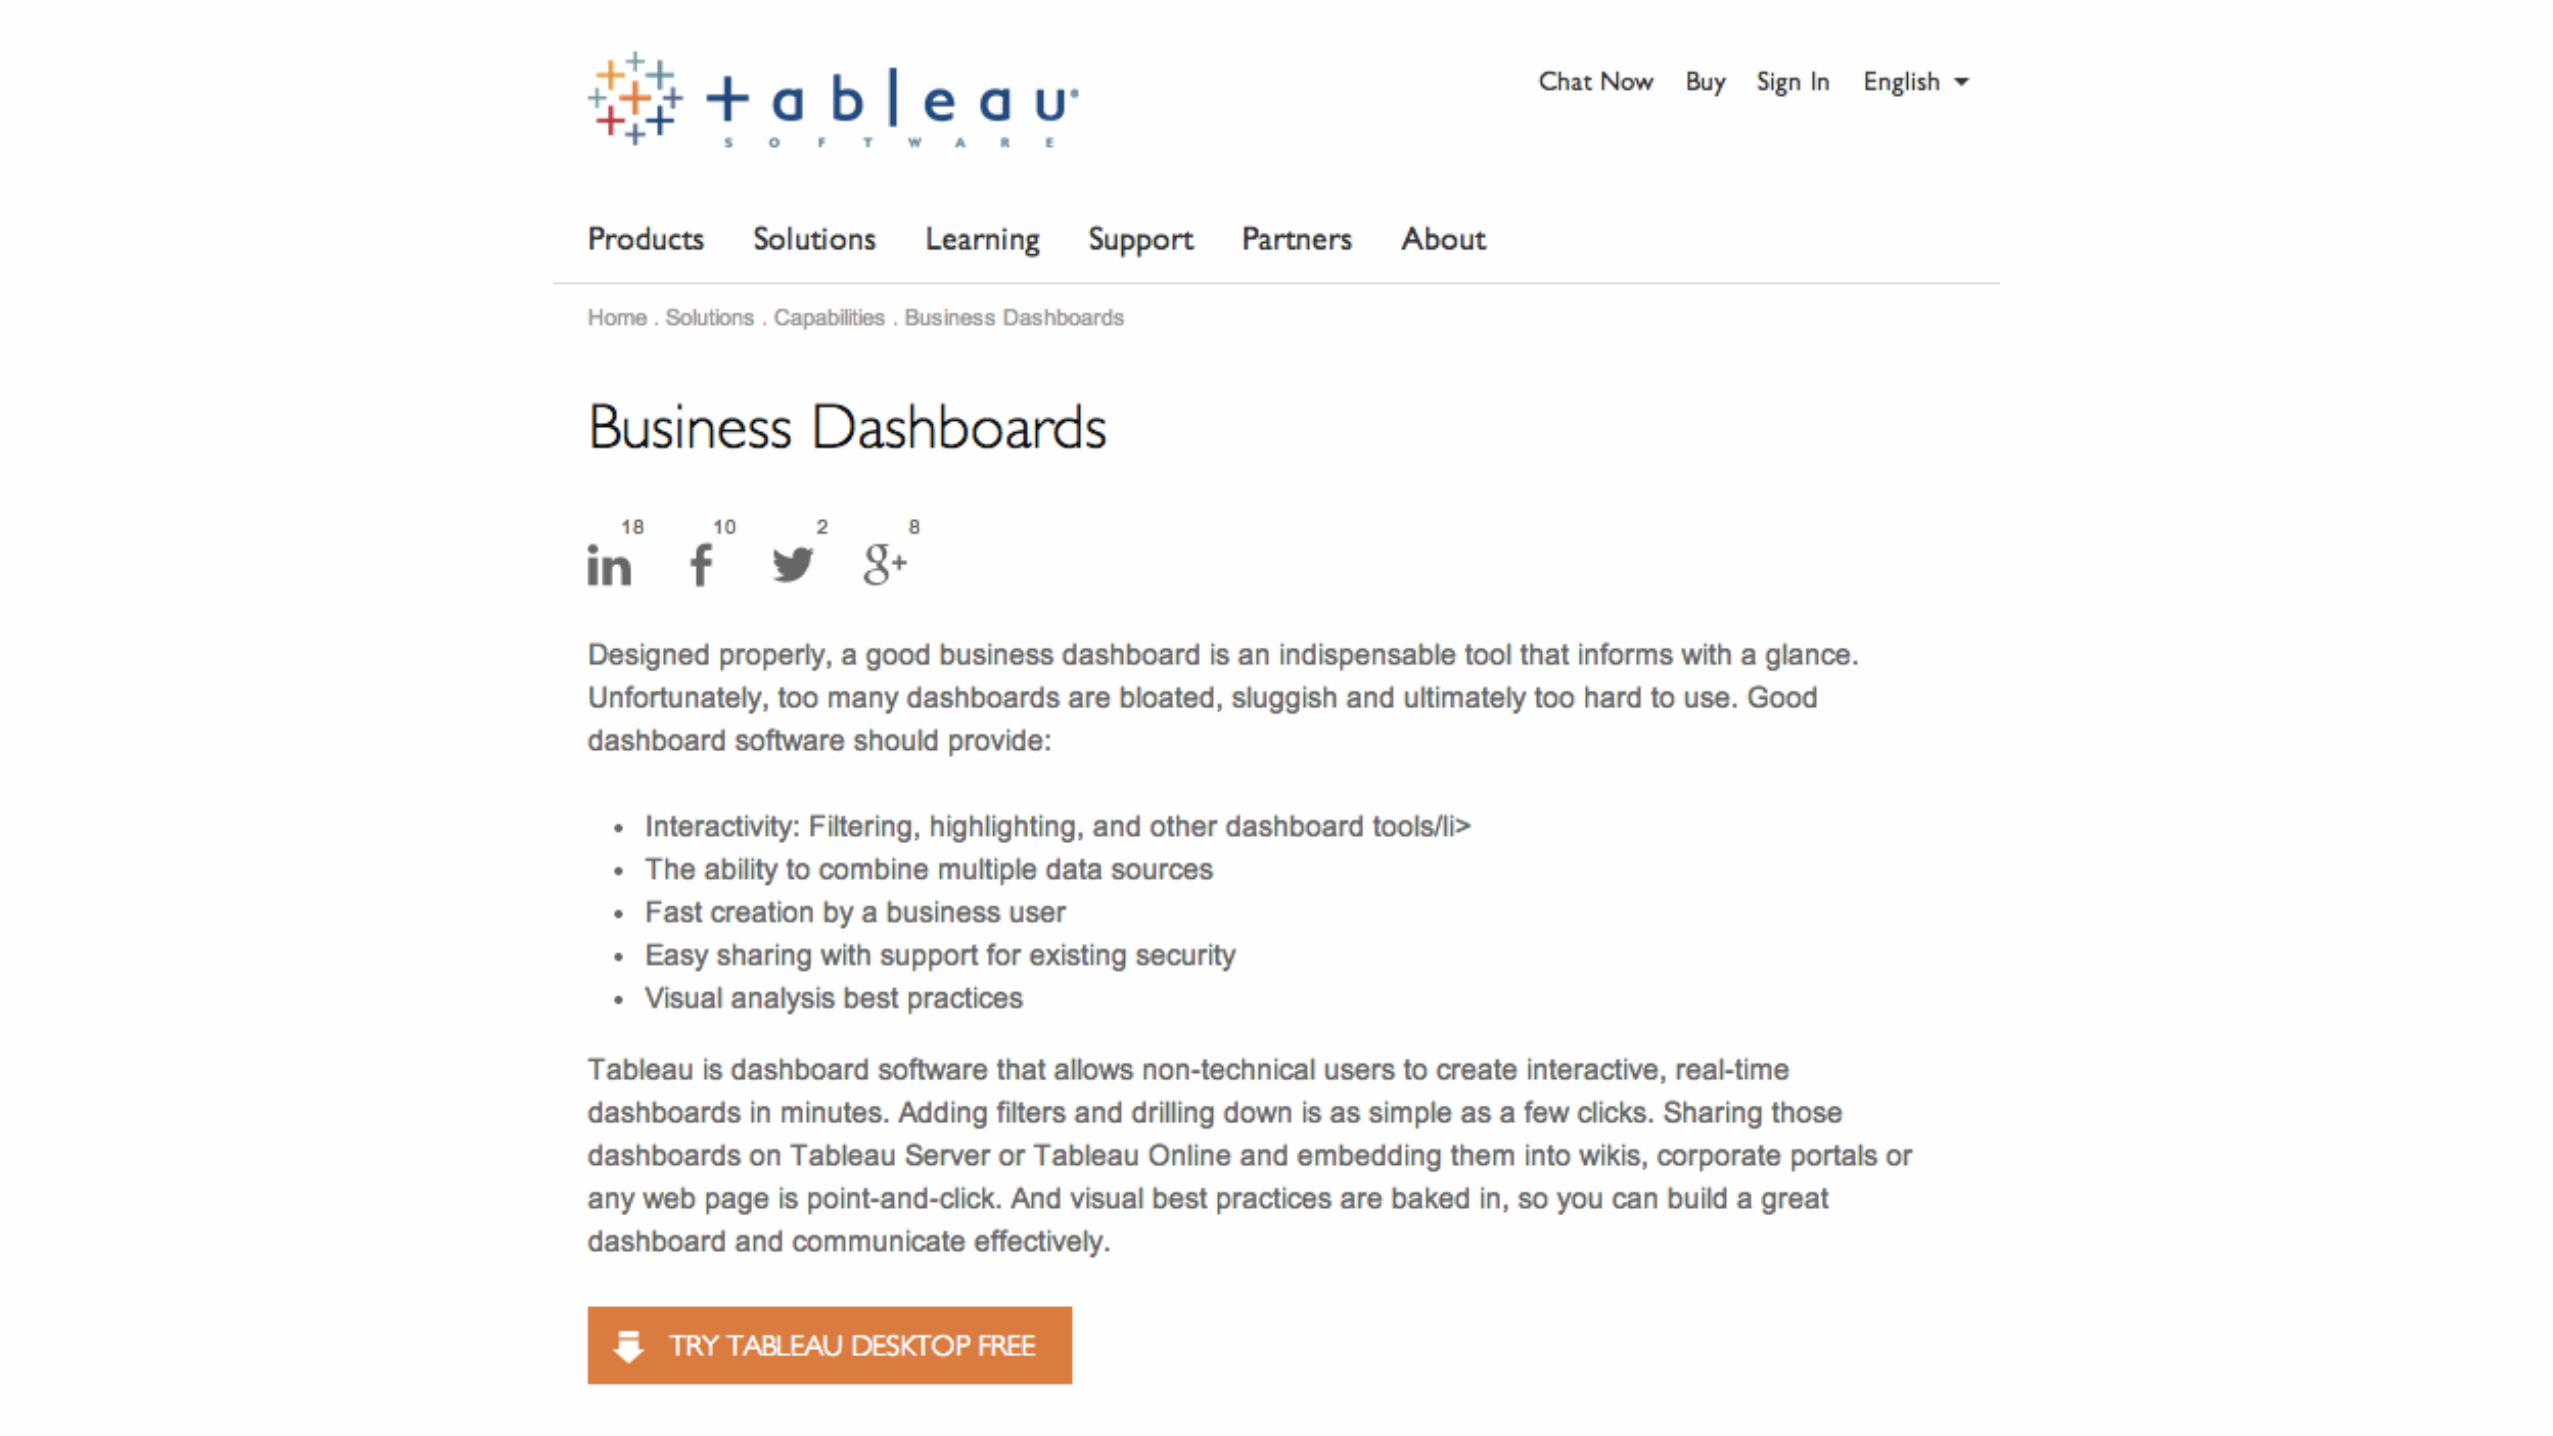
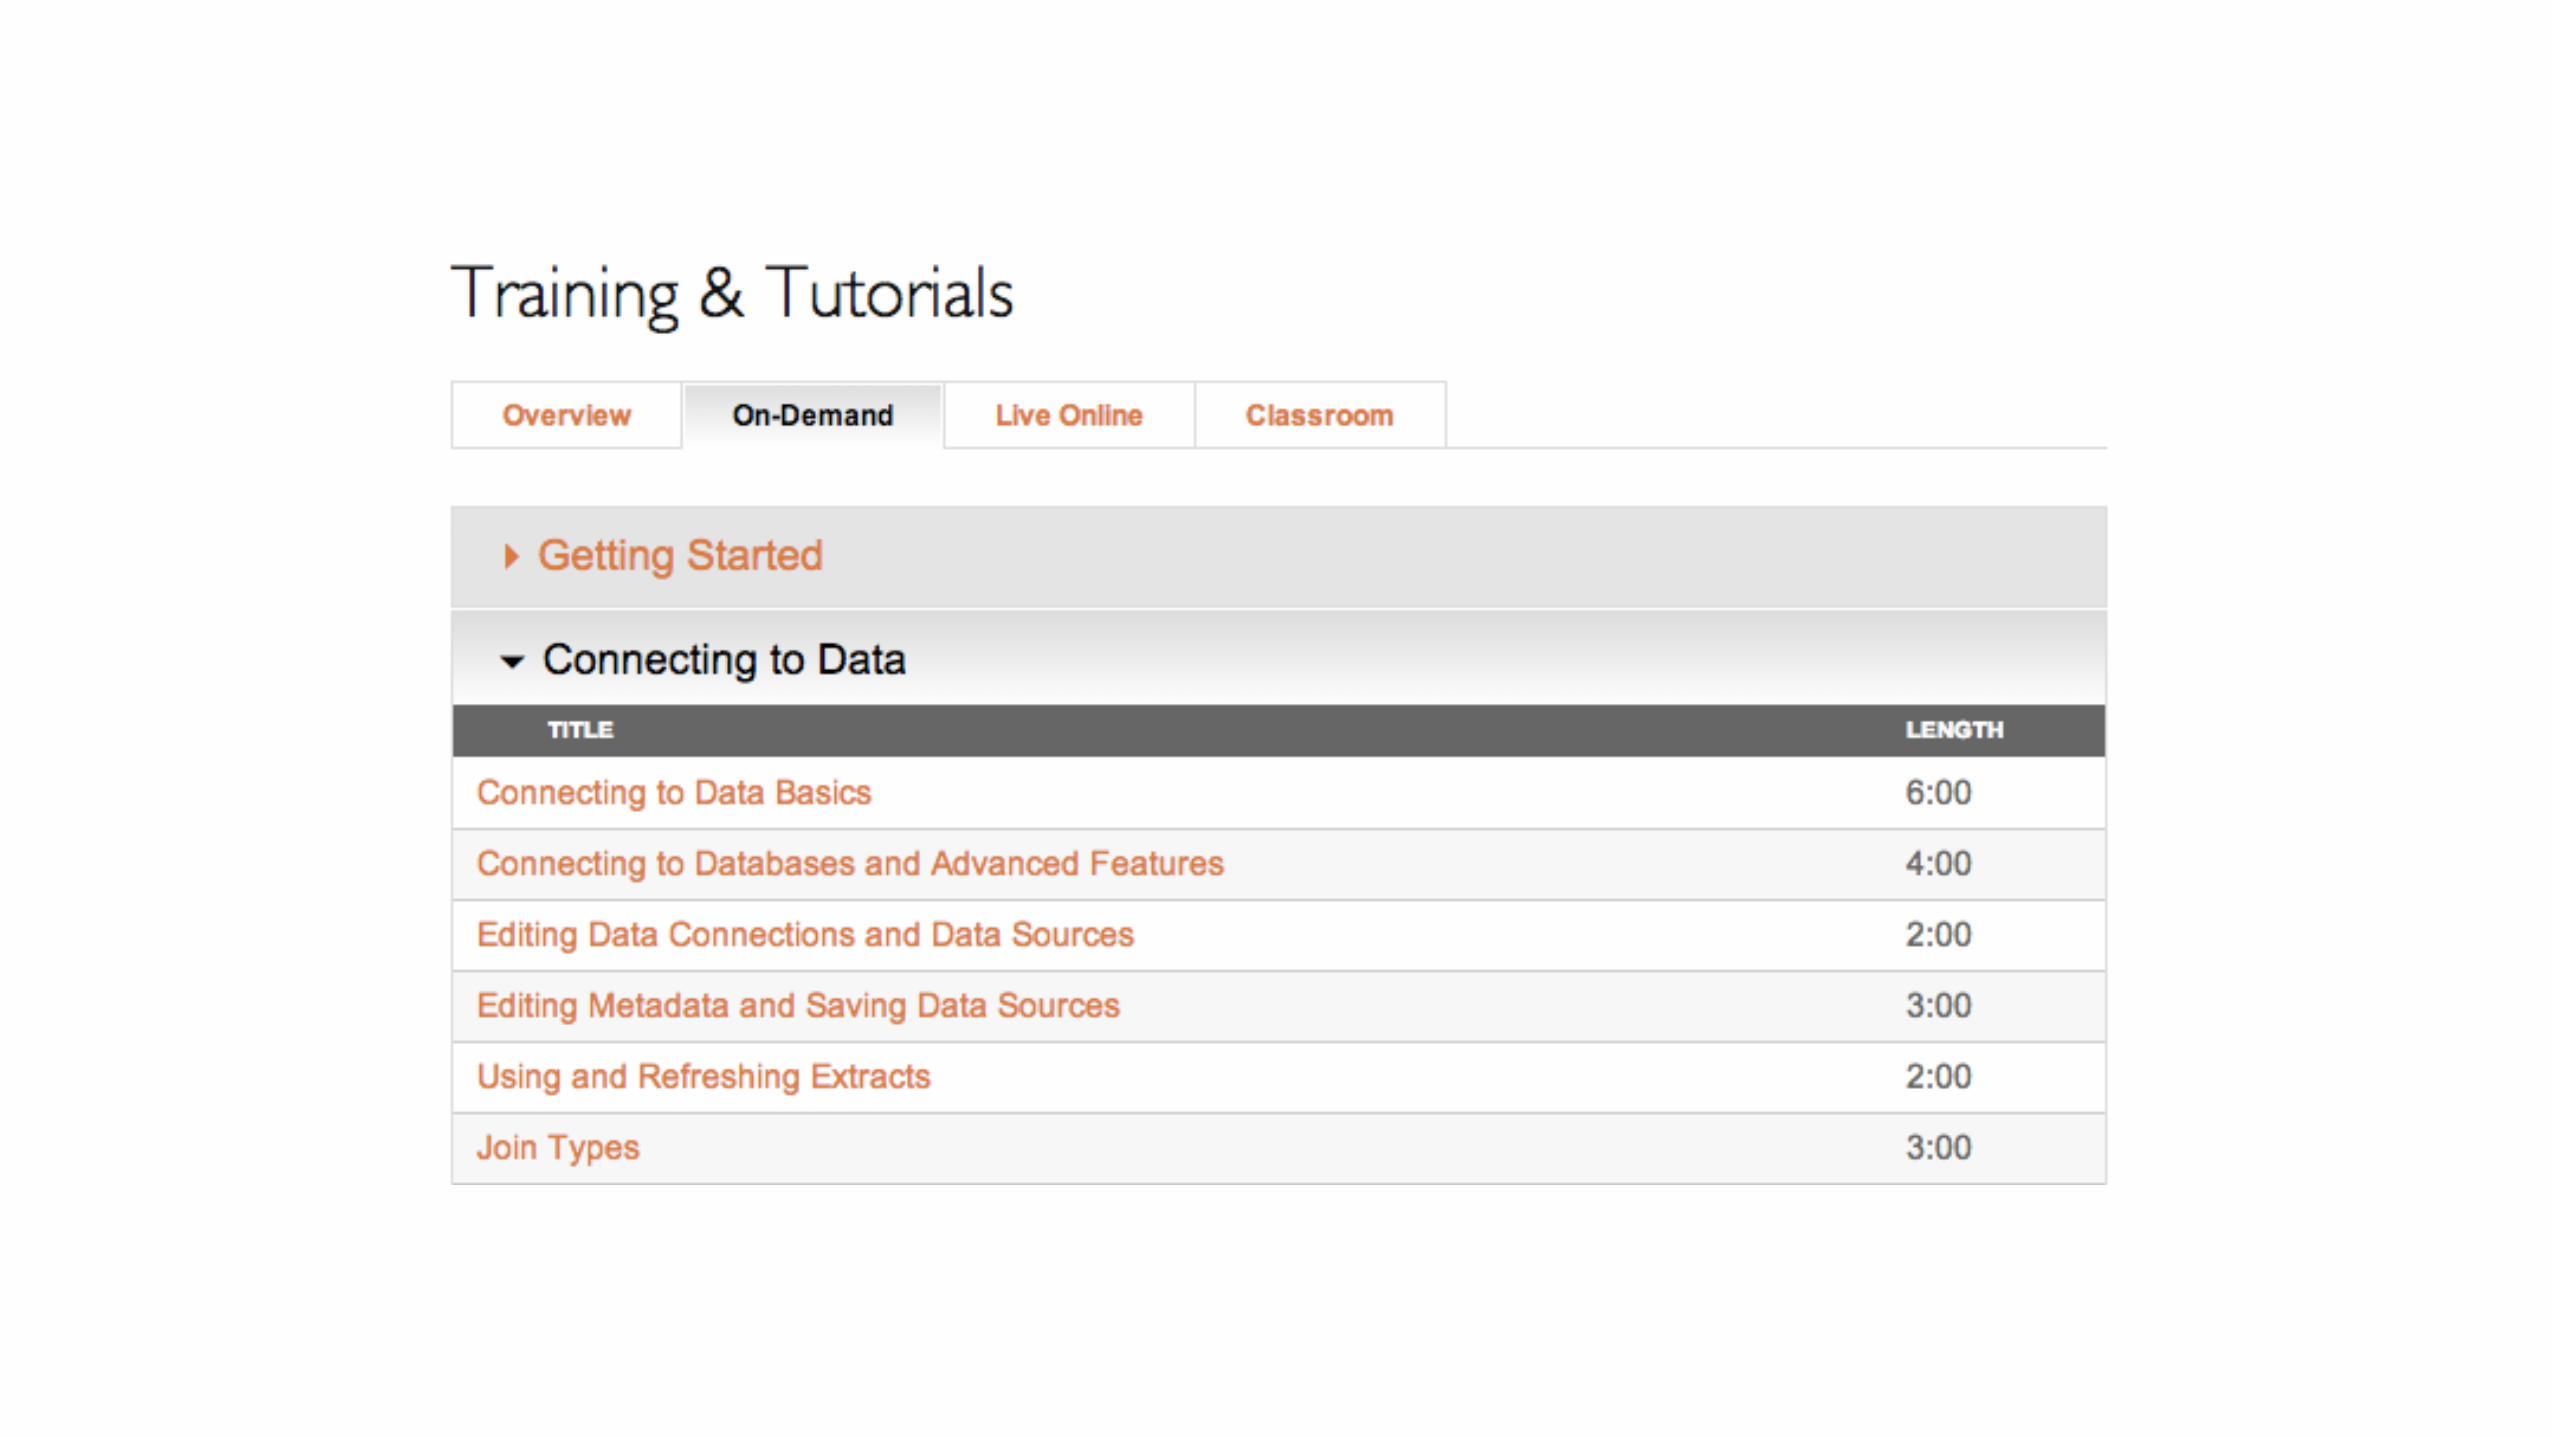

1 hour from that Google search…
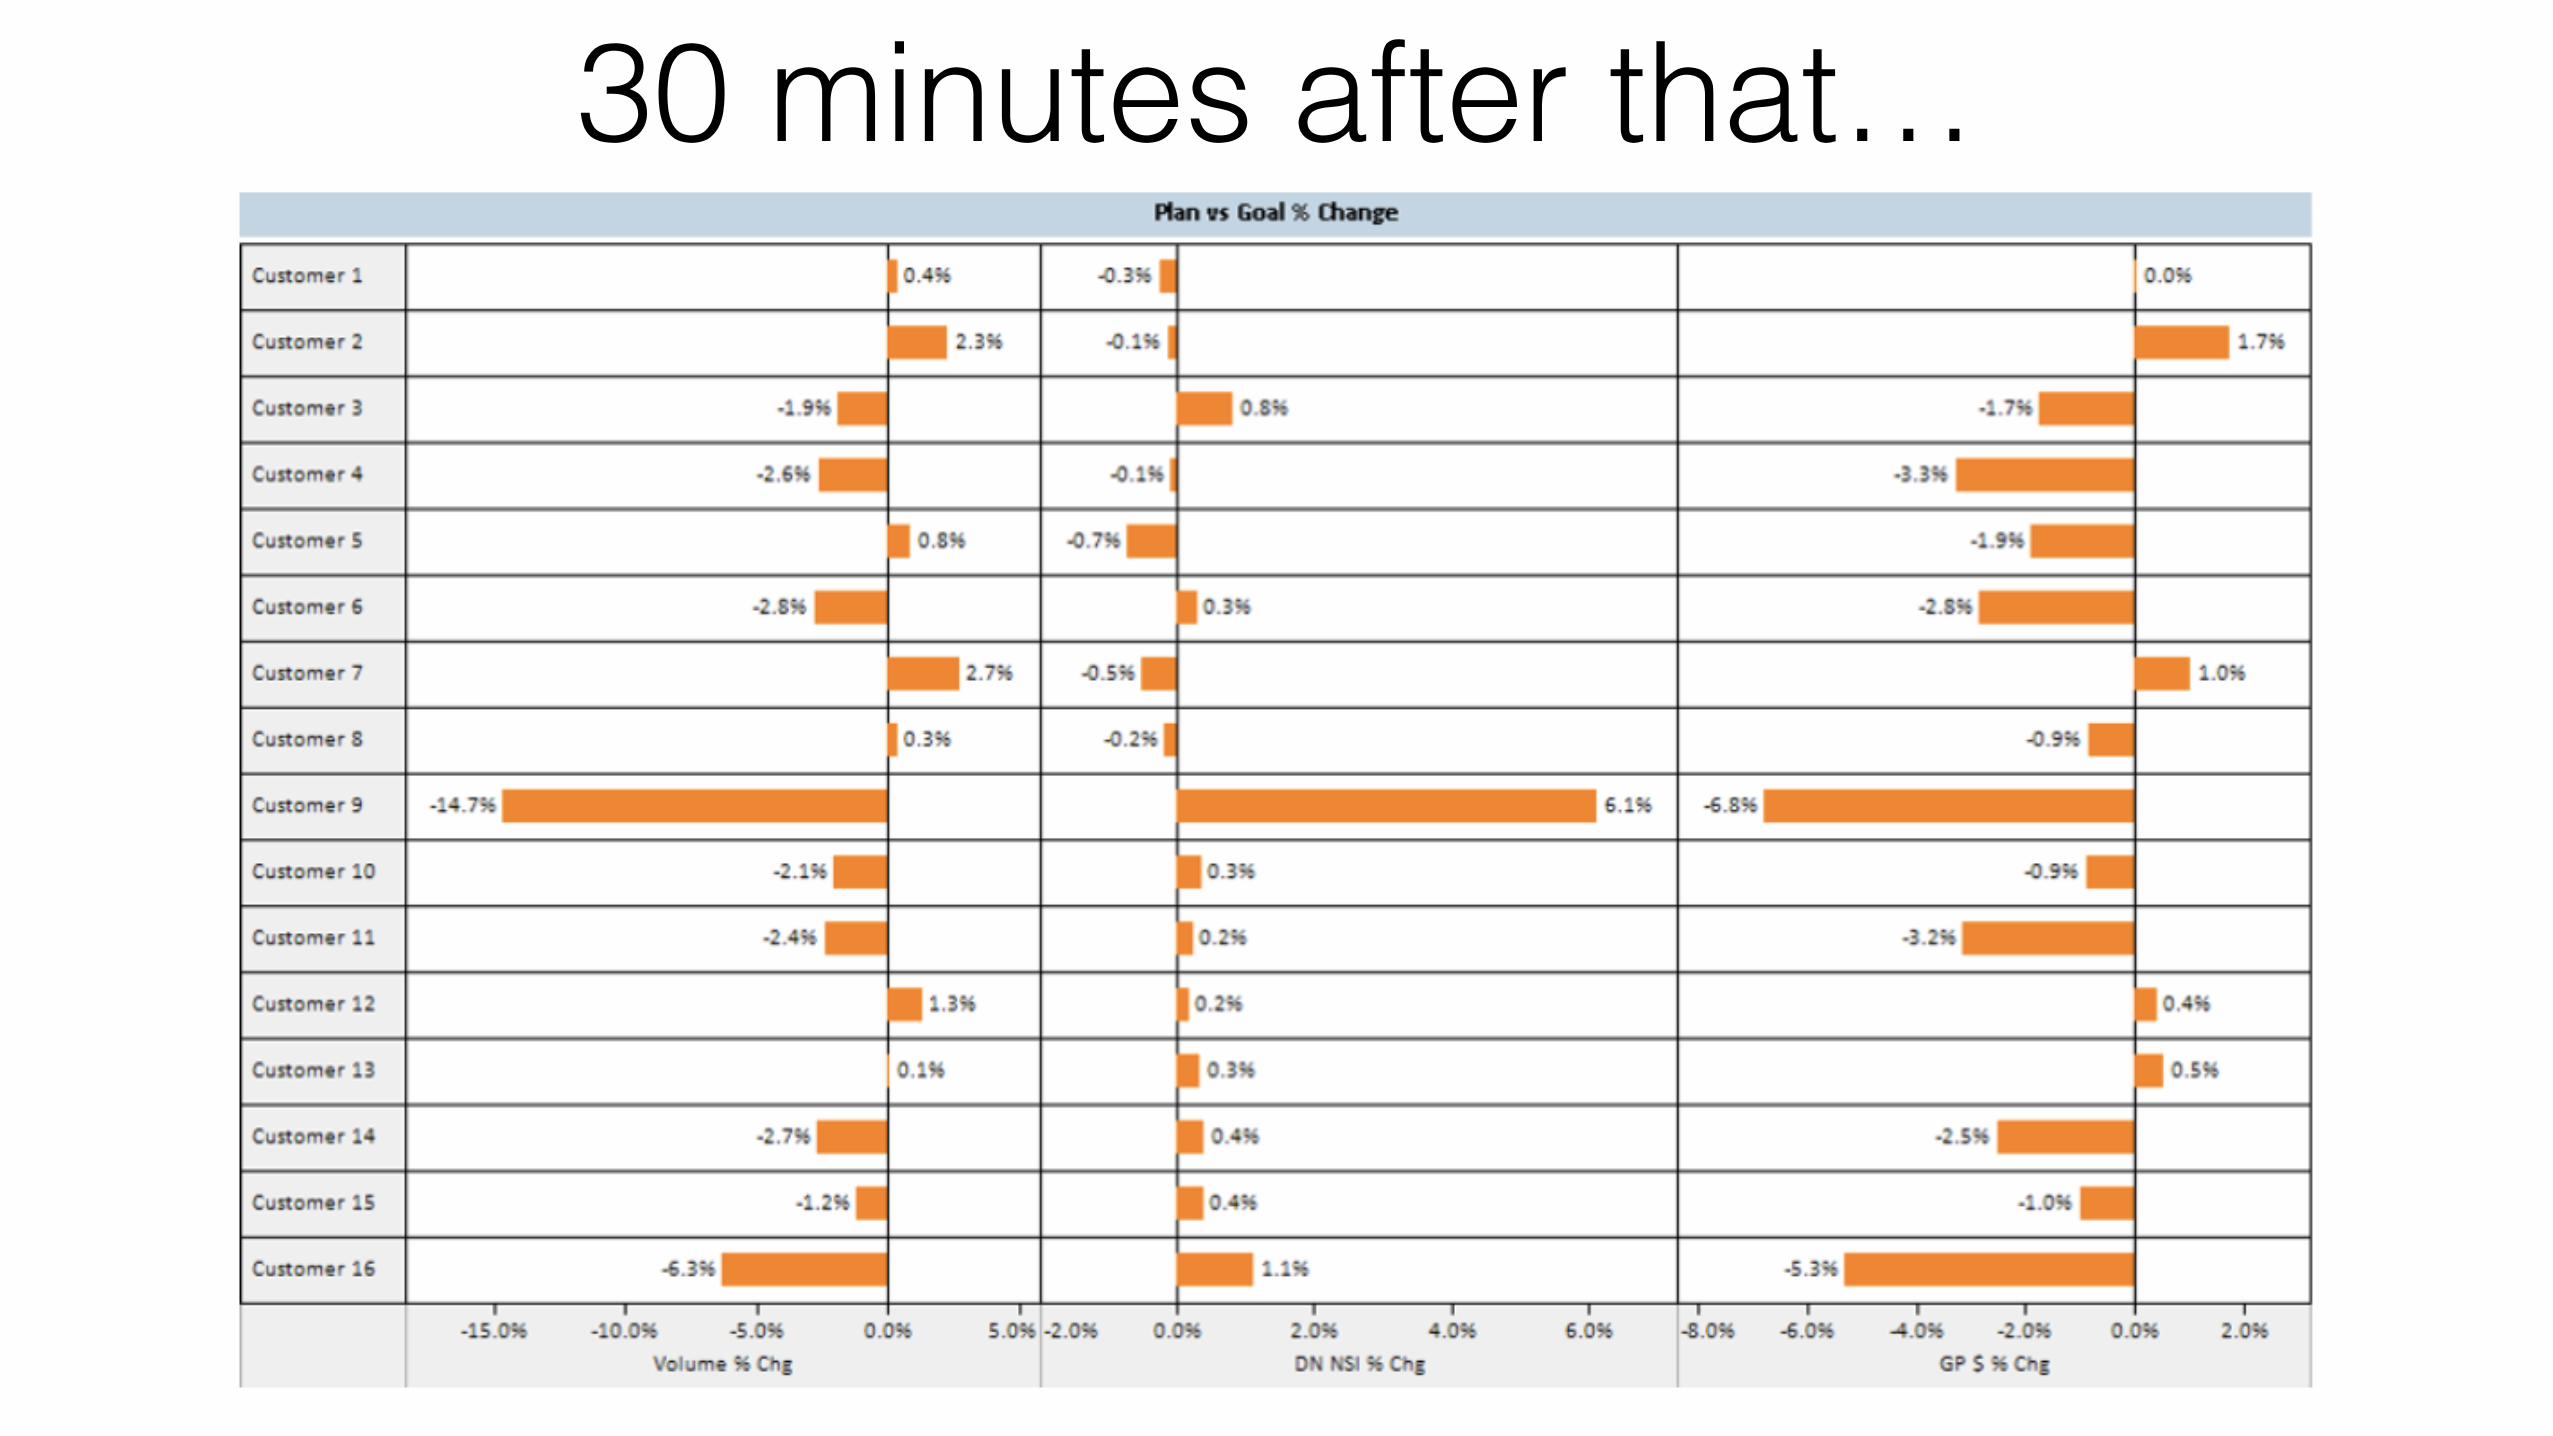
30 minutes after that…

The next day, we identified problems!

Teams were now accountable!


There are now 93 TUGs!


Who has been to Facebook?

Let’s go on a tour...


1.3 billion

4.5 billion

325 million per day

140 billion friend connections

What is big data to you?

Facebook’s Big Data
• 300 petabytes of data in Hive • 600 terabytes incoming daily

Size is relative

What works for Facebook might not work for you

“Our problem is not a lack of data, it’s our inability to make sense of what we have.”
Stephen Few: Tableau Customer Conference 2008

Our legacy reporting stack had major gaps
MicroStrategy
• Complex and hard to master ad-hoc environment
• Dependency on developers • Needed a full-time on-site trainer

In-house tools• Lack of sophisticated data visualization or
top-notch dashboarding • Needed to be supported by in-house
engineers • Upgrades have been painful
Why did we need another tool?

What were we looking for?1. Self-service dashboards and analysis 2. Remove dependency on the BI team 3. Needed an intuitive tool for data
discovery 4. Security 5. Increase speed of development


What’s worked and what hasn’t?

We started with a multi-tenancy model…
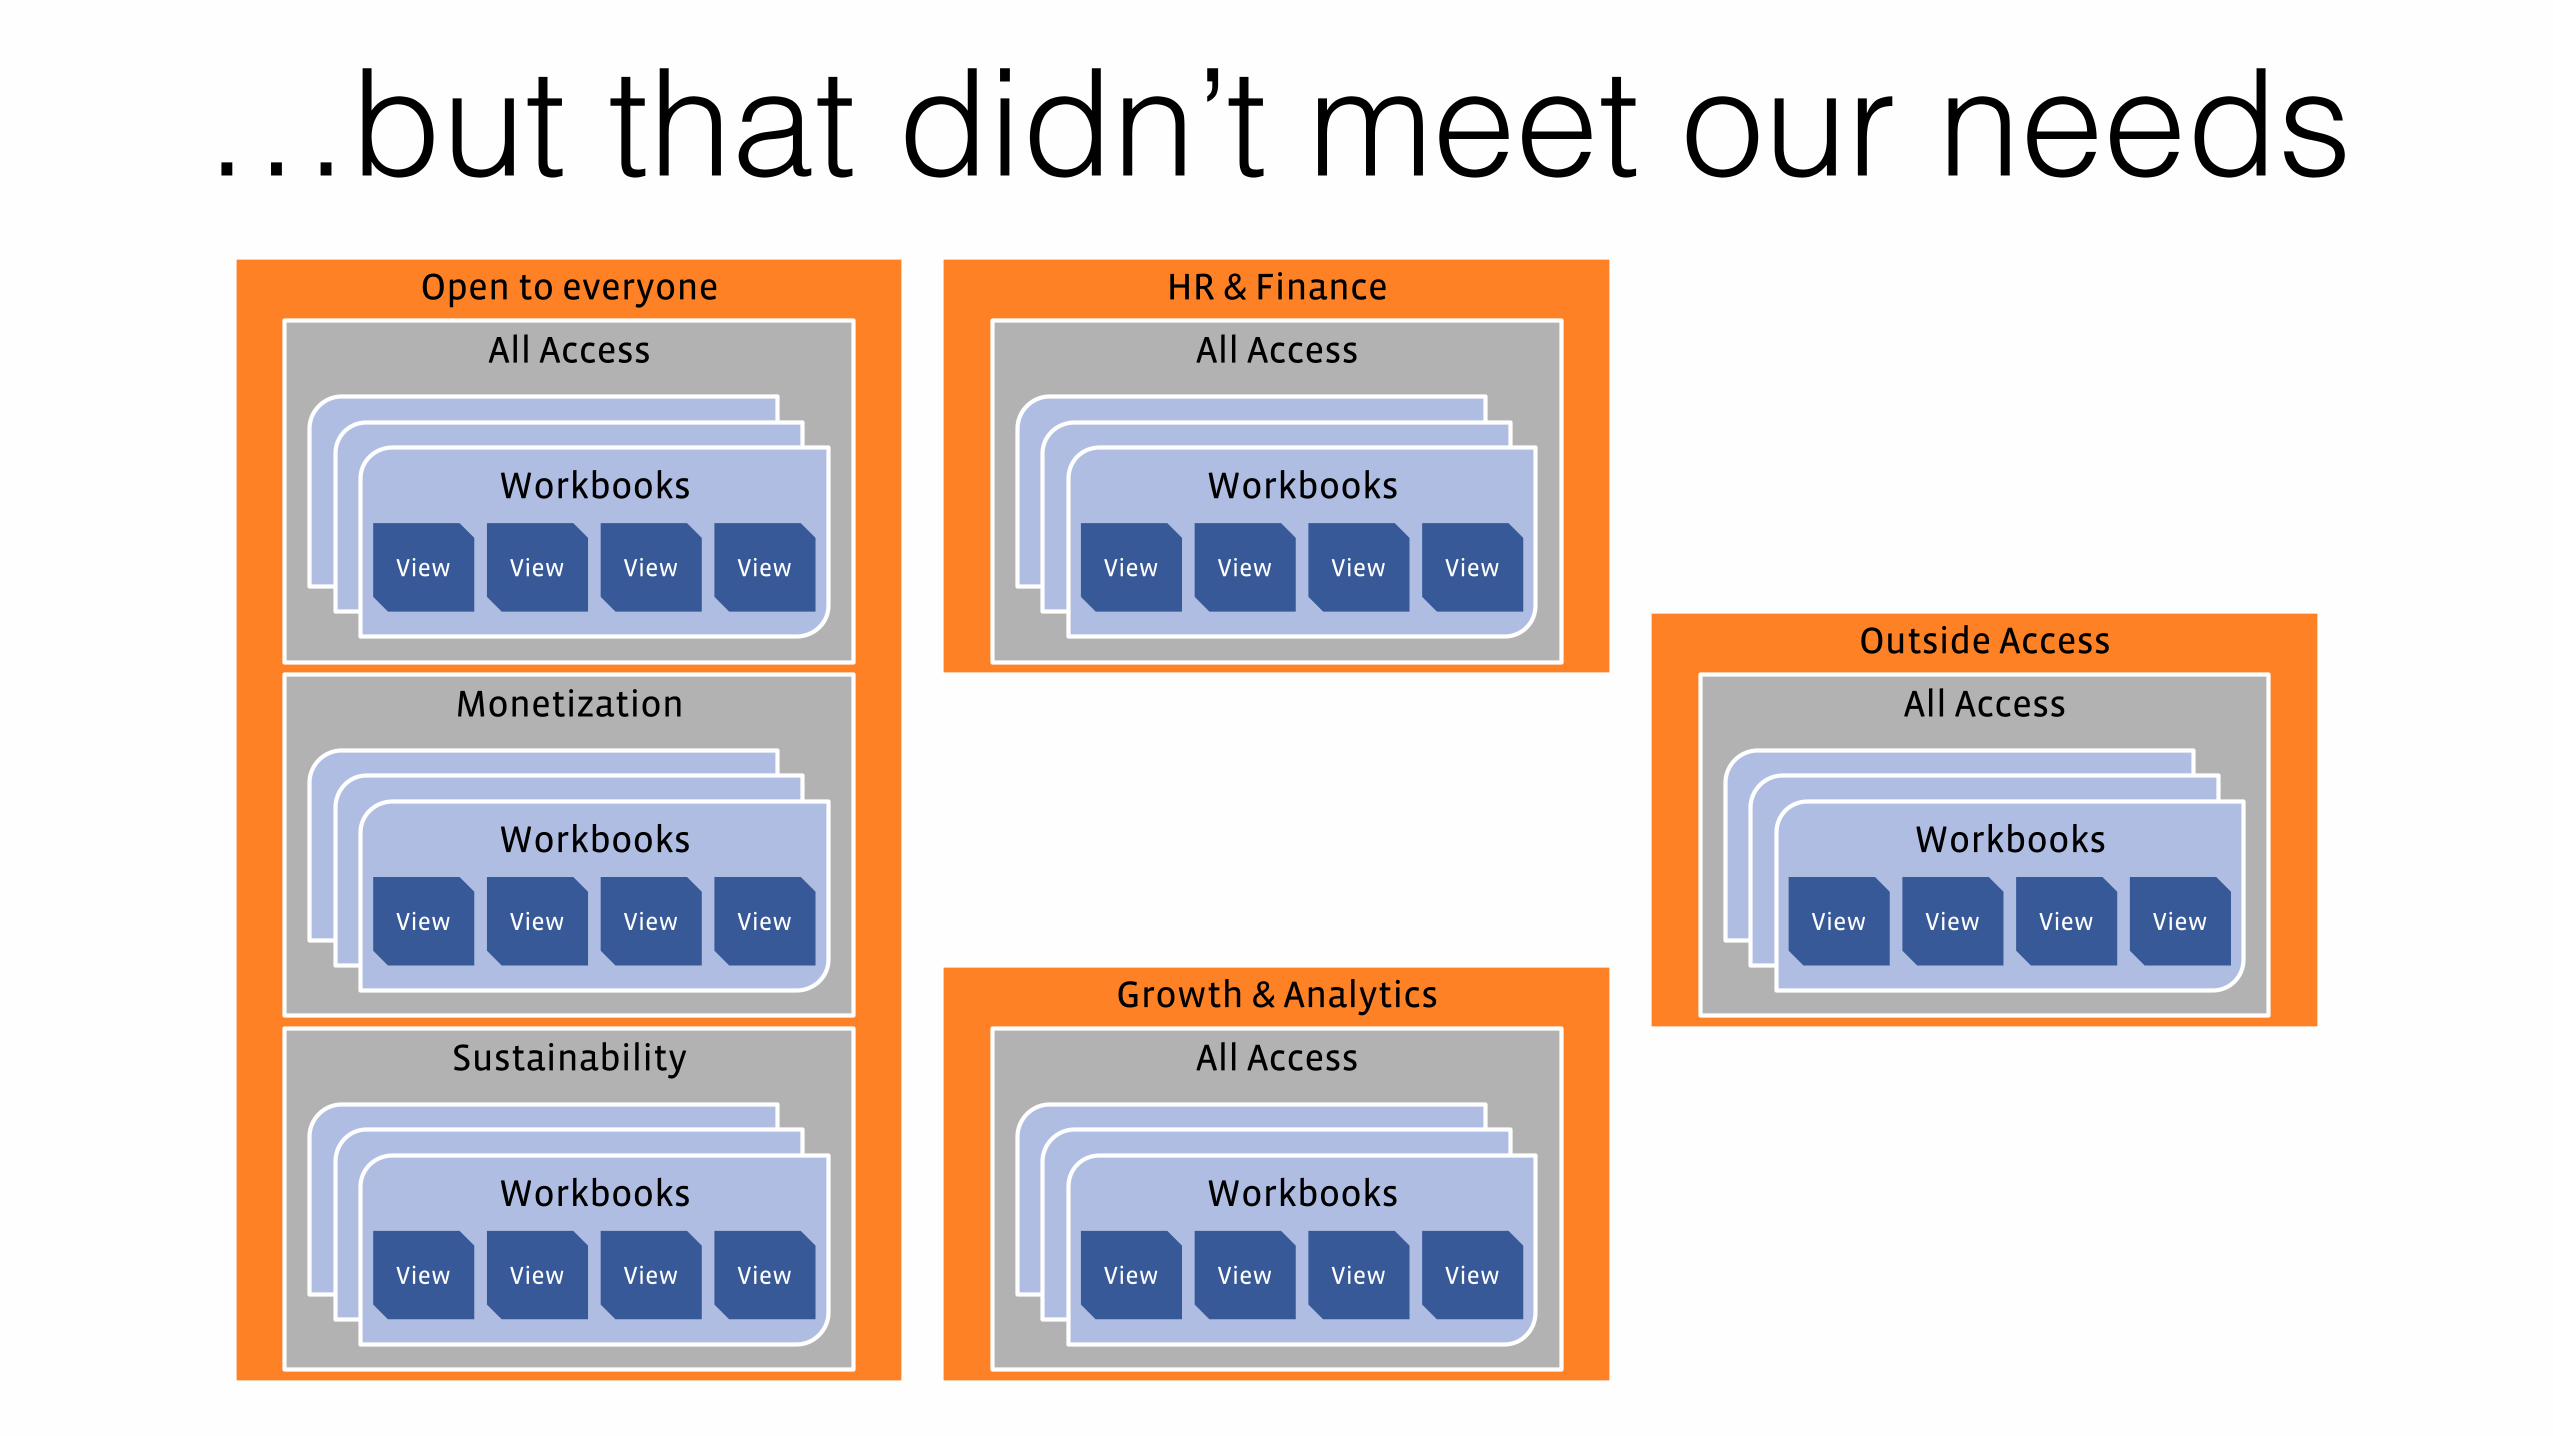
…but that didn’t meet our needsOpen to everyone
All Access
Workbooks
View View View View
Monetization
Workbooks
View View View View
Sustainability
Workbooks
View View View View
HR & Finance
All Access
Workbooks
View View View View
Outside Access
All Access
Workbooks
View View View View
Growth & Analytics
All Access
Workbooks
View View View View
Tableau is available to EVERYONE

And the growth has been phenomenal
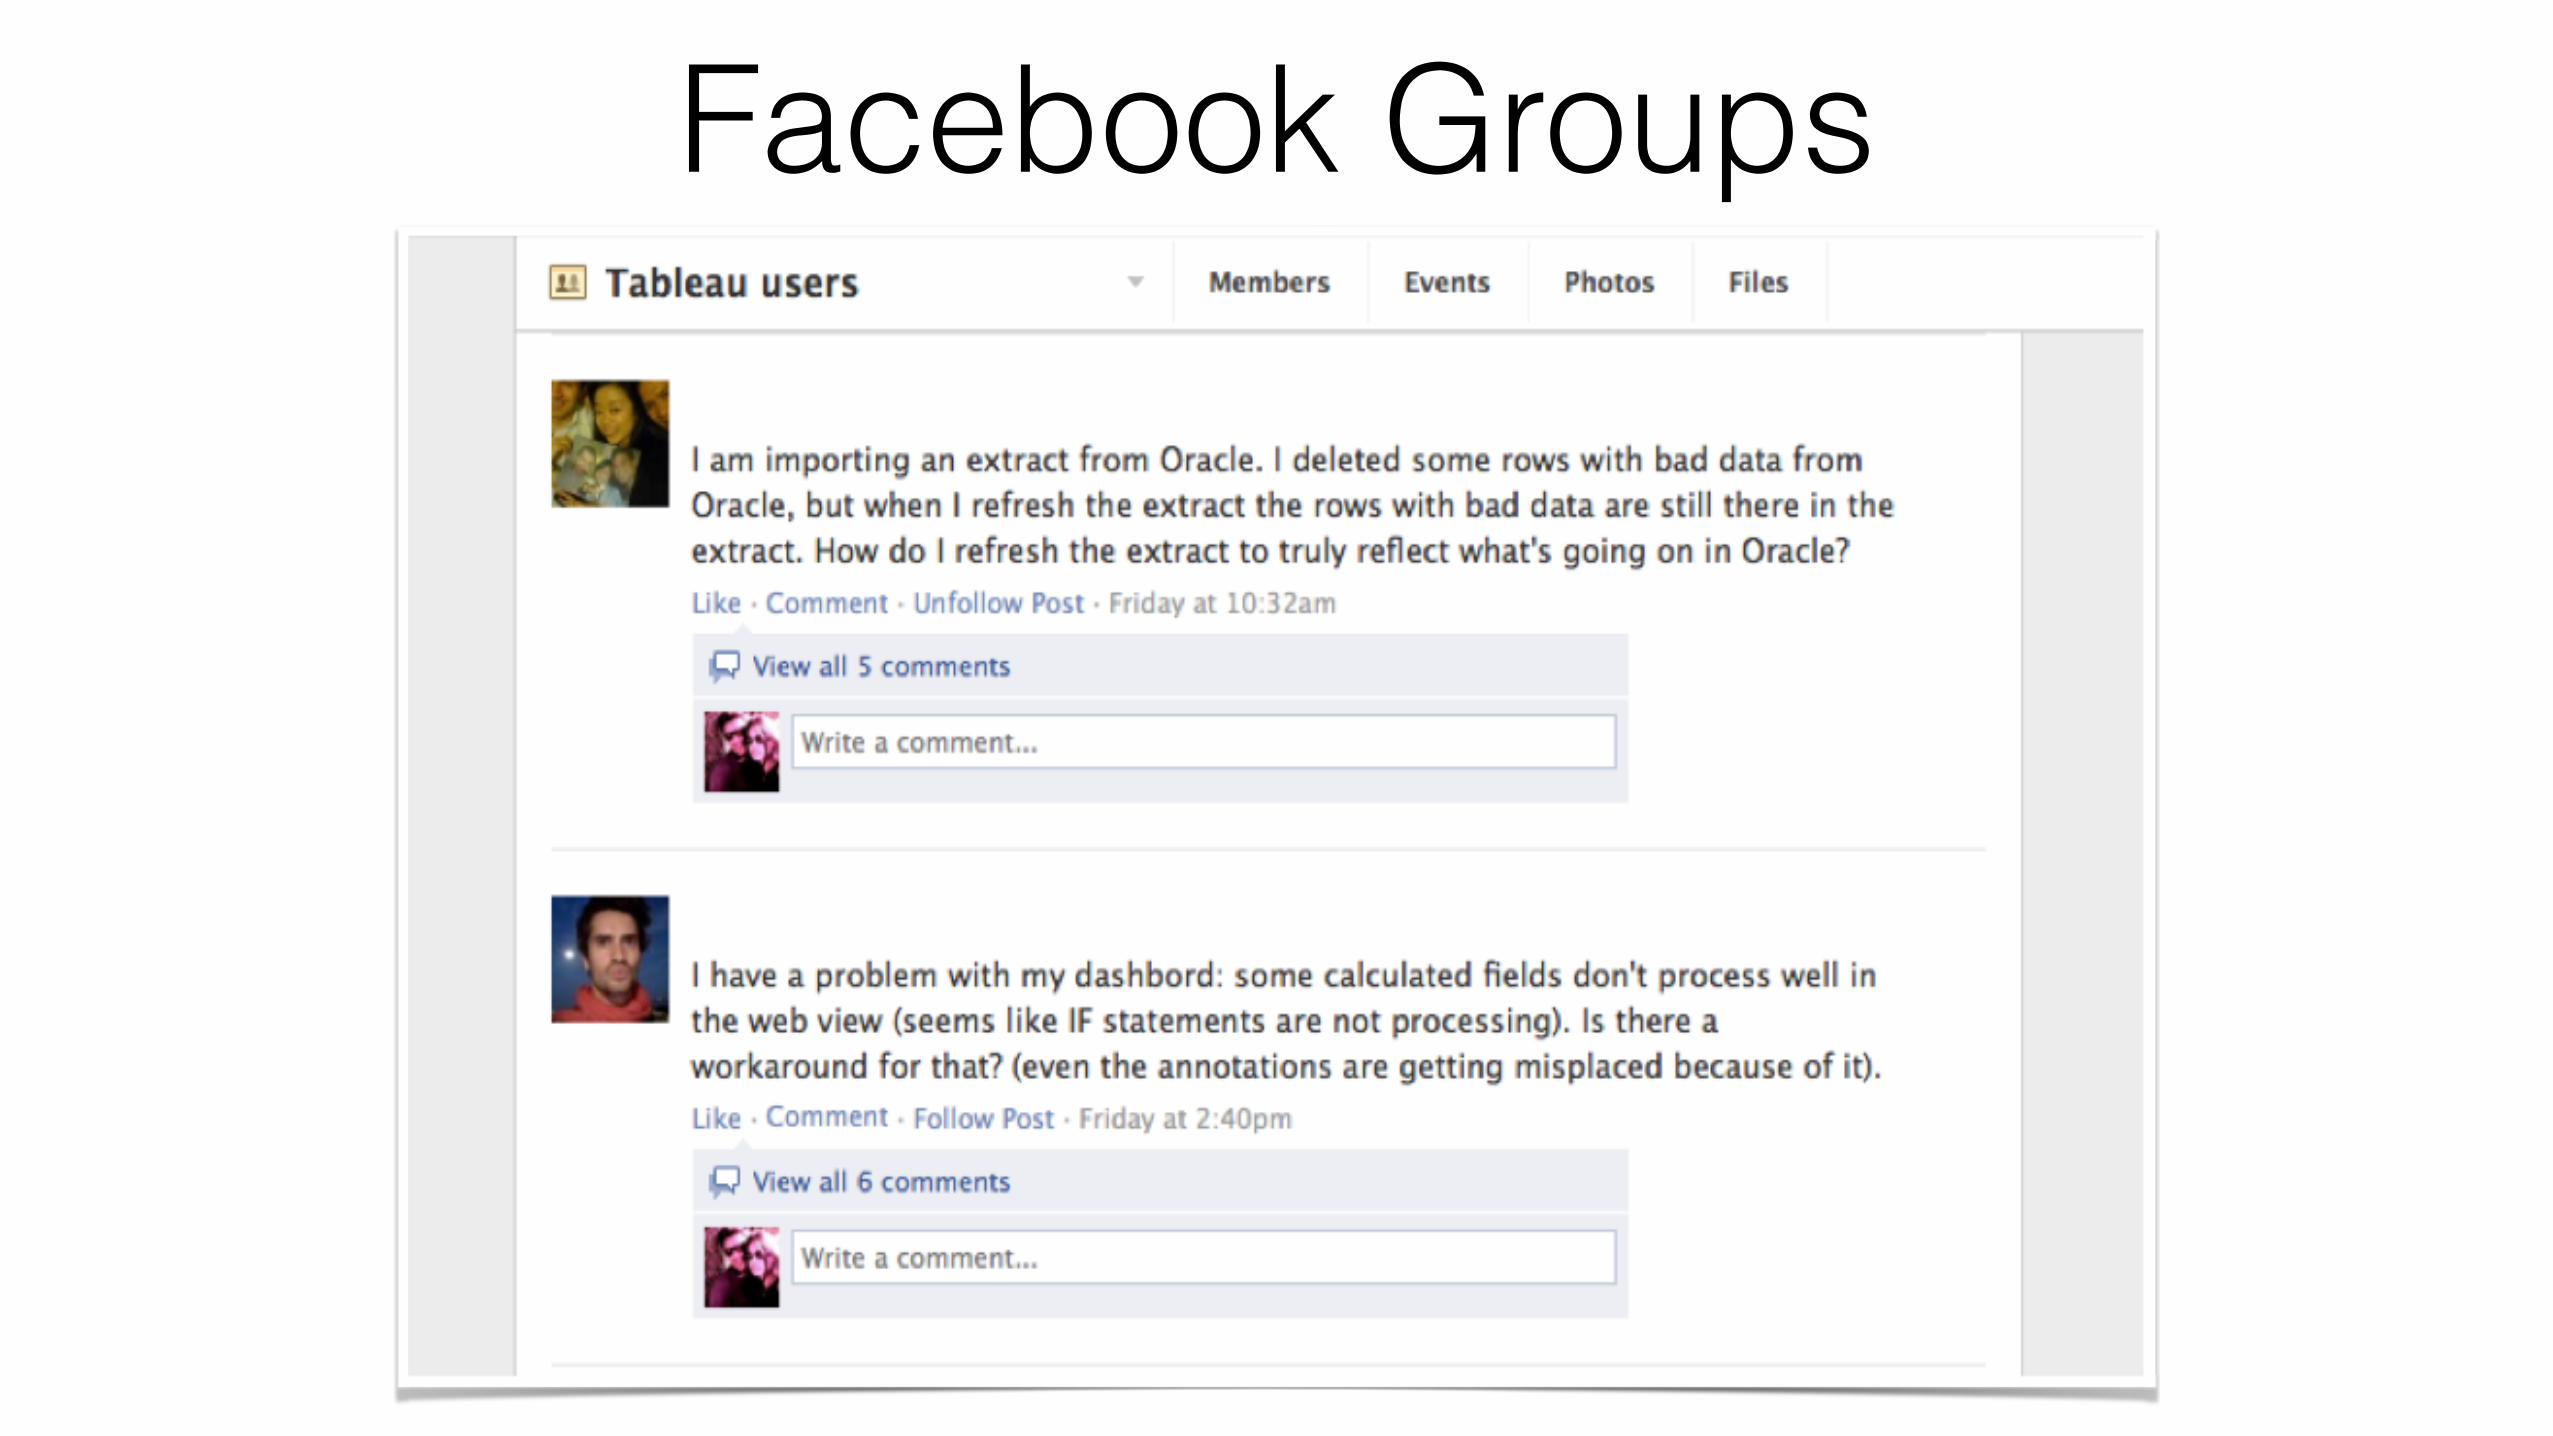
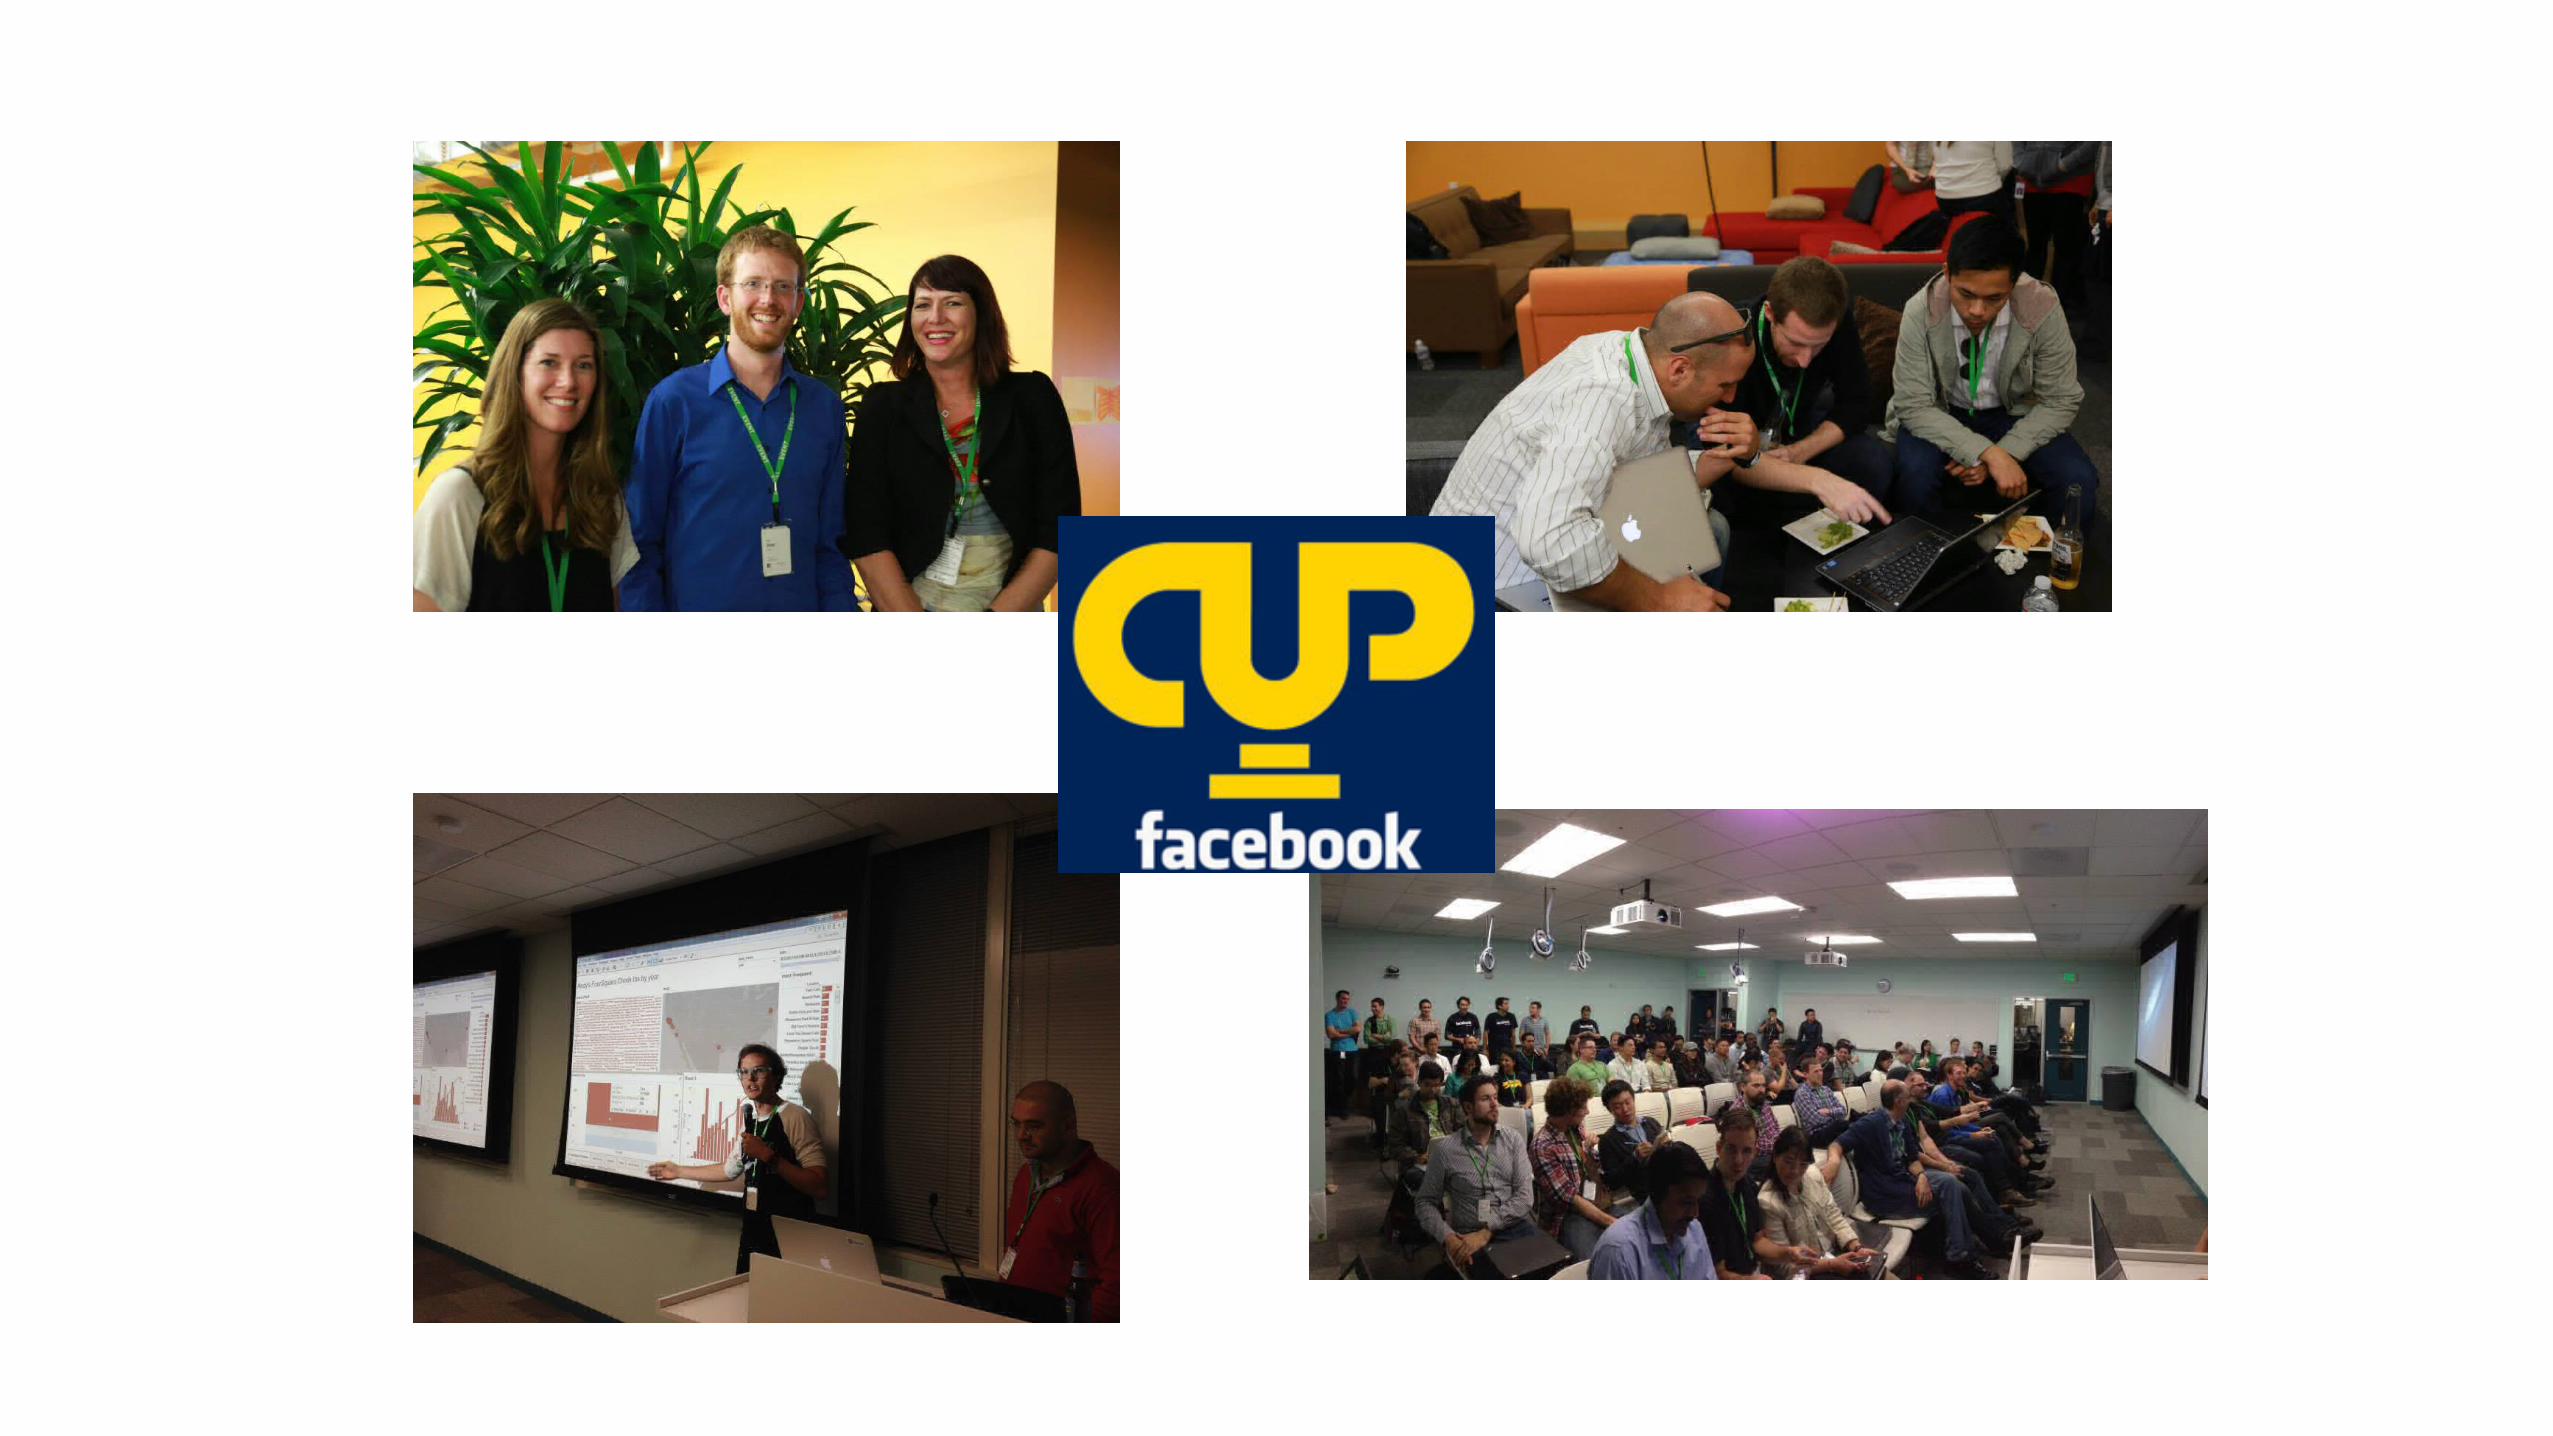
Facebook Groups
Set the foundation with data viz best practices

Regular, hands-on Tableau training sessions

We invite industry experts

Hackathons

We make Tableau work for us
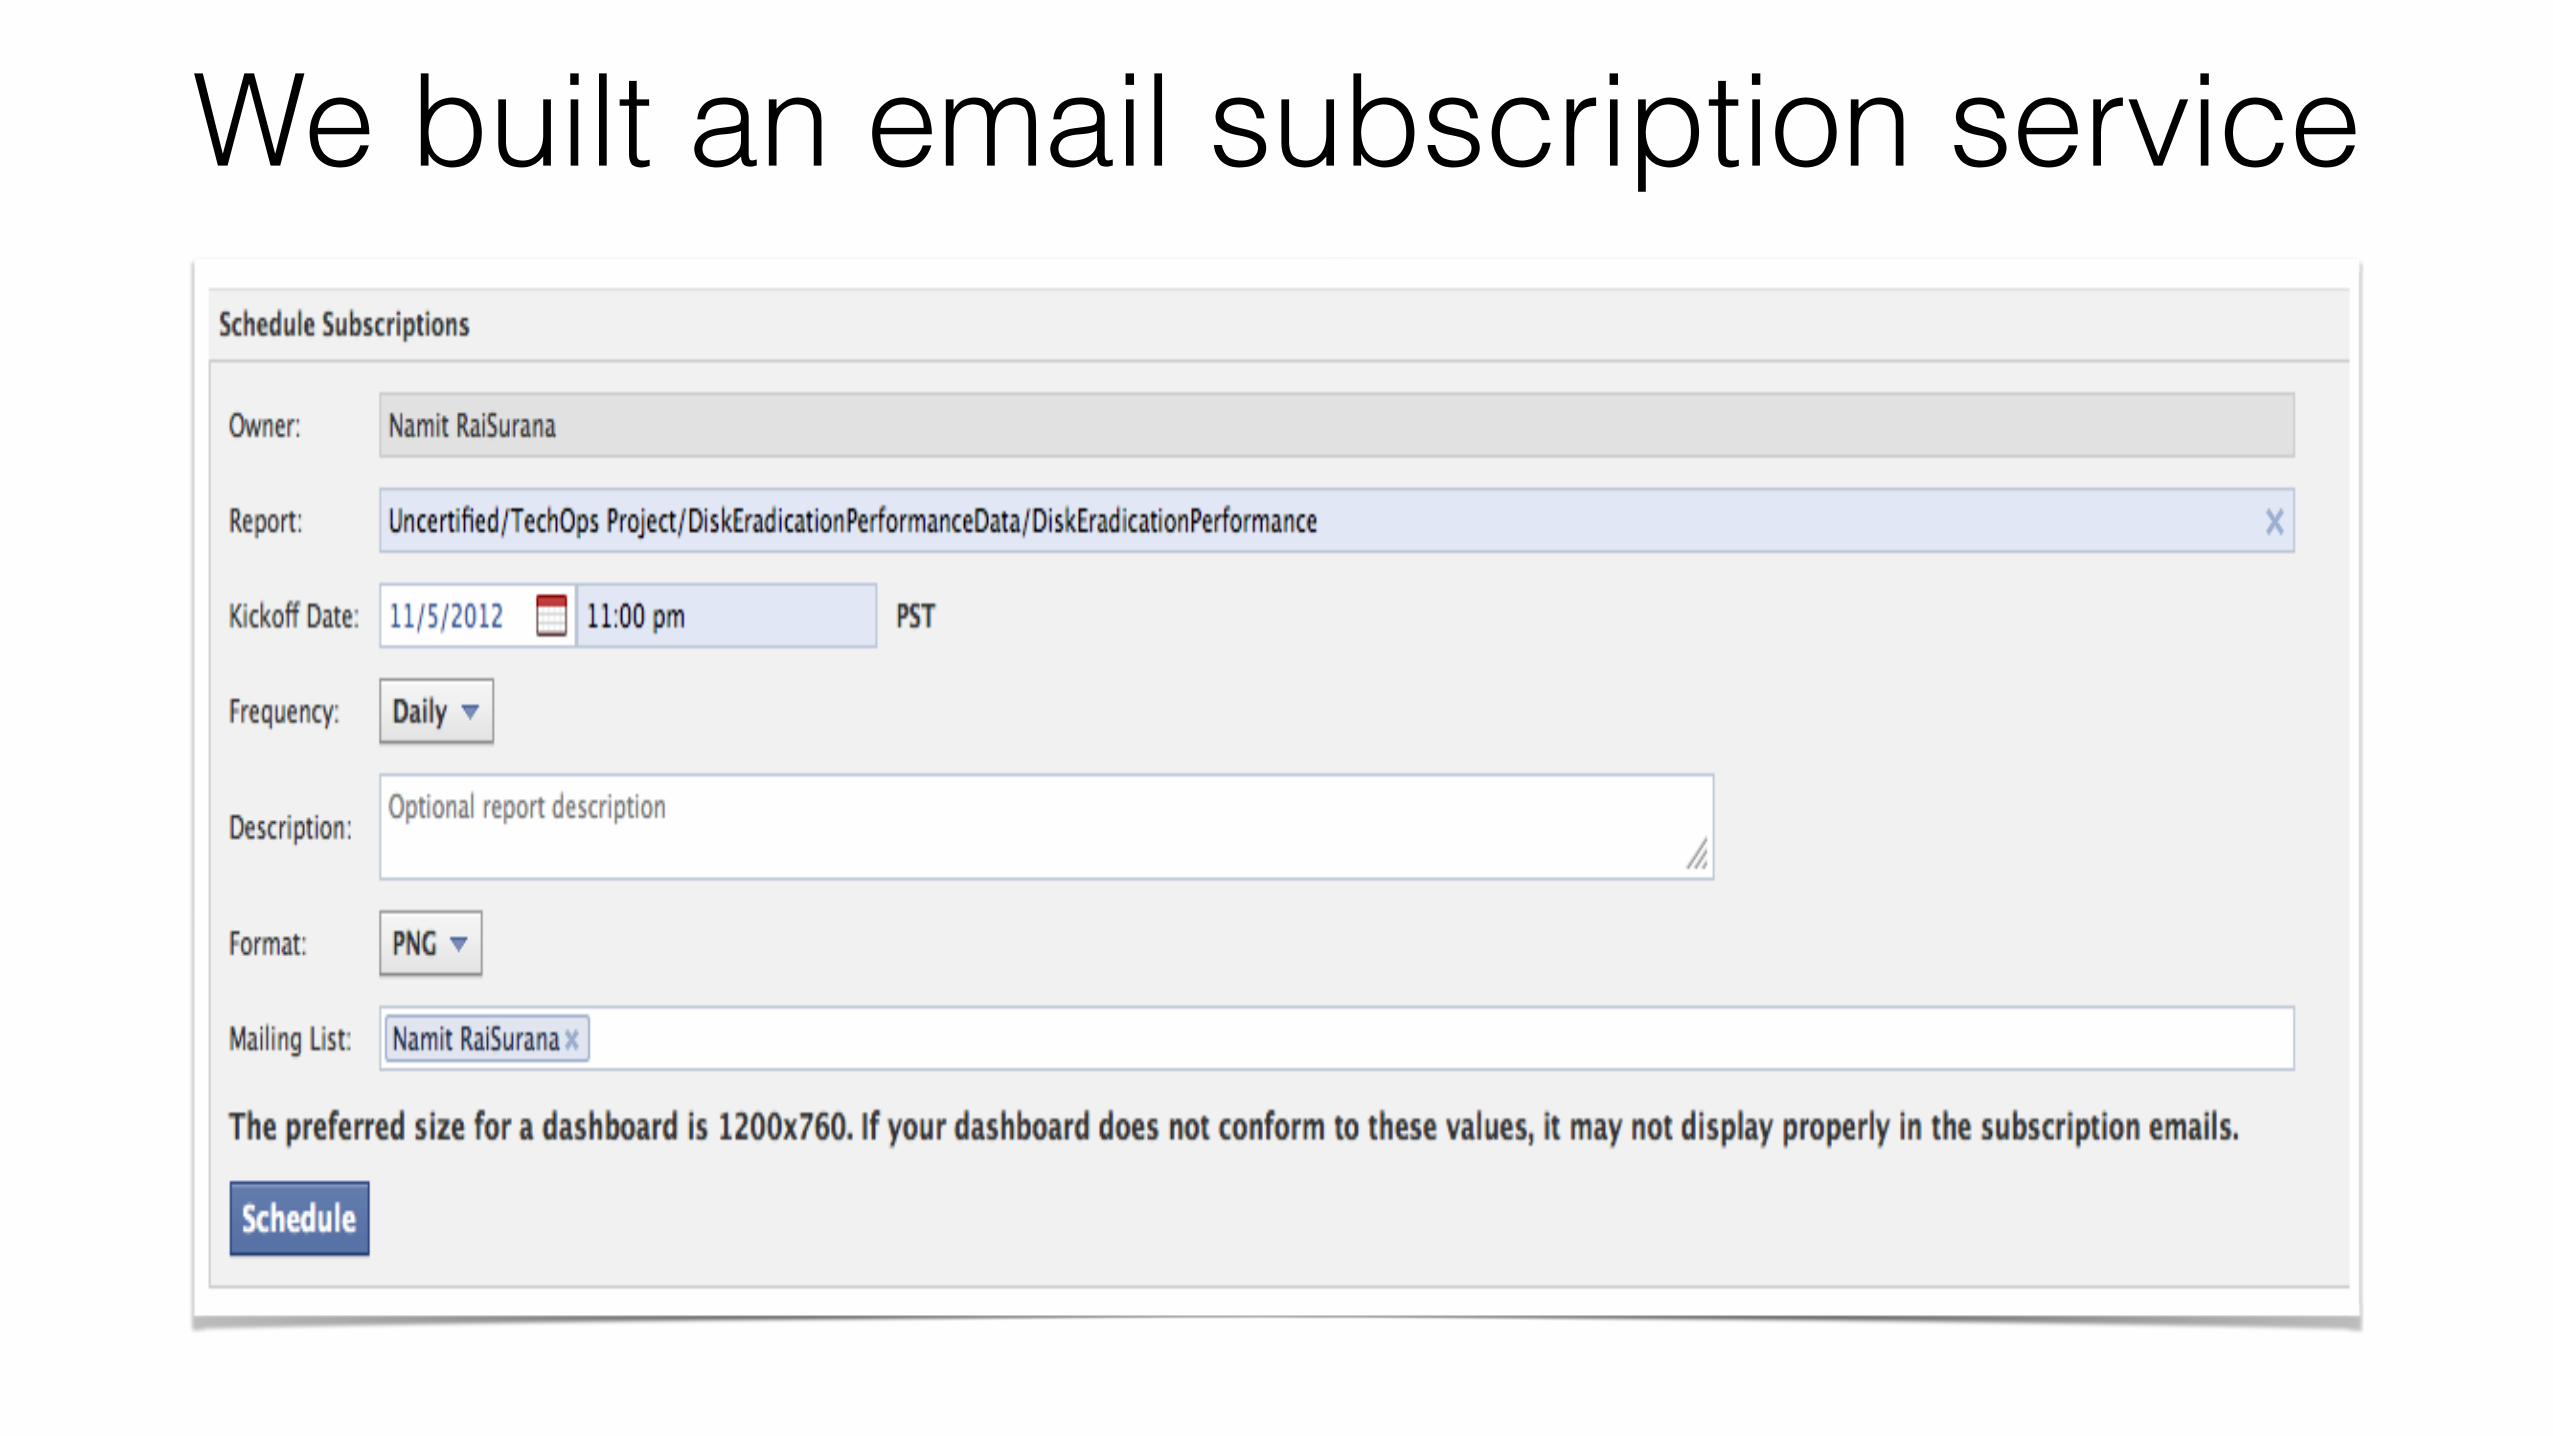
We built an email subscription service
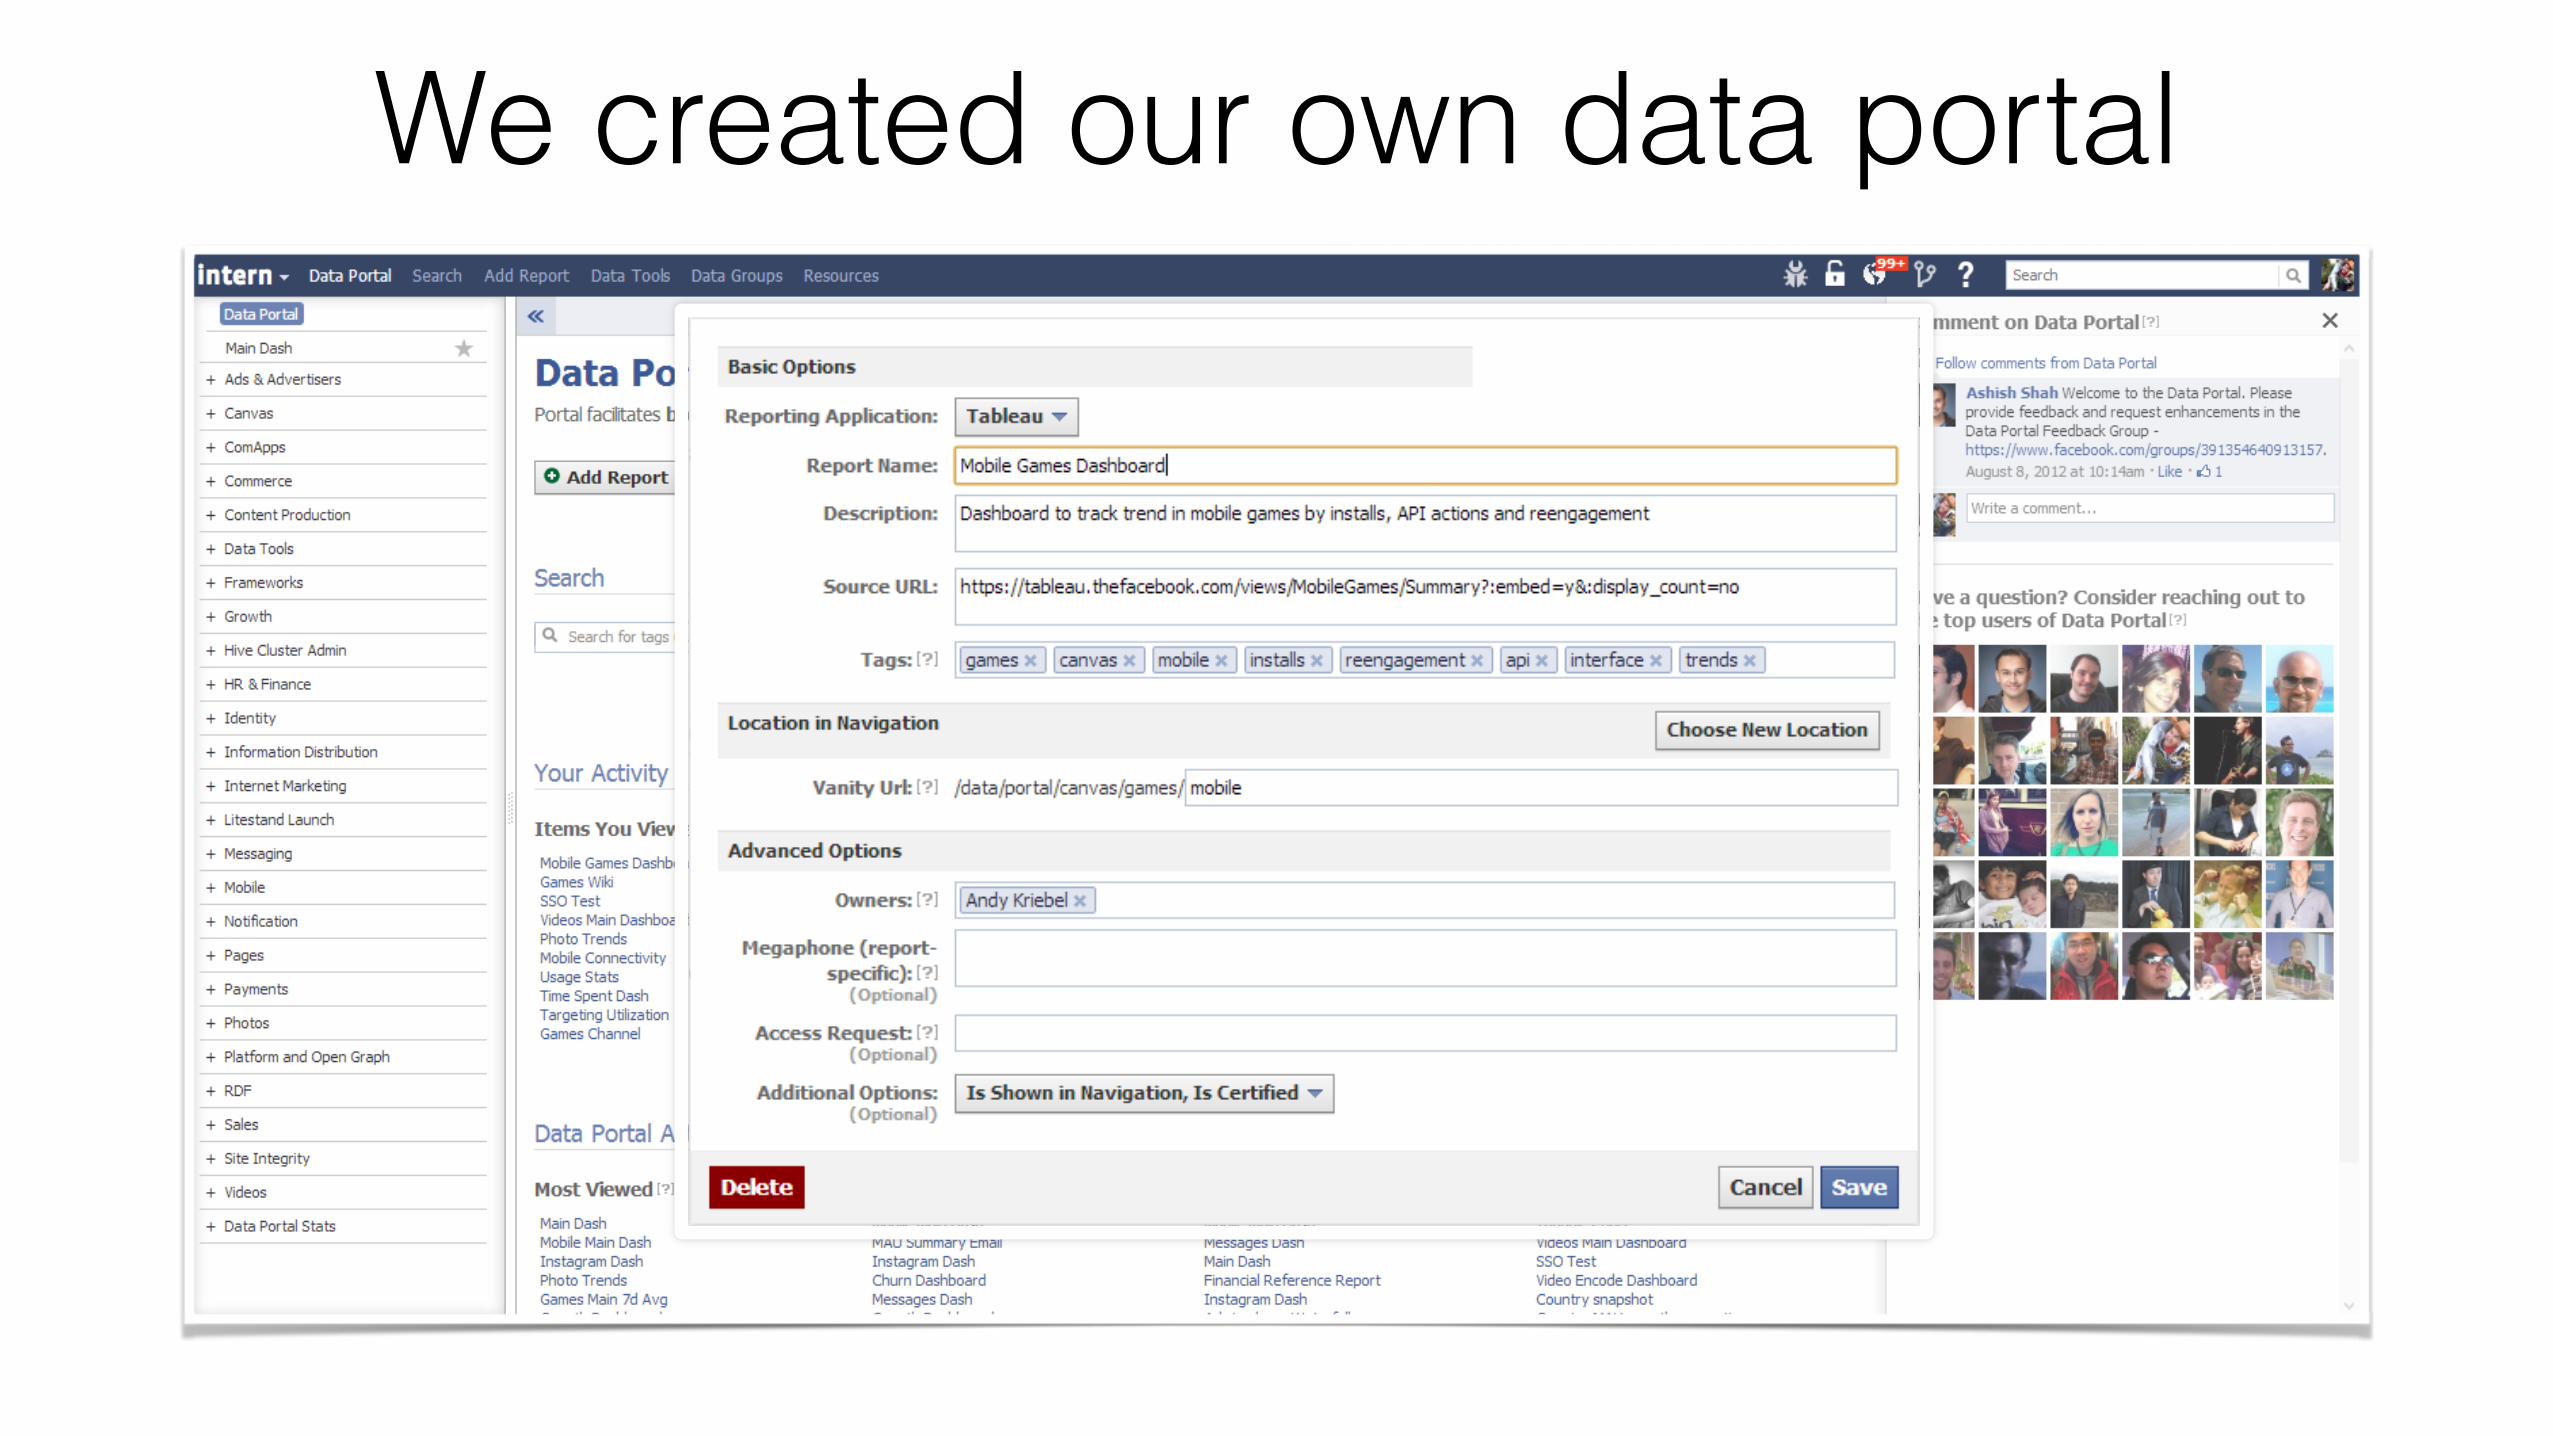
We created our own data portal

BI is no longer a roadblock
We tap into the postgres database

Users know the status of their extracts
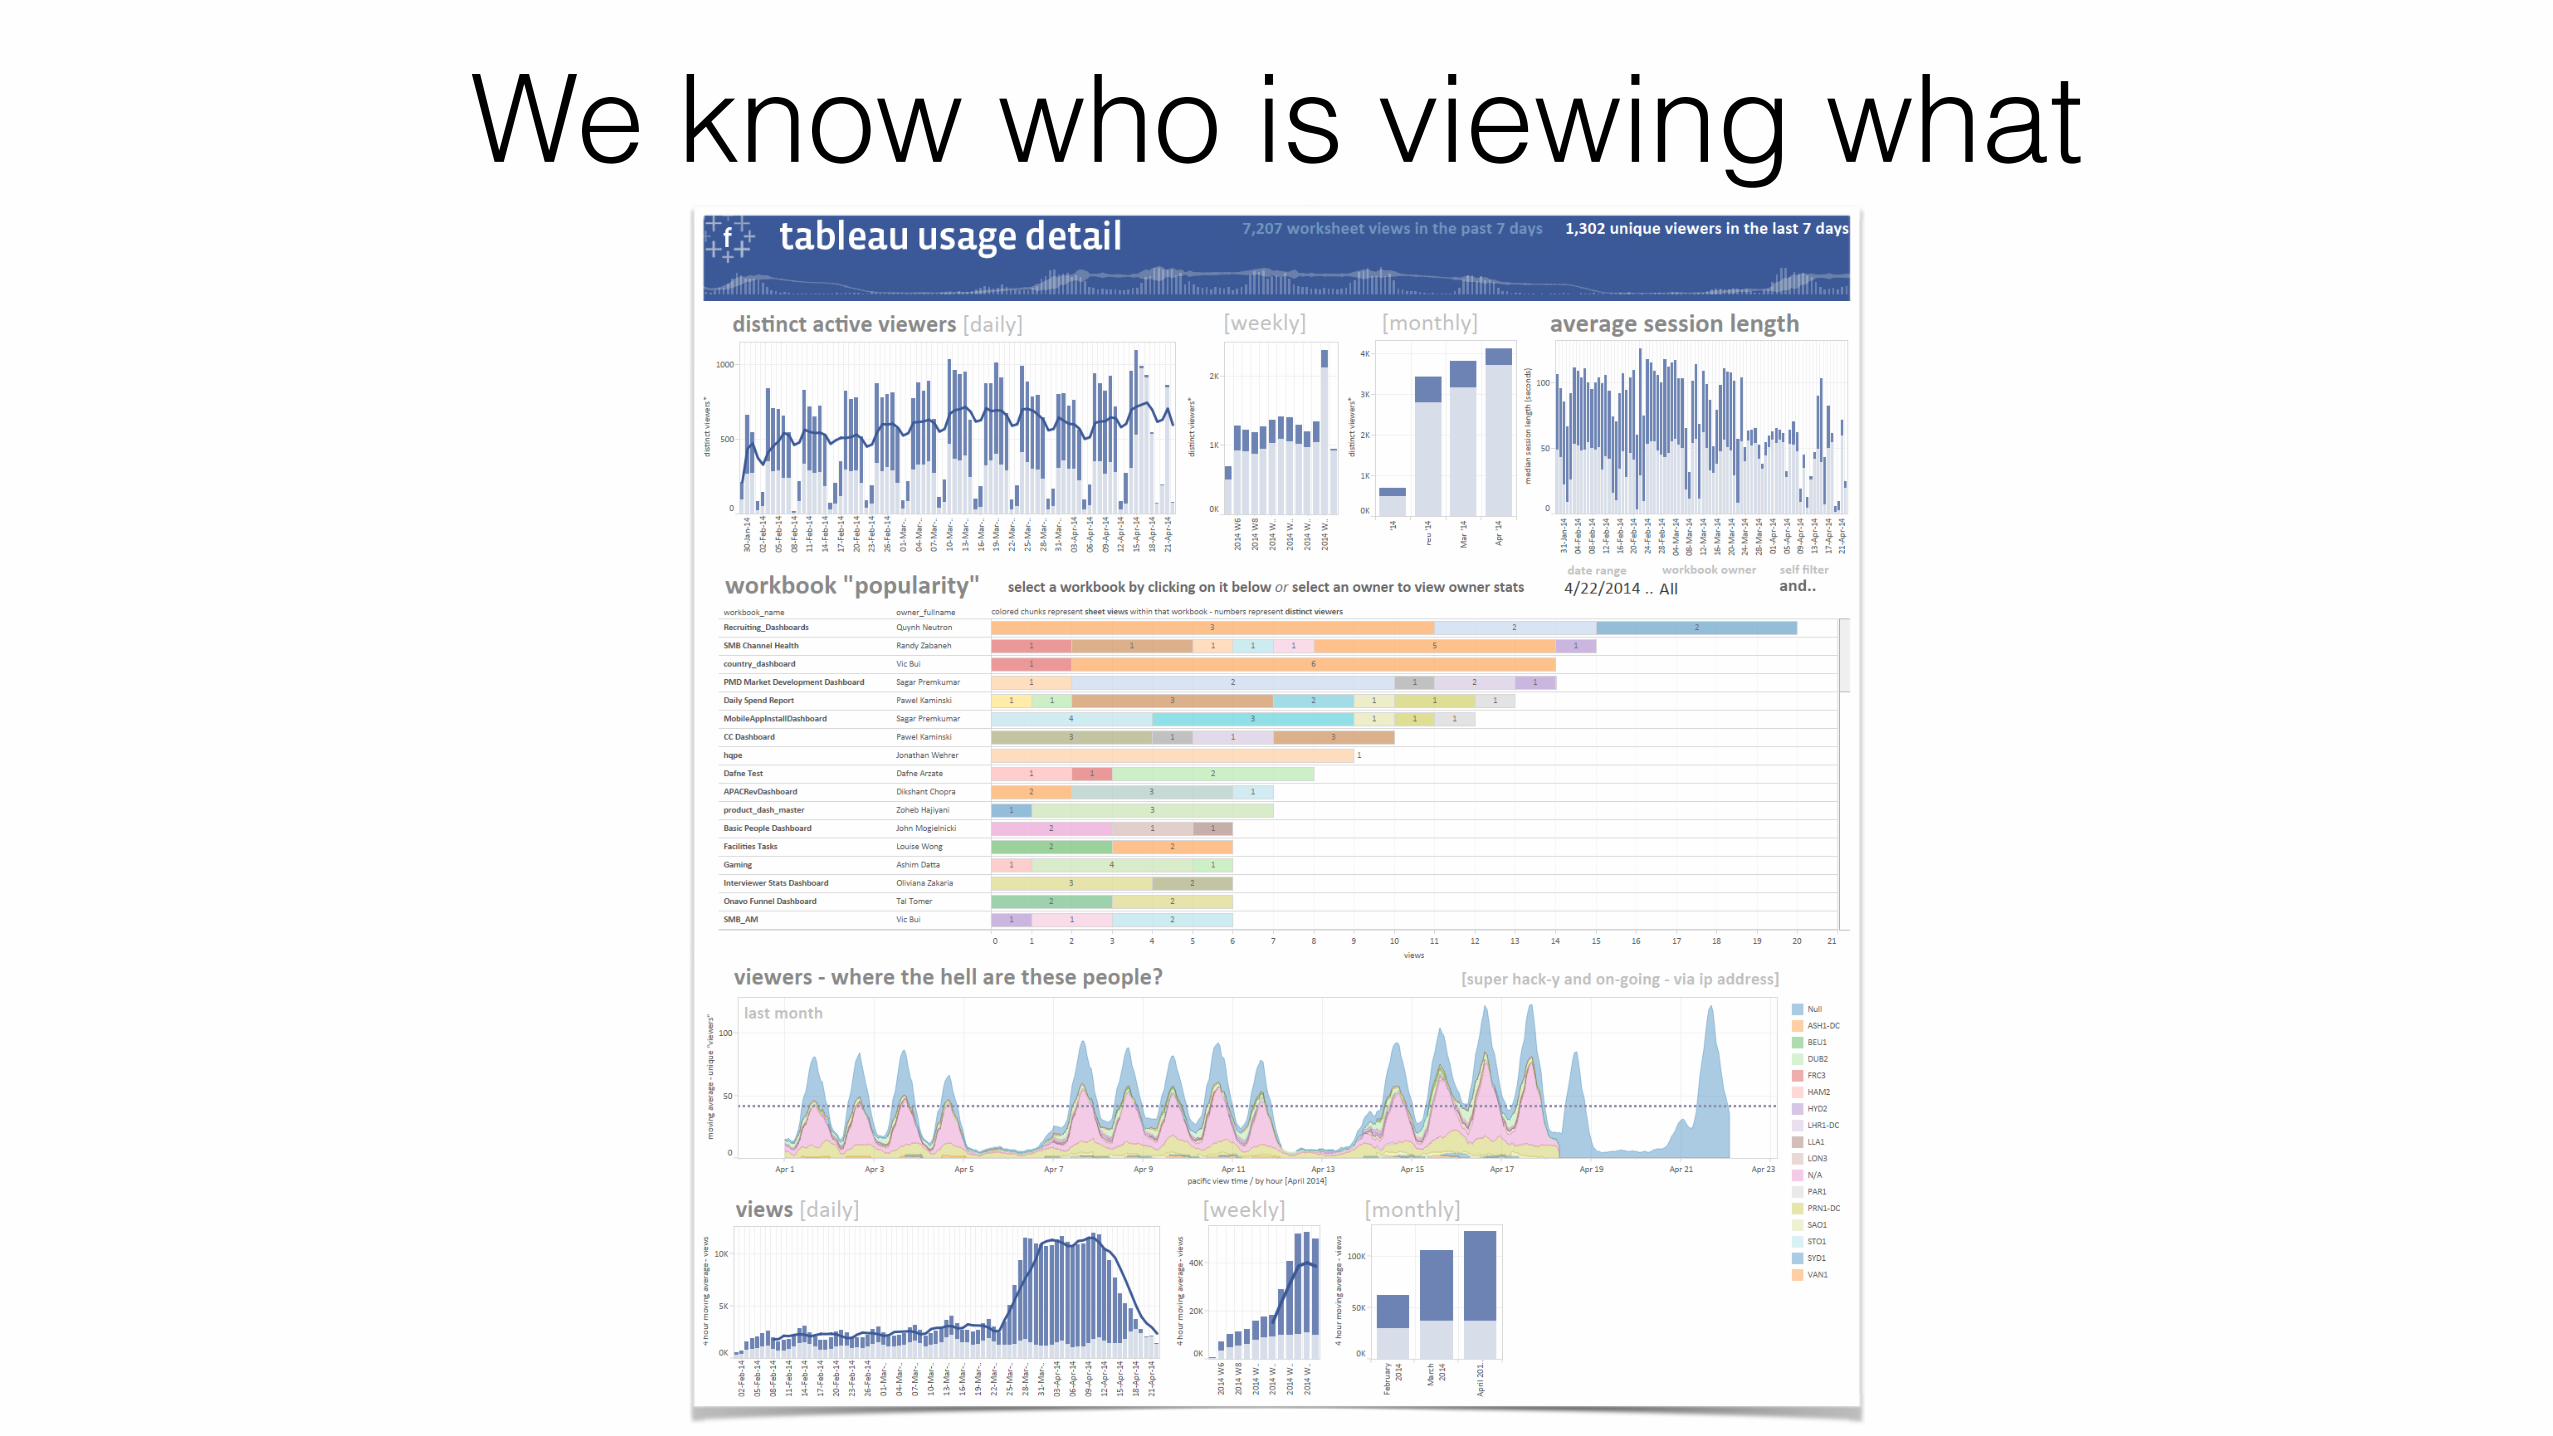
We know who is viewing what

We trigger extracts only after data lands
Datacamp


VizPlateShowcase Tips & Tricks
News & Announcements

How can we support so many people?

The Architects

The Data Viz Team

We have some challenges

Dashboards vs. Analytics

Performance & scalability

Vertica implementation

Growing our team
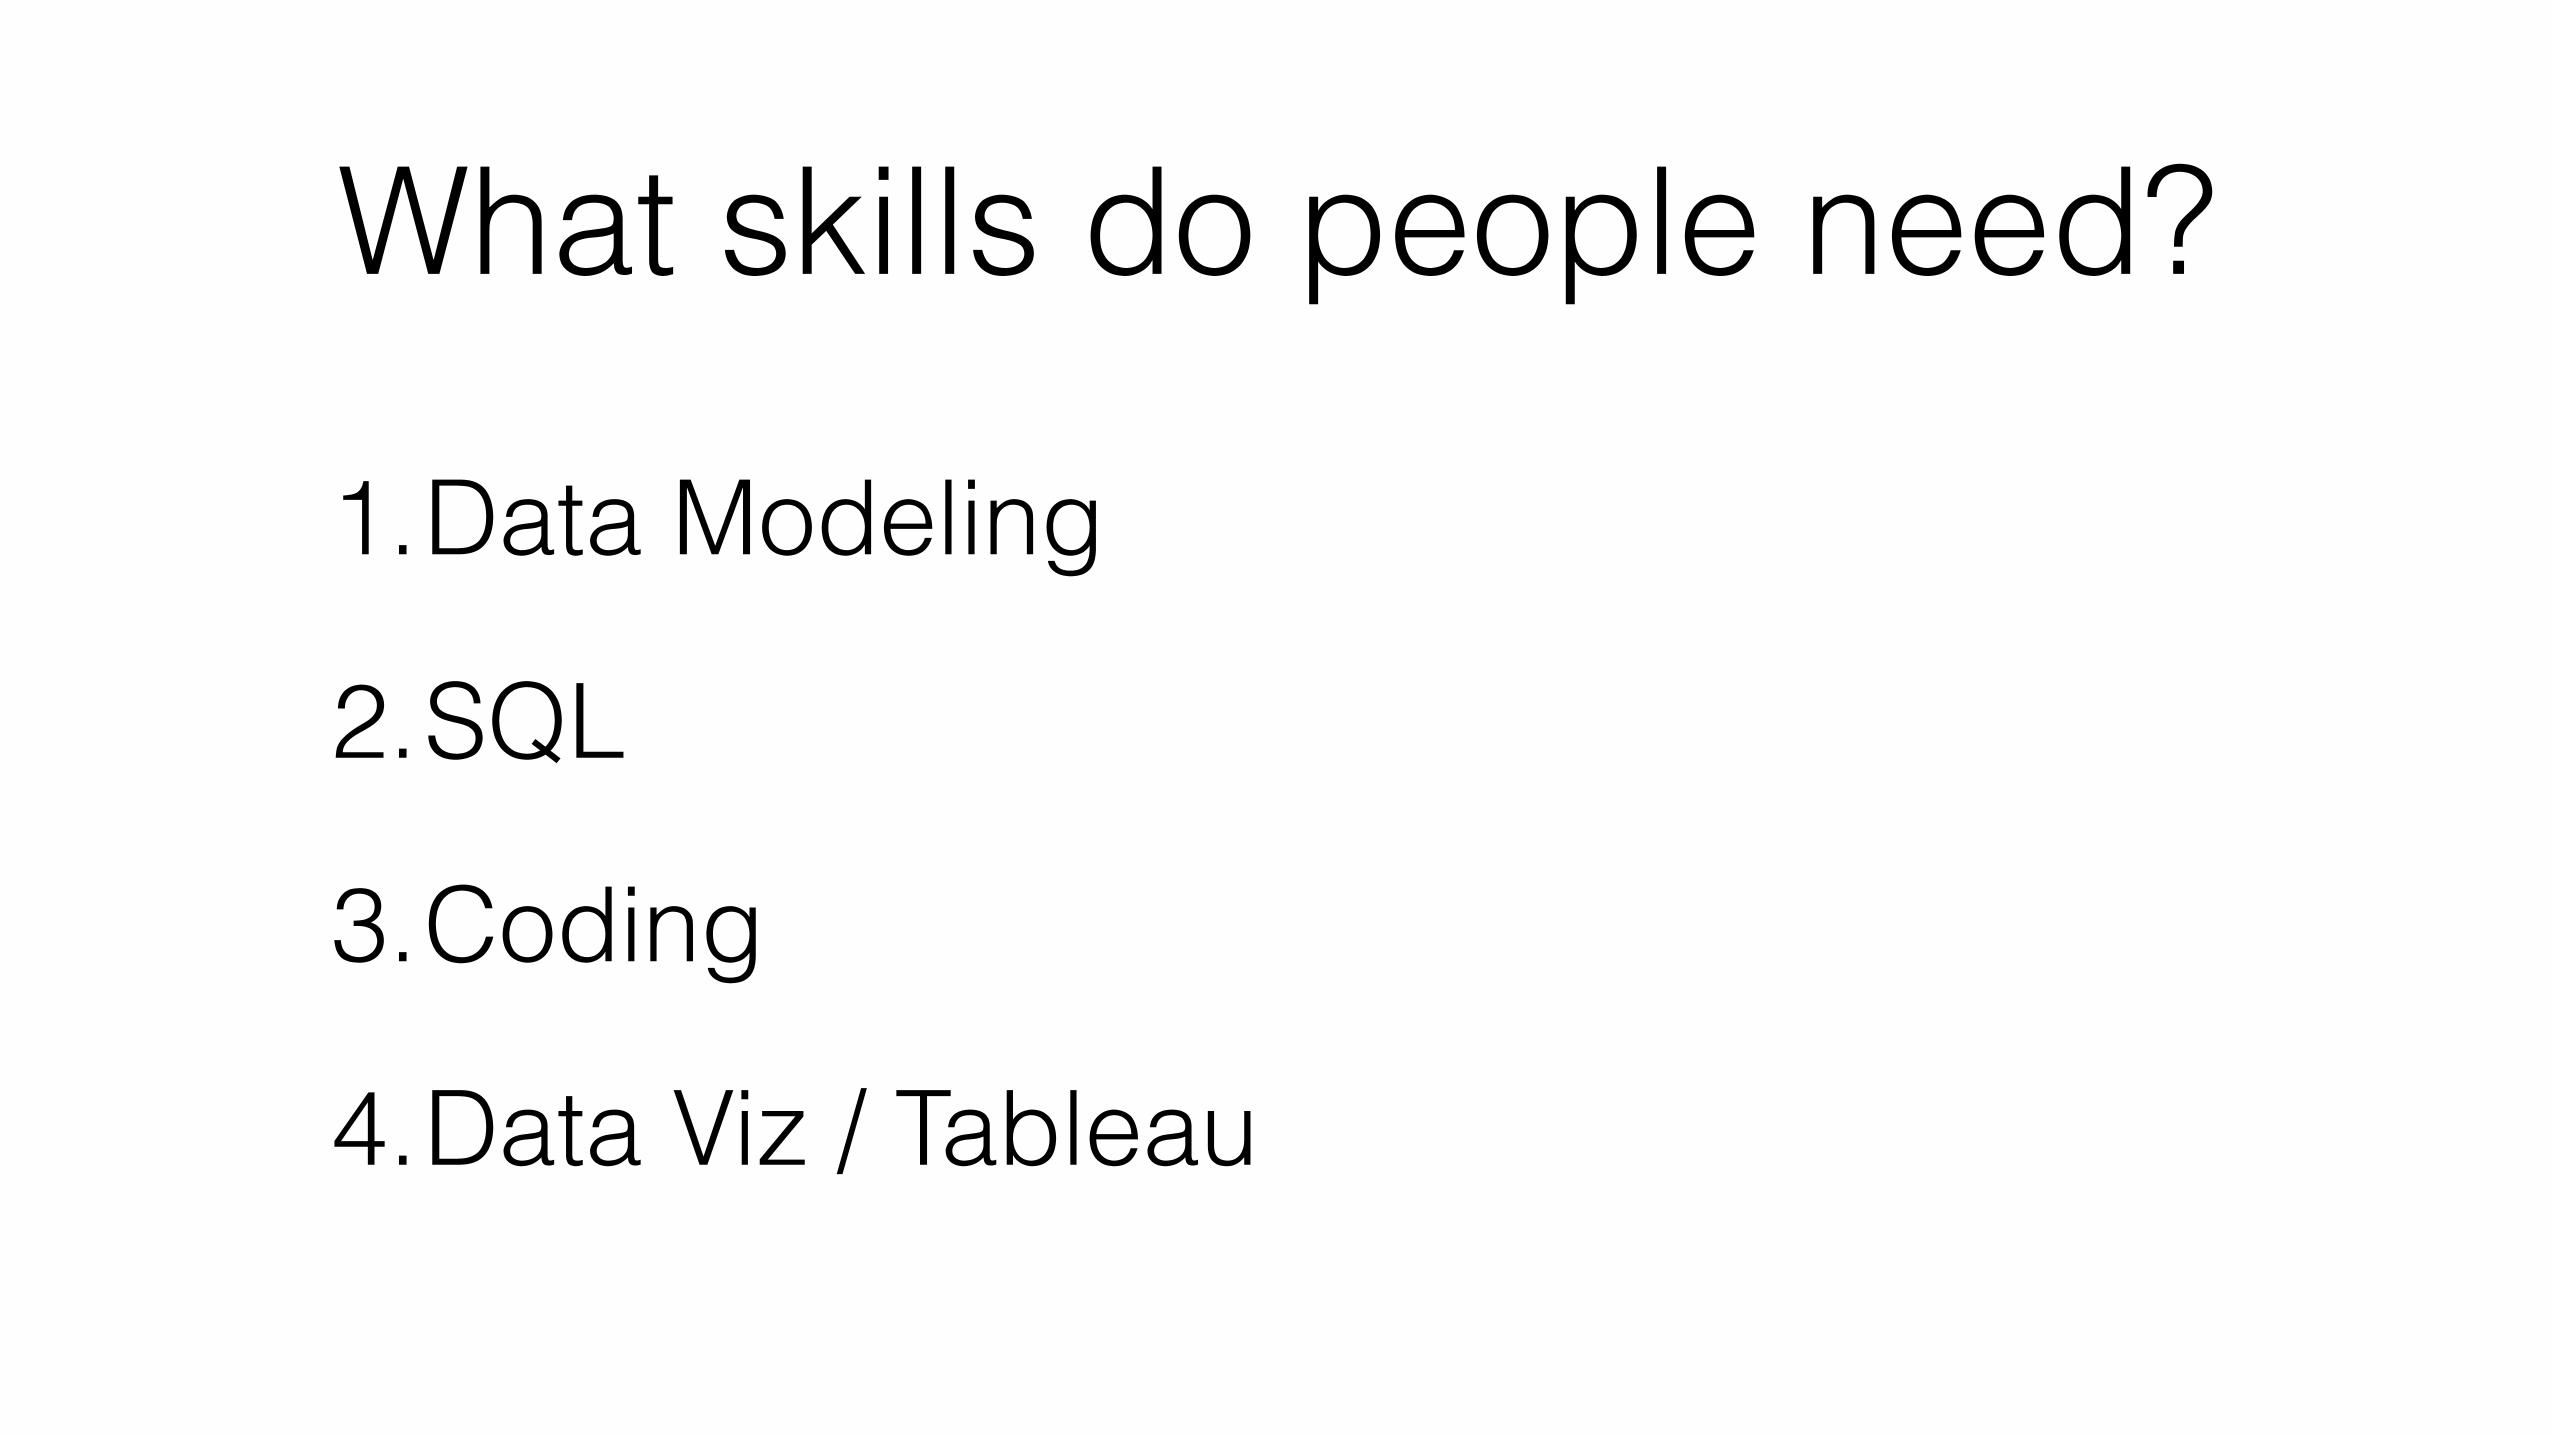
What skills do people need?
1.Data Modeling
2.SQL
3.Coding
4.Data Viz / Tableau

If you know anyone, let me know!

We’re building some cool hacks!

Think HAXML

Dynamically update shapes

We’ve invented new chart types
Imagine Tableau Servers that do NO EXTRACTS

Imagine extracts that run 40x FASTER

Offload extract creation on distributed systems without licensing costs
And it’ll all be open sourced
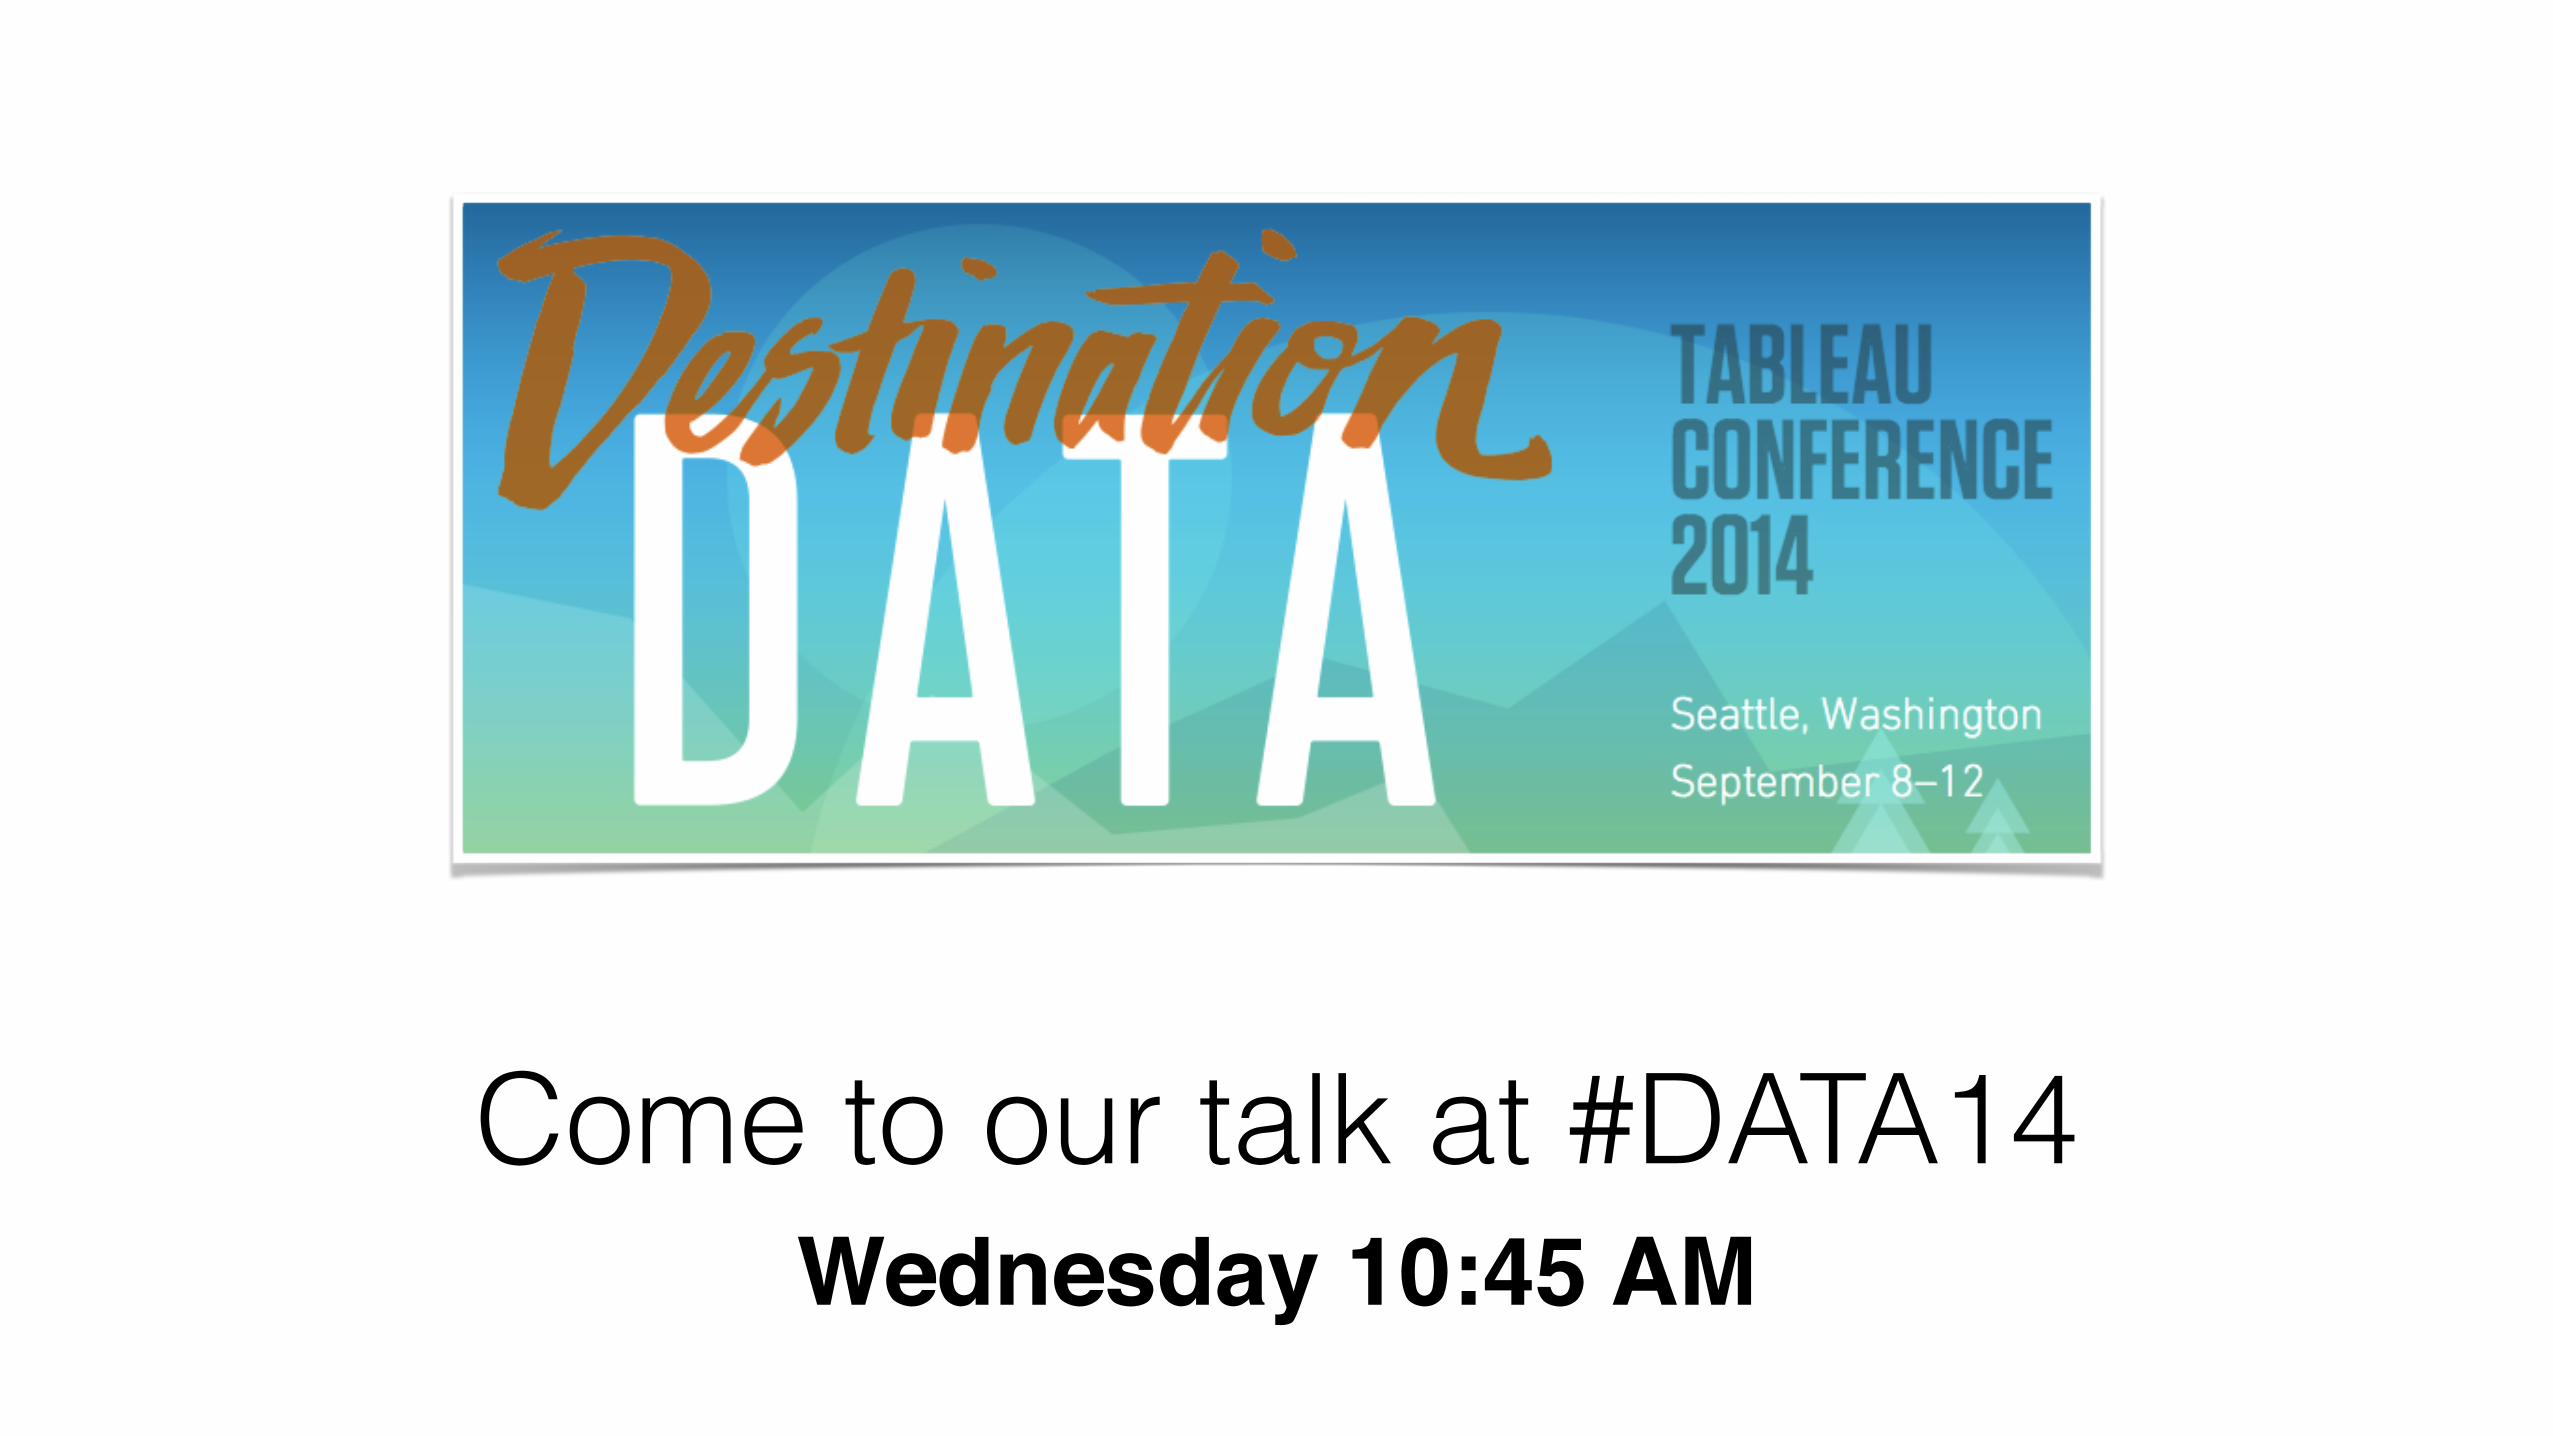
Come to our talk at #DATA14Wednesday 10:45 AM

Sources of inspiration
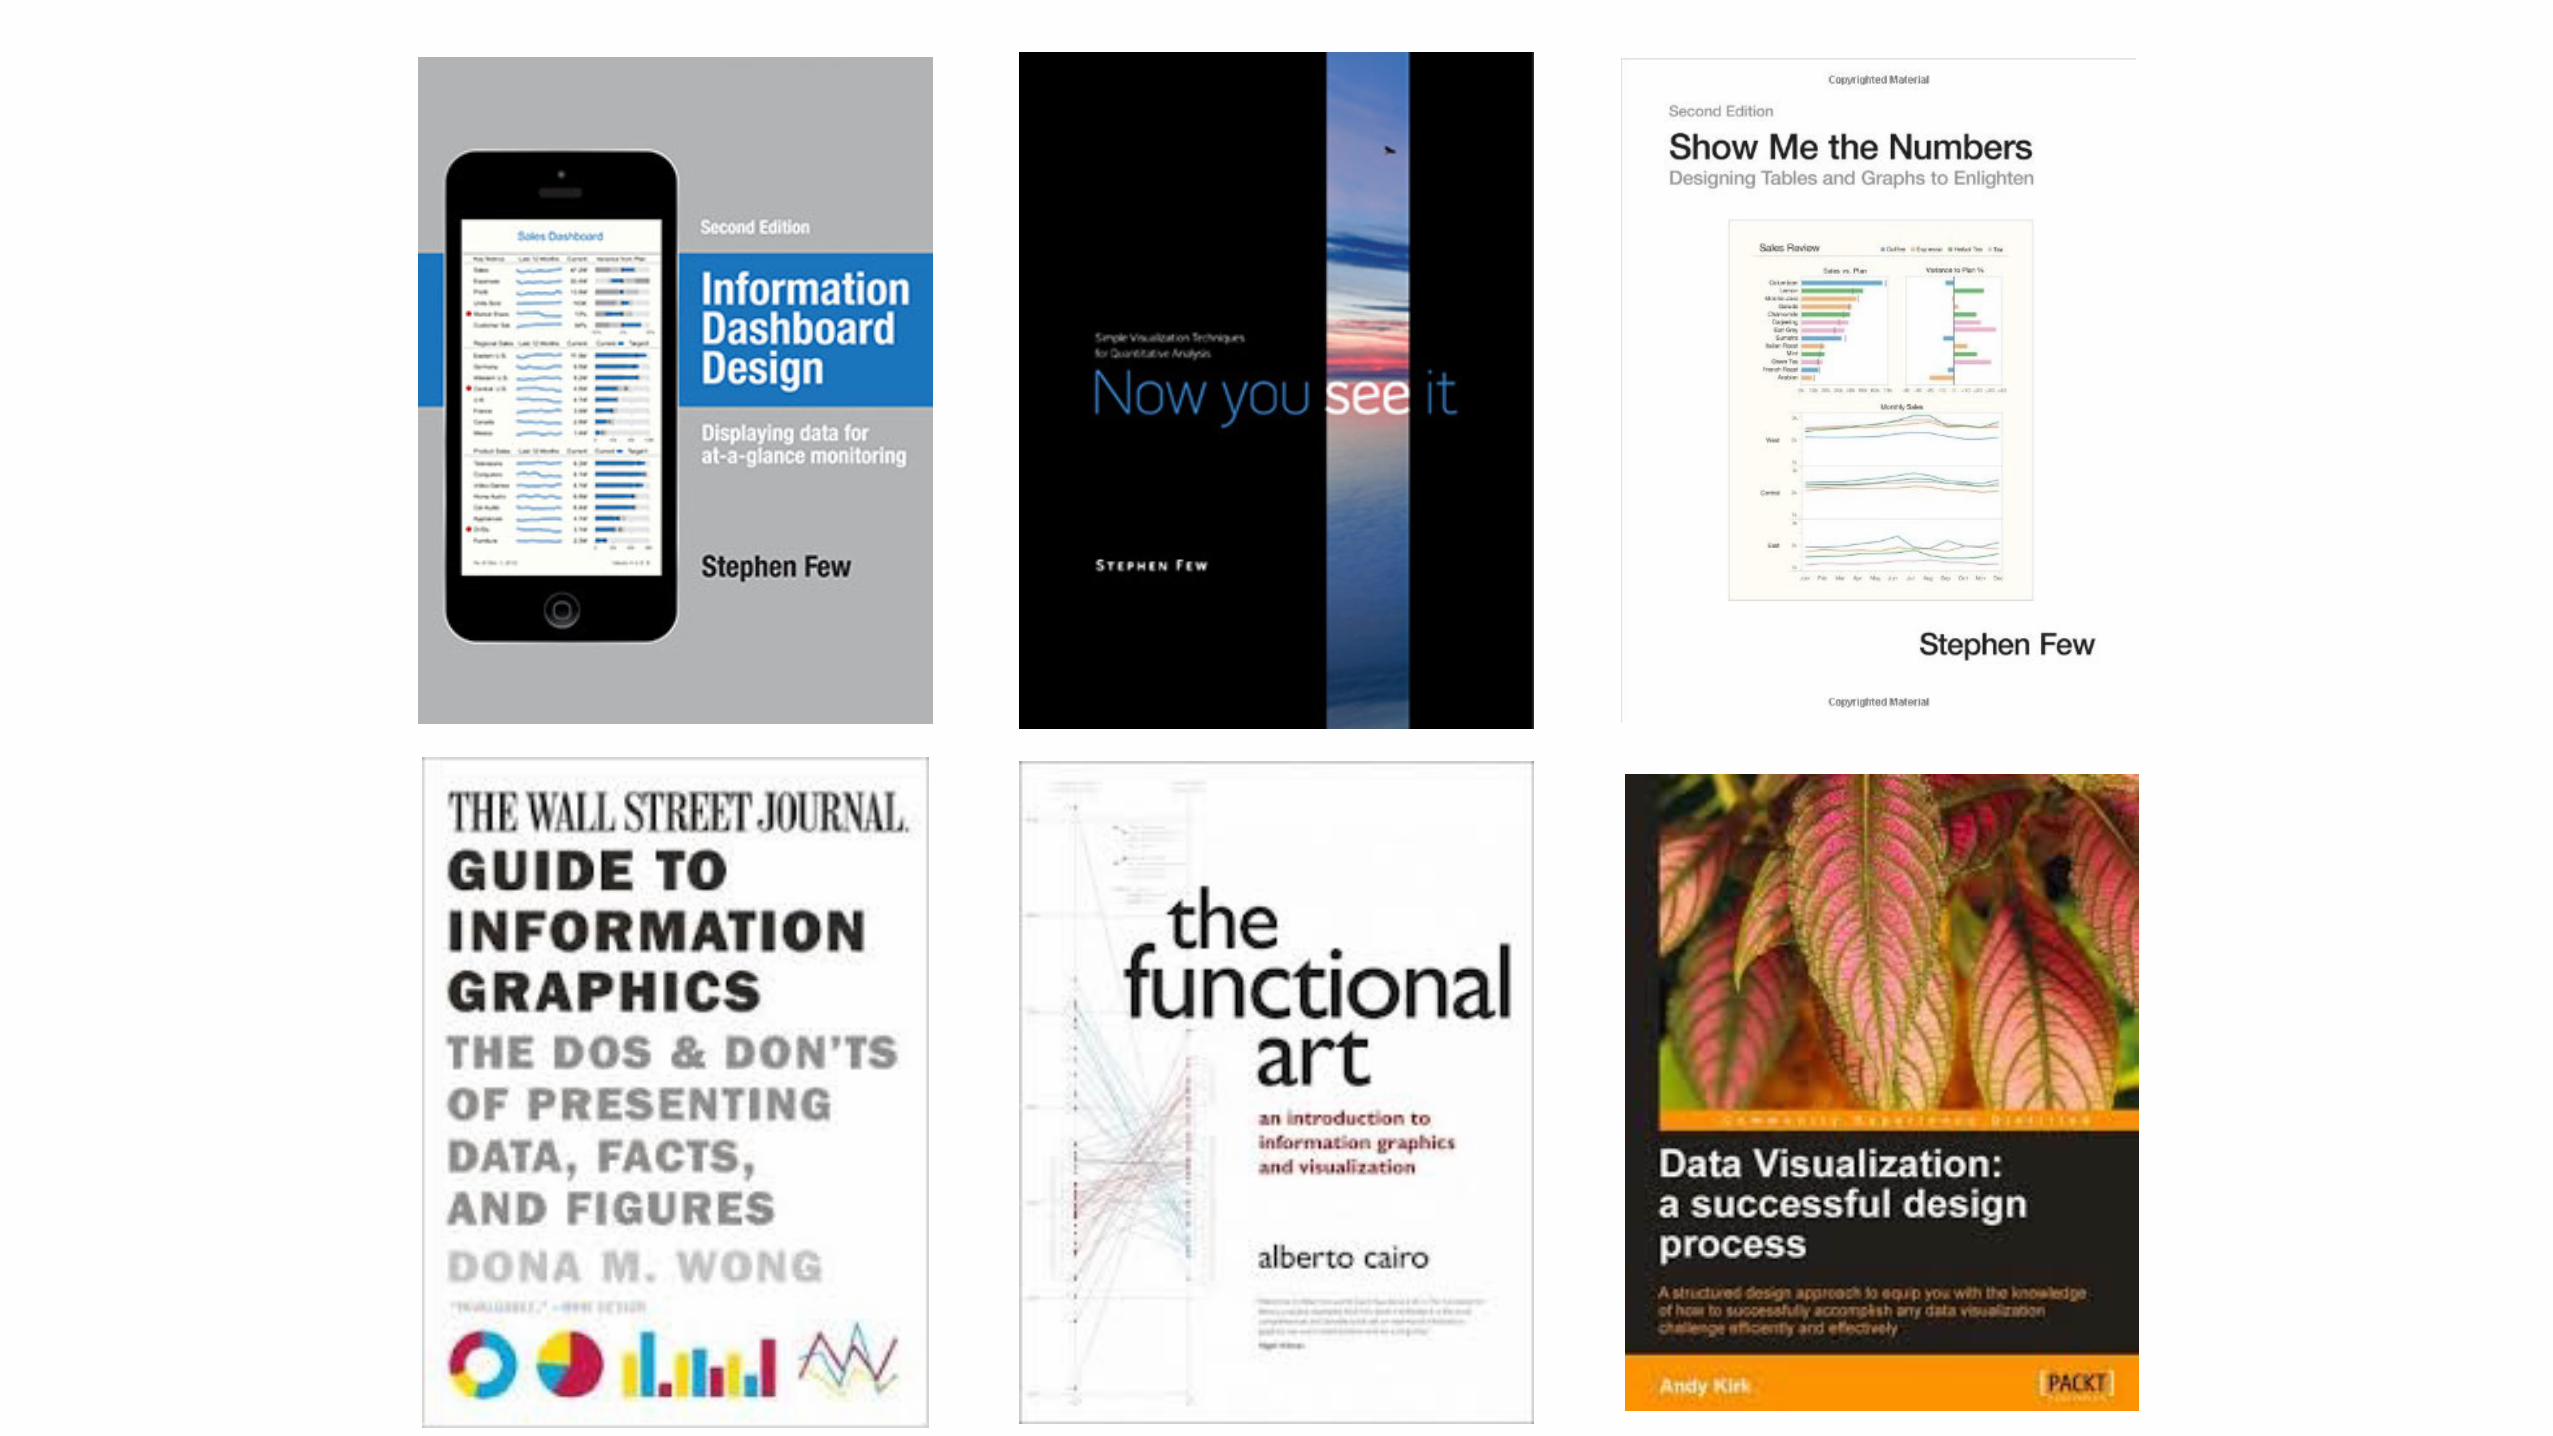
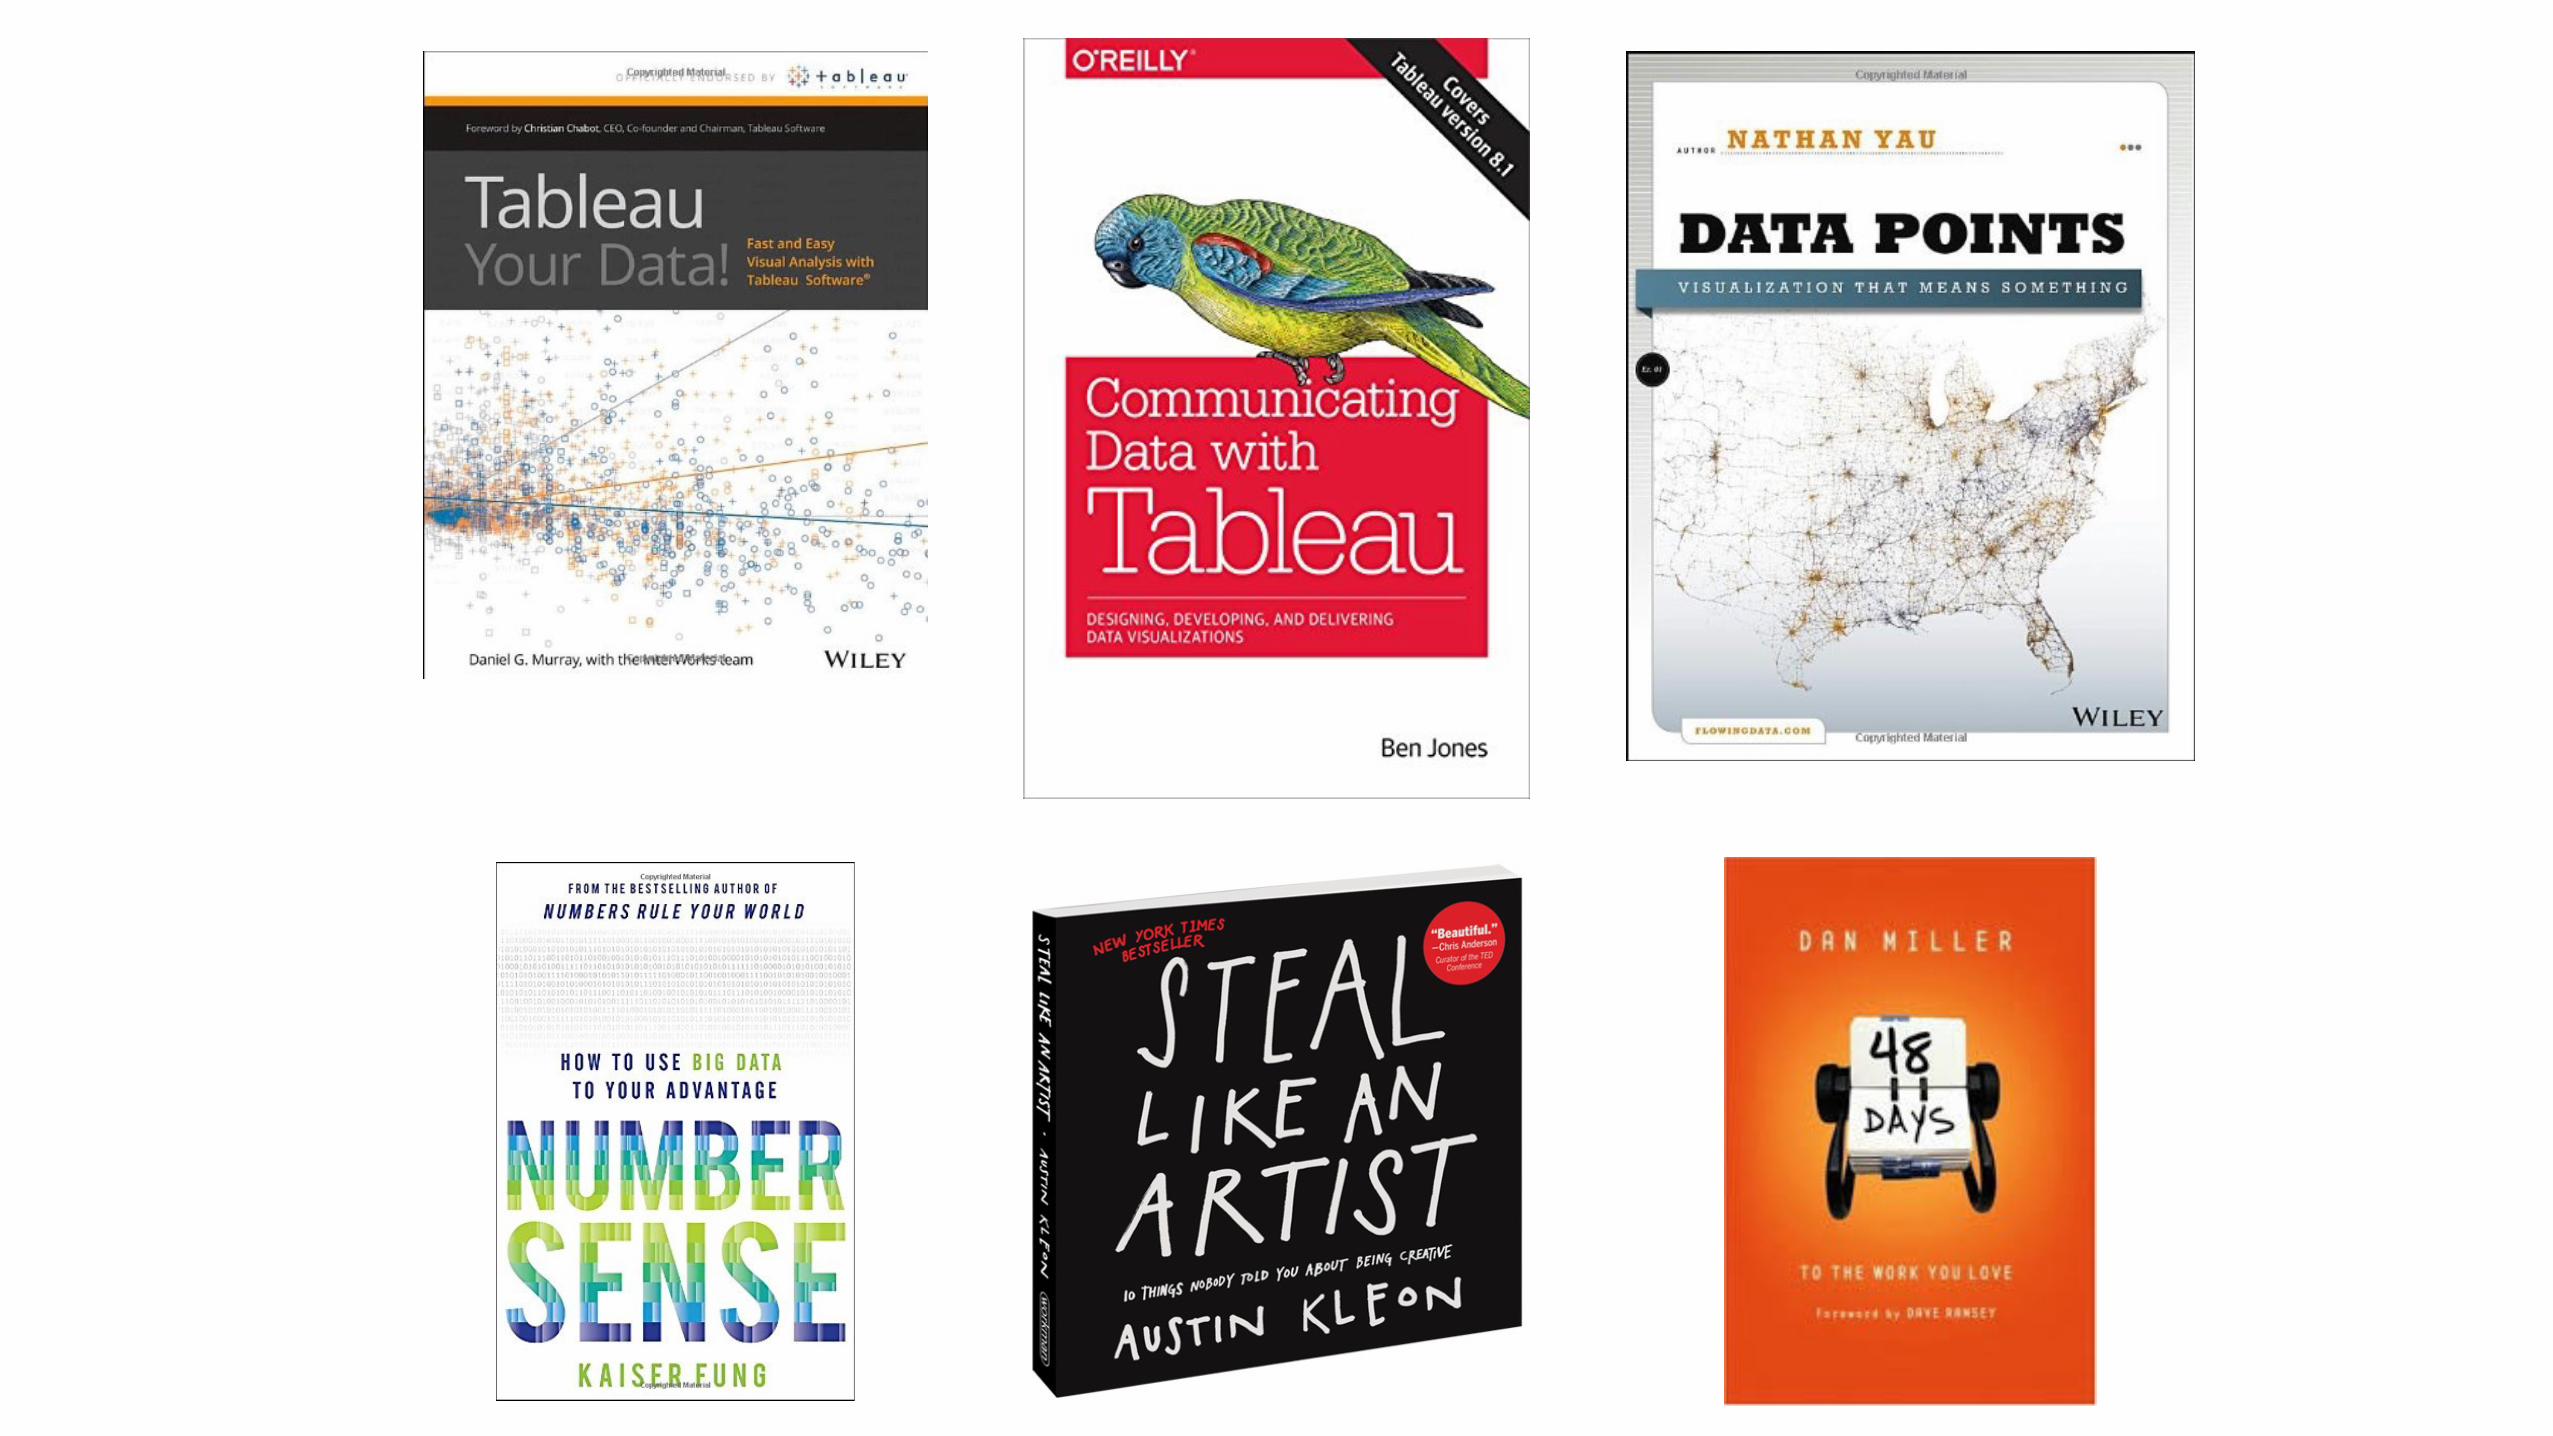


Read lots of blogs!http://bit.ly/DataVizBlogs

Follow me!vizwiz.blogspot.com facebook.com/vizwiz
@VizWizBI

Thank you!