Embed Size (px)
Citation preview
A WEB PLATFORM FOR THE VISUALISATION AND THE DISSEMINATION OF STATISTICAL DATA AND GEOSPATIAL
ANALYSIS
Alessandro Capezzuoli Emanuela Recchini
ESS Visualisation Workshop
Valencia, Spain, May 17-18, 2016
www.statview.eu

ESS Vision 2020: directions for National Statistical Offices1
3
4
5
2
Concluding remarks
A tool for visualisation, dissemination and geospatial analysis: STATVIEW
Data visualisation, webgis and statistical data
Data dissemination formats, standards and methods
A web platform for the visualisation and the dissemination of statistical data and geospatial analysisAlessandro Capezzuoli, Emanuela Recchini – ESS Visualisation Workshop, Valencia, Spain, May 17-18, 2016

1. ESS Vision 2020: directions for National Statistical Offices
The UN Fundamental Principles of Official Statistics and the European Statistics Code of Practice provide a crucial guidance in achieving the ESS Vision 2020. In fact, an essential role in supporting analysis and decision making is played first of all by statistical information that is produced under strict conditions and quality criteria for both outputs and processes.
In this respect, highest quality can be found in information derived from data that are produced under the statistical programme of a given country or an international organization (Official Statistics).
Introductory remarks
As highlighted in the ESS Vision 2020:
Official statistics have always strived to adapt to major developments in society and the economy.
The ever increasing availability of data is a trend that is of strategic relevance for official statistics. There is a need to assess and interpret the meaning of these data in an intelligent and interactive fashion.
1A web platform for the visualisation and the dissemination of statistical data and geospatial analysisAlessandro Capezzuoli, Emanuela Recchini – ESS Visualisation Workshop, Valencia, Spain, May 17-18, 2016

1. ESS Vision 2020: directions for National Statistical Offices
In order to deliver ESS Vision 2020, five key areas have been identified. Their formulations are centered around a number of specific points:
Key area 3 - New data sourcesWe base our statistical products and services on both traditional surveys and newer sources, including administrative data, geospatial and, where possible, big data. New data sources complement the existing ones and help us to improve the quality of our products.
Key area 4 - Efficient and robust statistical processesWe will intensify our collaboration … also by sharing tools … .
Key area 5 - Dissemination and communication on European statisticsWe recognise that different user groups have different needs and capabilities, both in terms of products and dissemination channels, and we will address this diversity by offering a variety of output channels and services.
Solicited by ESS, National Statistical Offices (NSOs) have started exploring new technology-driven areas when dealing with very large amount of data and are developing suitable tools for the integration of different types of information and its dissemination, i.e. platforms for data storage, analysis and visualisation.
Keywords in the ESS Vision 2020
2A web platform for the visualisation and the dissemination of statistical data and geospatial analysisAlessandro Capezzuoli, Emanuela Recchini – ESS Visualisation Workshop, Valencia, Spain, May 17-18, 2016

If you have an apple and I have an apple and we exchange these apples then you and I will stilleach have one
apple. But if you have an idea and I have an idea and
we exchange these ideas, then each of
us will have two ideas.
(George Bernard Shaw)
If you have a single data and I have a single data and we exchange these data, then all have two data
2. Data dissemination formats, standards and methods

• The role of National Statistical Offices
2. Data dissemination formats, standards and methodsIntroductory remarks
• Data dissemination and visualisation in the Internet Era
• Data sharing at the basis of knowledge
• Challenges: measurement, description and representation of statistical data
4A web platform for the visualisation and the dissemination of statistical data and geospatial analysisAlessandro Capezzuoli, Emanuela Recchini – ESS Visualisation Workshop, Valencia, Spain, May 17-18, 2016

2. Data dissemination formats, standards and methods Statistics data flow
1 - Acquisition
2 - Treatment
3 - Dissemination
5A web platform for the visualisation and the dissemination of statistical data and geospatial analysisAlessandro Capezzuoli, Emanuela Recchini – ESS Visualisation Workshop, Valencia, Spain, May 17-18, 2016

W3C open standard formats: XML vs JSON2. Data dissemination formats, standards and methods
eXtensible Markup Language
Javascript Object Notation
JSON CAN BE USED BY:
Programming languages: Frameworks for graphical and cartographic representations:
• Javascript• Ajax• PHP• JSP• PYTHON
• NodeJS• Openlayers• Leaflet• RaphaelJS• D3JS
6A web platform for the visualisation and the dissemination of statistical data and geospatial analysisAlessandro Capezzuoli, Emanuela Recchini – ESS Visualisation Workshop, Valencia, Spain, May 17-18, 2016

The XML format relies on the use of a Service Oriented Architecture - SOA
W3C open standard formats: XML vs JSON2. Data dissemination formats, standards and methods
The JSON format relies on the use of a Resource Oriented Architecture - ROA
- is not a standard, is just an architecture style for designing networked applications
- is a lightweight alternative to mechanisms like RPC (Remote Procedure Calls) and Web Services (SOAP, WSDL, etc.)
- is a service concept that may be summarized by the CRUD principles
Representational State Transfer (REST)
7A web platform for the visualisation and the dissemination of statistical data and geospatial analysisAlessandro Capezzuoli, Emanuela Recchini – ESS Visualisation Workshop, Valencia, Spain, May 17-18, 2016

W3C open standard formats: REST vs NO REST2. Data dissemination formats, standards and methods
8A web platform for the visualisation and the dissemination of statistical data and geospatial analysisAlessandro Capezzuoli, Emanuela Recchini – ESS Visualisation Workshop, Valencia, Spain, May 17-18, 2016
WITHOUT REST WITH REST

RESTful - Systems conforming to the REST constraints
SOAP – Simple Objects Access Protocol
REST WEBSERVICESArchitectures for data visualisation
2. Data dissemination formats, standards and methods
Can be used asApplication Programming Interface (API)
9A web platform for the visualisation and the dissemination of statistical data and geospatial analysisAlessandro Capezzuoli, Emanuela Recchini – ESS Visualisation Workshop, Valencia, Spain, May 17-18, 2016

The Italian National Institute of Statistics (Istat) uses several channels for data dissemination:
The Istat experienceData dissemination in Official statistics
An example: ISTAT ACCIDENTS DATA
The single exit point for exchanging and supplying data to Eurostat and other institutional subjects through the SDMX format
I.STAT, a web channel allowing data downloading in several formats (csv, excel, etc.)
A set of API REST to disseminate data in the JSON-STAT format
3. Data visualisation, webGIS and statistical data
Istat, like other NSOs, uses the JSON-STAT format for its data dissemination
10A web platform for the visualisation and the dissemination of statistical data and geospatial analysisAlessandro Capezzuoli, Emanuela Recchini – ESS Visualisation Workshop, Valencia, Spain, May 17-18, 2016

JSON-STAT, SDMX, ODATAAn example from Statistics Sweden
3. Data visualisation, webGIS and statistical data
11A web platform for the visualisation and the dissemination of statistical data and geospatial analysisAlessandro Capezzuoli, Emanuela Recchini – ESS Visualisation Workshop, Valencia, Spain, May 17-18, 2016

The Istat datawarehouse is conceived on the basis of the multi-dimensional array of data OLAP Cube (On-Line Analytical Processing).
JSON-STAT, SDMX, ODATAThe Istat Datawarehouse
The OLAP Cube is characterized by:
• Dimensions – i.e. the dimensional spreadsheets containing the descriptive attributes of the measures (Province, Region, gender, date of birth, etc.). The faces of the cube contain the dimensions, while each cell contains the value related to the intersection of dimensions.
• Measures – describe the qualitative aspects of a given event.
3. Data visualisation, webGIS and statistical data
12A web platform for the visualisation and the dissemination of statistical data and geospatial analysisAlessandro Capezzuoli, Emanuela Recchini – ESS Visualisation Workshop, Valencia, Spain, May 17-18, 2016

The JSON-stat format is a simple lightweight JSON format for data dissemination. It is based on a cube model that arises from the evidence that the most common form of data dissemination is the tabular form.
JSON-STAT, SDMX, ODATAThe JSON-stat format
In this cube model, datasets are organized in dimensions. Dimensions are organized in categories.
JSON-stat has been the starting point for the development of StatVIEW
3. Data visualisation, webGIS and statistical data
13A web platform for the visualisation and the dissemination of statistical data and geospatial analysisAlessandro Capezzuoli, Emanuela Recchini – ESS Visualisation Workshop, Valencia, Spain, May 17-18, 2016

JSON-STAT, SDMX, ODATAOpen data utilisation
3. Data visualisation, webGIS and statistical data
• Considerable evolution of dissemination and visualisation of data from official statistics
• Proliferation of tools for data visualisation and cartographic analysis (Tableau, Microstrategy, Spago BI, etc.)
… nevertheless …
14A web platform for the visualisation and the dissemination of statistical data and geospatial analysisAlessandro Capezzuoli, Emanuela Recchini – ESS Visualisation Workshop, Valencia, Spain, May 17-18, 2016
The potential of georeferenced spatial data
is still underutilized

JSON-STAT, SDMX, ODATA3. Data visualisation, webGIS and statistical data
The potential of georeferenced spatial data is still underutilized
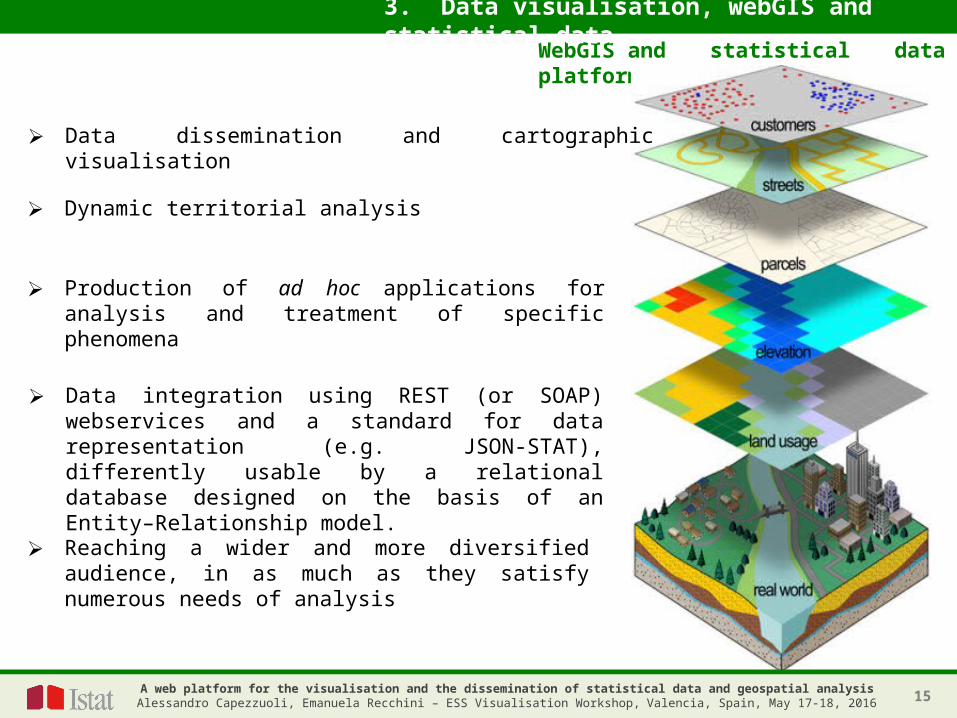
JSON-STAT, SDMX, ODATAWebGIS and statistical data platform
➢ Data dissemination and cartographic visualisation
➢ Dynamic territorial analysis
➢ Production of ad hoc applications for analysis and treatment of specific phenomena
➢ Data integration using REST (or SOAP) webservices and a standard for data representation (e.g. JSON-STAT), differently usable by a relational database designed on the basis of an Entity–Relationship model.
➢ Reaching a wider and more diversified audience, in as much as they satisfy numerous needs of analysis
3. Data visualisation, webGIS and statistical data
15A web platform for the visualisation and the dissemination of statistical data and geospatial analysisAlessandro Capezzuoli, Emanuela Recchini – ESS Visualisation Workshop, Valencia, Spain, May 17-18, 2016

4. A tool for visualisation, dissemination and geospatial analysis
StatVIEW is a web GIS and statistical data platform comprising:
1) Map Server and a geospatial database (Geoserver, Postgres, PostGIS)
2) Different data sources (datawarehouse, webservices, database, etc.)
3) Interrogation engine and user interface
WMSWFS WCS
StatVIEW:
• Highly scalable systemo Supports different data sources (database, files, webservices)
o Supports different models for open data sources (SDMX, DDI, JSON-STAT)
o Supports different formats for open data sources (XML, JSON)
• Source output in JSON-stat format
16A web platform for the visualisation and the dissemination of statistical data and geospatial analysisAlessandro Capezzuoli, Emanuela Recchini – ESS Visualisation Workshop, Valencia, Spain, May 17-18, 2016

JSON-STAT, SDMX, ODATA4. A tool for visualisation, dissemination and geospatial analysis
StatVIEW (www.statview.eu) allows users to carry out operations normally included in GIS Desktop and WebGIS systems:
● Buffering
● Network analysis
● Topology Overlay
17A web platform for the visualisation and the dissemination of statistical data and geospatial analysisAlessandro Capezzuoli, Emanuela Recchini – ESS Visualisation Workshop, Valencia, Spain, May 17-18, 2016

Architecture
4. A tool for visualisation, dissemination and geospatial analysis
18A web platform for the visualisation and the dissemination of statistical data and geospatial analysisAlessandro Capezzuoli, Emanuela Recchini – ESS Visualisation Workshop, Valencia, Spain, May 17-18, 2016

4. A tool for visualisation, dissemination and geospatial analysis
DENSITY MAPA density map for vehicles involved in road accidents
Dimensions associated to the dataset
Representation type (cartographic, graphic, table)
Customize the research
19A web platform for the visualisation and the dissemination of statistical data and geospatial analysisAlessandro Capezzuoli, Emanuela Recchini – ESS Visualisation Workshop, Valencia, Spain, May 17-18, 2016

DYNAMIC GRAPH
A dynamic graph for vehicles involved in road accidents
4. A tool for visualisation, dissemination and geospatial analysis
20A web platform for the visualisation and the dissemination of statistical data and geospatial analysisAlessandro Capezzuoli, Emanuela Recchini – ESS Visualisation Workshop, Valencia, Spain, May 17-18, 2016

4. A tool for visualisation, dissemination and geospatial analysis
A table for vehicles involved in road accidents realized with JSON-STAT Table Browser
TABLE
21A web platform for the visualisation and the dissemination of statistical data and geospatial analysisAlessandro Capezzuoli, Emanuela Recchini – ESS Visualisation Workshop, Valencia, Spain, May 17-18, 2016

OVERLAY: Map - residence permits of non-EU citizens
A tool for visualisation, dissemination and geospatial analysis
By selecting the layers and, for example, a different base map, or a different color shade, or a different partition (quartile, quintile), it is possible to get a different visualisation, leading to a different interpretation of the phenomenon.
The customization depends on the layers available in the chosen map.
Another layer creates, via a geospatial query, a bubble chart representing the number of the georeferenced organizations active in the territory
One layer contains the georeferenced organizations providing assistance to migrants
22A web platform for the visualisation and the dissemination of statistical data and geospatial analysisAlessandro Capezzuoli, Emanuela Recchini – ESS Visualisation Workshop, Valencia, Spain, May 17-18, 2016

A tool for visualisation, dissemination and geospatial analysis
By using an OSRM (Open Source Routing Machine) routing algorithm, it is possible to obtain the shortest route to a geo-localised point in the map server used by StatVIEW (e.g. hospital, police station, etc.) from any point in the map, as well as the respective travel time.
Routing
23A web platform for the visualisation and the dissemination of statistical data and geospatial analysisAlessandro Capezzuoli, Emanuela Recchini – ESS Visualisation Workshop, Valencia, Spain, May 17-18, 2016

4. A tool for visualisation, dissemination and geospatial analysis
The dimension of the arrows gives an idea of volumes: the thicker the arrow, the greater the flow.
Changes of residence for foreign citizens to and from Italian Provinces
It is possible to represent inflows and outflows to and from a given territorial border..
INTERNAL FLOW
It is possible to set the maximum distance or the distance range for the desired flows.
For example, we may be interested in visualizing the flows within 100 km from a given Province, or within a distance ranging 100-300 km.
24A web platform for the visualisation and the dissemination of statistical data and geospatial analysisAlessandro Capezzuoli, Emanuela Recchini – ESS Visualisation Workshop, Valencia, Spain, May 17-18, 2016

4. A tool for visualisation, dissemination and geospatial analysis
ITALIAN REGIONS
This example shows the evolution of employment data at the regional level
25A web platform for the visualisation and the dissemination of statistical data and geospatial analysisAlessandro Capezzuoli, Emanuela Recchini – ESS Visualisation Workshop, Valencia, Spain, May 17-18, 2016

4. A tool for visualisation, dissemination and geospatial analysis
ITALIAN MUNICIPALITIES
This example shows the Romanian citizens who are resident in the Italian Lazio Region at the municipal level
26A web platform for the visualisation and the dissemination of statistical data and geospatial analysisAlessandro Capezzuoli, Emanuela Recchini – ESS Visualisation Workshop, Valencia, Spain, May 17-18, 2016

4. A tool for visualisation, dissemination and geospatial analysis
In the example a pyramid graph showing the age of foreign citizens resident in Italy, compared to that of resident Italian citizens
PYRAMID GRAPHThe standardization of the sources’ output allows the creation of ad hoc plugins for the generalized visualisation of multi-source graphs or dashboards.
27A web platform for the visualisation and the dissemination of statistical data and geospatial analysisAlessandro Capezzuoli, Emanuela Recchini – ESS Visualisation Workshop, Valencia, Spain, May 17-18, 2016

4 A tool for visualisation, dissemination and geospatial analysisAD HOC WEB APPLICATION
The case of management of immigration centres provides an example of how StatVIEW, thanks to the support of geospatial database, allows users to develop ad hoc applications.
The map indicates the position of immigration centres.
The colours indicate the number of available accommodations (red = no accommodation available; orange = few accommodations available; green = many accommodations available).
By clicking on the marker of an immigration centre, an interested user (like, for example, a Prefecture) can book a certain number of accommodations, in order to equally distribute immigrants.
In a reserved area, it is possible to insert a new immigration centre (e.g. Via Diego Cadello, 9, Cagliari, Italy, Lat 39.238140, Lng 9.118743) that, thanks to the geospatial database, will be immediately visualized on the map.
28A web platform for the visualisation and the dissemination of statistical data and geospatial analysisAlessandro Capezzuoli, Emanuela Recchini – ESS Visualisation Workshop, Valencia, Spain, May 17-18, 2016
A tool for visualisation, dissemination and geospatial analysis
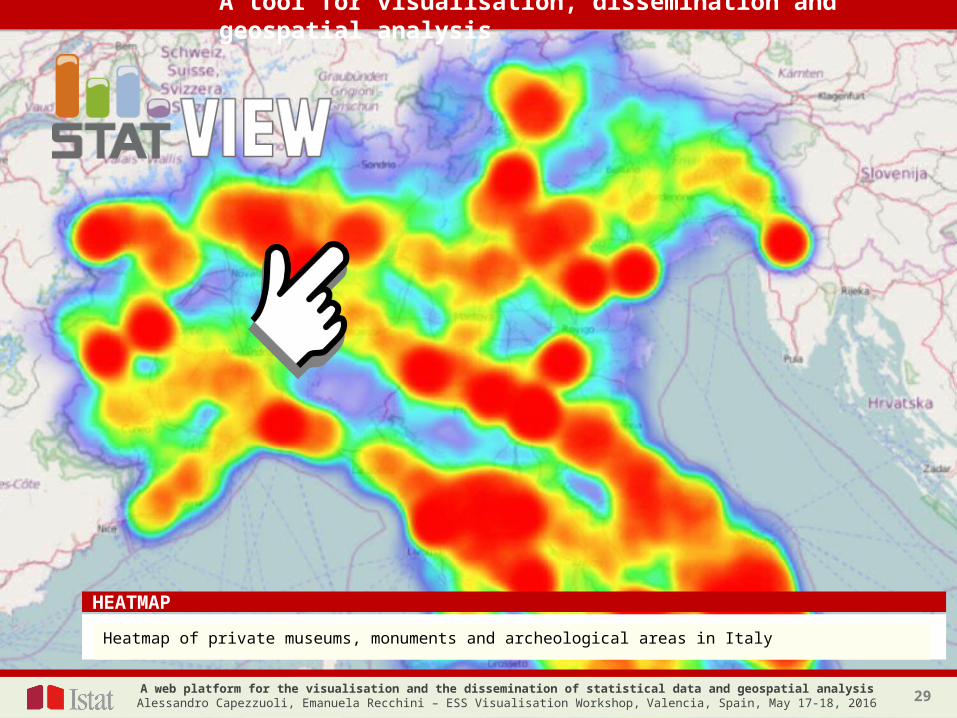
HEATMAP
29A web platform for the visualisation and the dissemination of statistical data and geospatial analysisAlessandro Capezzuoli, Emanuela Recchini – ESS Visualisation Workshop, Valencia, Spain, May 17-18, 2016
Heatmap of private museums, monuments and archeological areas in Italy

A tool for visualisation, dissemination and geospatial analysis
CLUSTERING
30A web platform for the visualisation and the dissemination of statistical data and geospatial analysisAlessandro Capezzuoli, Emanuela Recchini – ESS Visualisation Workshop, Valencia, Spain, May 17-18, 2016
Marker clusters of private museums, monuments and archeological areas in Italy

With the support of StatVIEW, it is easier for research work to analyze a specific phenomenon, overlay different layers to describe several phenomena as a whole and quickly monitor the evolution of different phenomena at the same time.
5. Concluding remarks
This helps to highlight the possible connections between phenomena or the impacts that the phenomena under investigation have on each other, thus facilitating the analysis and the drafting of proper and early-warning advice for decision making.
According to the ESS Vision 2020, developing an ESS that engages users proactively and meets their demands in a cost-efficient and responsive manner is one aim of the EU agenda. A web platform such as StatVIEW is along these lines.In providing high quality information, StatVIEW is time saving and cost-effective. It represents a useful open source tool that can be conveniently shared among NSOs for analyzing, visualizing and sharing statistical and cartographic data in a machine-readable format.
31A web platform for the visualisation and the dissemination of statistical data and geospatial analysisAlessandro Capezzuoli, Emanuela Recchini – ESS Visualisation Workshop, Valencia, Spain, May 17-18, 2016