Embed Size (px)
DESCRIPTION
A 80/20 approach to getting maximal insight in the shortest time and for the least fuss from your data (and a tour of corresponding pitfalls).
Citation preview
Data science = storytelling

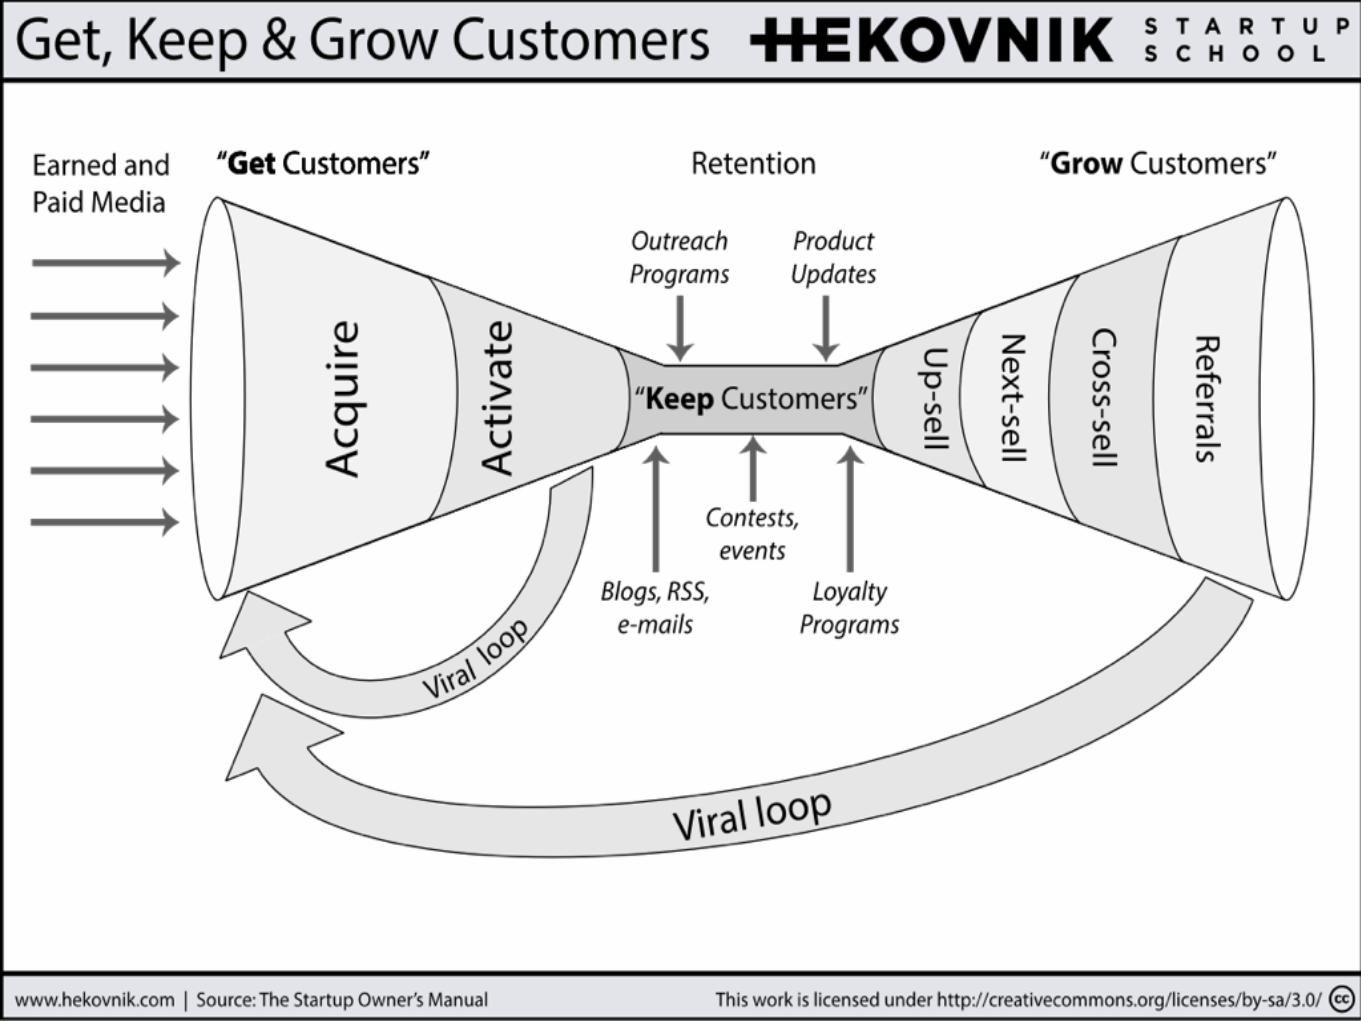
What to measure?
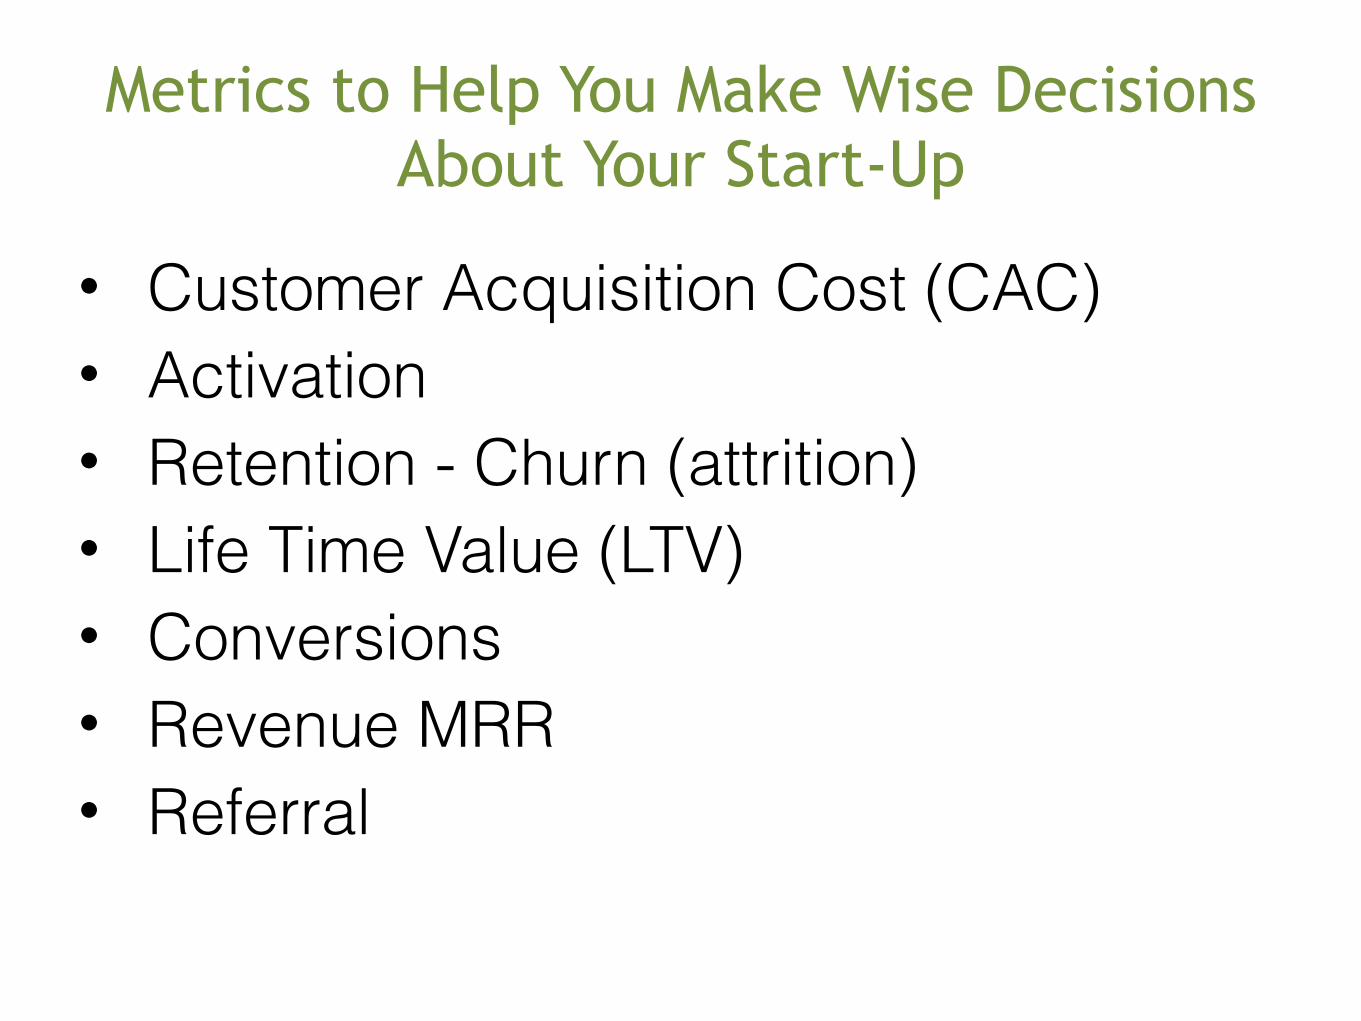
Metrics to Help You Make Wise Decisions About Your Start-Up
• Customer Acquisition Cost (CAC) • Activation • Retention - Churn (attrition) • Life Time Value (LTV) • Conversions • Revenue MRR • Referral
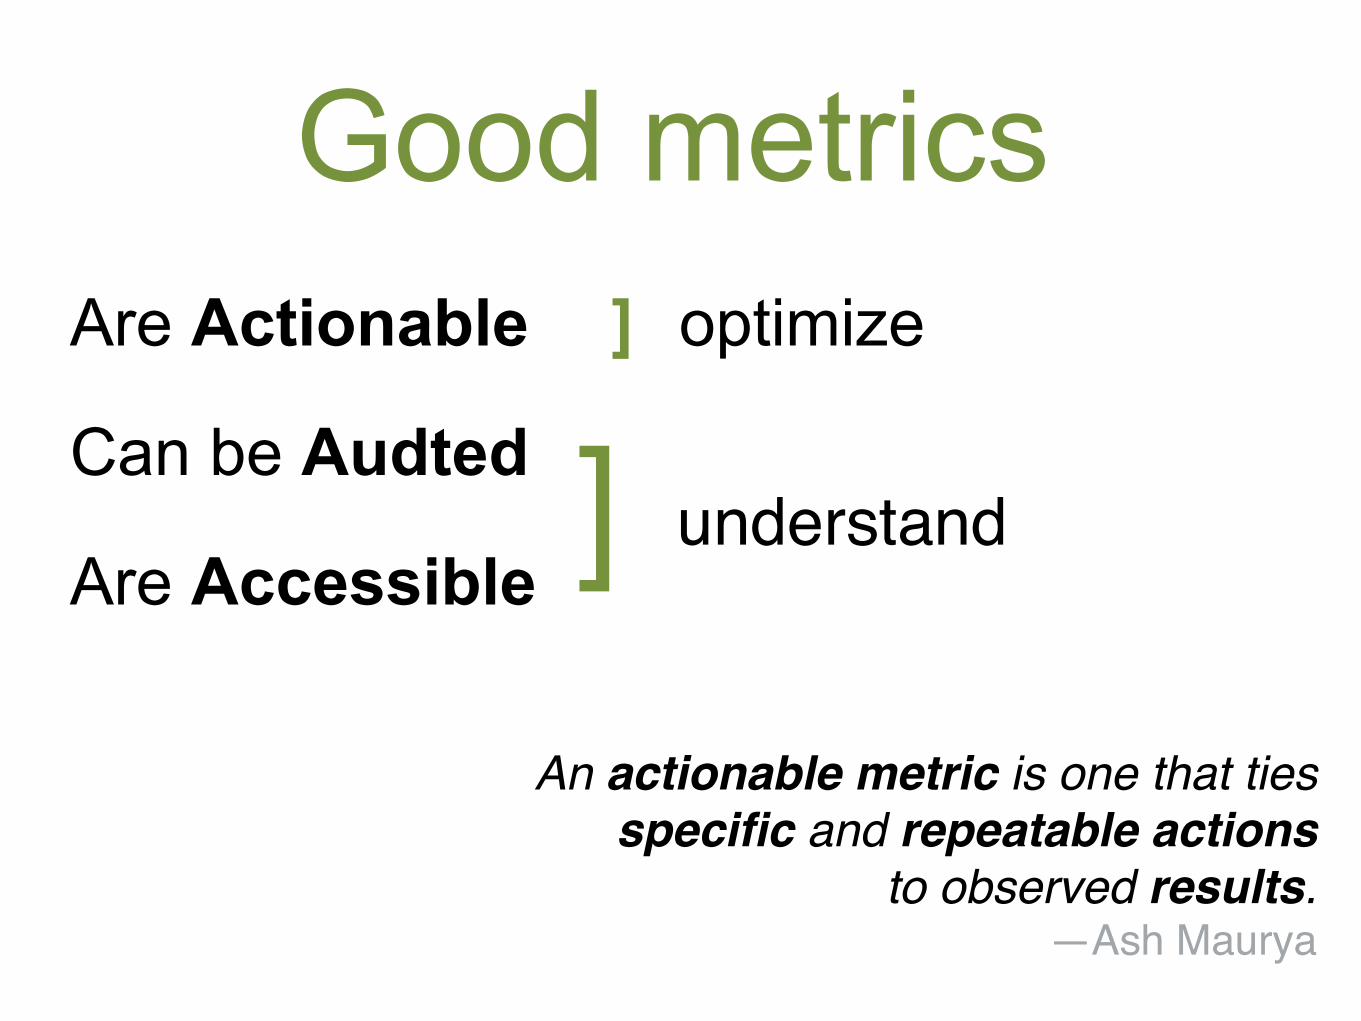
Good metrics Are Actionable ] optimize
Can be Audted
Are Accessible ]! understand!
An actionable metric is one that ties!specific and repeatable actions !
to observed results.!—Ash Maurya!
Metrics are data for humans
Metrics have to hurt (and be actionable)
Why should we measure?!
Understand &
optimize
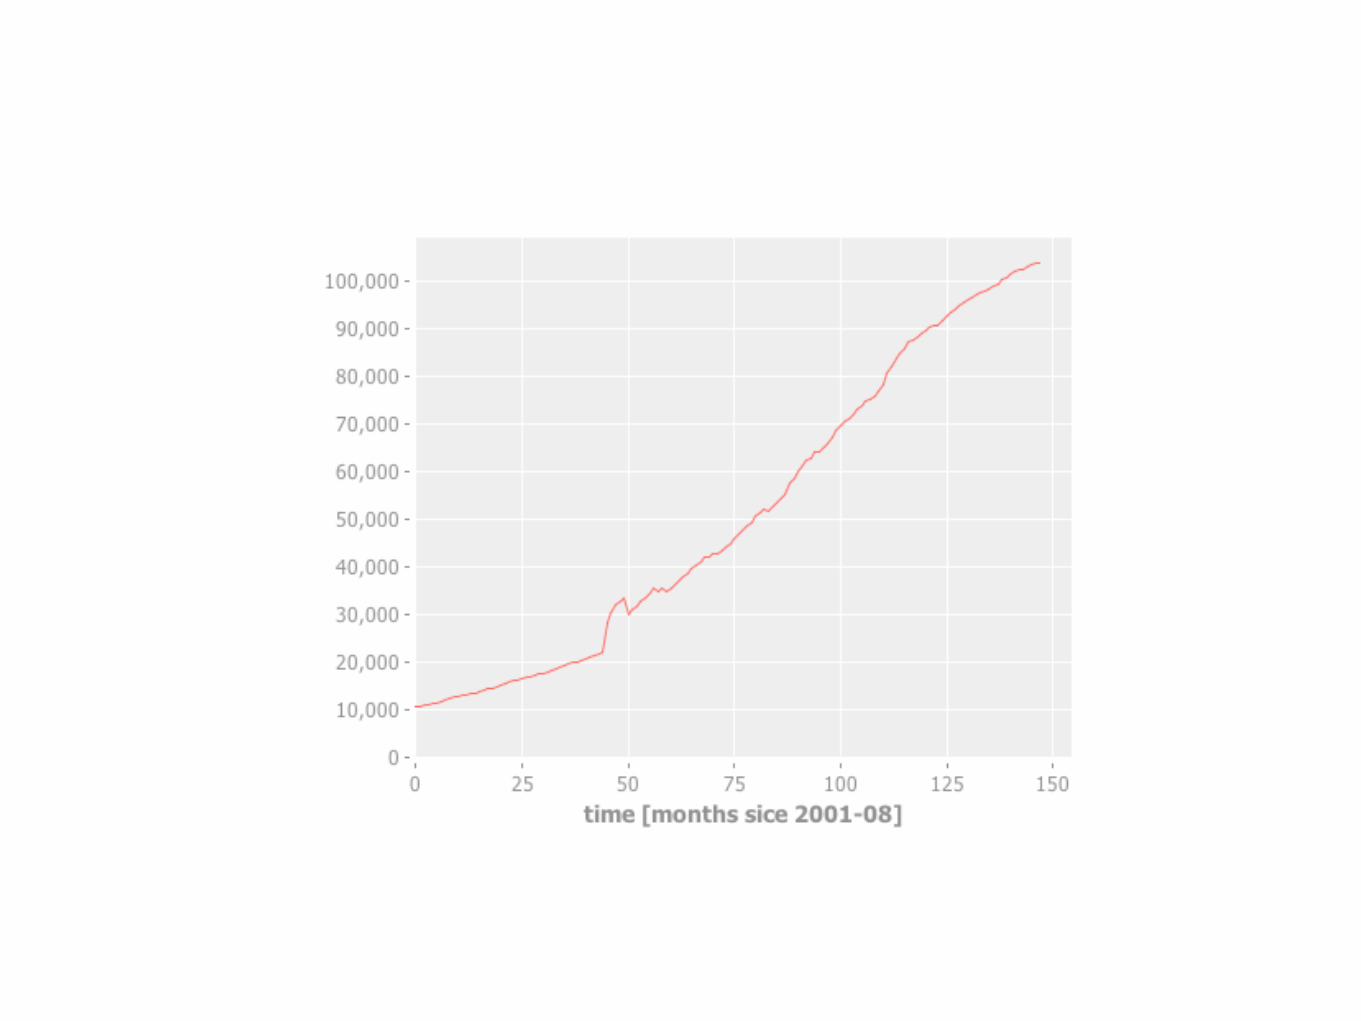
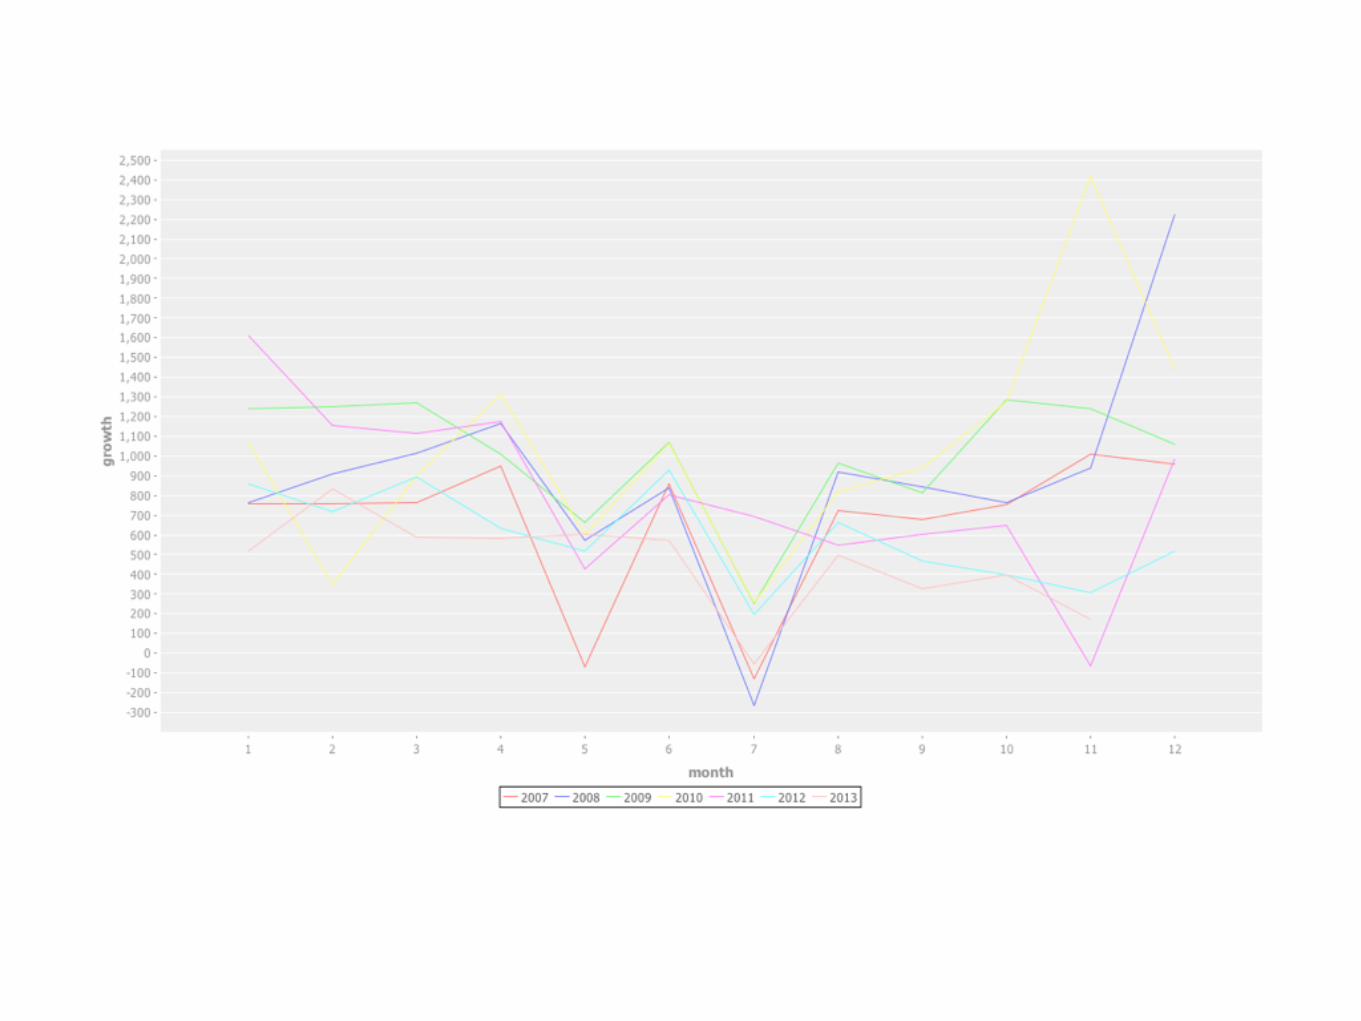
Capture time dynamics
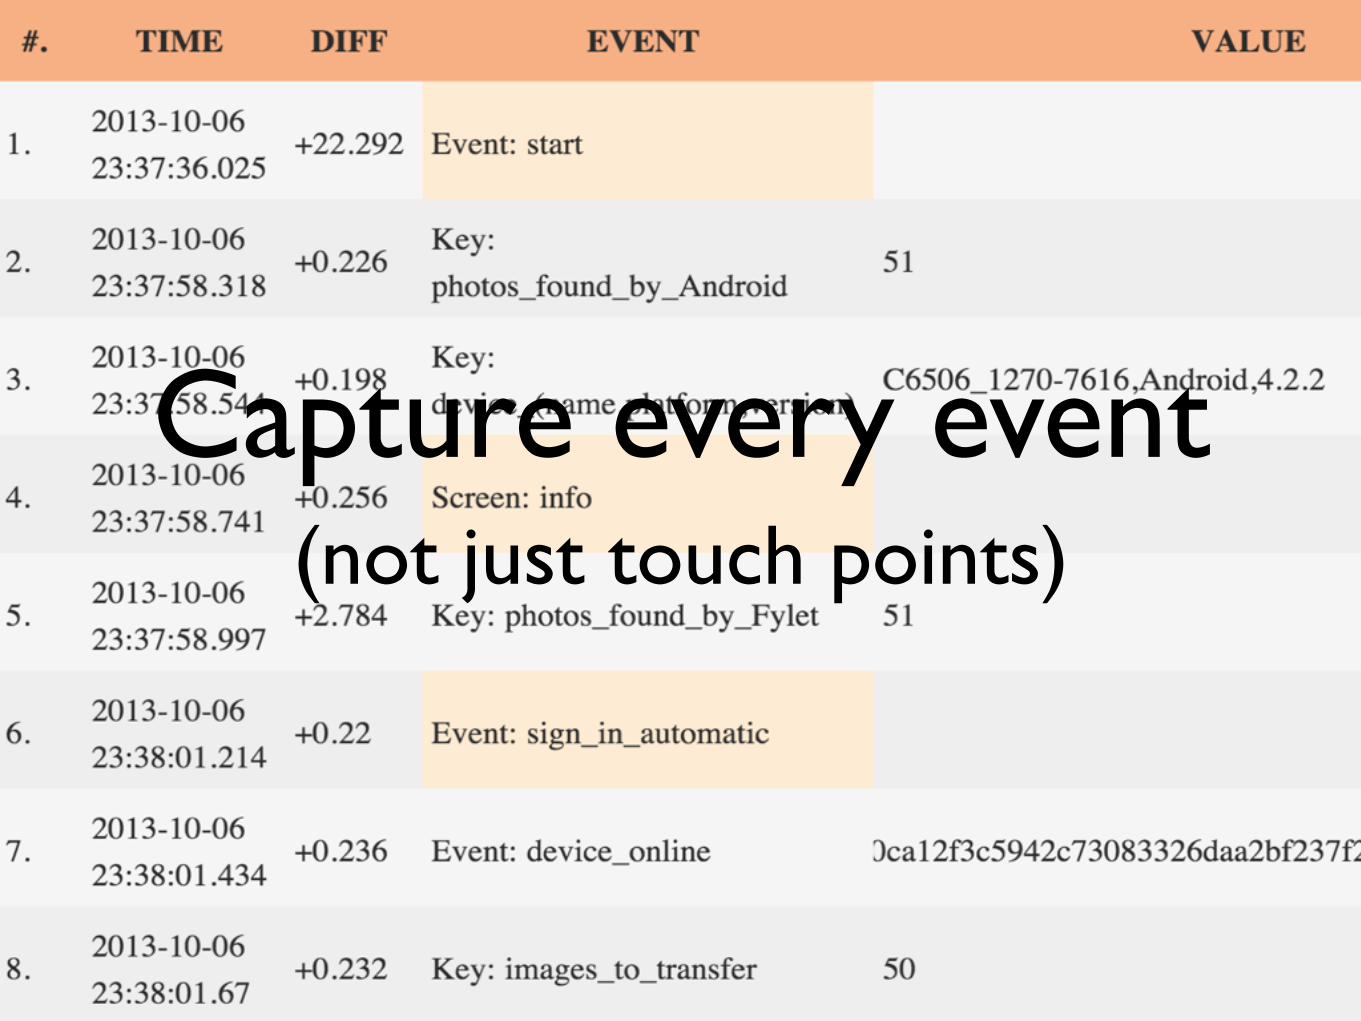
Capture every event (not just touch points)
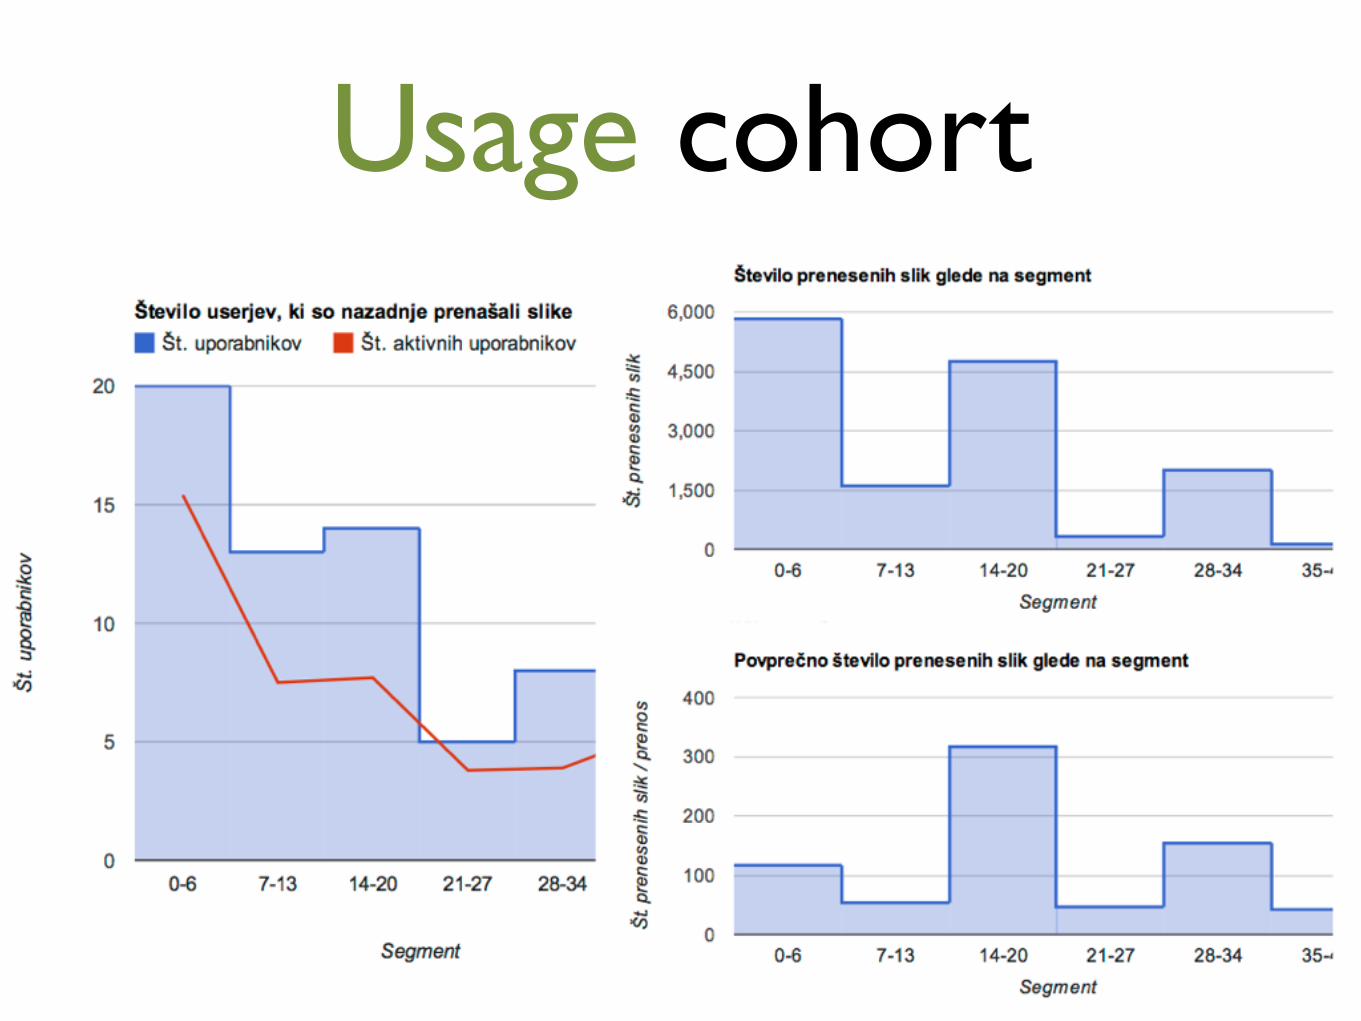
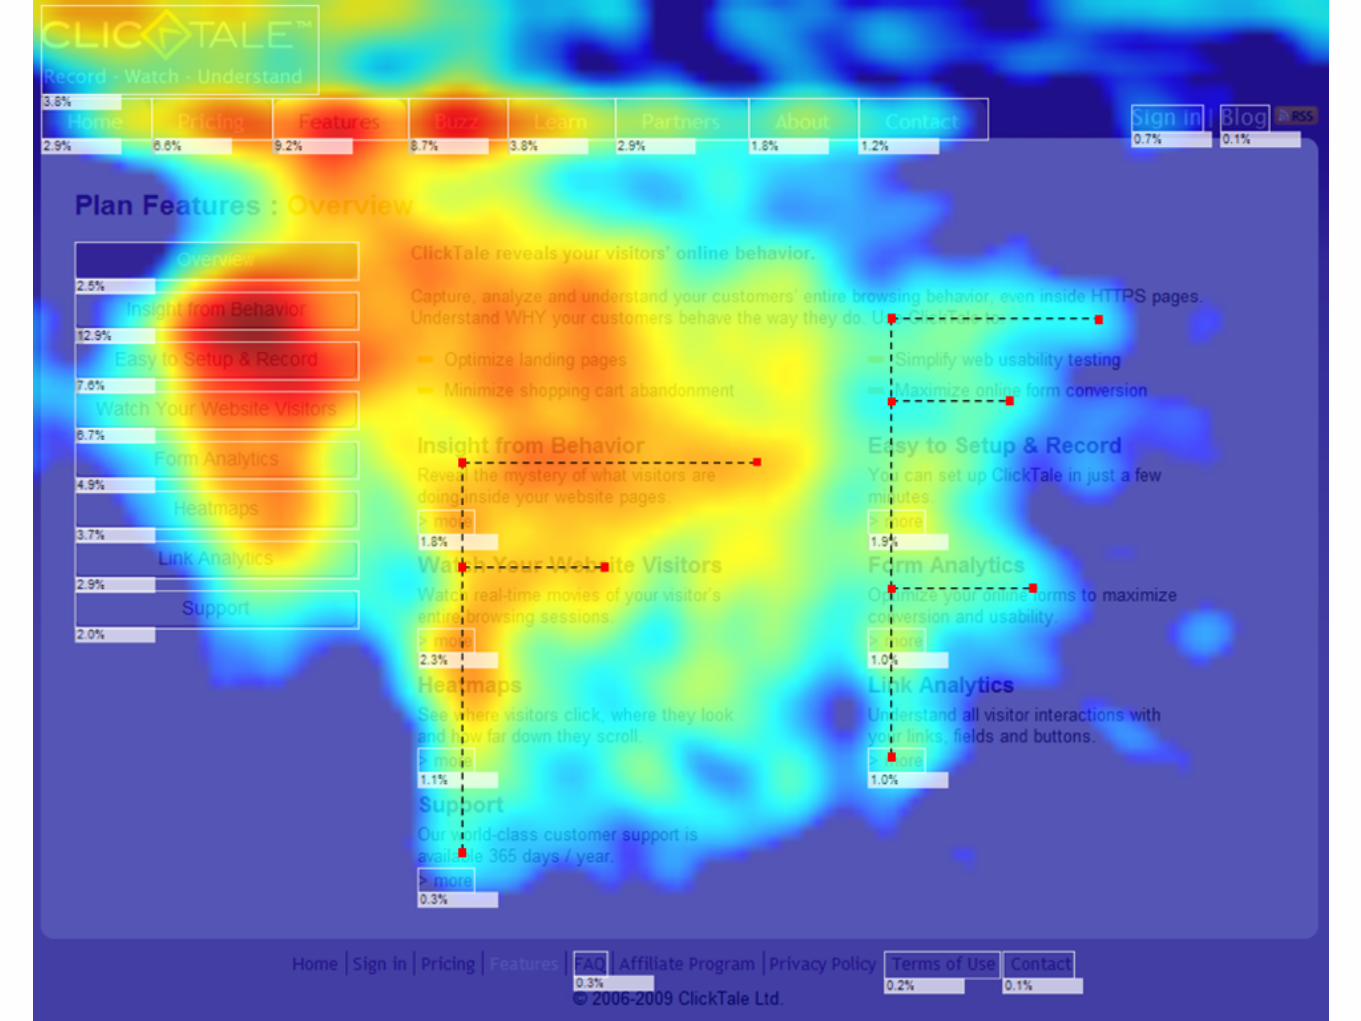
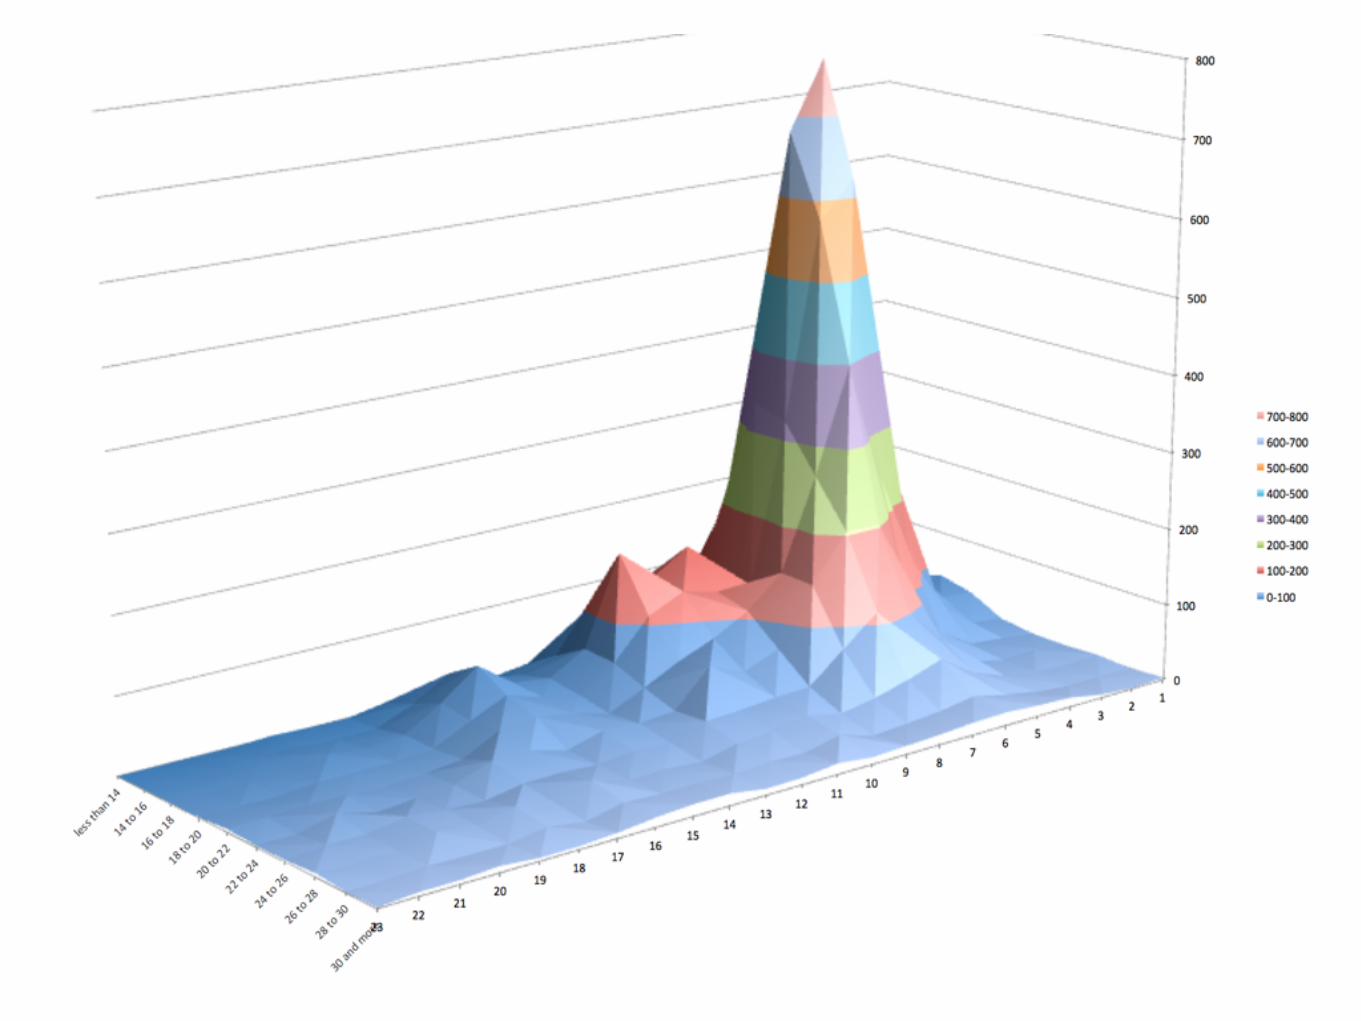
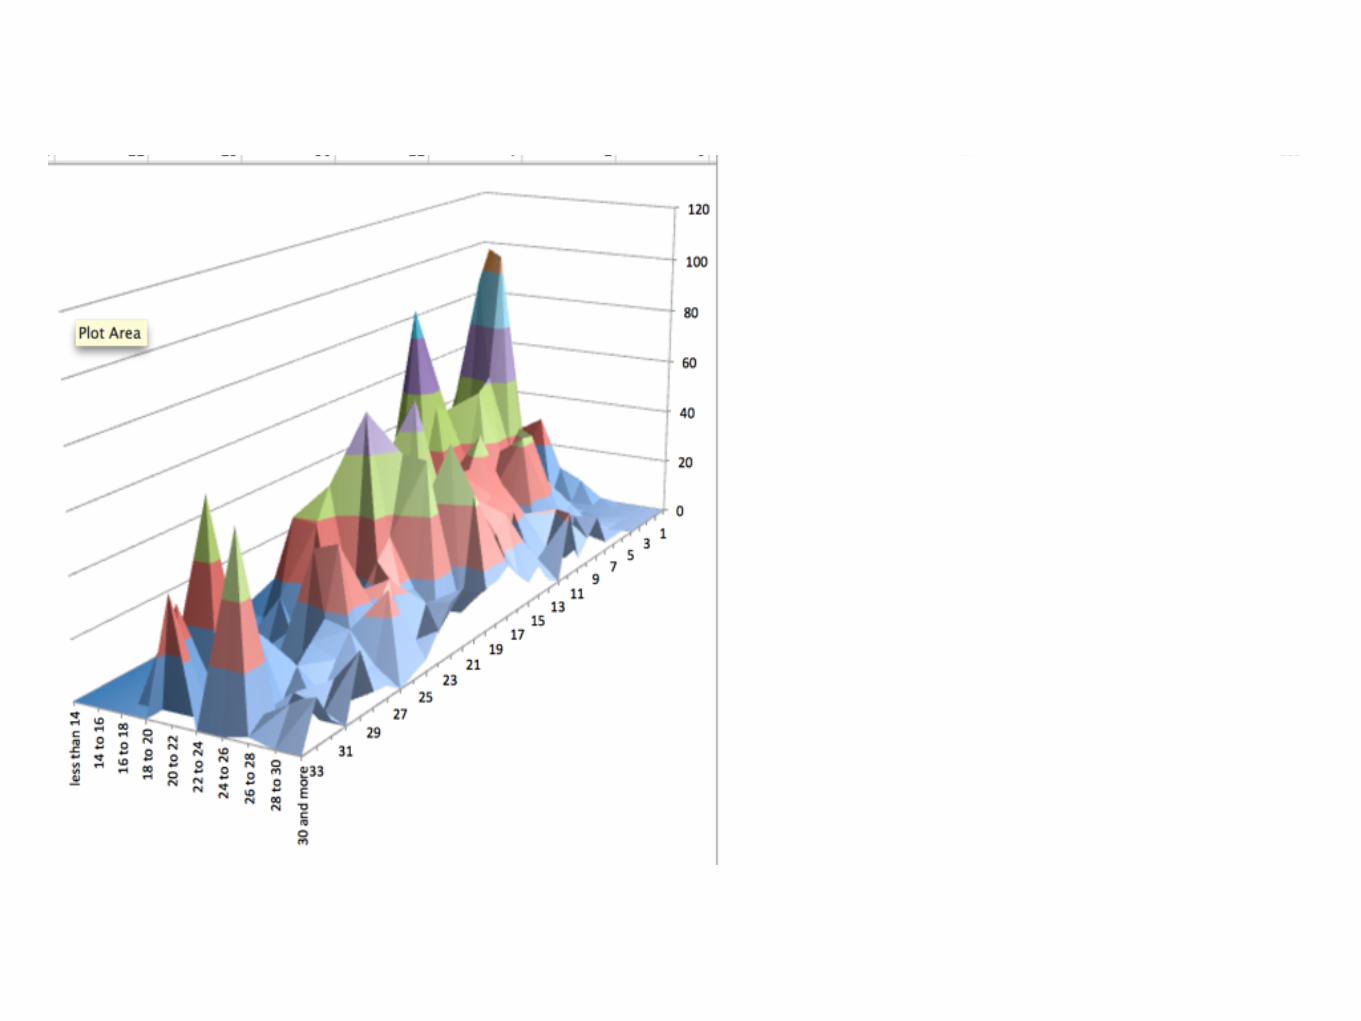
Usage cohort
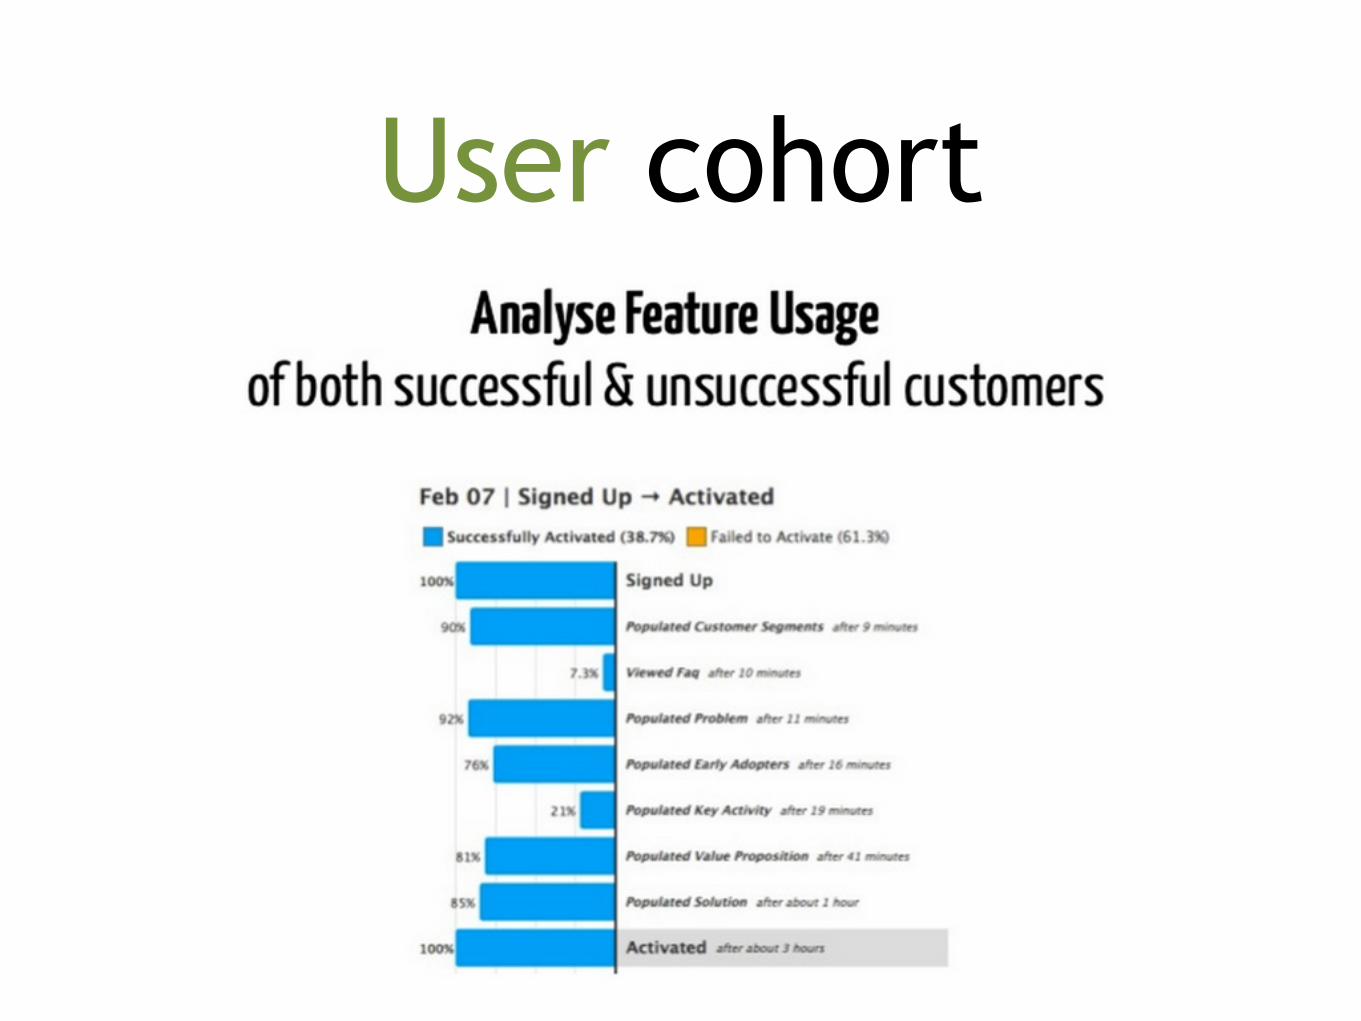
User cohort
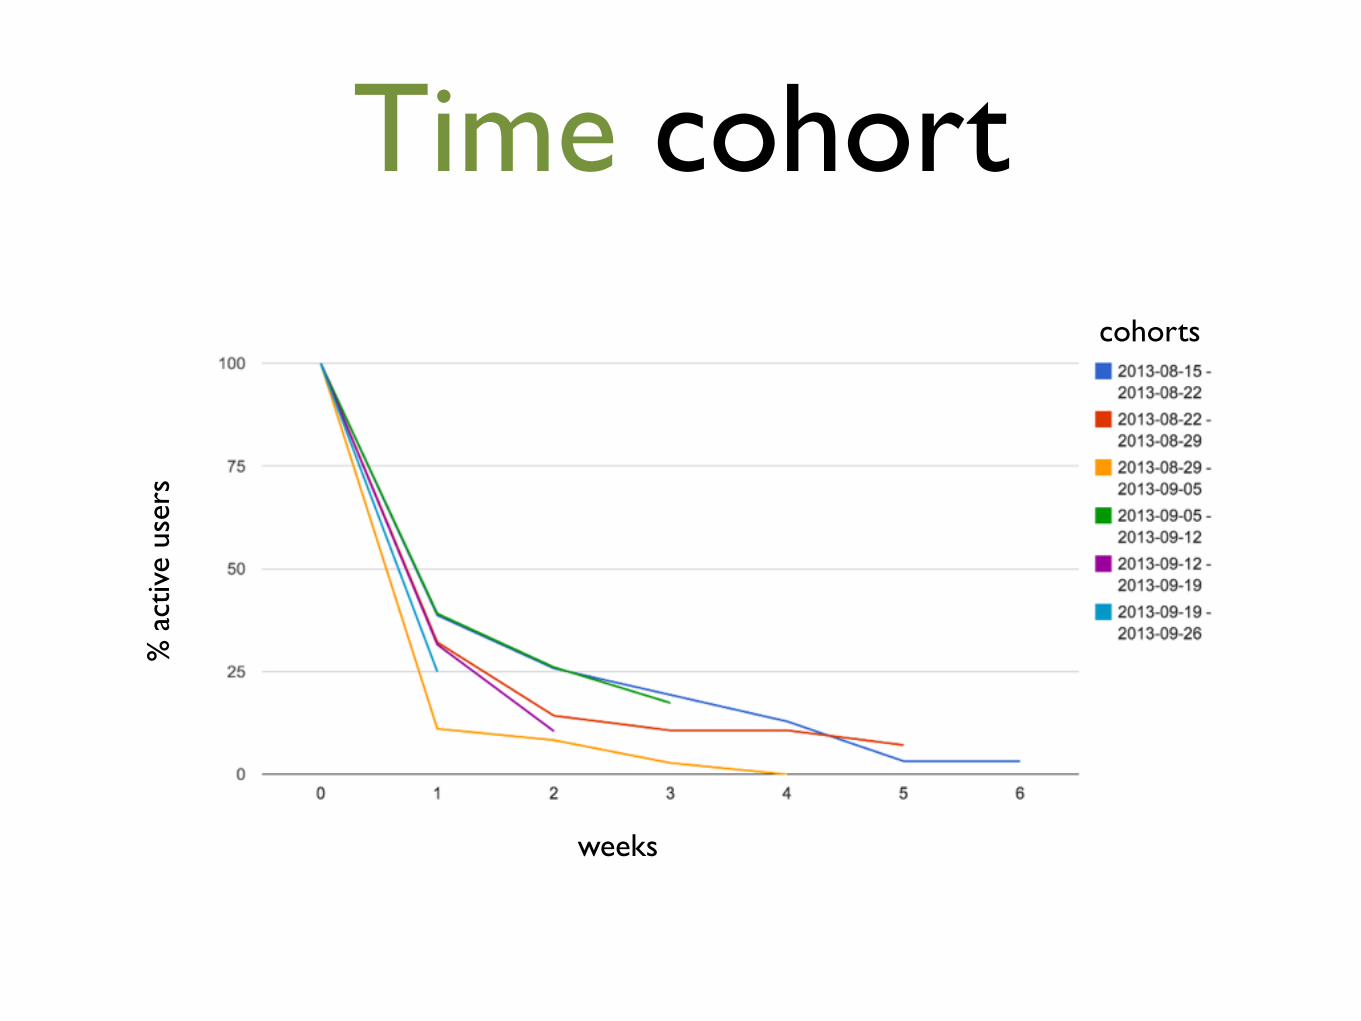
Time cohort
weeks
% a
ctiv
e us
ers
cohorts
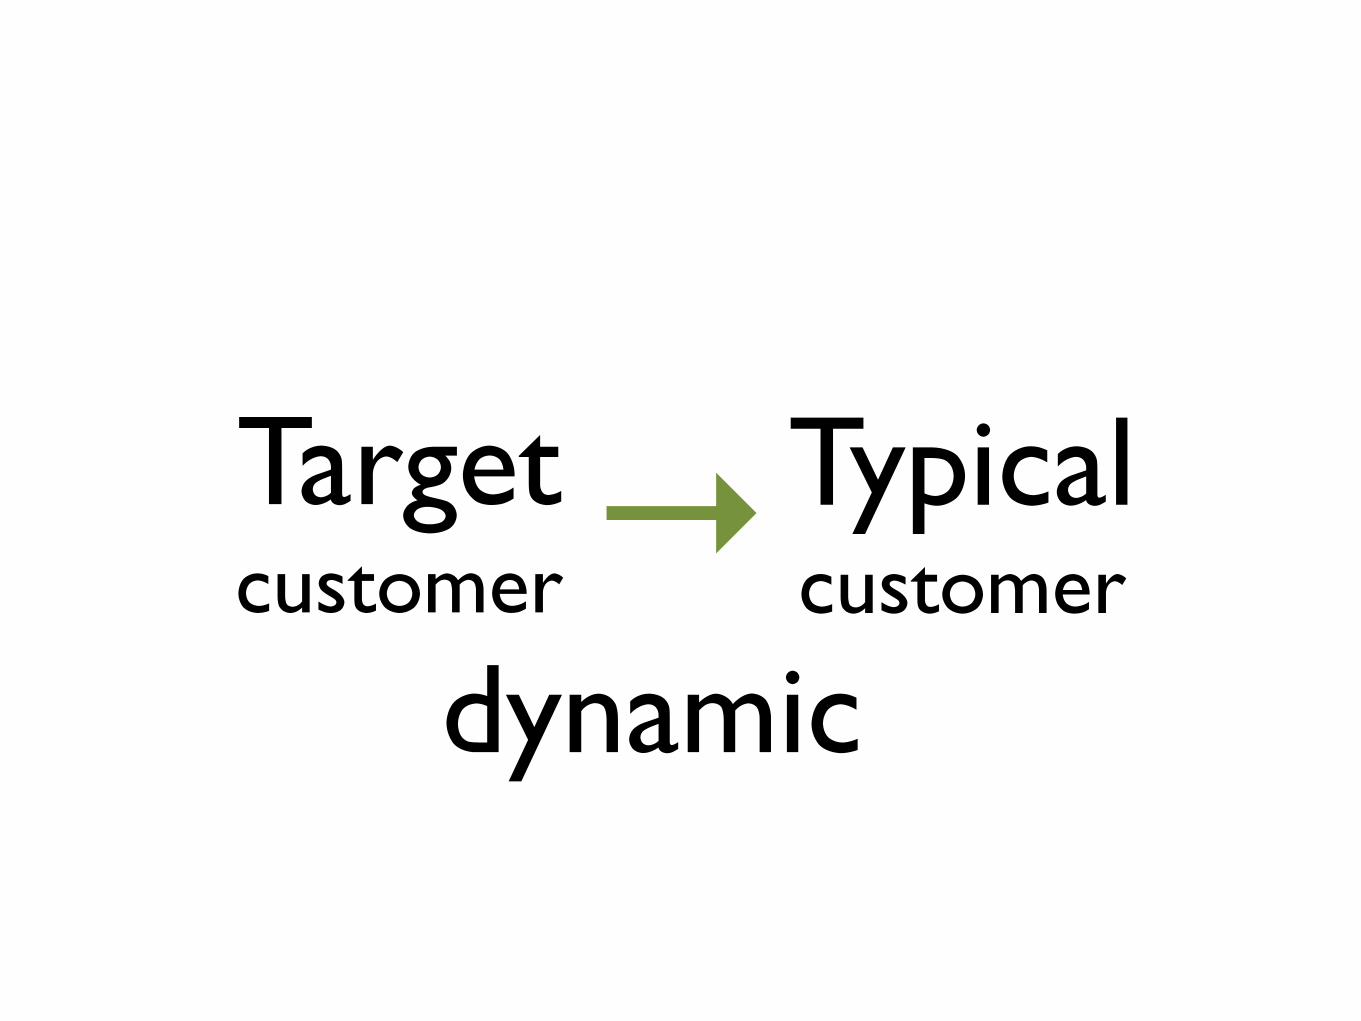
Target customer
Typical customer→
dynamic
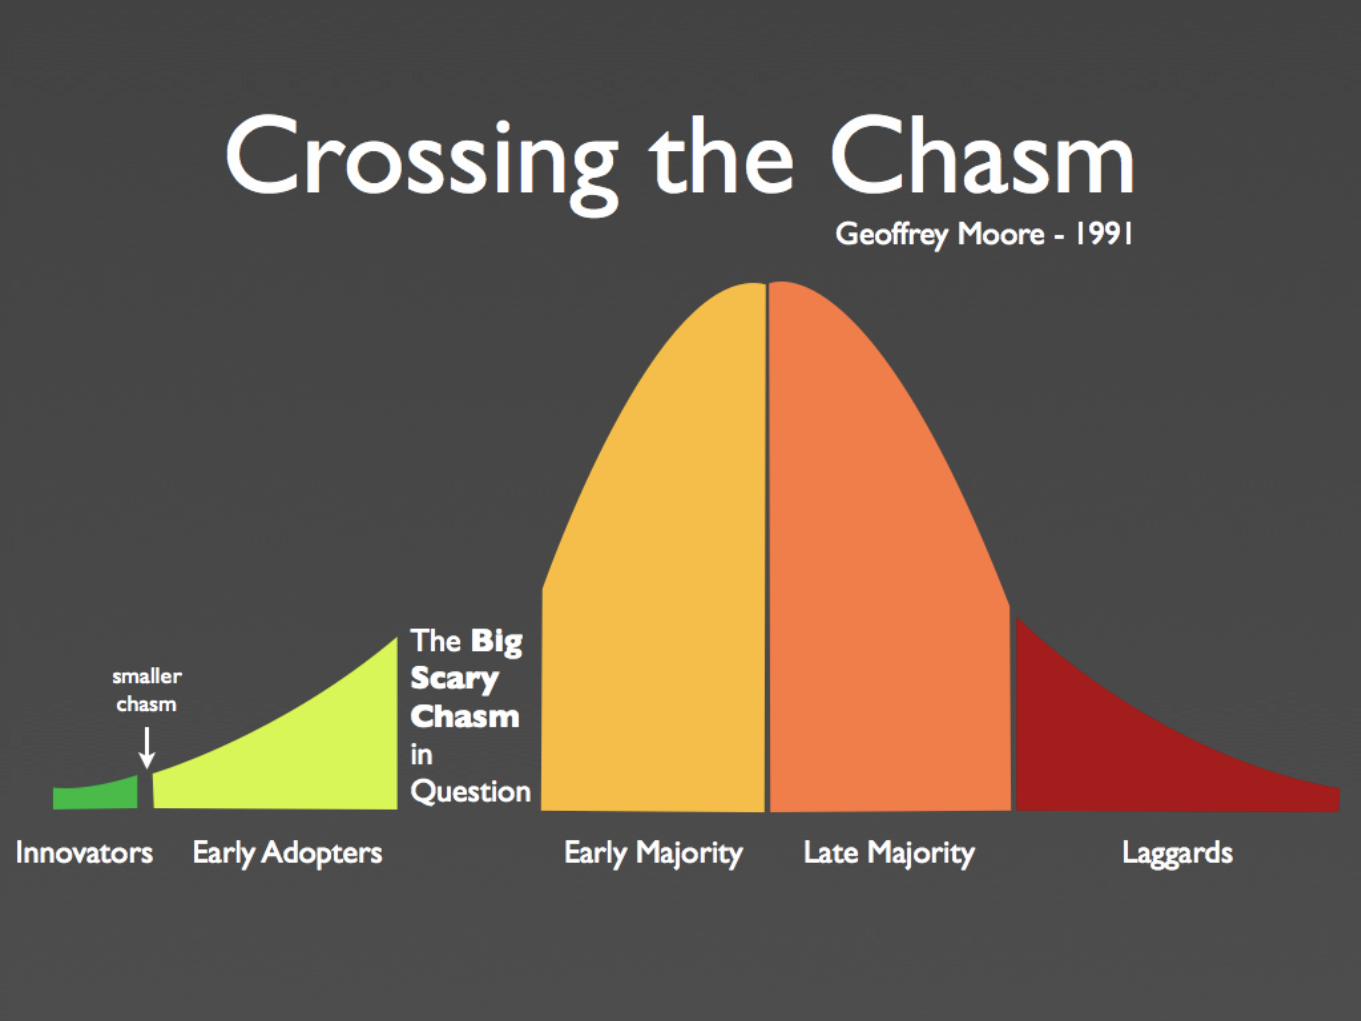
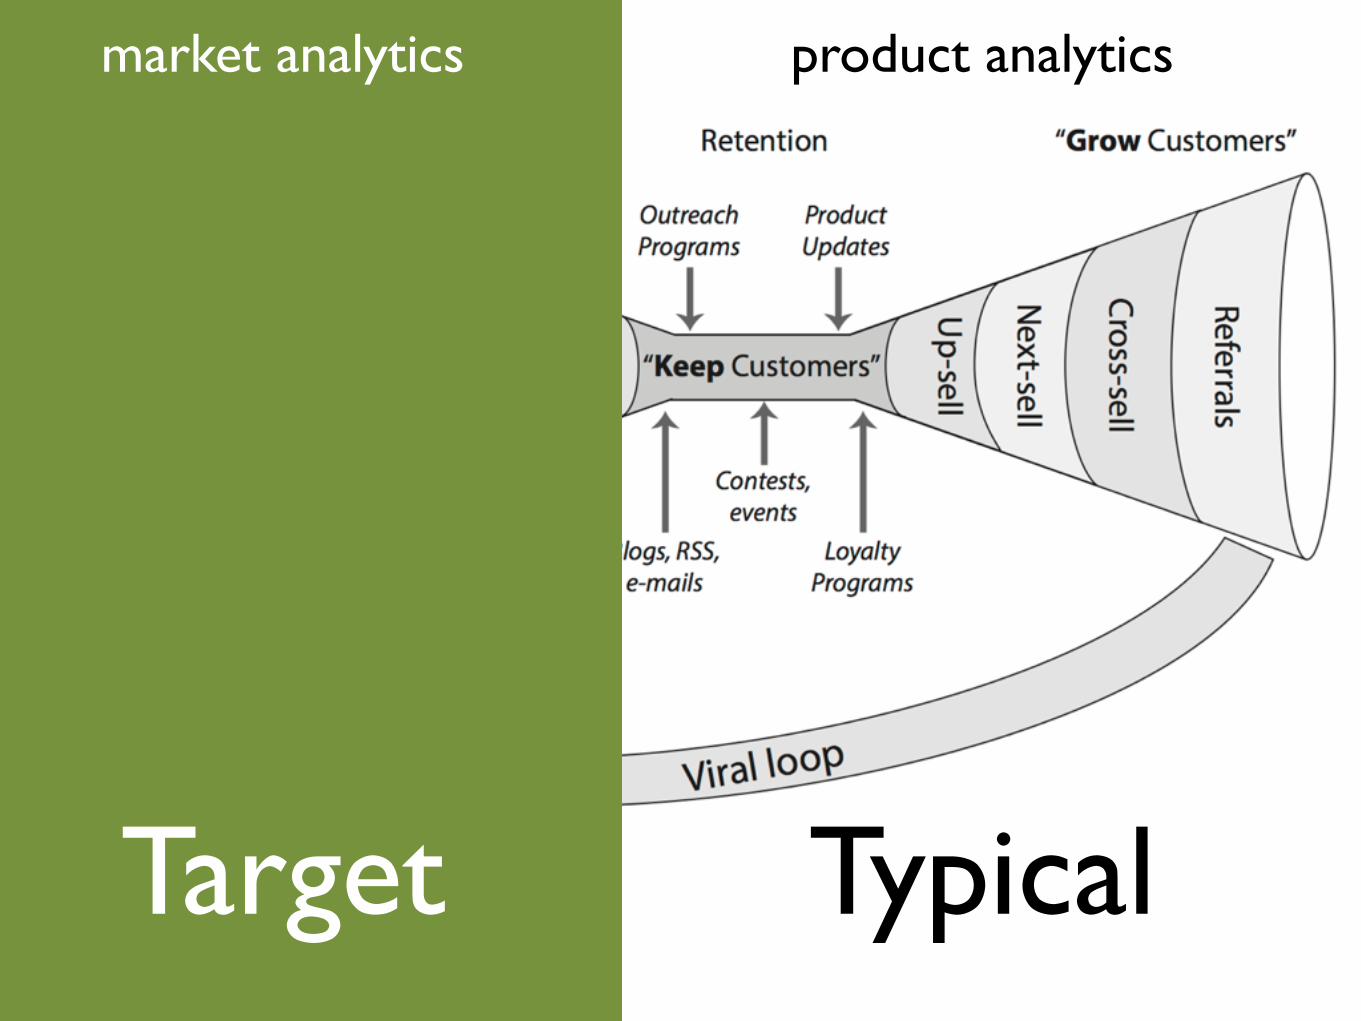
Target Typical
market analytics product analytics
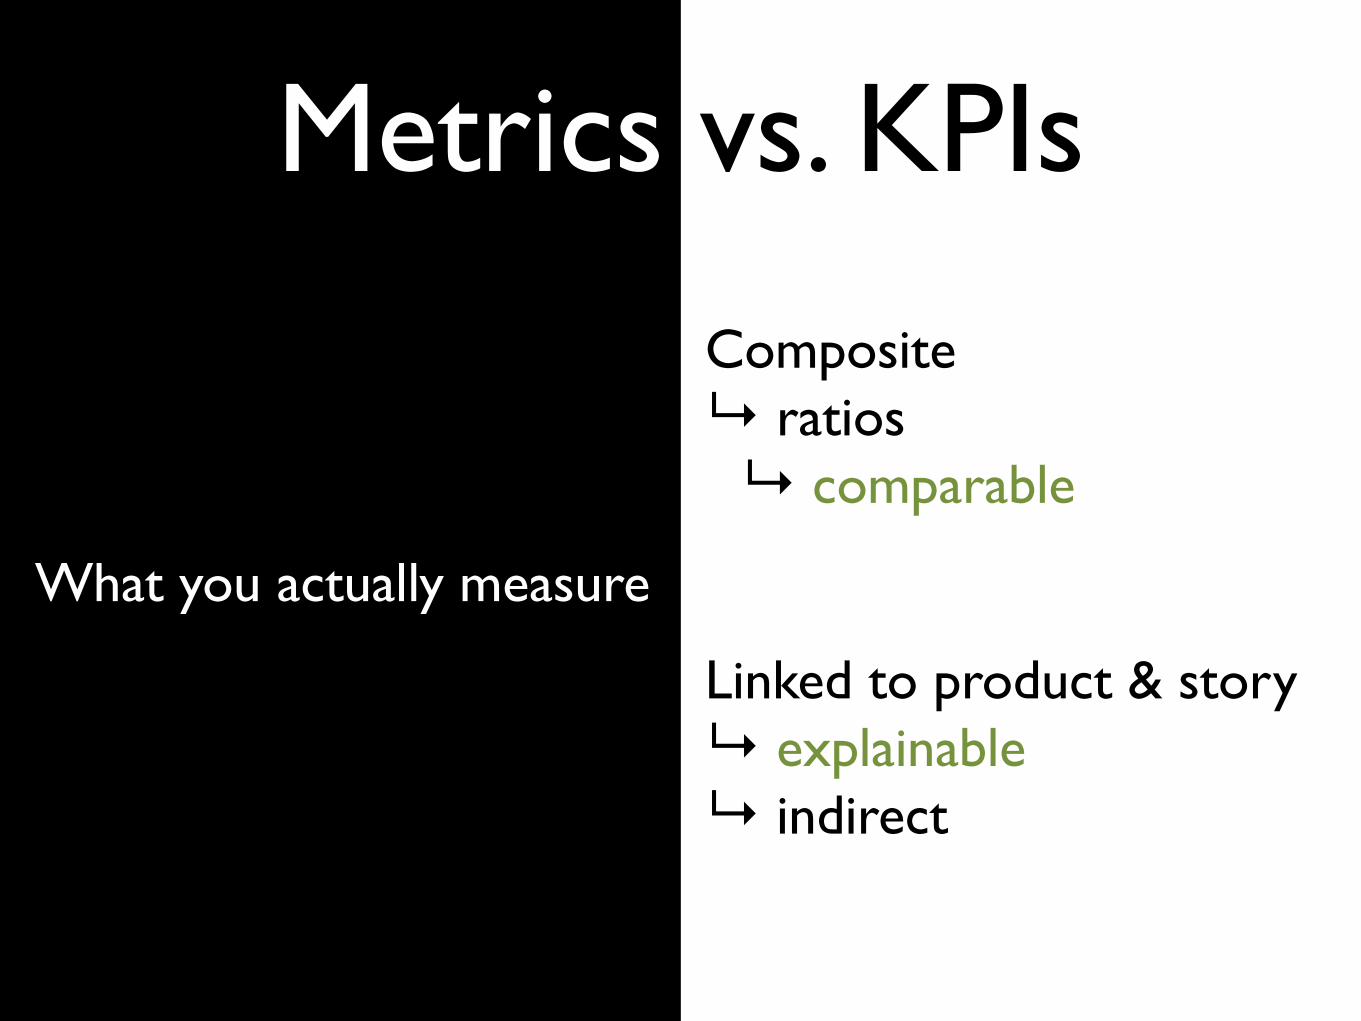
Metrics vs. KPIs
Composite ↳ ratios ↳ comparable
!
!
Linked to product & story ↳ explainable ↳ indirect
What you actually measure

Focus on one KPI at a time

The ambulance response time problem
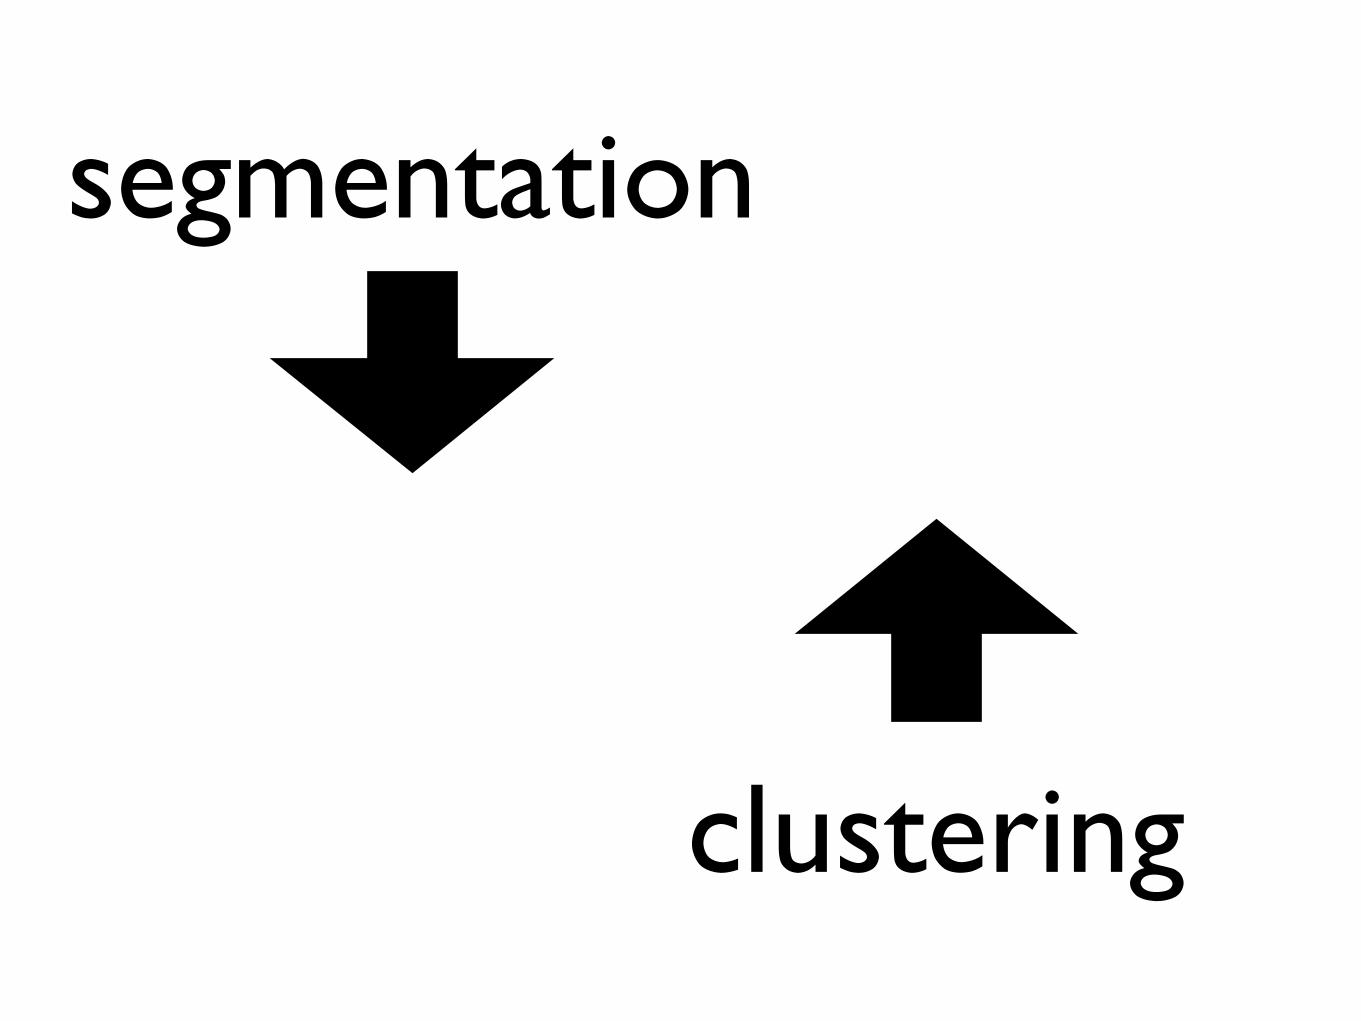
clustering
segmentation
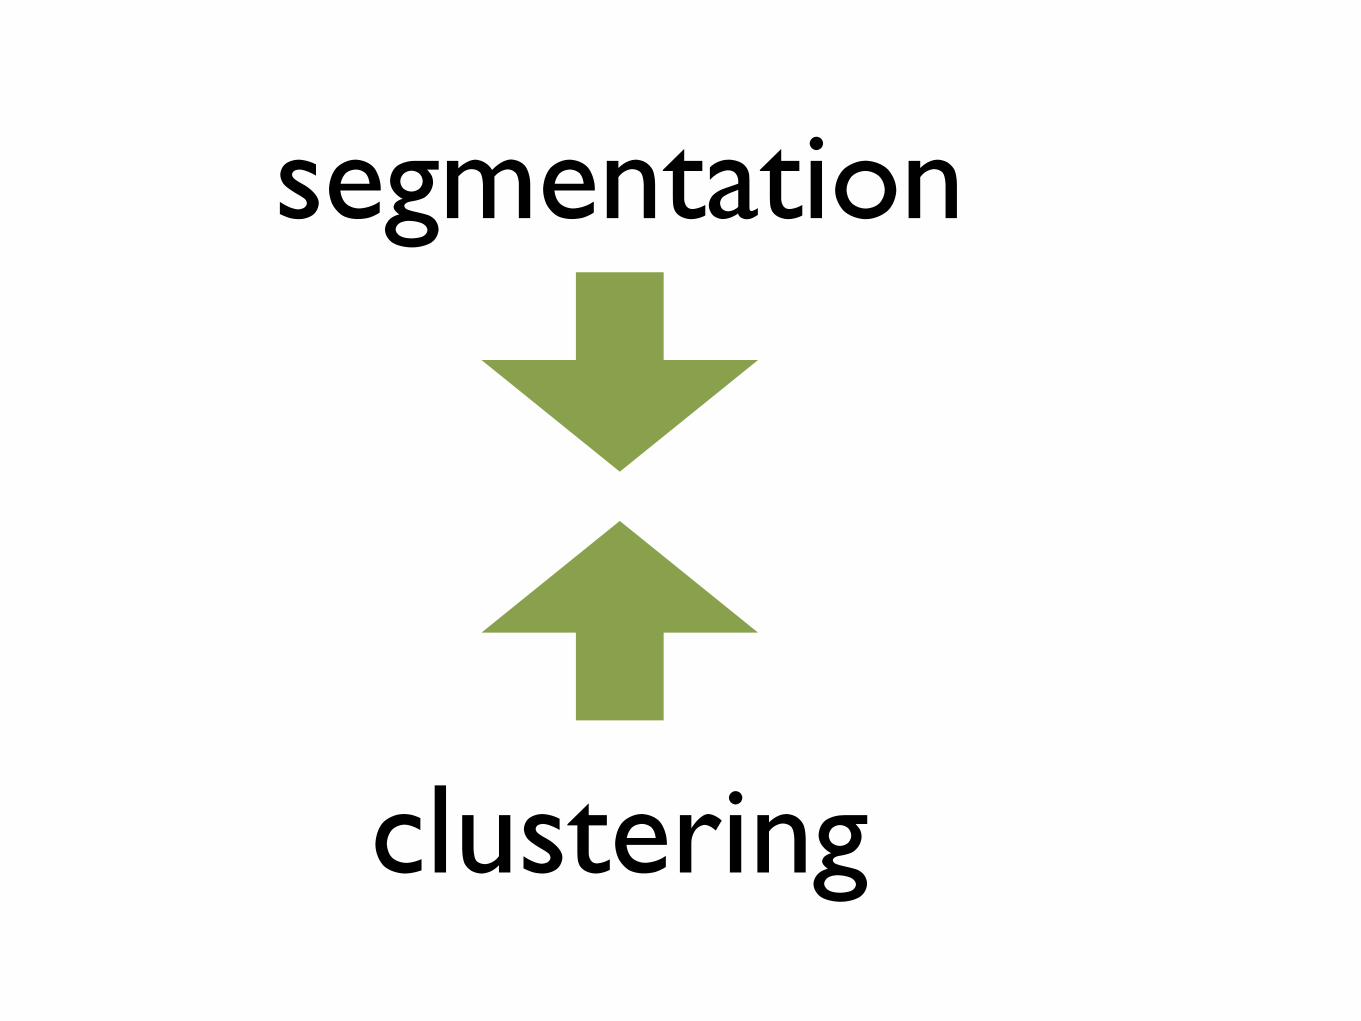
clustering
segmentation

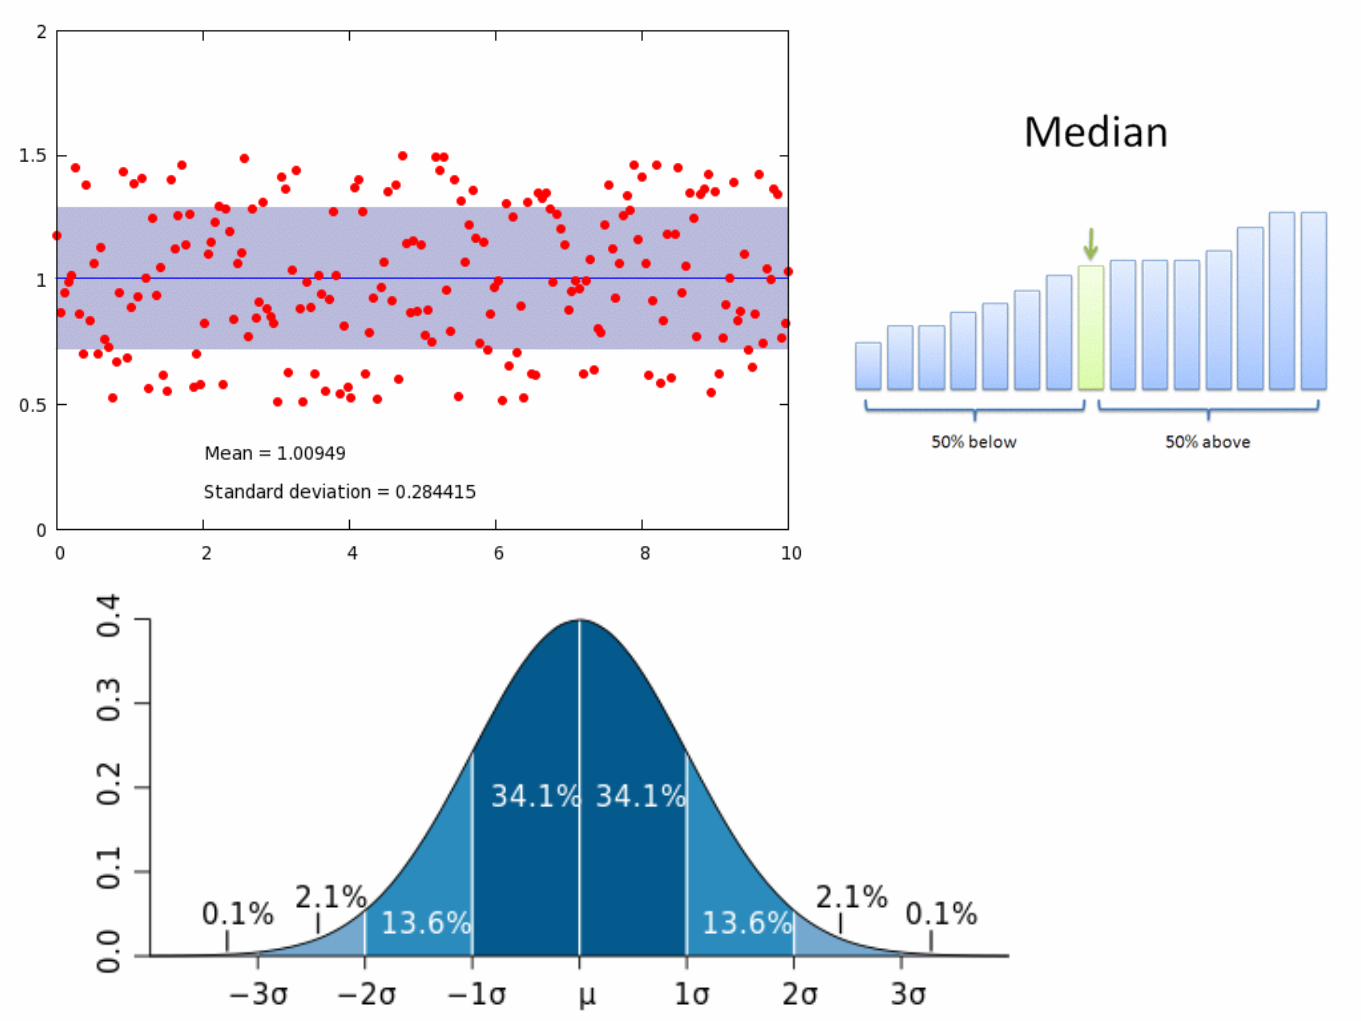
Statistics 101
32
33
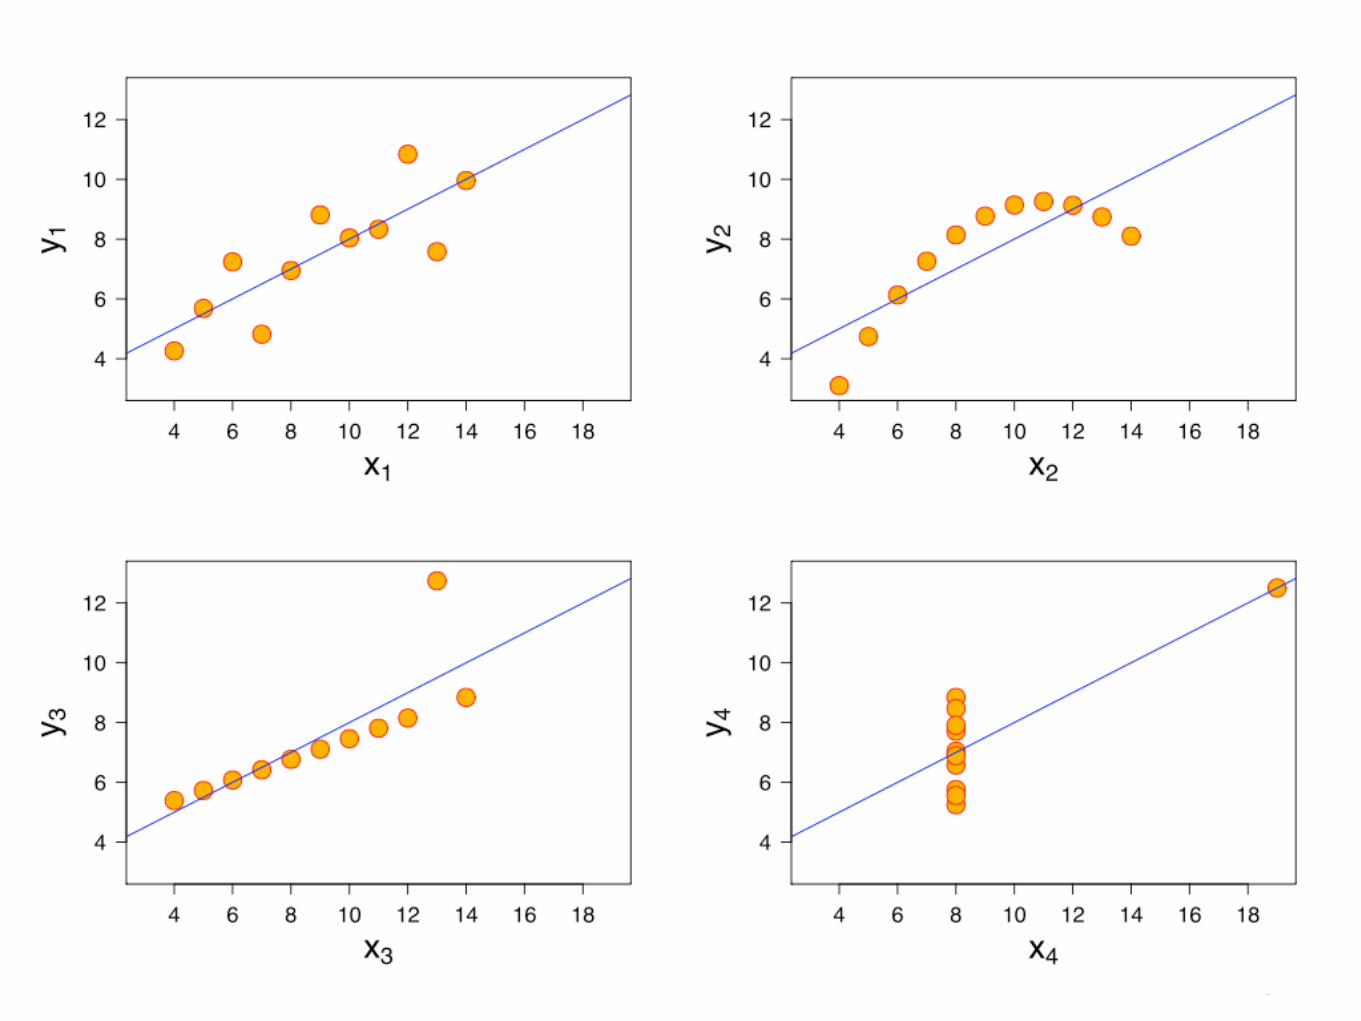
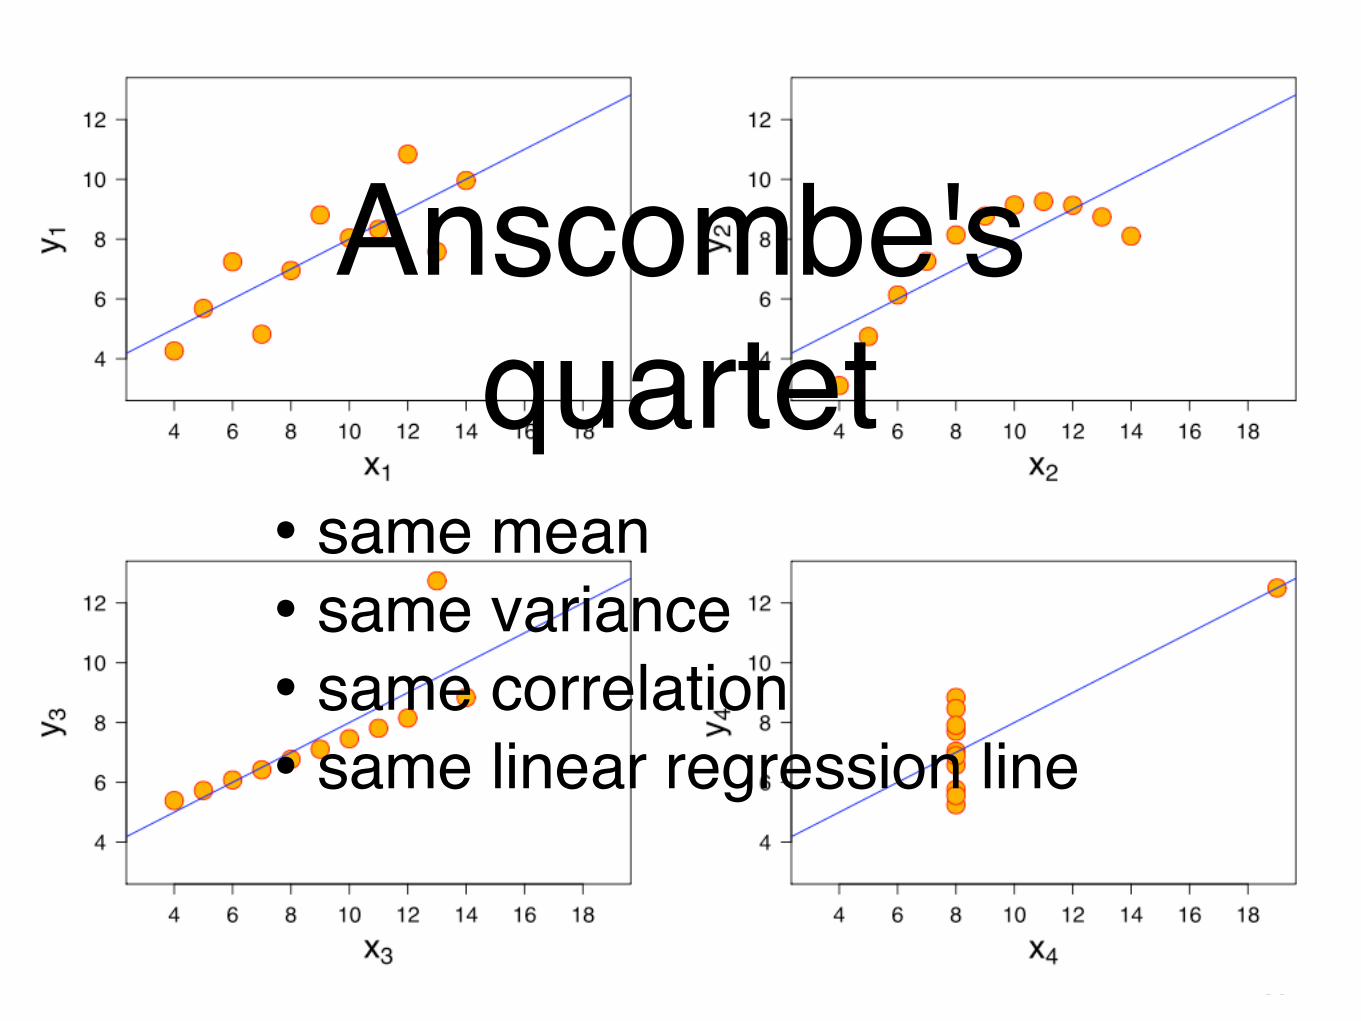
Anscombe's quartet!
!
• same mean!• same variance!• same correlation!• same linear regression line!
2
1
3
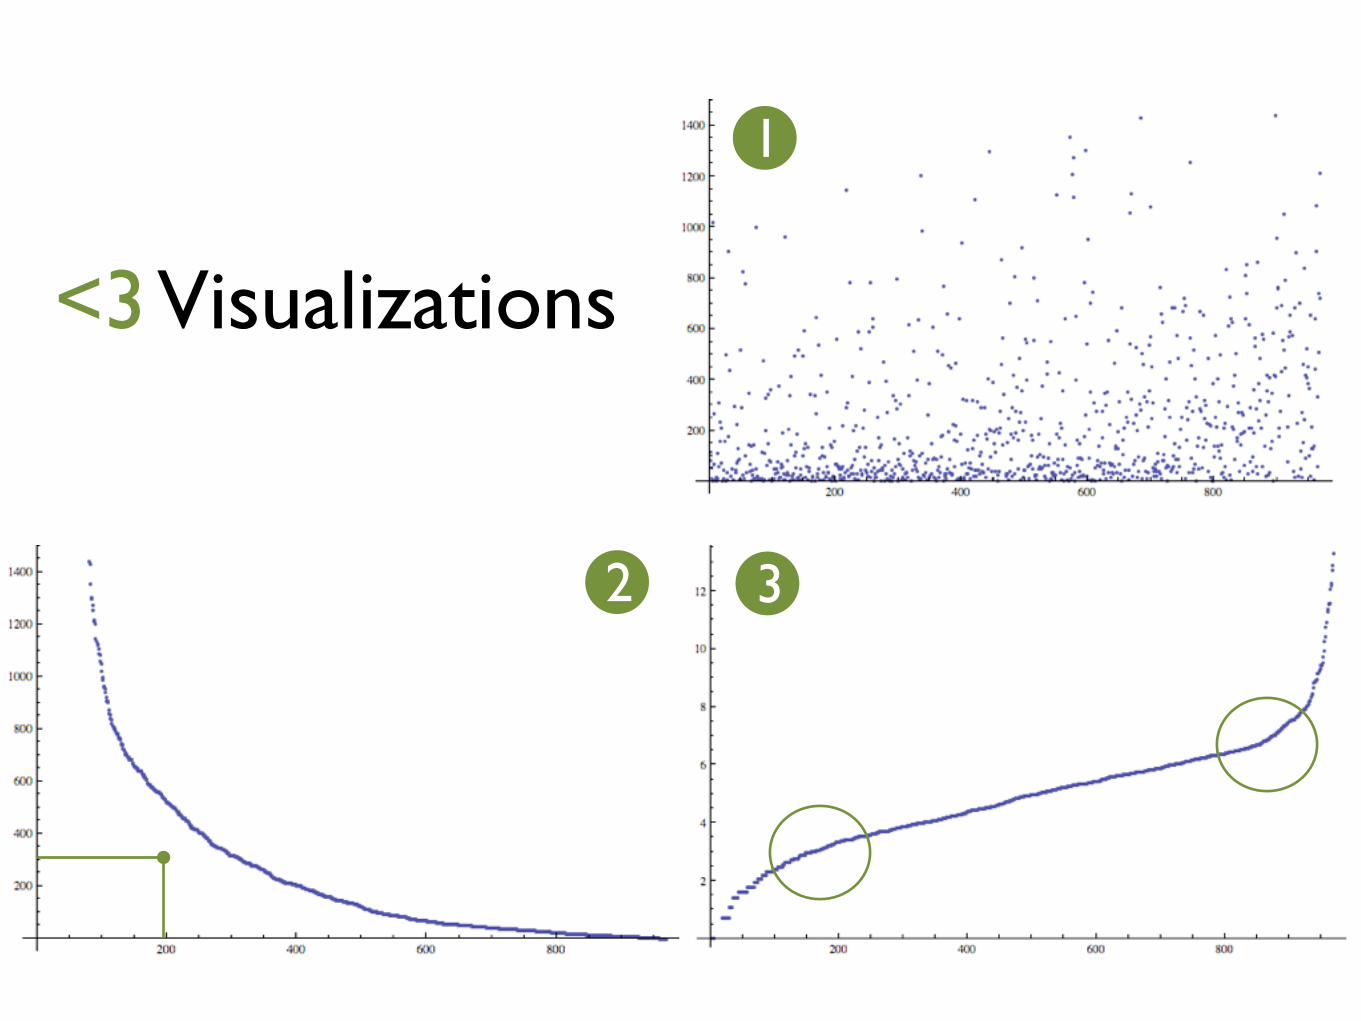
<3 Visualizations
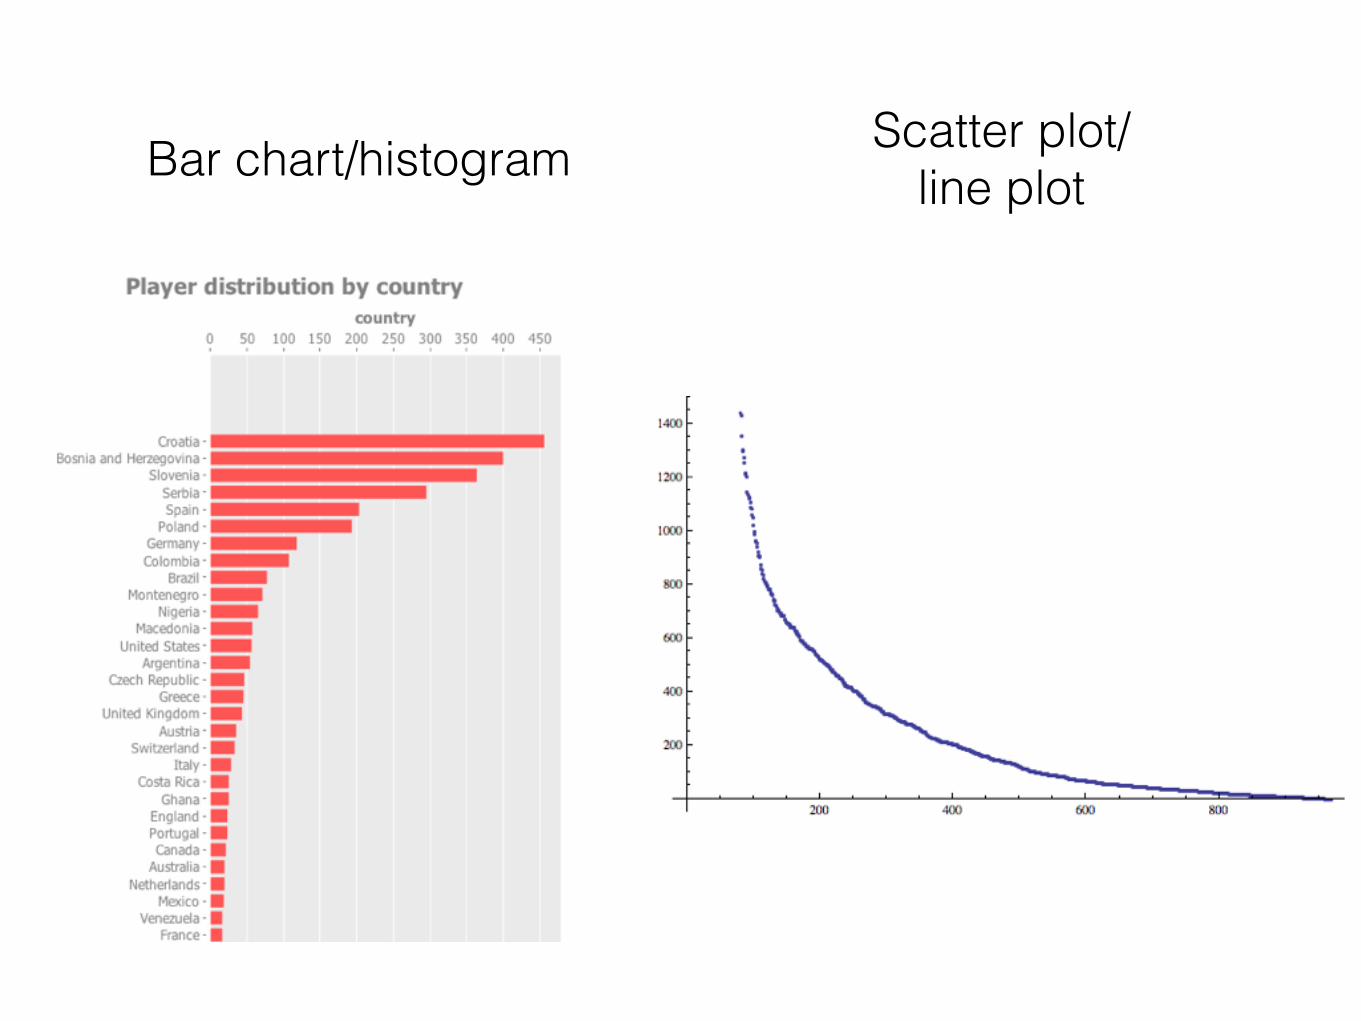
Bar chart/histogram Scatter plot/ line plot
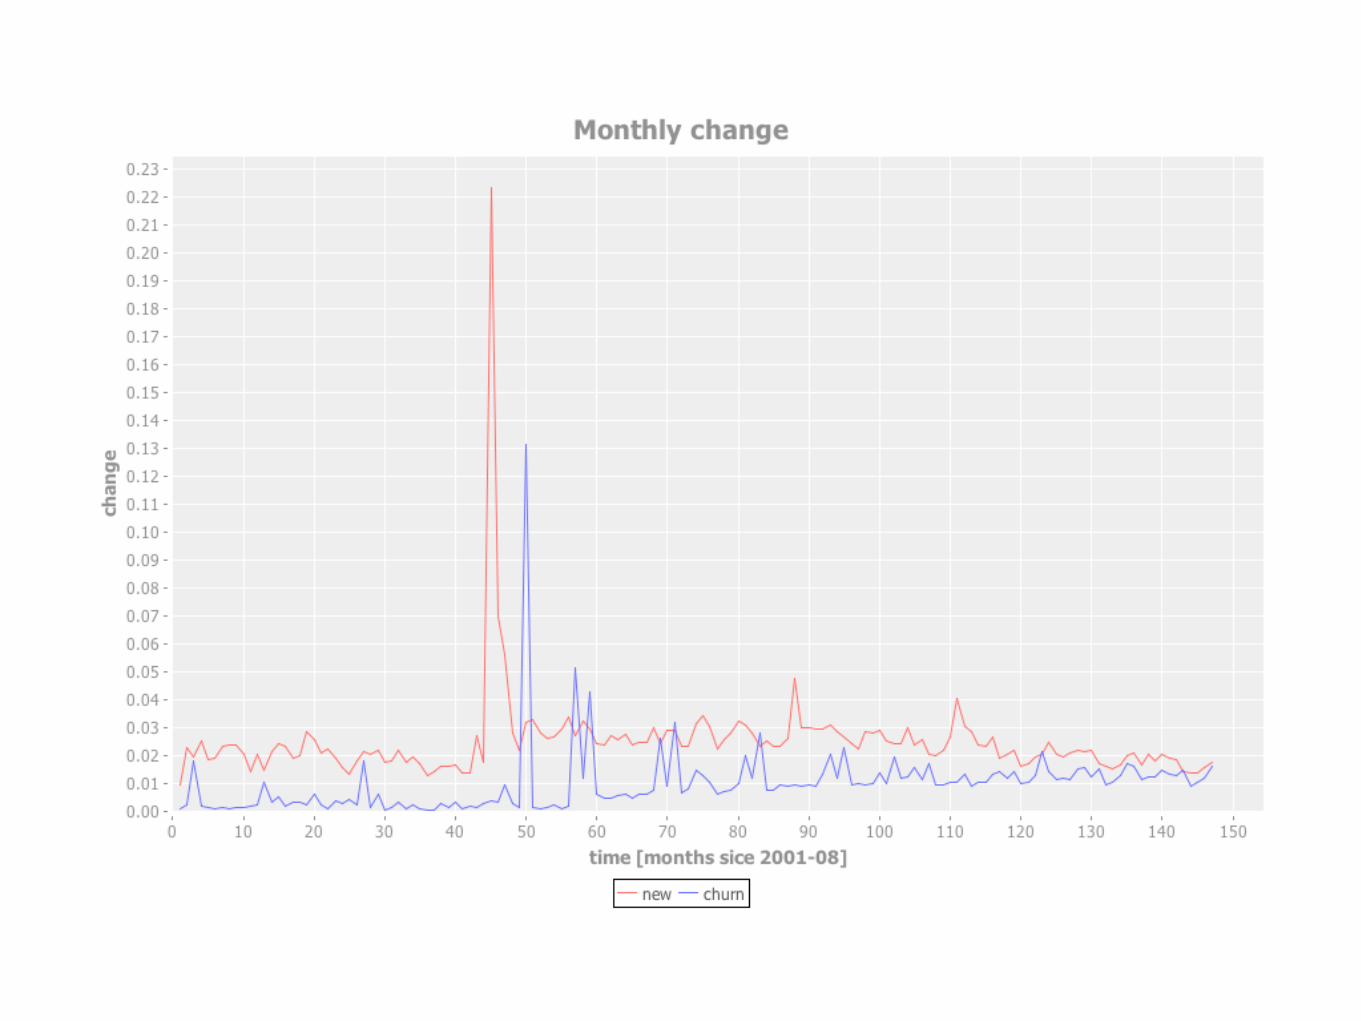
Working with series
1st derivate: change!2nd derivate: change of change
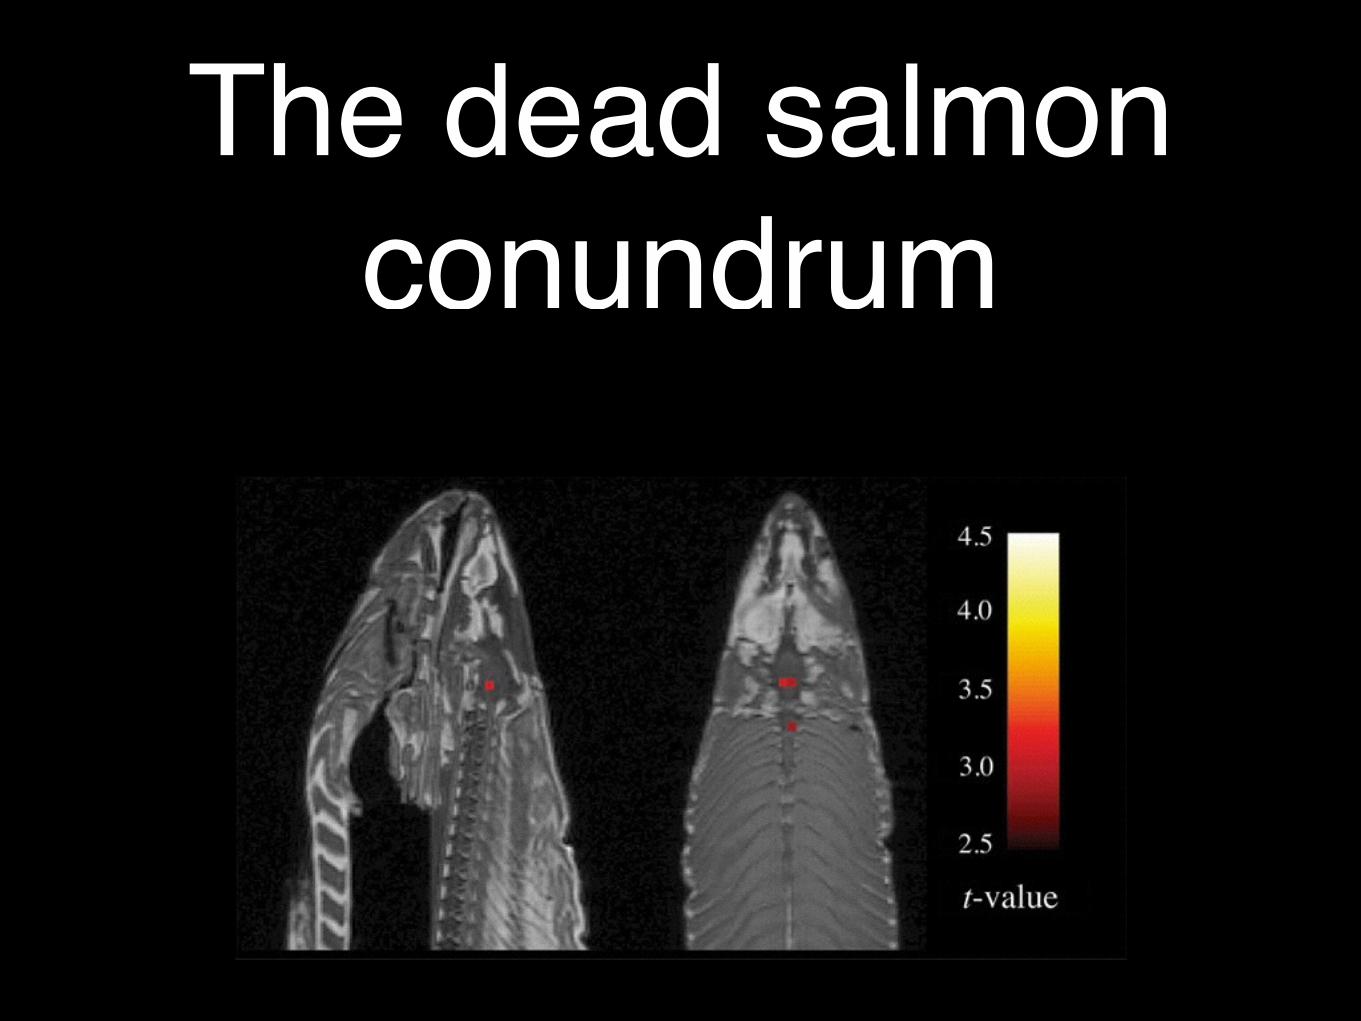
The dead salmon conundrum
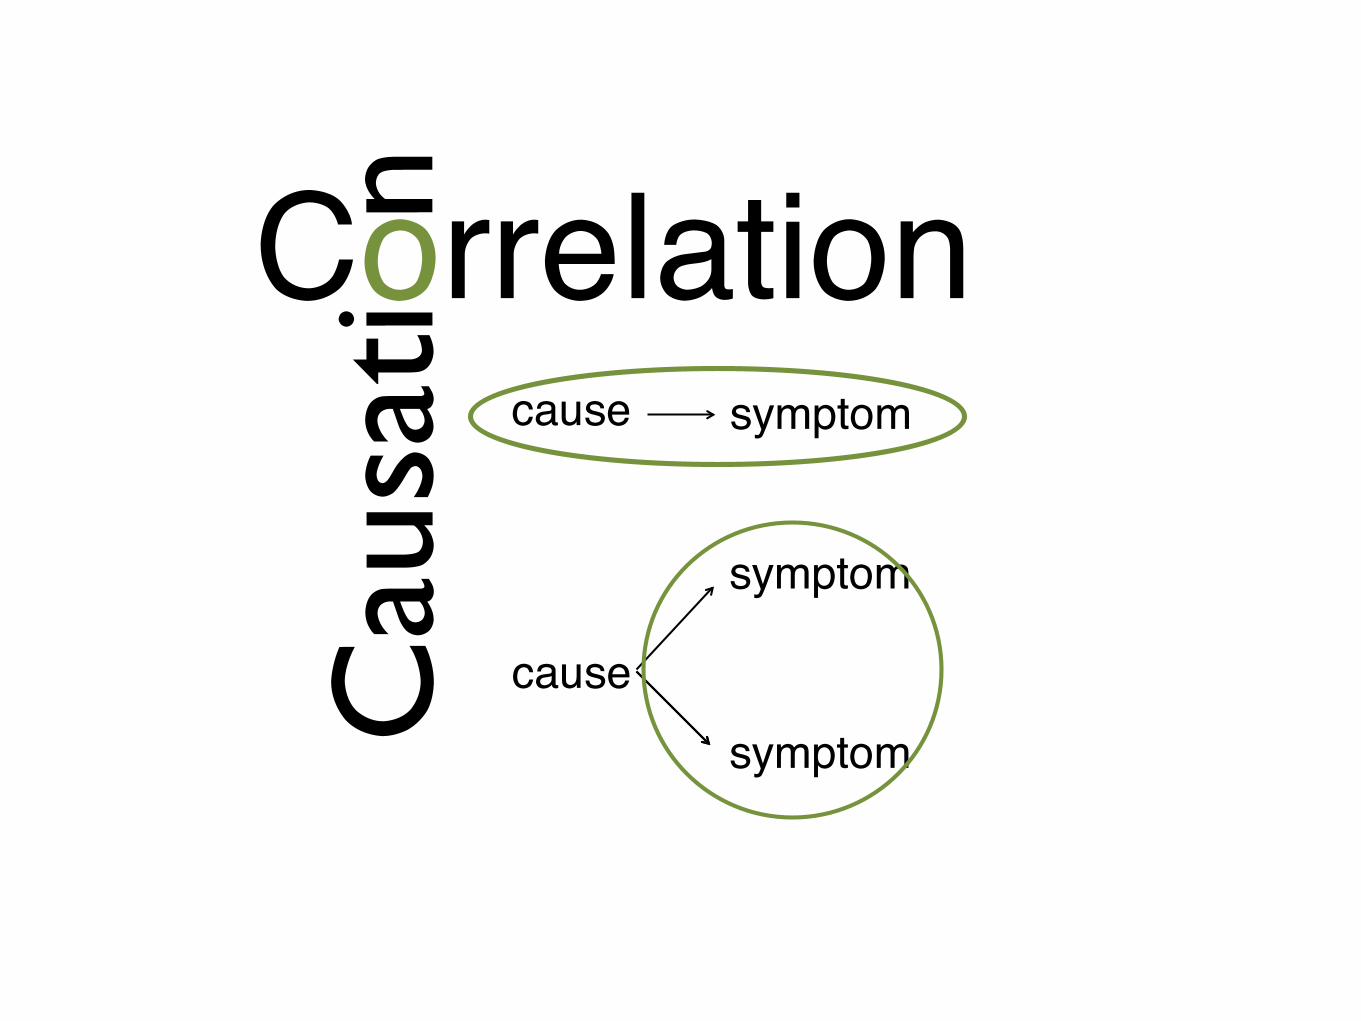
Correlation!!C
ausa
ti n!
cause!
symptom!
symptom!
symptom!
cause!
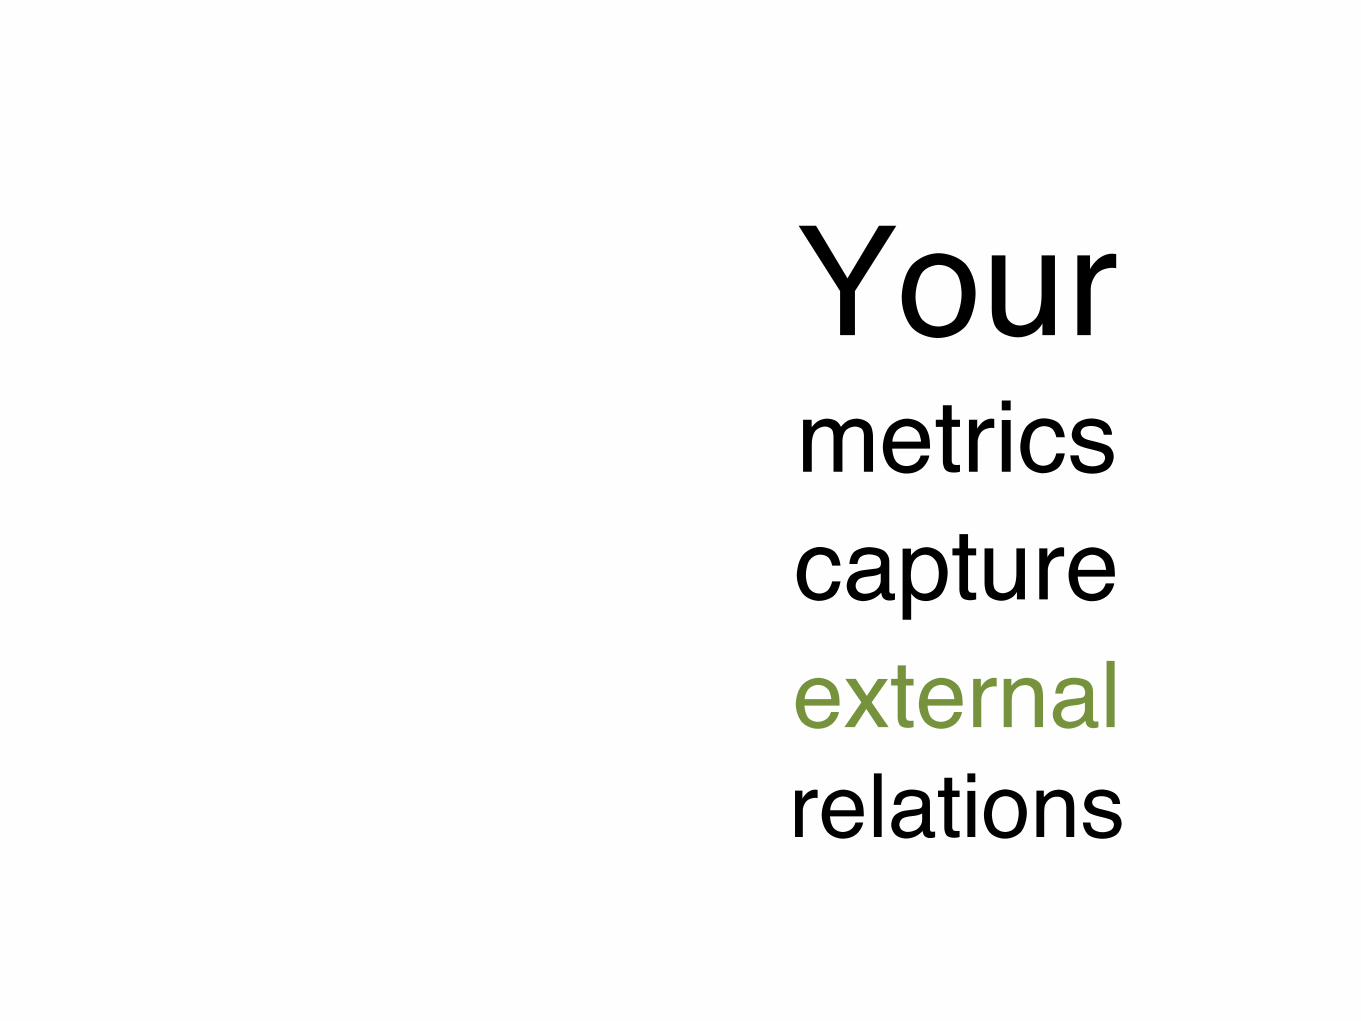
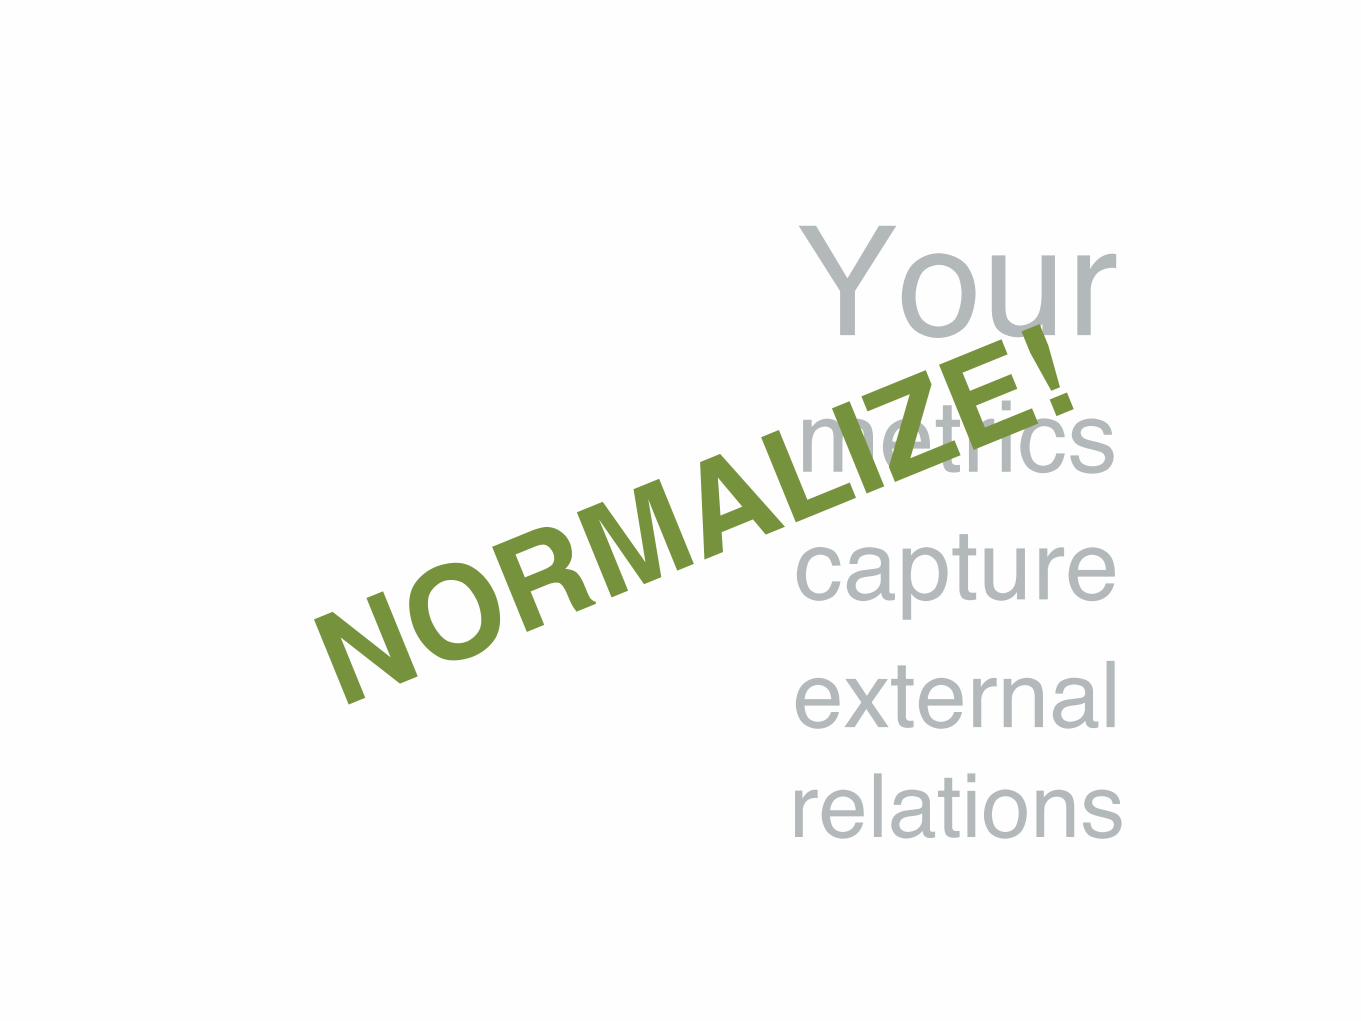
Your
metrics capture external relations!
Your
metrics capture external relations!
NORMAL
IZE!!
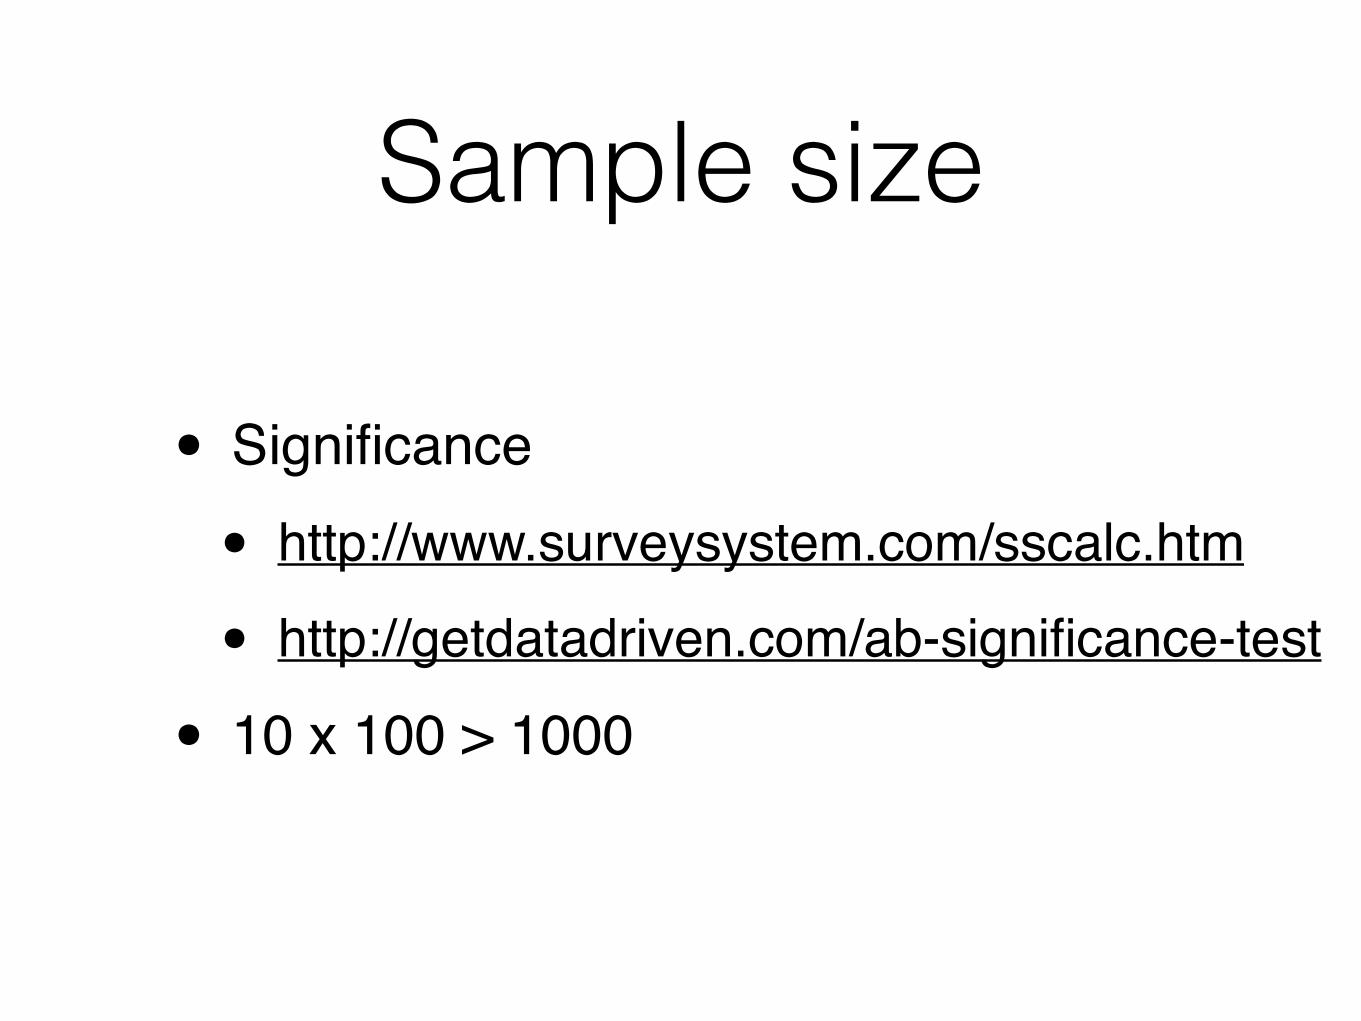
Sample size
• Significance!
• http://www.surveysystem.com/sscalc.htm!
• http://getdatadriven.com/ab-significance-test!
• 10 x 100 > 1000
More data > better model
Hustling data: proxy touch points
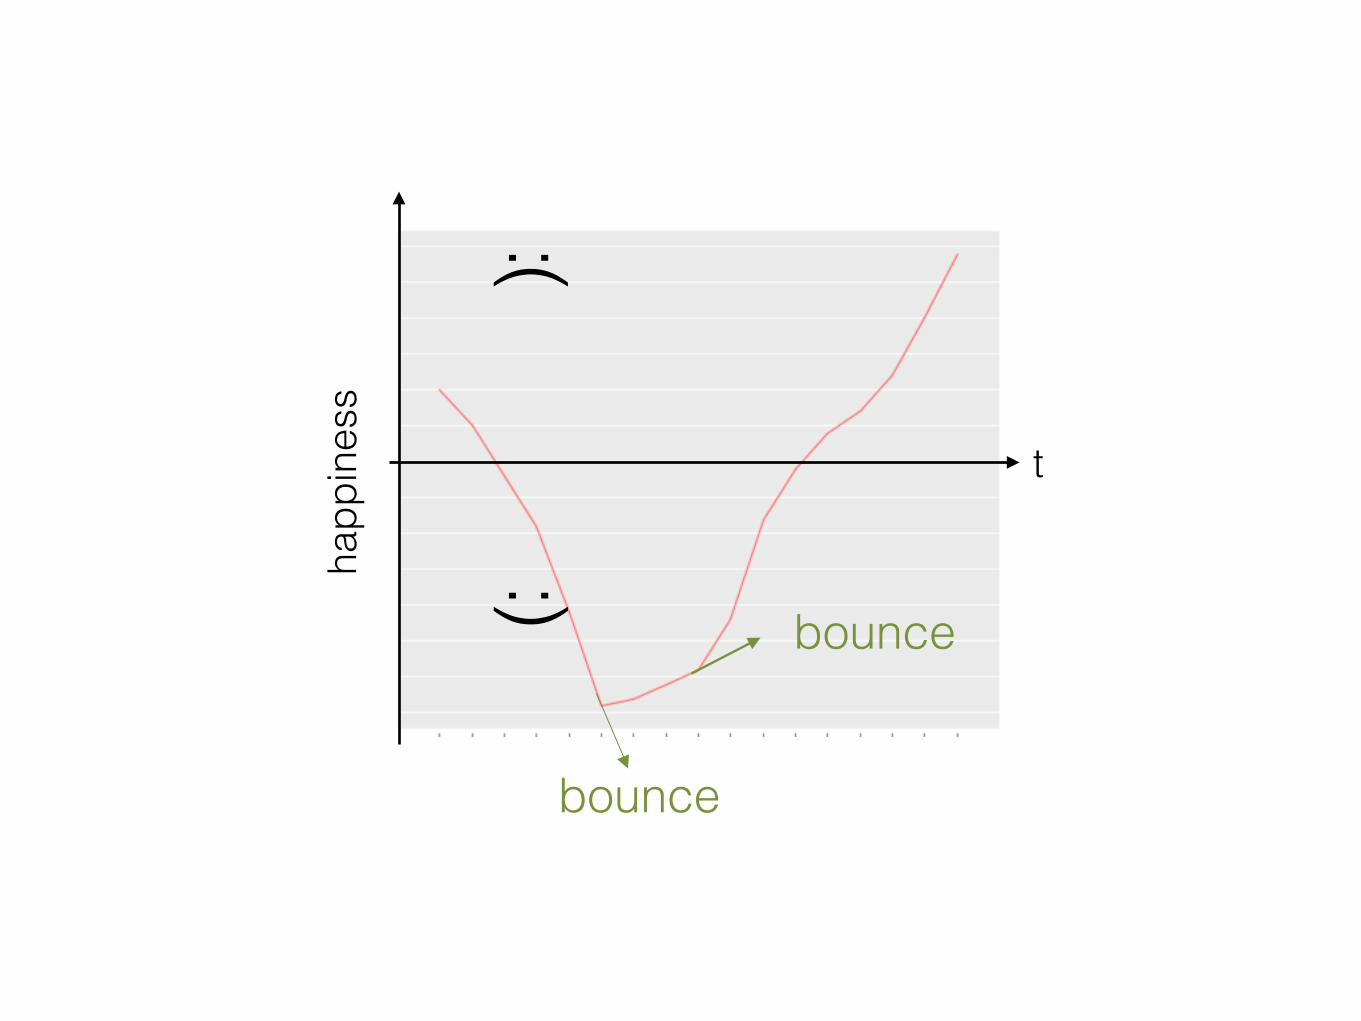
:)
:(
t
happ
ines
s
bounce
bounce
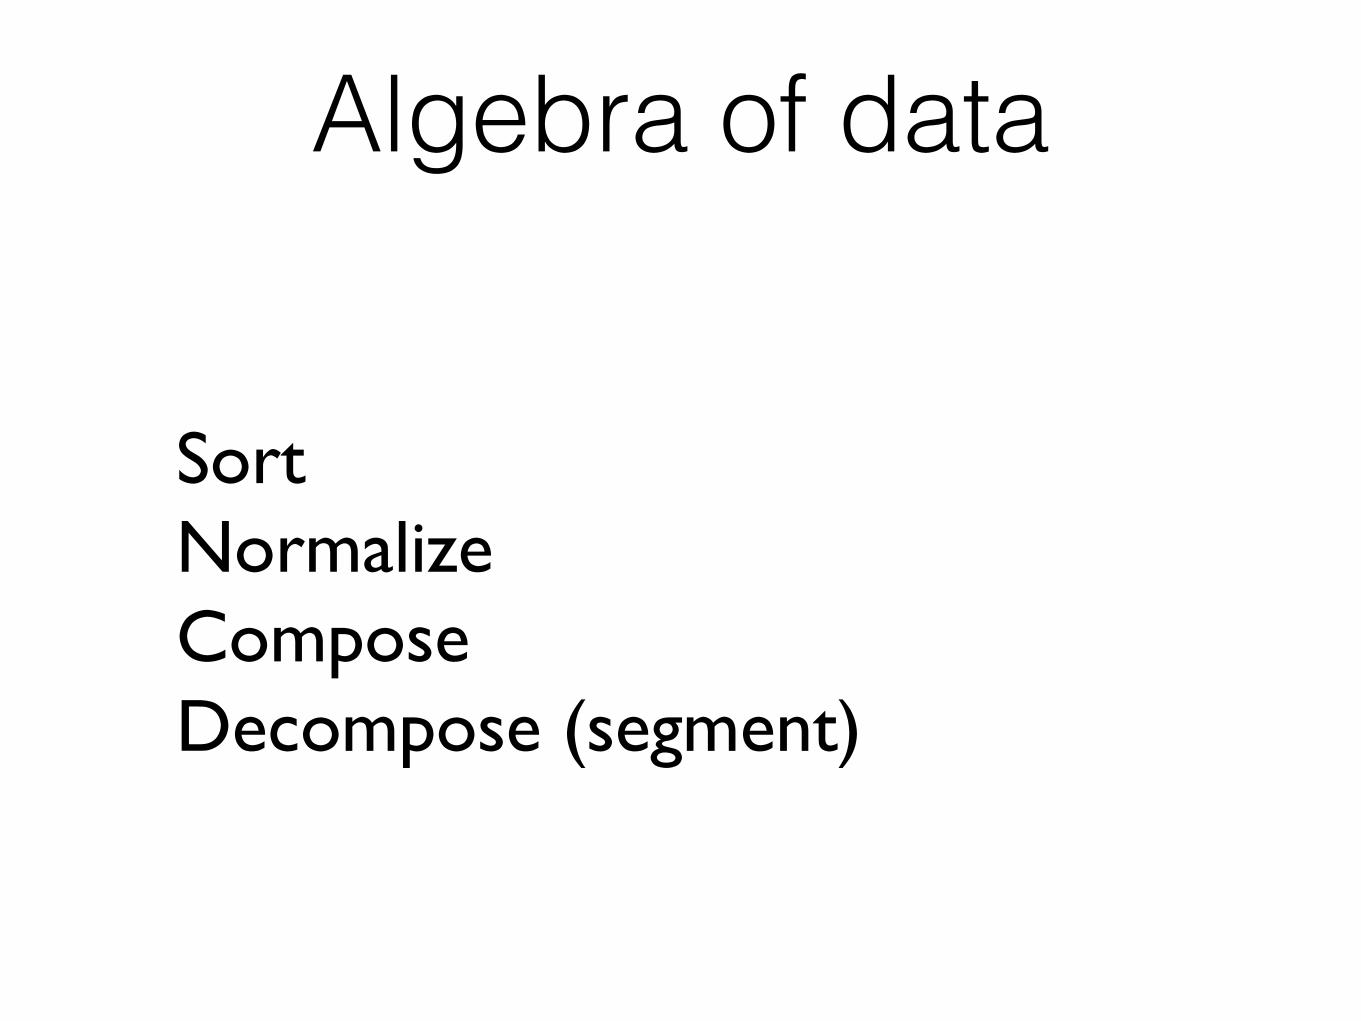
Sort!Normalize!Compose !Decompose (segment) !"
Algebra of data

Your tools shape your thoughts
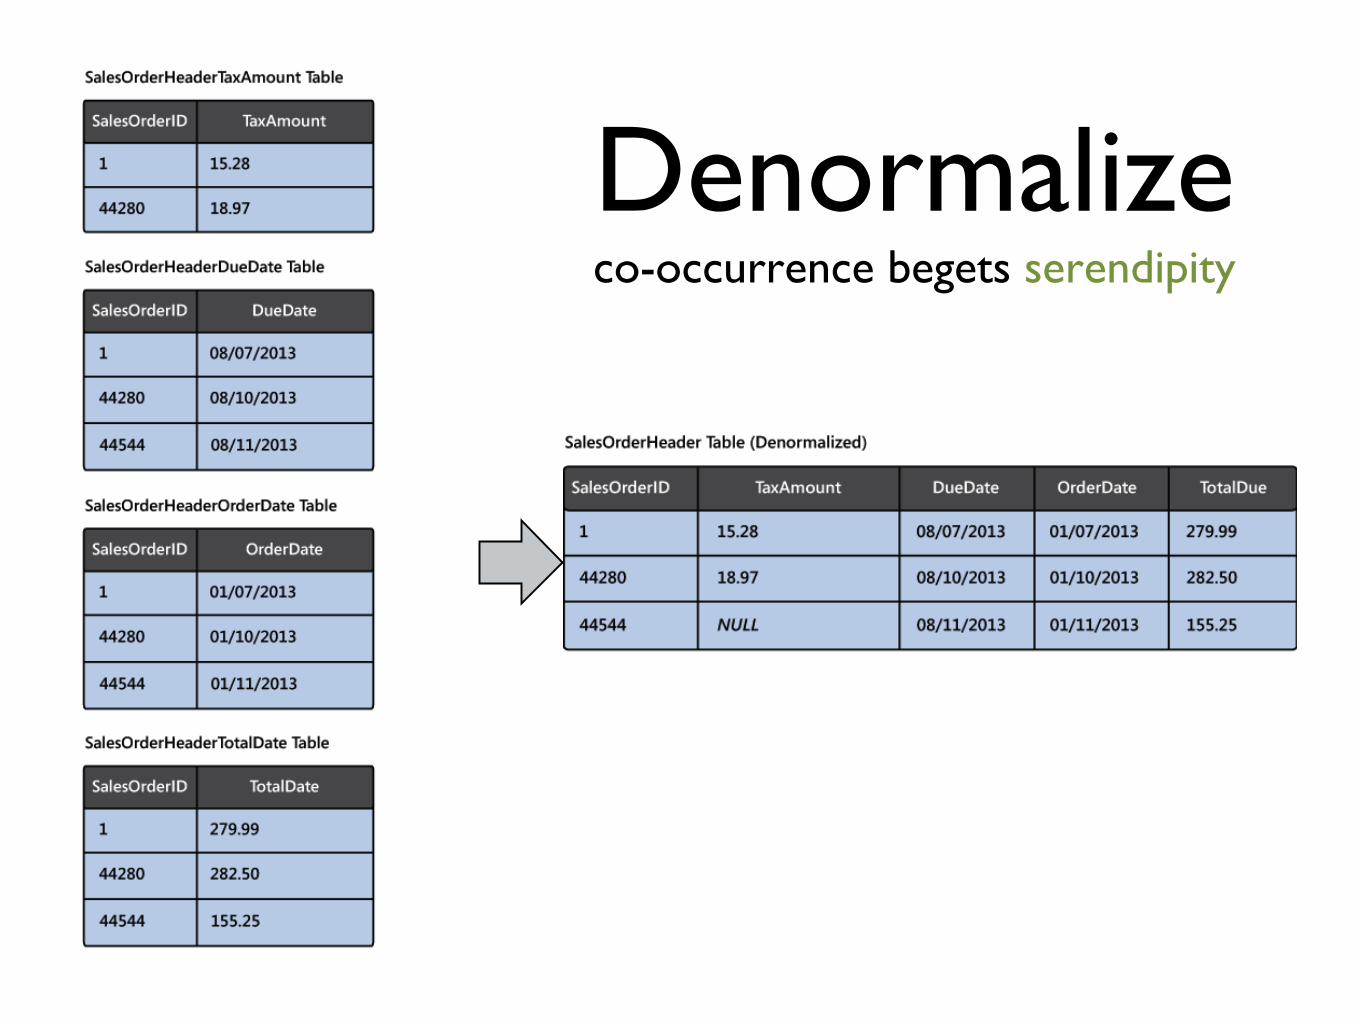
Aggregate data in one place
Denormalize!co-occurrence begets serendipity !

(De)compose data
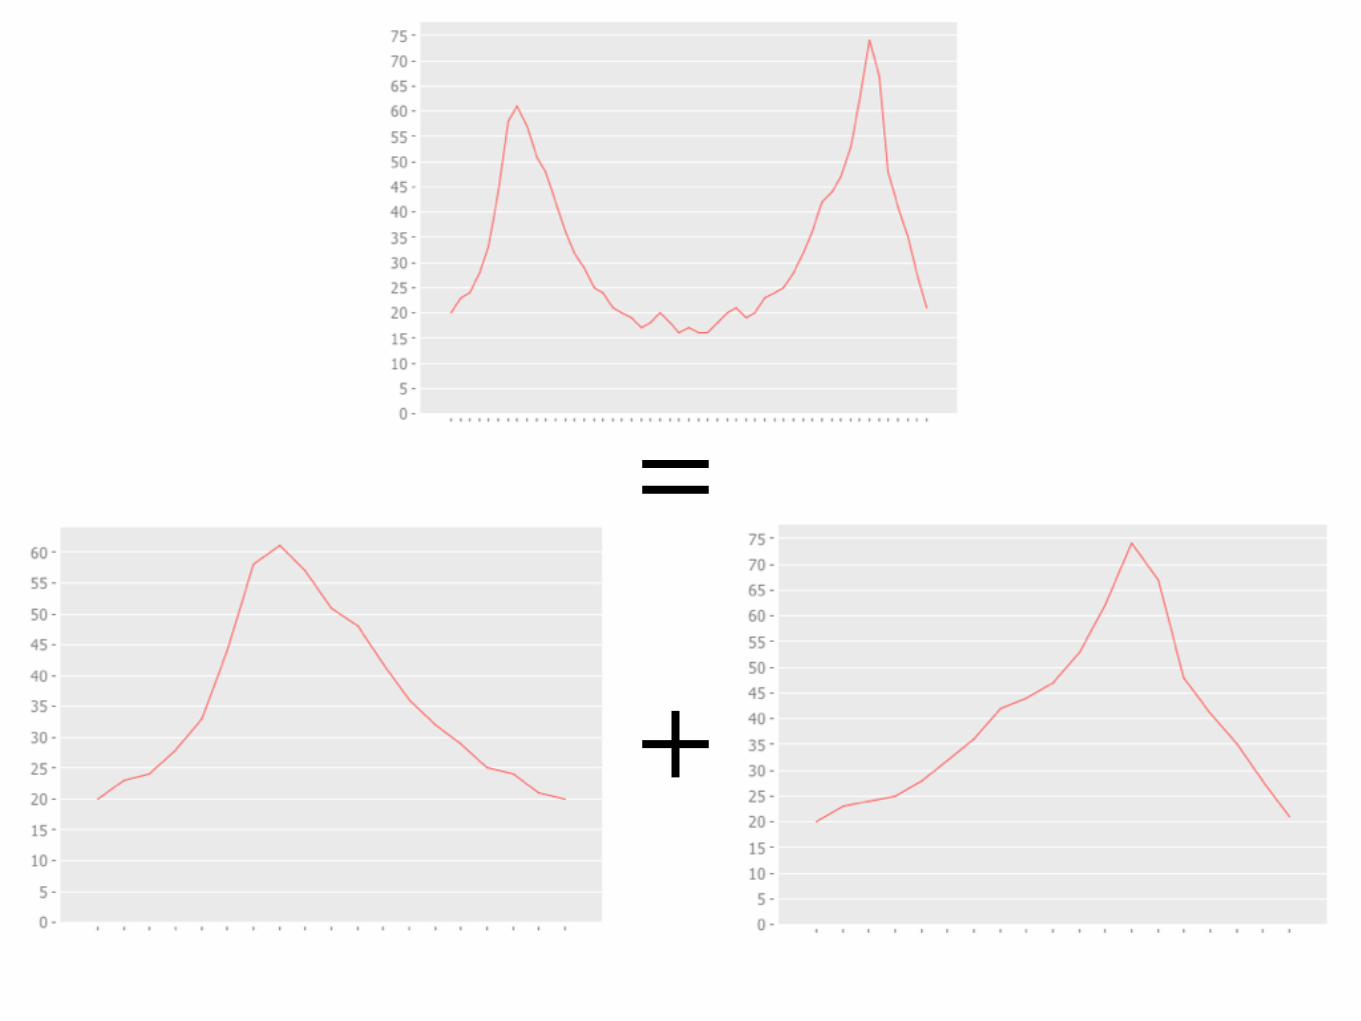
+
=
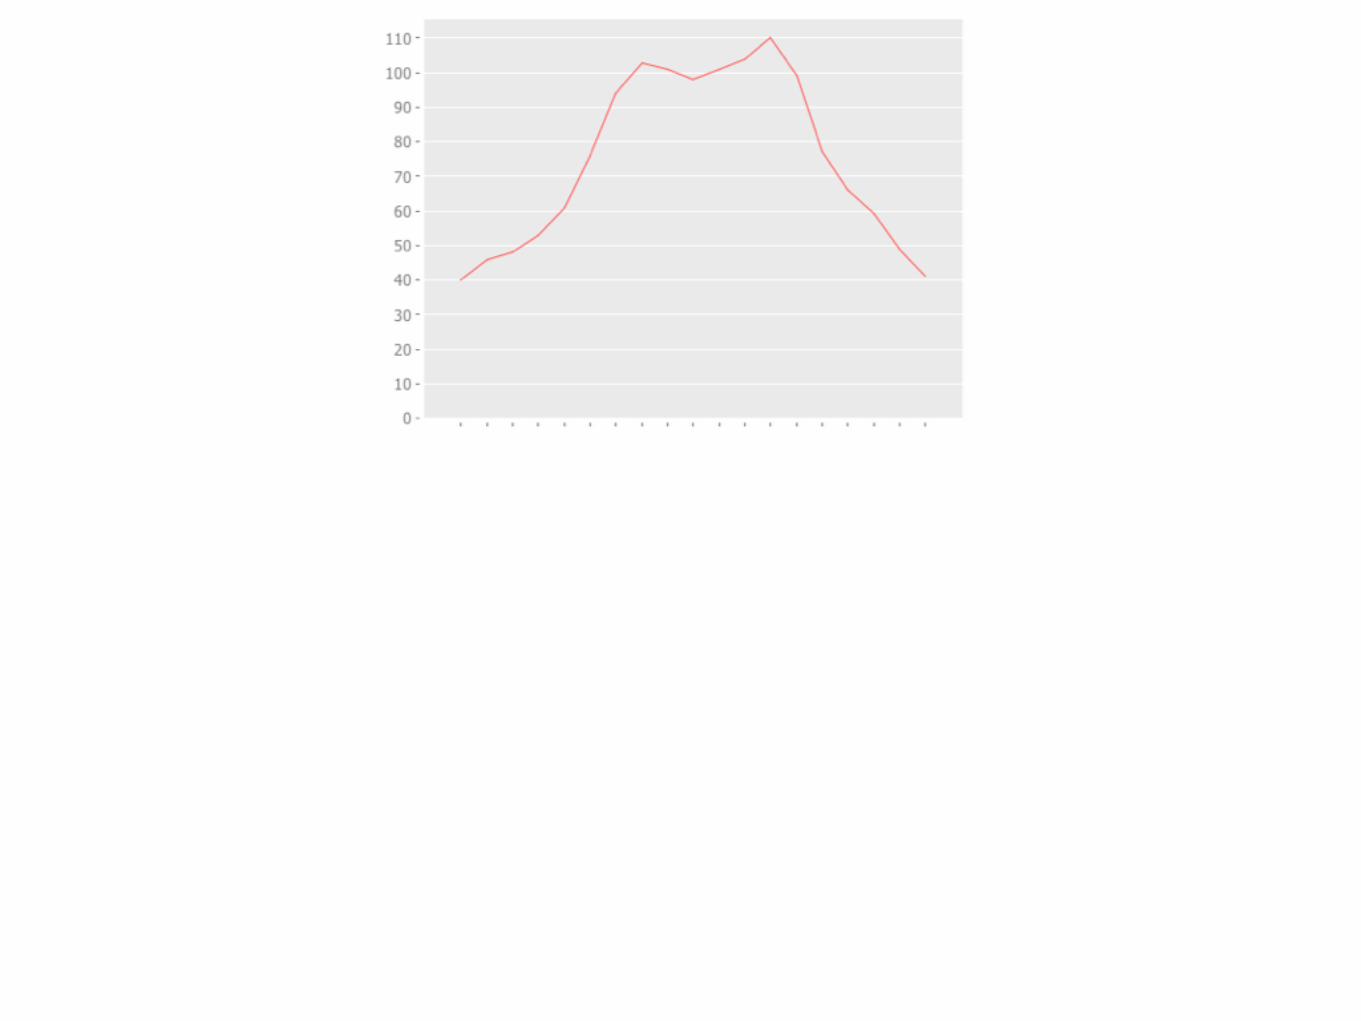
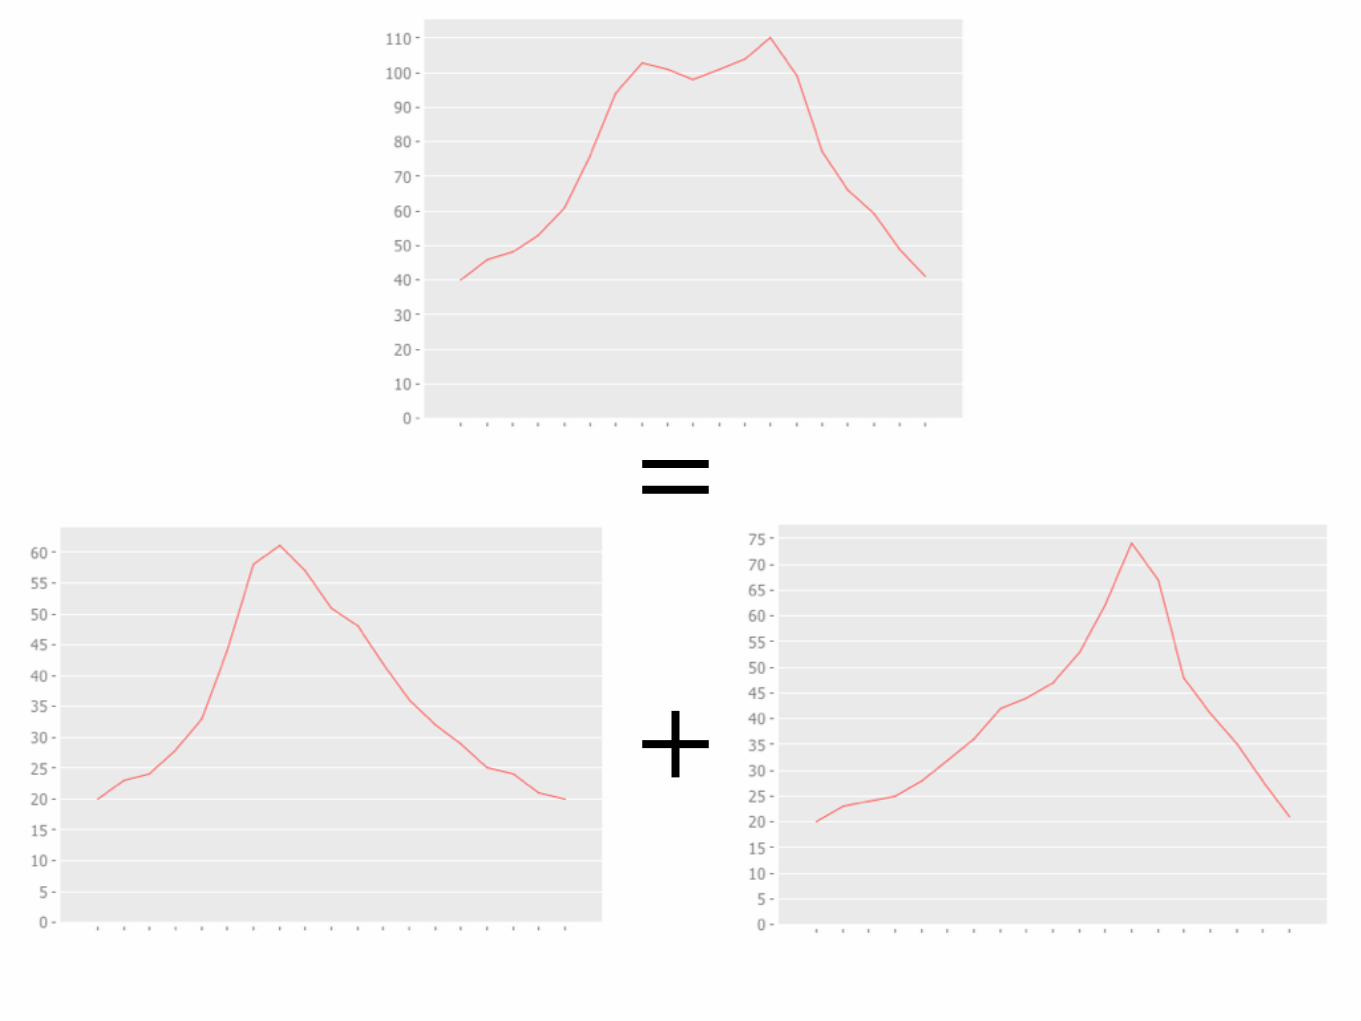
+
=

Data science = storytelling
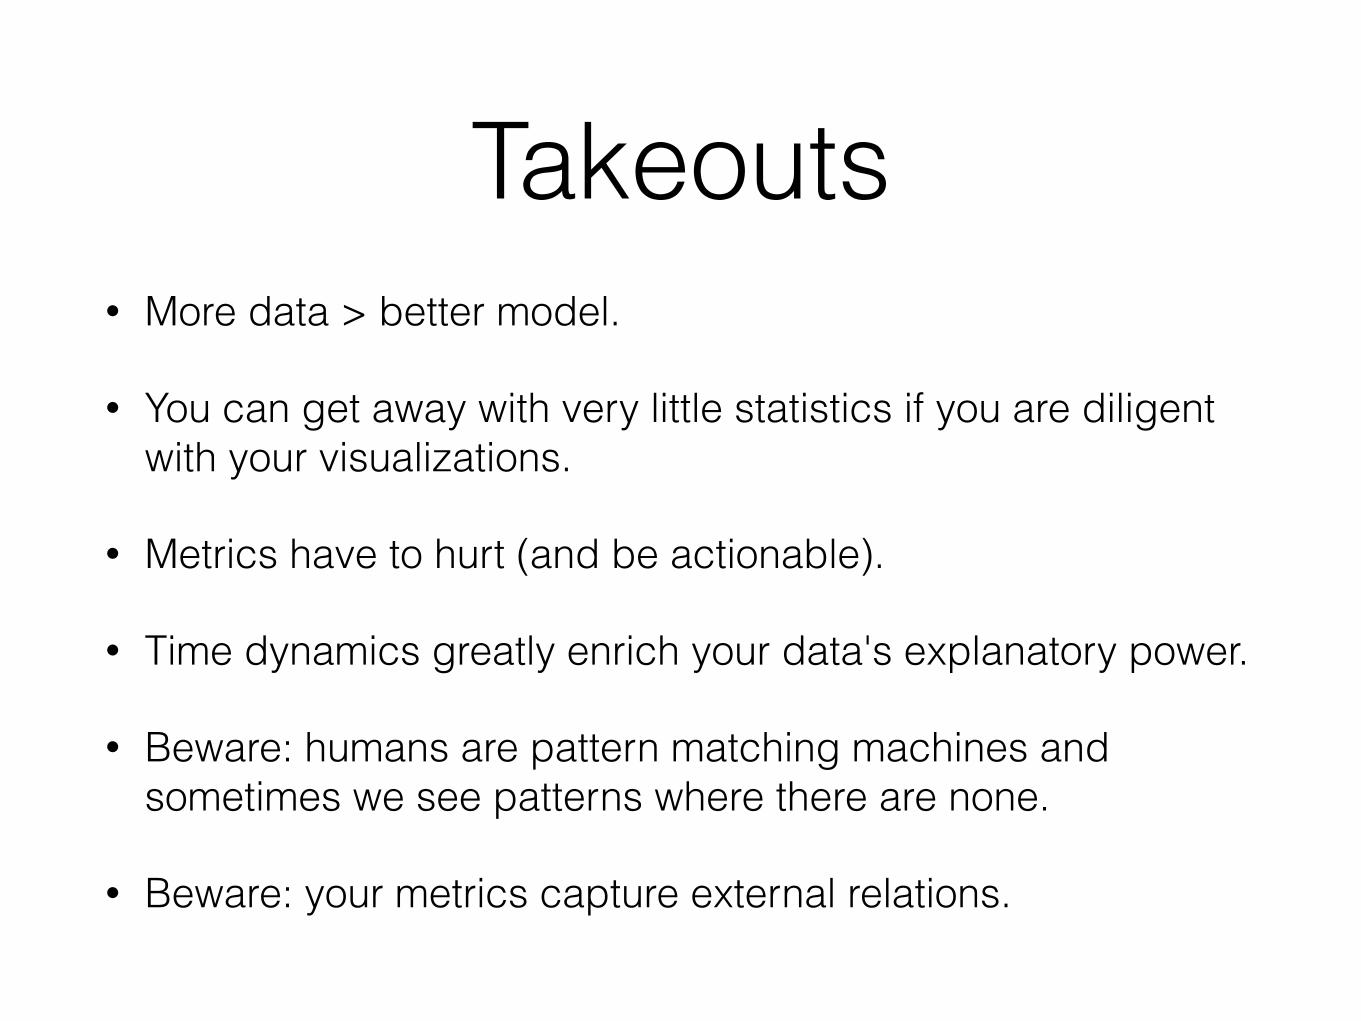
Takeouts• More data > better model.
• You can get away with very little statistics if you are diligent with your visualizations.
• Metrics have to hurt (and be actionable).
• Time dynamics greatly enrich your data's explanatory power.
• Beware: humans are pattern matching machines and sometimes we see patterns where there are none.
• Beware: your metrics capture external relations.