Embed Size (px)
Citation preview

Jigsaw Academy and ValueLabs
Sentiment Analysis CompetitionA Snapshot of the Winning Submissions

Business Objective
The Company wants to see if we can use the Sentiment Score derived from the comments section in the feedback form to predict the recommended score
● To find out sentiment score using comments given by clients.
● To build a model to predict Recommended score (RECOM) using the derived sentiment score

Analysis by Rajesh Peruri

● Mine the "Comments" section and arrive at a sentiment score Association Matrix to Capture the correlation between words of interest
Clustering Dendograms to Interpret the Sentiment of the various QPs based on word clusters
Derive an Linear regression Model using training dataset which captures the dependency of RECOM on other QPs
Methodology

Analysis
Attributes Mean Rating Sentiment Sentiment Sentiment Score Sentiment Sentiment
(Original Data) (Original Data) (Dendrogram) (SA algorithm) (SA algorithm) (LRM 2)
>= mean(RECOM)
RECOM 3.32 + + 0.37 + + 0.28
OTD 3.17 - - - 0.97 -
FLEX 3.44 + + + 1.7 +
QUAL 2.98 - - - 0.57 -
COMMIT 3.44 + + + 3.85 +
PROCESS 3.19 - - - 0.21 -
TRUST 3.49 + + + 1.28 +
RESPONSE 3.42 + + + 0.1 +
PARTNER 3.37 + + + 2.3 +
ESCAL/ISSUE 3.34 + - - 0.18 -
MINDSHARE3.22 - - + 0.48 +
Sentiment Table (+ is Positive, - is Negative)

Results
Recommend(RECOM)• Positive rating from the original dataset• Positive cumulative weighted sentiment,
when SA was performed on the “Comments”
• Positive sentiment using LRM
On Time Delivery(OTD)• Low rating from the original dataset.
• Negative sentiment = -0.92, when SA was performed on the “Comments”
• Word clusters from Dendrogram • Need quality, delivery
Quality(QUAL)• Low rating from the original dataset. • Negative sentiment = -0.57, when SA was
performed on the “Comments” • Word clusters from Dendrogram
• Need quality, delivery• Improve process and testing• Require detail understanding
Commitment(COMMIT)• High rating from the original dataset. • Positive sentiment = 3.85, when SA was
performed on the “Comments” • Word clusters from Dendrogram
• Provide consistency, meet expectation• Always commit really• Happy service
Results
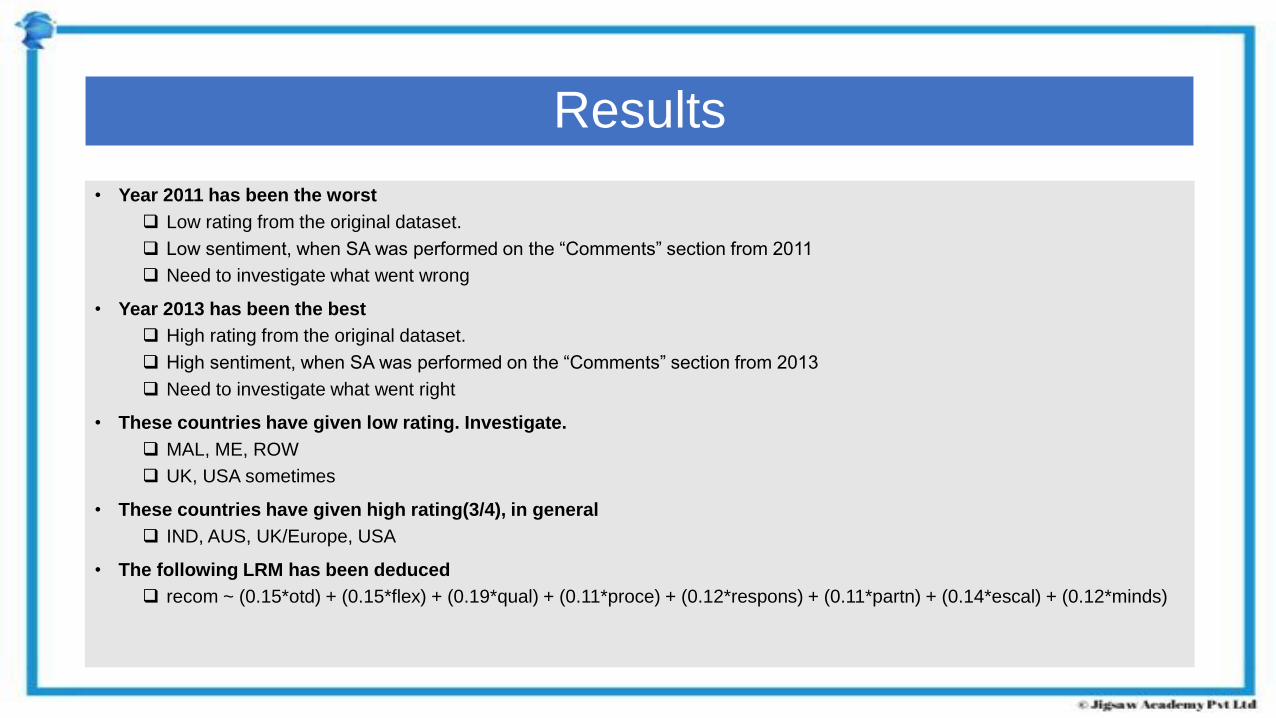
• Year 2011 has been the worst
Low rating from the original dataset.
Low sentiment, when SA was performed on the “Comments” section from 2011
Need to investigate what went wrong
• Year 2013 has been the best
High rating from the original dataset.
High sentiment, when SA was performed on the “Comments” section from 2013
Need to investigate what went right
• These countries have given low rating. Investigate.
MAL, ME, ROW
UK, USA sometimes
• These countries have given high rating(3/4), in general
IND, AUS, UK/Europe, USA
• The following LRM has been deduced
recom ~ (0.15*otd) + (0.15*flex) + (0.19*qual) + (0.11*proce) + (0.12*respons) + (0.11*partn) + (0.14*escal) + (0.12*minds)

Analysis by Rajanikar

● Overall Sentiment: Positive, Sentiment Score of 2 approx.
● Sentiment Analysis of Comments Extracted all positive and negative words
Identified positive and negative words in each comment
Used dictionary to assign sentiment score to words
Identified negations and adjusted word sentiment
Polarity of word's sentiment was reversed
Identified suggestions and recommendations
Sentiment score calculated for each comment
Methodology

Model
Model Used: Sentiment Score Density as only Predictor Variable
RECOM = 9.848 + 3.848*(Score Density)
Here, Normalized Score (Score Density is used for the modeling)
80% data-points taken for training the model and 20% testing
Results:
60% of cases were classified correctly
However, if only polarity is considered 86% of cases were classified correctly
Out of cases of incorrect classification, 4 cases have negative sentiment score- This shows that model is not good in classifying cases with negative sentiments

Word Cloud Analysis
Most Frequent Positive Polarity words:Excellent, Good, Like & Support
Most Frequent Negative Polarity words:Issues, Issue

Cluster Dendogram

Conclusion
● Comparing sentiment score directly with Recommended Score- Although, only in 35% of cases Normalized Score matches perfectly with recommended Score, 88% of cases were classified correctly in terms of polarity
● Therefore, sentiment score itself gives better result than using regression model to predict recommended score.
Analysis by Priyadarshini

Methodology
Jeffrey Breen Sentiment Algorithm was implemented.It estimates the sentiment by assigning an integer score by subtracting the number of occurrences of negative words from that of the positive words.

Analysis
• The histogram and ggplot of the sentiment scores for all the comments spanning across the year 2009 to 2013 has been plotted.
• The plot is right tailed and we can infer that comments are more on the positive note and there are very few negative comments.

AnalysisPlot of year-wise score distribution :Based on the plot we can infer that there are more positive comments for the company and minimal negative comments.
Sentiment Score : The total positive count, negative count and Sentiment Score percentage for each year from 2009 to 2013 has been tabulated below
Ratings Score : The average rating for each record in the dataset is calculated using the formula:
Score=(OTD+FLEX+QUAL+COMMIT+PROCE+TRU.REL+
RESPONS+PARTN+ESCAL+MINDS+OVERAL+RECOM)/12

Results
• From the table we can infer that sentiment score obtained by using the Jeffrey Breen algorithm almost coincide with the ratings score.
• Therefore we can conclude that the sentiment score derived from the comments useful in predicting the recommended score.
• The straight line represents a simple linear regression between the rating score and the sentiment scores.
• According to the plot, we can infer that the sentiment score are pretty close to our ratings score