Embed Size (px)
Citation preview

info@@scientificrevenue.com Pricing Without Compromise
Getting to Continuous Optimization
USF Seminar in Analytics, November 2016

info@@scientificrevenue.com Pricing Without Compromise

info@@scientificrevenue.com Pricing Without Compromise
info@@scientificrevenue.com Pricing Without Compromise
Agenda
• Background on Scientific Revenue• Analytics as it is Done Today• Going Down the Rabbit Hole• Above Ground Again• Some More Details on Causal Inference• Frameworks for Evaluation

info@@scientificrevenue.com Pricing Without Compromise
Machine Learning for E-Commerce(Revenue Optimization)
机器学习之于电子商务(收益优化)
info@@scientificrevenue.com Pricing Without Compromise
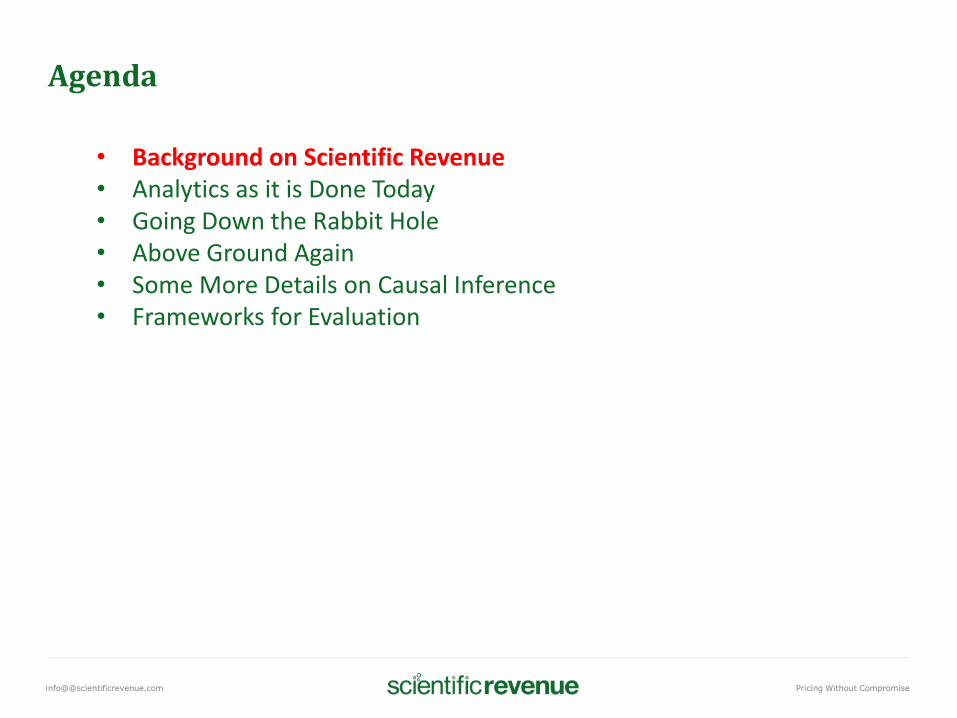
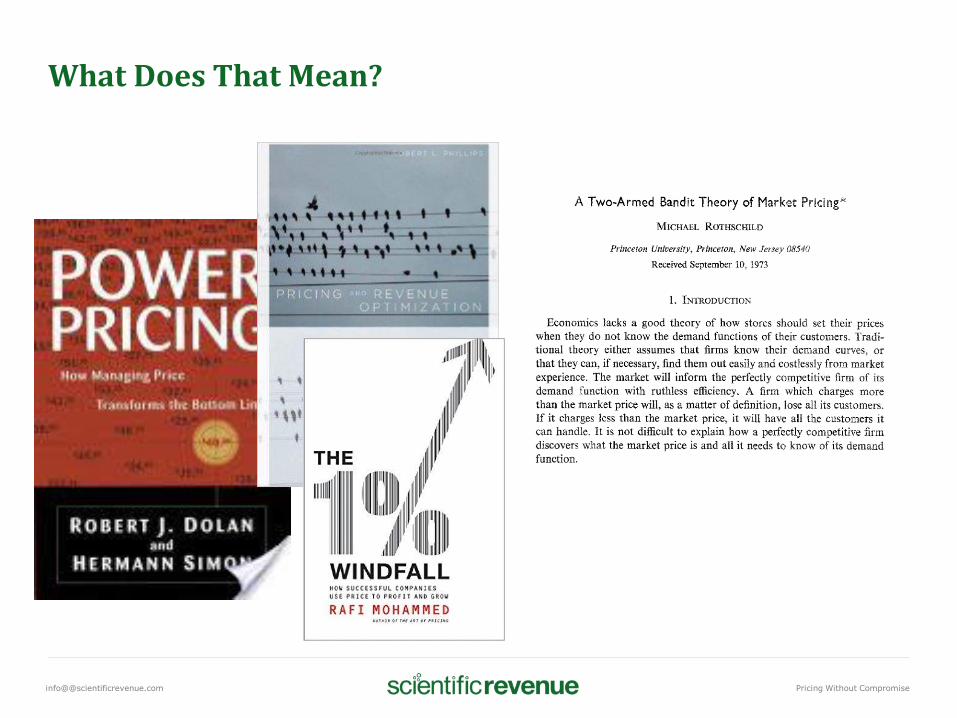
What Does That Mean?
info@@scientificrevenue.com Pricing Without Compromise
What Does That Mean?
info@@scientificrevenue.com Pricing Without Compromise
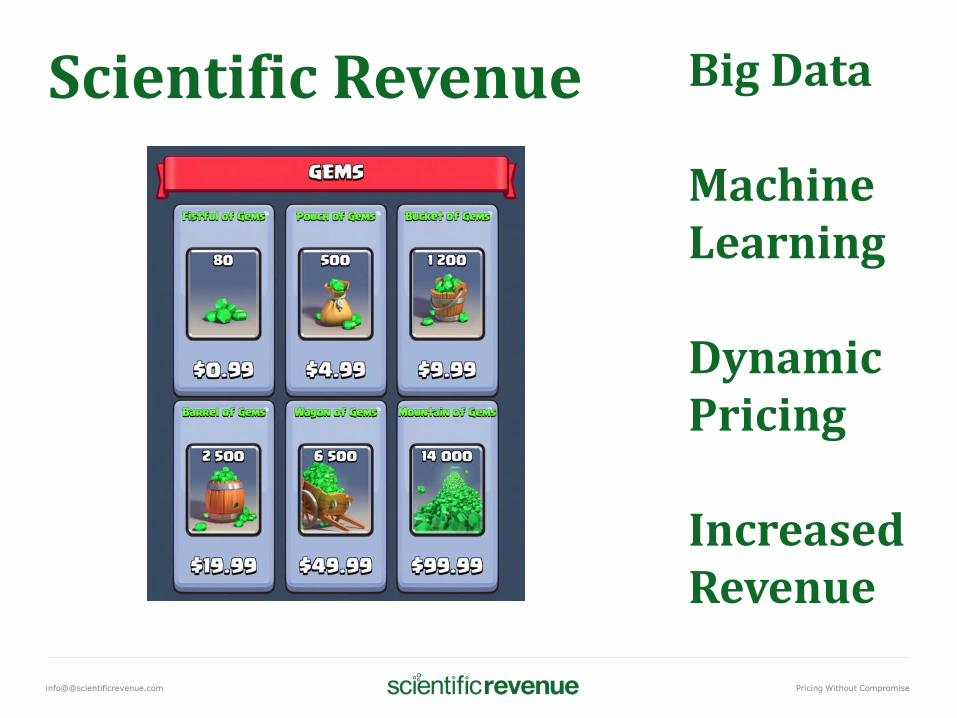
Scientific Revenue Big Data
Machine Learning
Dynamic Pricing
Increased Revenue
info@@scientificrevenue.com Pricing Without Compromise
Agenda
• Background on Scientific Revenue• Analytics as it is Done Today• Going Down the Rabbit Hole• Above Ground Again• Some More Details on Causal Inference• Frameworks for Evaluation
info@@scientificrevenue.com Pricing Without Compromise
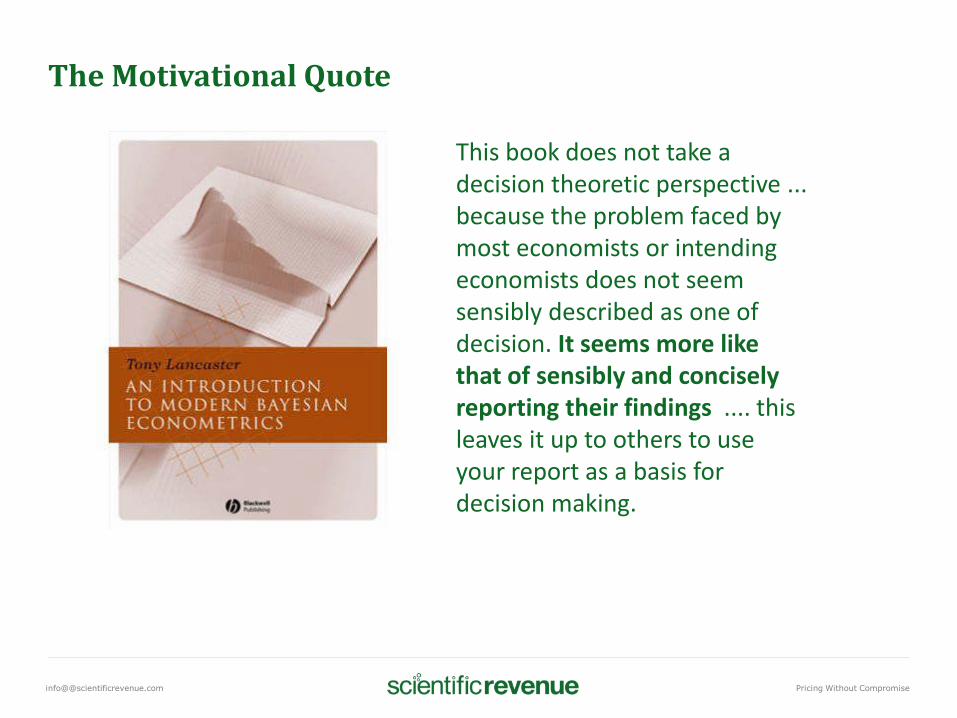
The Motivational Quote
This book does not take a decision theoretic perspective ... because the problem faced by most economists or intending economists does not seem sensibly described as one of decision. It seems more like that of sensibly and concisely reporting their findings .... this leaves it up to others to use your report as a basis for decision making.
info@@scientificrevenue.com Pricing Without Compromise
Stated Another Way
….
info@@scientificrevenue.com Pricing Without Compromise
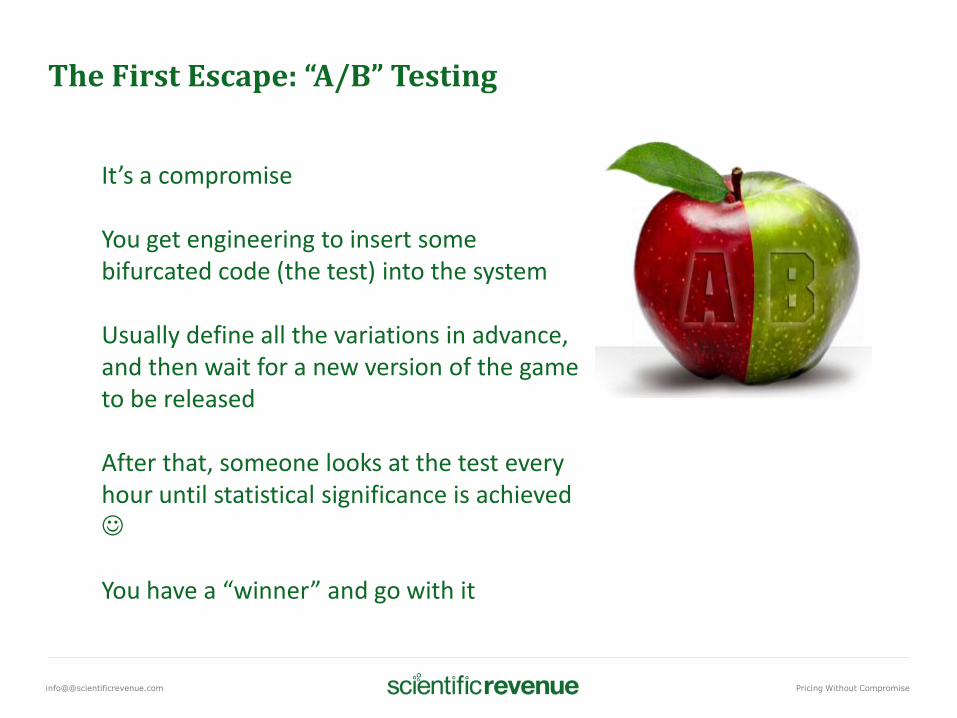
The First Escape: “A/B” Testing
It’s a compromise
You get engineering to insert some bifurcated code (the test) into the system
Usually define all the variations in advance, and then wait for a new version of the game to be released
After that, someone looks at the test every hour until statistical significance is achieved
You have a “winner” and go with it
info@@scientificrevenue.com Pricing Without Compromise
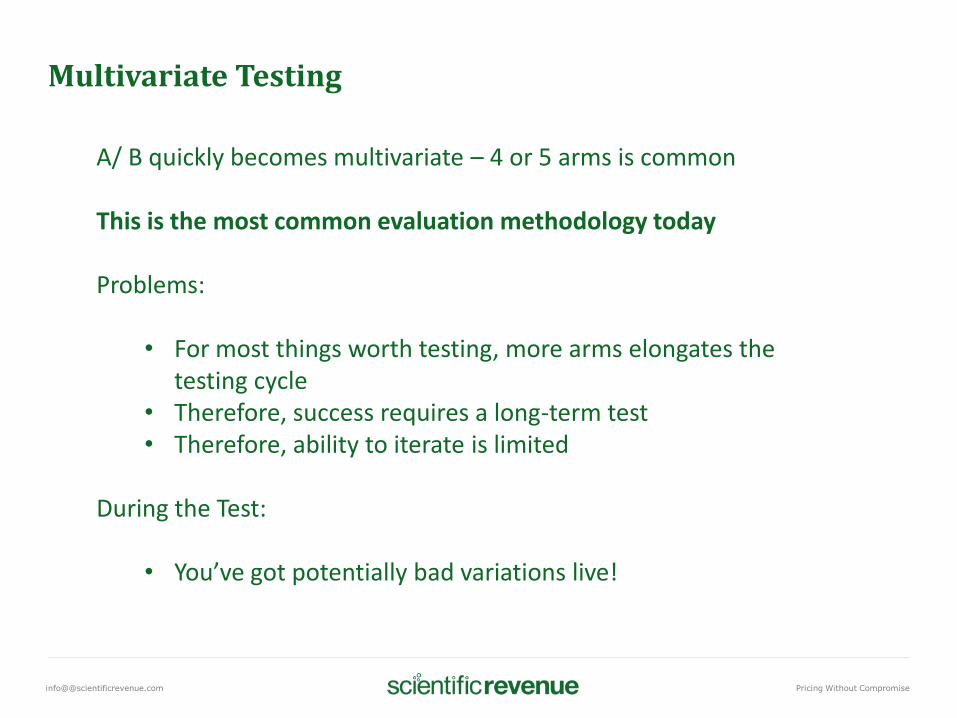
Multivariate Testing
A/ B quickly becomes multivariate – 4 or 5 arms is common
This is the most common evaluation methodology today
Problems:
• For most things worth testing, more arms elongates the testing cycle
• Therefore, success requires a long-term test• Therefore, ability to iterate is limited
During the Test:
• You’ve got potentially bad variations live!
info@@scientificrevenue.com Pricing Without Compromise
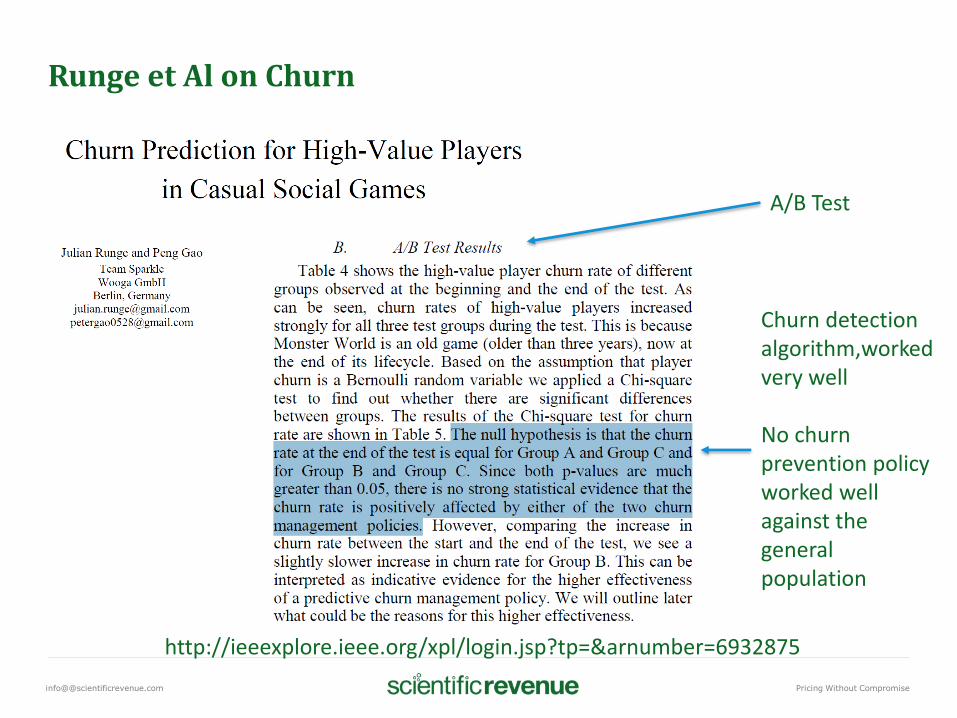
Runge et Al on Churn
Churn detection algorithm,workedvery well
No churn prevention policy worked well against the general population
A/B Test
http://ieeexplore.ieee.org/xpl/login.jsp?tp=&arnumber=6932875
info@@scientificrevenue.com Pricing Without Compromise
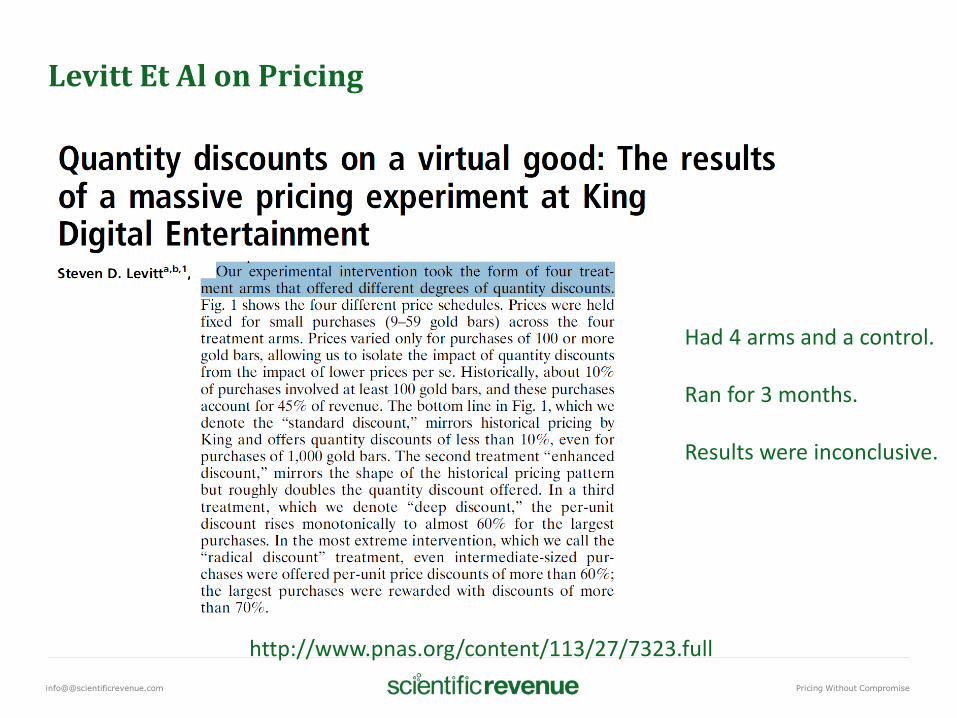
Levitt Et Al on Pricing
Had 4 arms and a control.
Ran for 3 months.
Results were inconclusive.
http://www.pnas.org/content/113/27/7323.full
info@@scientificrevenue.com Pricing Without Compromise
Agenda
• Background on Scientific Revenue• Analytics as it is Done Today• Going Down the Rabbit Hole• Above Ground Again• Some More Details on Causal Inference• Frameworks for Evaluation
info@@scientificrevenue.com Pricing Without Compromise
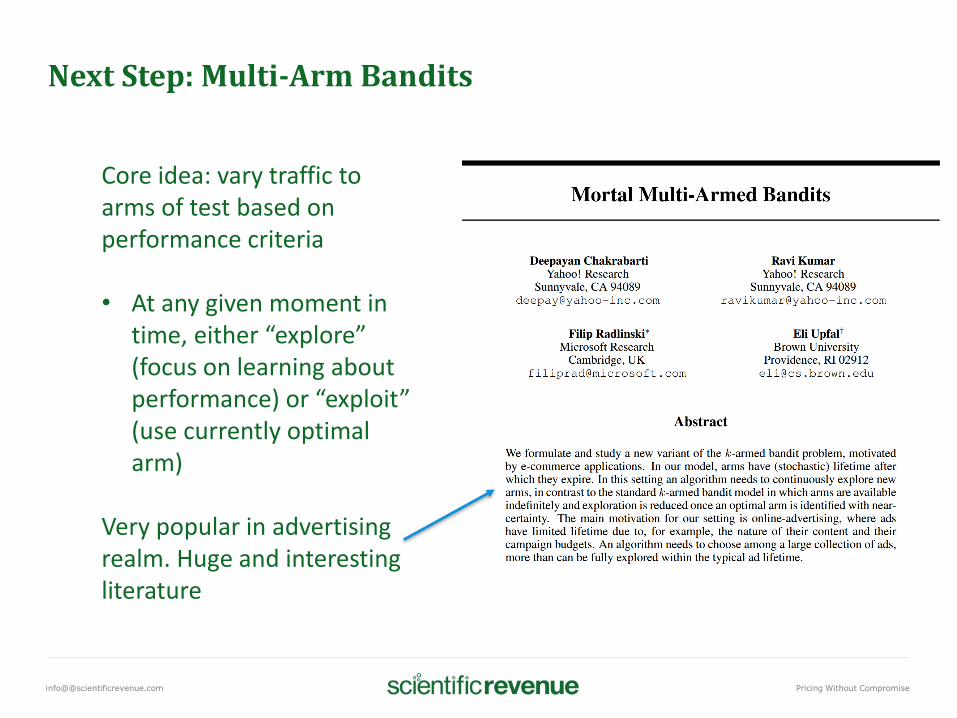
Next Step: Multi-Arm Bandits
Core idea: vary traffic to arms of test based on performance criteria
• At any given moment in time, either “explore” (focus on learning about performance) or “exploit” (use currently optimal arm)
Very popular in advertising realm. Huge and interesting literature
info@@scientificrevenue.com Pricing Without Compromise
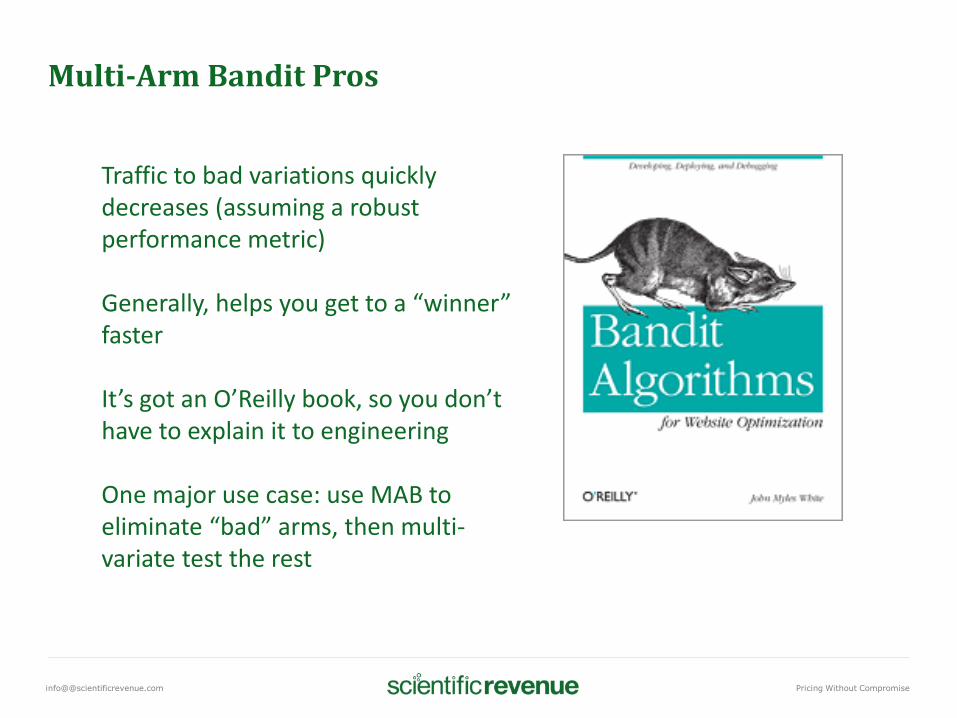
Multi-Arm Bandit Pros
Traffic to bad variations quickly decreases (assuming a robust performance metric)
Generally, helps you get to a “winner” faster
It’s got an O’Reilly book, so you don’t have to explain it to engineering
One major use case: use MAB to eliminate “bad” arms, then multi-variate test the rest
info@@scientificrevenue.com Pricing Without Compromise
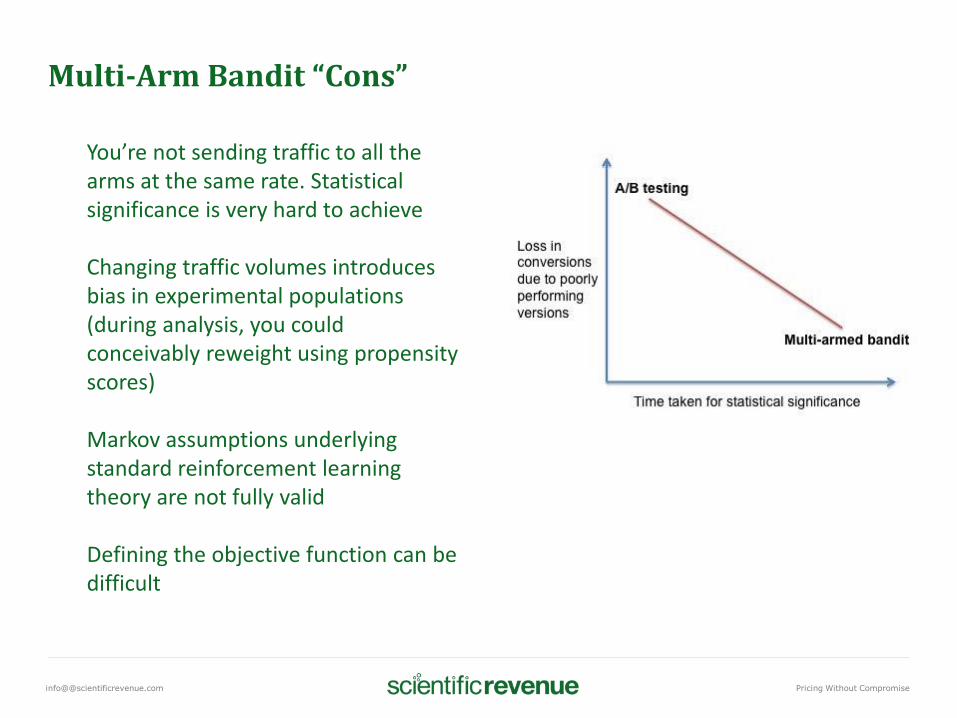
Multi-Arm Bandit “Cons”
You’re not sending traffic to all the arms at the same rate. Statistical significance is very hard to achieve
Changing traffic volumes introduces bias in experimental populations (during analysis, you could conceivably reweight using propensity scores)
Markov assumptions underlying standard reinforcement learning theory are not fully valid
Defining the objective function can be difficult
info@@scientificrevenue.com Pricing Without Compromise
Bias ?
Changing traffic volumes introduces bias in experimental populations
Suppose you send 20% of the users to each of 5 arms. Then suppose you send 40% of new users to the first arm, and 15% to each of the remaining arms
The population going to the first arm has a lower percentage of experienced users, and a higher percentage of people from certain locales (depending on the time you alter the percentages)
Propensity scores are your friend here. But so is a certain level of resignation.
info@@scientificrevenue.com Pricing Without Compromise
Agenda
• Background on Scientific Revenue• Analytics as it is Done Today• Going Down the Rabbit Hole• Above Ground Again• Some More Details on Causal Inference• Frameworks for Evaluation
info@@scientificrevenue.com Pricing Without Compromise
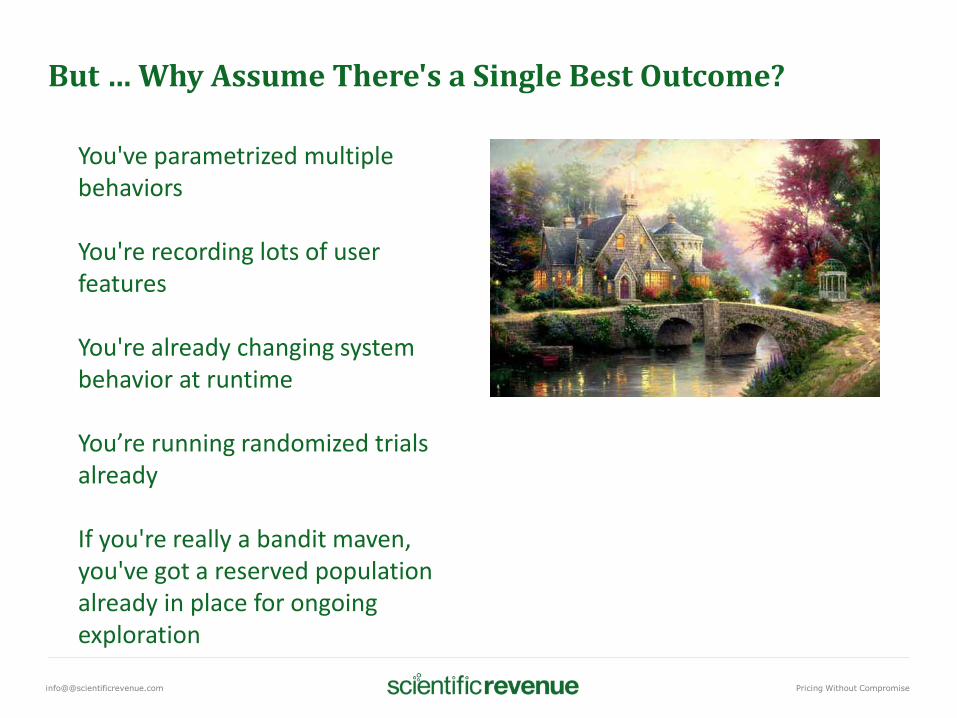
But … Why Assume There's a Single Best Outcome?
You've parametrized multiple behaviors
You're recording lots of user features
You're already changing system behavior at runtime
You’re running randomized trials already
If you're really a bandit maven, you've got a reserved population already in place for ongoing exploration
info@@scientificrevenue.com Pricing Without Compromise
! =

info@@scientificrevenue.com Pricing Without Compromise
Think of a test arm as a population-selecting function
info@@scientificrevenue.com Pricing Without Compromise
Articulating the New Goal
Instead of thinking about “winners” and “losers”
Instead of thinking about “better” and “worse”
Think of a test arm as a population-selecting function
Given an arm of a test, the population it selects is the population it is optimal for, under some objective function
info@@scientificrevenue.com Pricing Without Compromise
Key Idea: Continuous Optimization Using a Control Framework
If you have an objective function
And you have a control state
And you have multiple treatments
Then you should map the user to the treatment that maximizes the objective function
• In realtime• On a per-user basis
info@@scientificrevenue.com Pricing Without Compromise
The Analytical Two-Step
Run randomized trials
• Users randomly assigned to treatments• Banditing has much more explore (and much less
exploit) than is usual• Exploration is guided by models
After the trial, run a predictive model builder
• Put your eyeballs at the end of the experiment and see if you can figure out how you should have assigned the users (to optimize the objective function)
info@@scientificrevenue.com Pricing Without Compromise
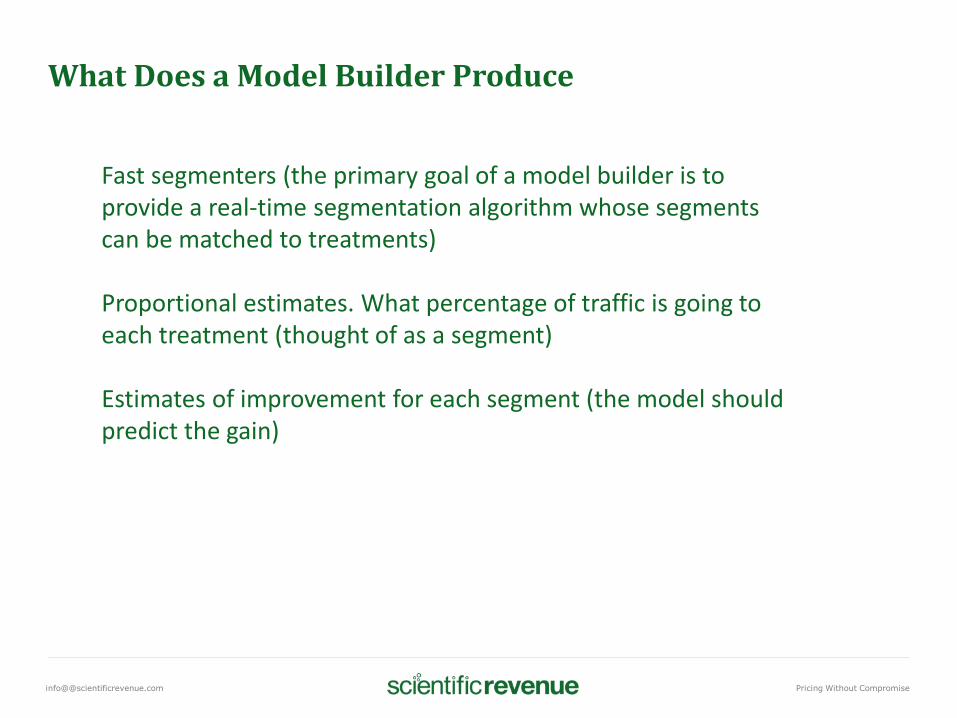
What Does a Model Builder Produce
Fast segmenters (the primary goal of a model builder is to provide a real-time segmentation algorithm whose segments can be matched to treatments)
Proportional estimates. What percentage of traffic is going to each treatment (thought of as a segment)
Estimates of improvement for each segment (the model should predict the gain)
info@@scientificrevenue.com Pricing Without Compromise
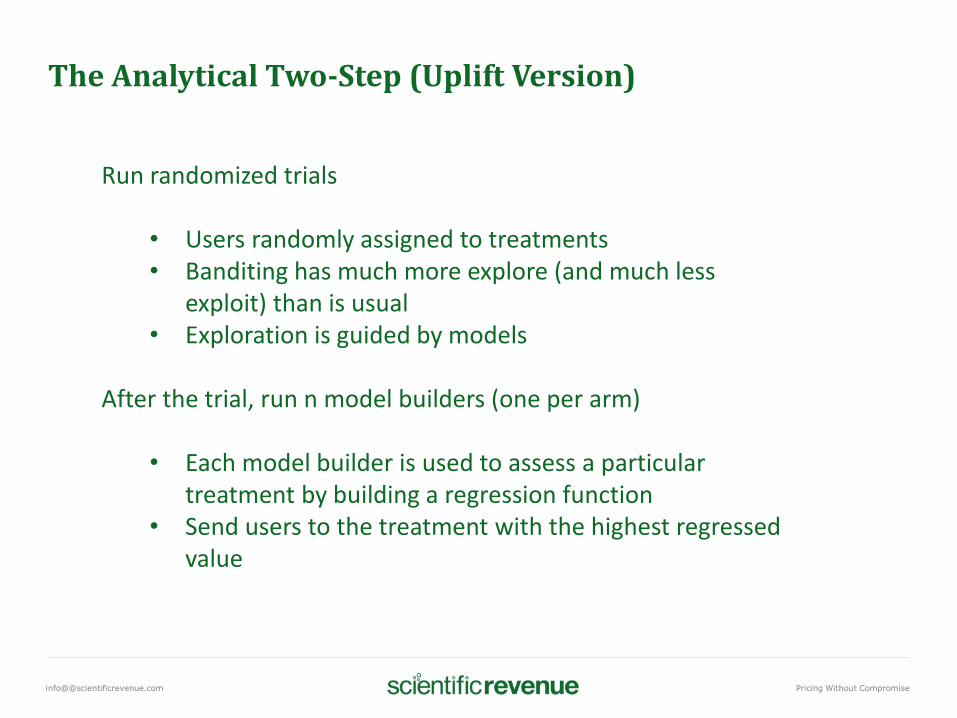
The Analytical Two-Step (Uplift Version)
Run randomized trials
• Users randomly assigned to treatments• Banditing has much more explore (and much less
exploit) than is usual• Exploration is guided by models
After the trial, run n model builders (one per arm)
• Each model builder is used to assess a particular treatment by building a regression function
• Send users to the treatment with the highest regressed value
info@@scientificrevenue.com Pricing Without Compromise
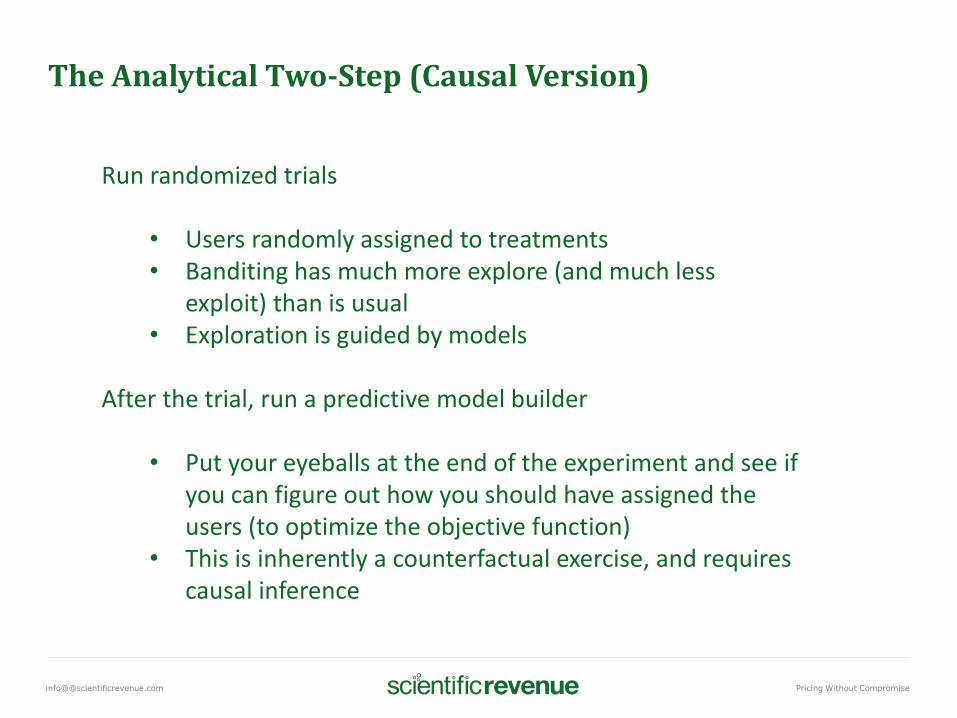
The Analytical Two-Step (Causal Version)
Run randomized trials
• Users randomly assigned to treatments• Banditing has much more explore (and much less
exploit) than is usual• Exploration is guided by models
After the trial, run a predictive model builder
• Put your eyeballs at the end of the experiment and see if you can figure out how you should have assigned the users (to optimize the objective function)
• This is inherently a counterfactual exercise, and requires causal inference
info@@scientificrevenue.com Pricing Without Compromise
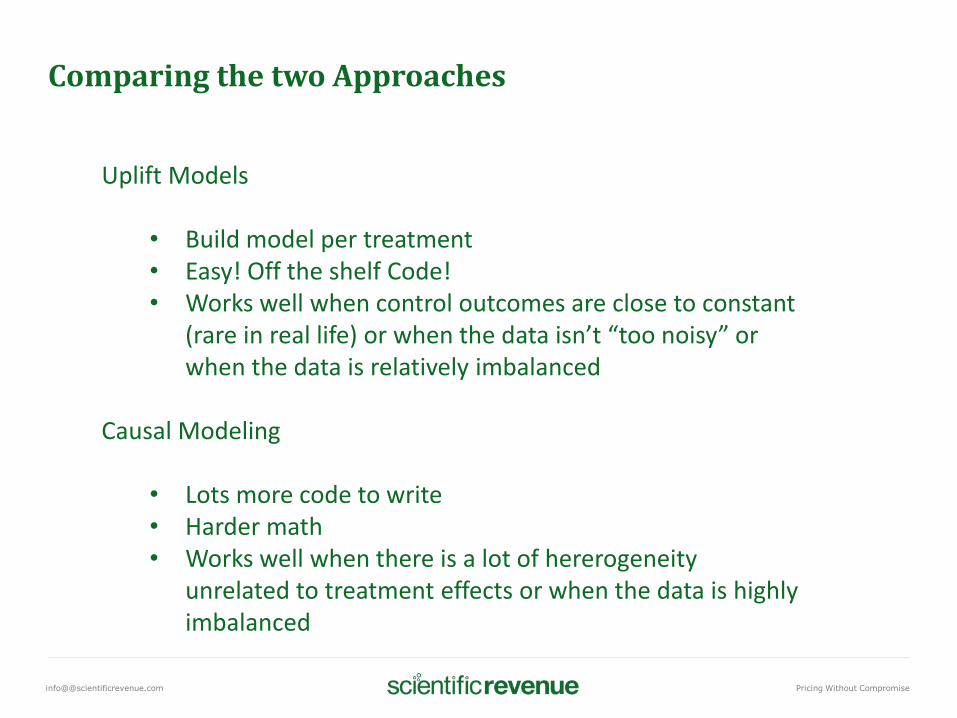
Comparing the two Approaches
Uplift Models
• Build model per treatment• Easy! Off the shelf Code!• Works well when control outcomes are close to constant
(rare in real life) or when the data isn’t “too noisy” or when the data is relatively imbalanced
Causal Modeling
• Lots more code to write• Harder math• Works well when there is a lot of hererogeneity
unrelated to treatment effects or when the data is highly imbalanced
info@@scientificrevenue.com Pricing Without Compromise
Agenda
• Background on Scientific Revenue• Analytics as it is Done Today• Going Down the Rabbit Hole• Above Ground Again• Some More Details on Causal Inference• Frameworks for Evaluation
info@@scientificrevenue.com Pricing Without Compromise
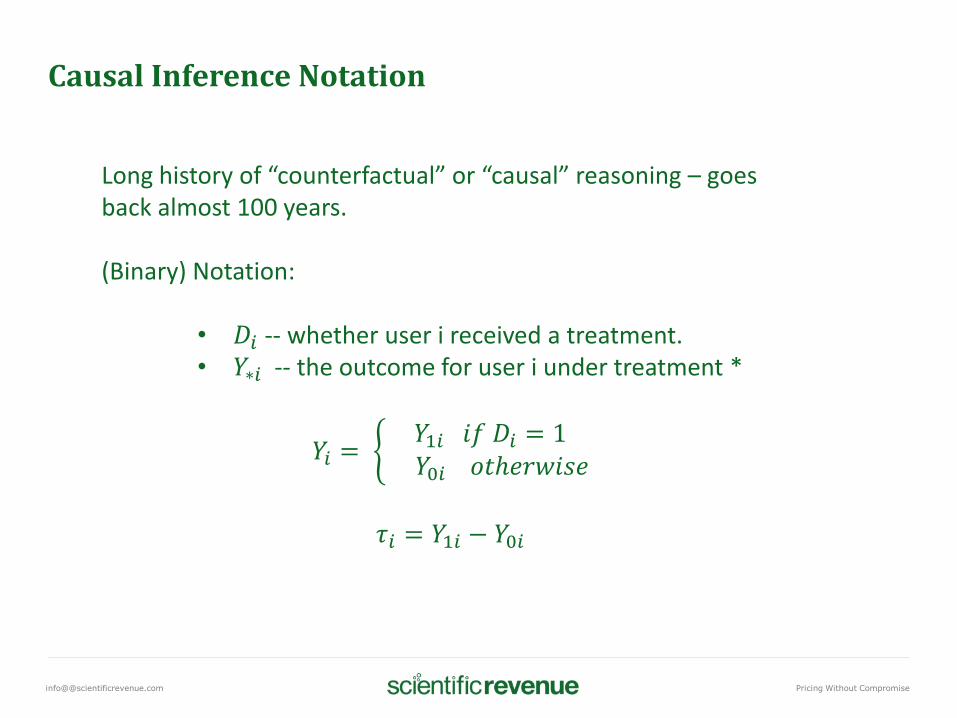
Causal Inference Notation
Long history of “counterfactual” or “causal” reasoning – goes back almost 100 years.
(Binary) Notation:
• 𝐷𝑖 -- whether user i received a treatment.• 𝑌∗𝑖 -- the outcome for user i under treatment *
𝑌𝑖 = ቊ𝑌1𝑖 𝑖𝑓 𝐷𝑖 = 1𝑌0𝑖 𝑜𝑡ℎ𝑒𝑟𝑤𝑖𝑠𝑒
𝜏𝑖 = 𝑌1𝑖 − 𝑌0𝑖
info@@scientificrevenue.com Pricing Without Compromise
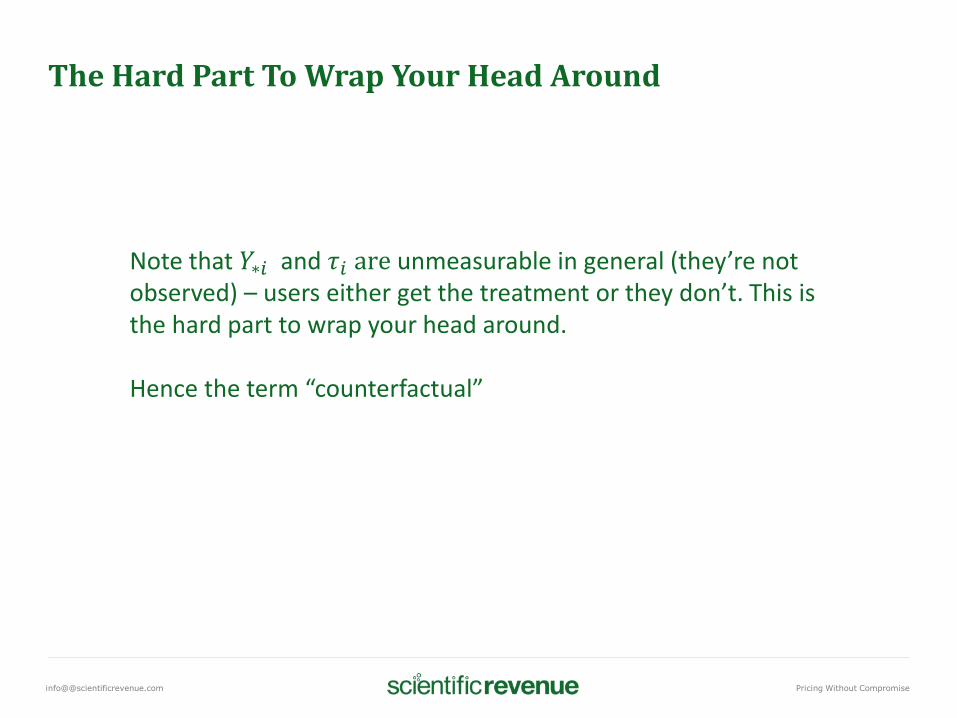
The Hard Part To Wrap Your Head Around
Note that 𝑌∗𝑖 and 𝜏𝑖 are unmeasurable in general (they’re not observed) – users either get the treatment or they don’t. This is the hard part to wrap your head around.
Hence the term “counterfactual”
info@@scientificrevenue.com Pricing Without Compromise
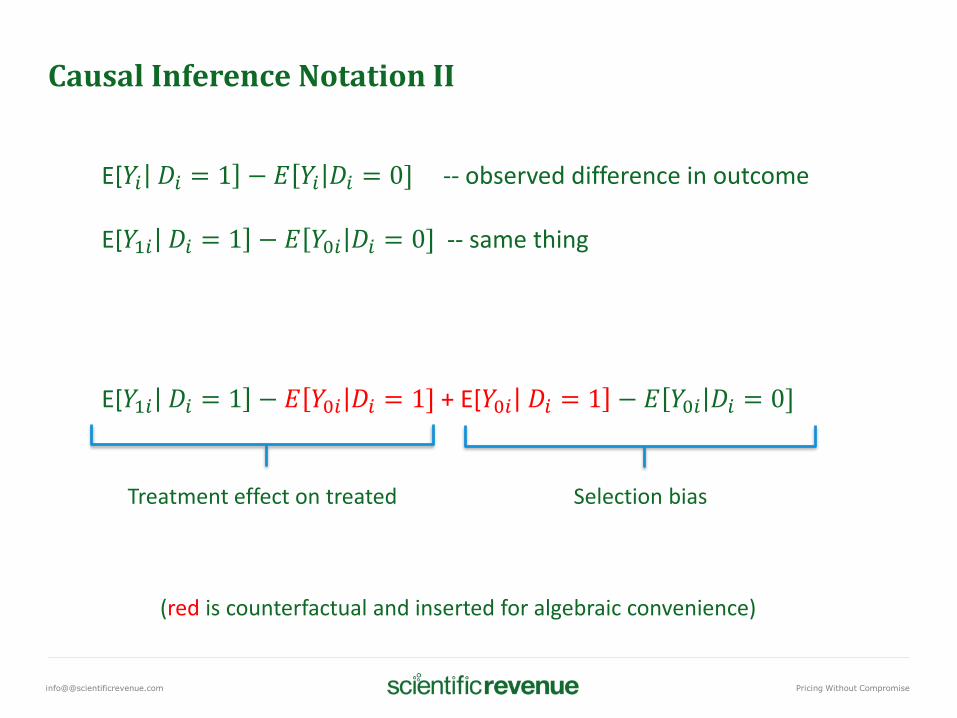
Causal Inference Notation II
E[𝑌𝑖 𝐷𝑖 = 1 − 𝐸 𝑌𝑖 𝐷𝑖 = 0] -- observed difference in outcome
E[𝑌1𝑖 𝐷𝑖 = 1 − 𝐸 𝑌0𝑖 𝐷𝑖 = 0] -- same thing
E[𝑌1𝑖 𝐷𝑖 = 1 − 𝐸 𝑌0𝑖 𝐷𝑖 = 1] + E[𝑌0𝑖 𝐷𝑖 = 1 − 𝐸 𝑌0𝑖 𝐷𝑖 = 0]
Treatment effect on treated Selection bias
(red is counterfactual and inserted for algebraic convenience)
info@@scientificrevenue.com Pricing Without Compromise
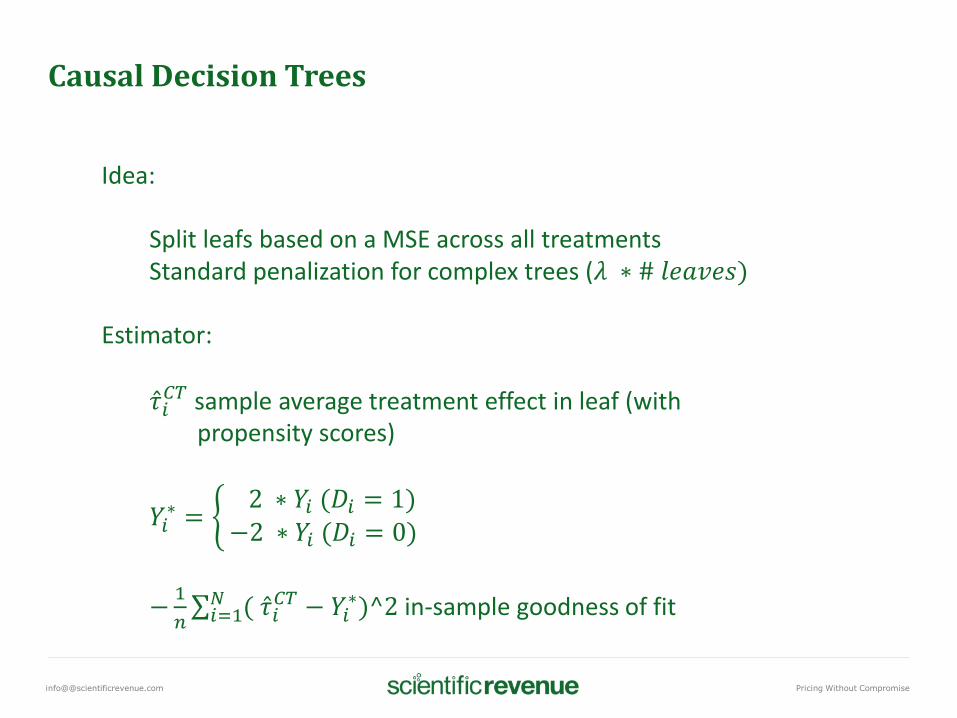
Causal Decision Trees
Idea:
Split leafs based on a MSE across all treatmentsStandard penalization for complex trees (𝜆 ∗ # 𝑙𝑒𝑎𝑣𝑒𝑠)
Estimator:
Ƹ𝜏𝑖𝐶𝑇 sample average treatment effect in leaf (with
propensity scores)
𝑌𝑖∗ = ቊ
2 ∗ 𝑌𝑖 (𝐷𝑖 = 1)−2 ∗ 𝑌𝑖 (𝐷𝑖 = 0)
−1
𝑛σ𝑖=1𝑁 ( Ƹ𝜏𝑖
𝐶𝑇 − 𝑌𝑖∗)^2 in-sample goodness of fit
info@@scientificrevenue.com Pricing Without Compromise
Drilldown: Causal Random Forests
A Casual Decision Tree …. Overfits (just like a decision tree!)
A Causal Random Forest is just a bag of Causal Decision Trees
This example is adding two treatments to decision trees.
But the algebra is similar for m treatments, and for different ML algorithms (which is what we use)
info@@scientificrevenue.com Pricing Without Compromise
Agenda
• Background on Scientific Revenue• Analytics as it is Done Today• Going Down the Rabbit Hole• Above Ground Again• Some More Details on Causal Inference• Frameworks for Evaluation
info@@scientificrevenue.com Pricing Without Compromise
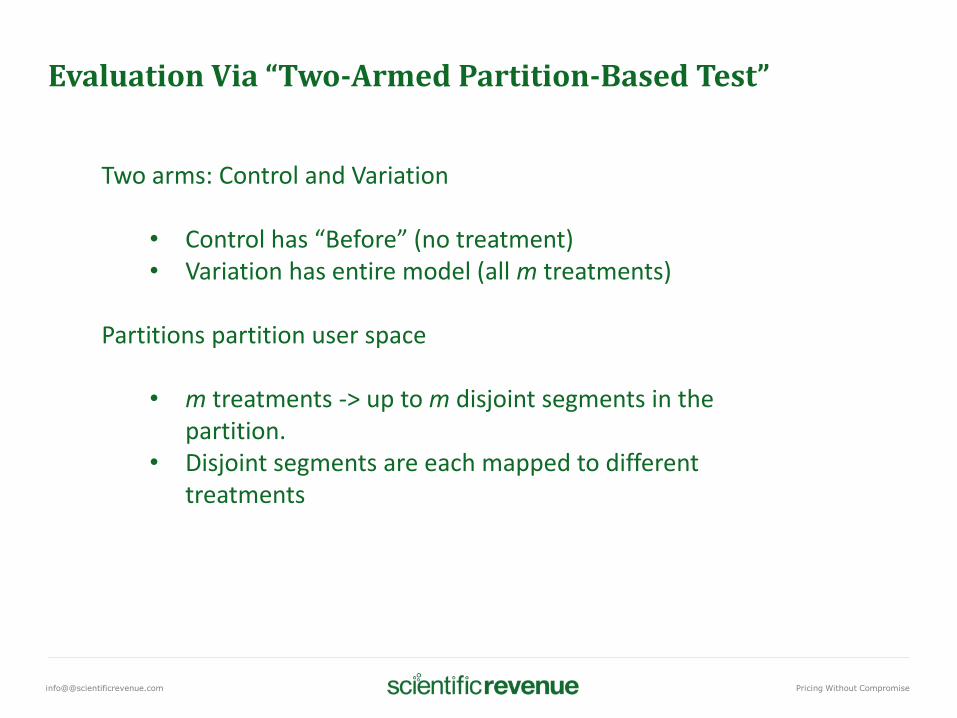
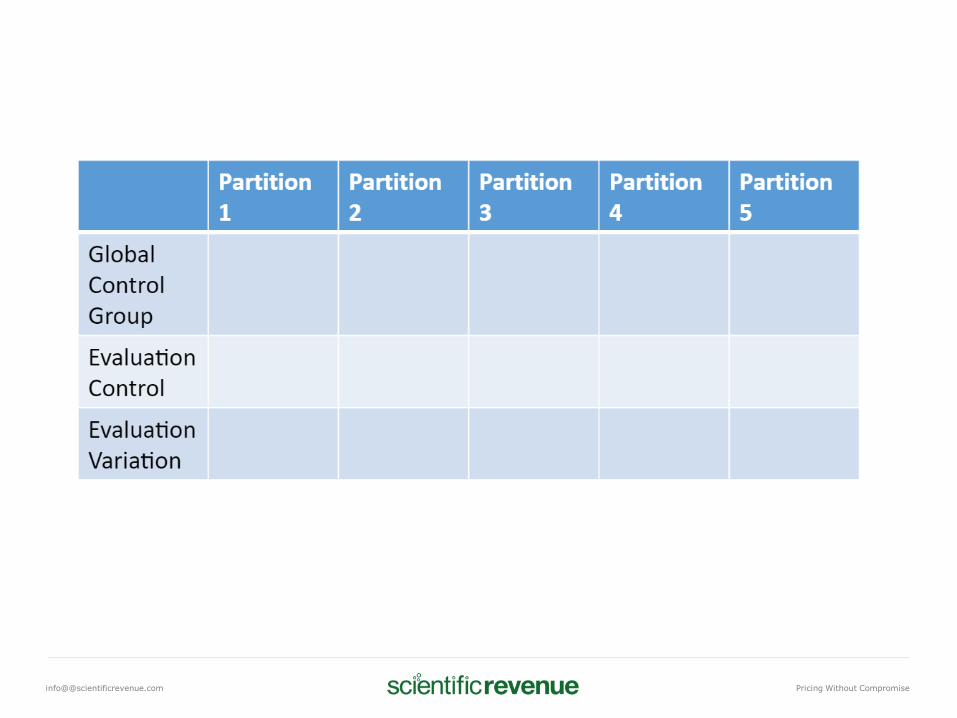
Evaluation Via “Two-Armed Partition-Based Test”
Two arms: Control and Variation
• Control has “Before” (no treatment)• Variation has entire model (all m treatments)
Partitions partition user space
• m treatments -> up to m disjoint segments in the partition.
• Disjoint segments are each mapped to different treatments
info@@scientificrevenue.com Pricing Without Compromise

info@@scientificrevenue.com Pricing Without Compromise
Runge et Al on Churn
Churn detection algorithm,workedvery well
No churn prevention policy worked well against the general population
A/B Test
http://ieeexplore.ieee.org/xpl/login.jsp?tp=&arnumber=6932875
info@@scientificrevenue.com Pricing Without Compromise
Revisiting Runge et Al
Runge et al built a model of churn prediction
This defines both the test population and the objective function
• Test population: Likely to churn• (Very simpleminded) Objective function: (Number of
Days until Actually Churned) – (Predicted Number of Days)
Covariates: they’ve collected a bunch
What should they do next?
Causal inference to see which strategies worked for whom (using the covariates as features)
info@@scientificrevenue.com Pricing Without Compromise
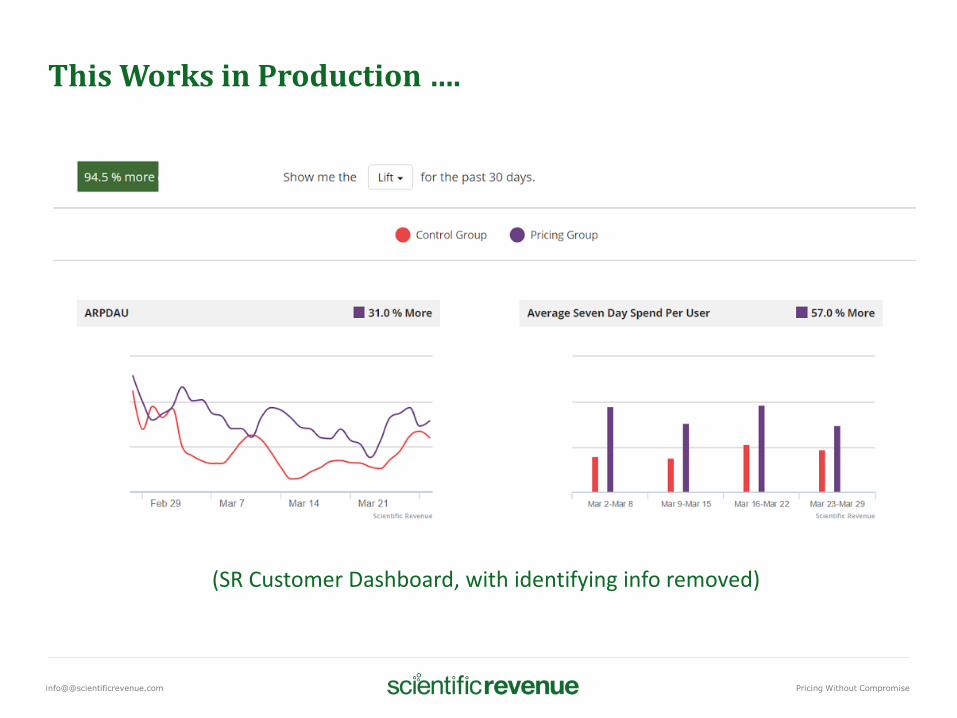
This Works in Production ….
(SR Customer Dashboard, with identifying info removed)