Embed Size (px)
Citation preview
1 | P a g e
“Working Capital Management Efficiency of
Ceramics Industry in BANGLADESH”
Independent University, Bangladesh
Submitted to
Dr. Md. Abdul Hannan Mia Faculty of Financial Management (MBA 511, Sec-04)
School of Business
Independent University, Bangladesh
Submitted by
Name ID
Farabi Ahmed 121-121-8
Marzan Bin Azad 141-067-3
MD. Shoriful Alom Sarkar 142-063-2
Date of Submission: 8th April, 2015
2 | P a g e
Letter of Transmittal
8th
April, 2015.
Dr. Md. Abdul Hannan Mia
Financial Management (MBA 511, Sec-04)
Faculty Member of School of Business,
Independent University Bangladesh.
Subject: A report on Working Capital Management Efficiency of Ceramics Industry in
Bangladesh.
Dear Sir,
With due respect, I would like to inform you that I have completed report on “Working Capital
Management Efficiency of Ceramics Industry in Bangladesh”. It is immense pleasure for me
because I have successfully completed this report by receiving your continues guideline as a
supervisor.
I have endeavored to prepare this report from my level of best to accumulate relevant &
insightful information. If I am included any wrong information in unconsciously so please
forgive me as your student. It is a great experience for me to make this report. I have tried to
make the report comprehensively within the schedule time & limited recourse.
You’re sincerely,
.......................................
Farabi Ahmed
Marzan Bin Azad
Md. Shoriful Alom Sarkar
3 | P a g e
Working Capital Management Efficiency Between
RAK Ceramics Limited
&
Shinepukur Ceramics Limited
4 | P a g e
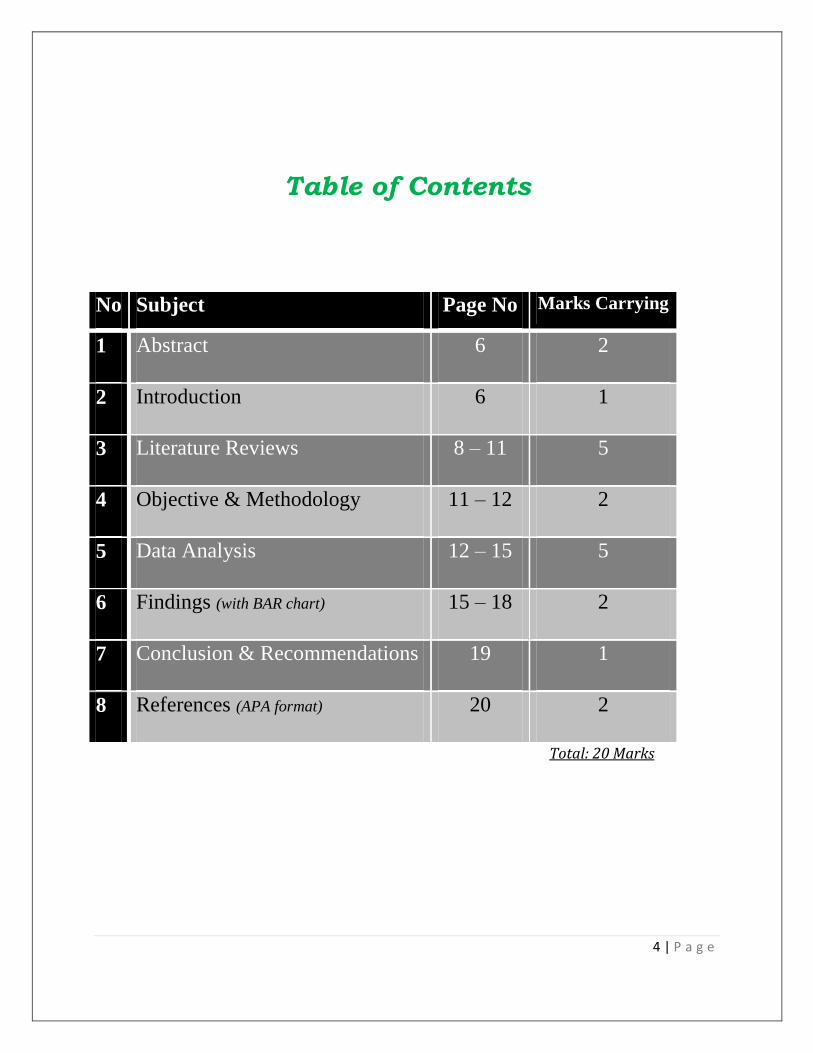
Table of Contents
No Subject Page No Marks Carrying
1 Abstract 6 2
2 Introduction 6 1
3 Literature Reviews 8 – 11 5
4 Objective & Methodology 11 – 12 2
5 Data Analysis 12 – 15 5
6 Findings (with BAR chart) 15 – 18 2
7 Conclusion & Recommendations 19 1
8 References (APA format) 20 2
Total: 20 Marks
5 | P a g e
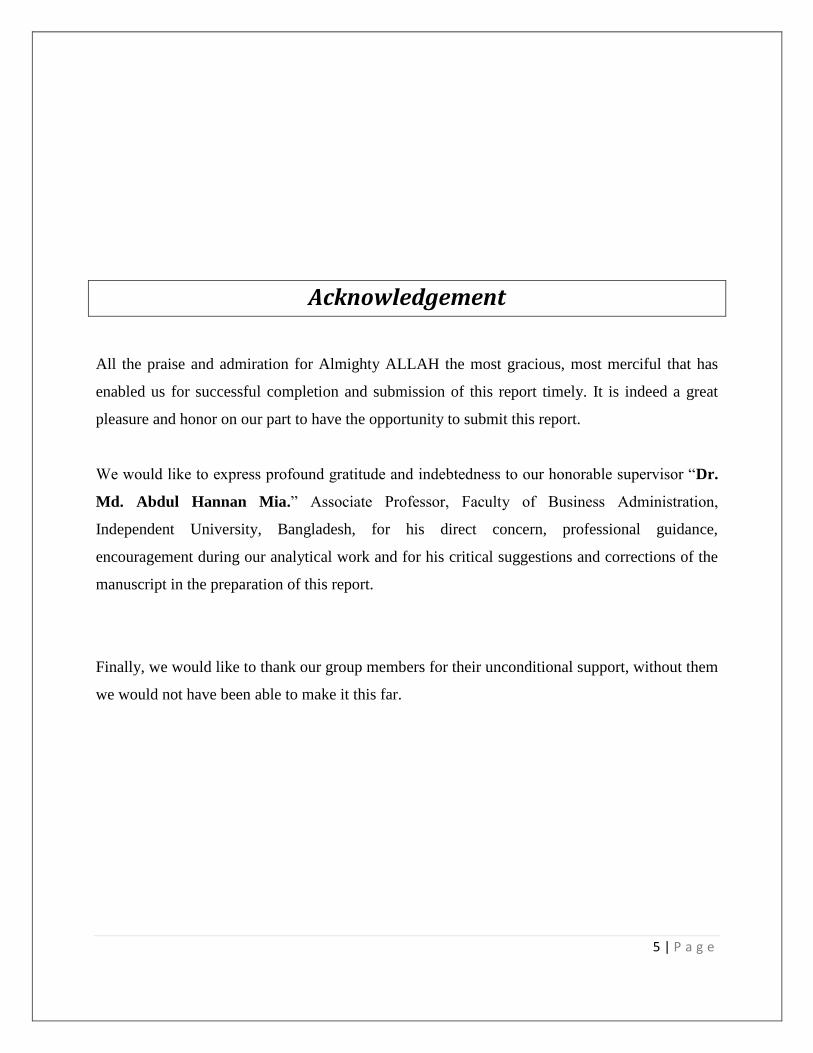
Acknowledgement
All the praise and admiration for Almighty ALLAH the most gracious, most merciful that has
enabled us for successful completion and submission of this report timely. It is indeed a great
pleasure and honor on our part to have the opportunity to submit this report.
We would like to express profound gratitude and indebtedness to our honorable supervisor “Dr.
Md. Abdul Hannan Mia.” Associate Professor, Faculty of Business Administration,
Independent University, Bangladesh, for his direct concern, professional guidance,
encouragement during our analytical work and for his critical suggestions and corrections of the
manuscript in the preparation of this report.
Finally, we would like to thank our group members for their unconditional support, without them
we would not have been able to make it this far.
6 | P a g e
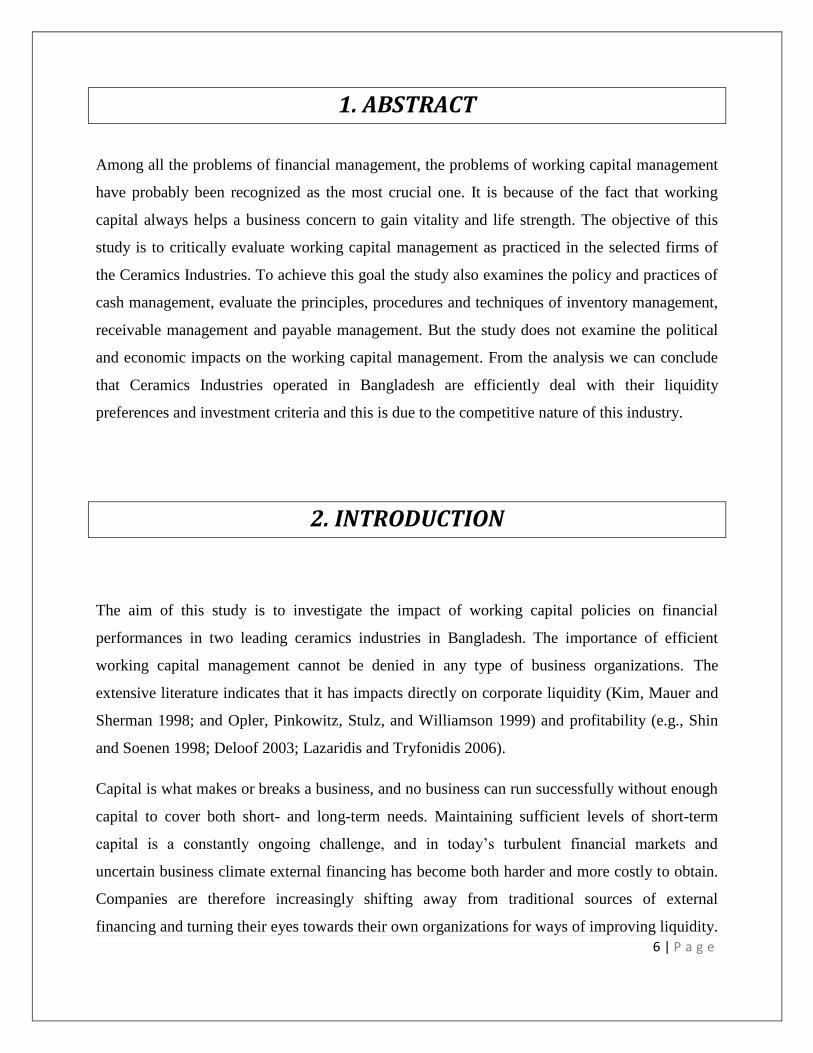
1. ABSTRACT
Among all the problems of financial management, the problems of working capital management
have probably been recognized as the most crucial one. It is because of the fact that working
capital always helps a business concern to gain vitality and life strength. The objective of this
study is to critically evaluate working capital management as practiced in the selected firms of
the Ceramics Industries. To achieve this goal the study also examines the policy and practices of
cash management, evaluate the principles, procedures and techniques of inventory management,
receivable management and payable management. But the study does not examine the political
and economic impacts on the working capital management. From the analysis we can conclude
that Ceramics Industries operated in Bangladesh are efficiently deal with their liquidity
preferences and investment criteria and this is due to the competitive nature of this industry.
2. INTRODUCTION
The aim of this study is to investigate the impact of working capital policies on financial
performances in two leading ceramics industries in Bangladesh. The importance of efficient
working capital management cannot be denied in any type of business organizations. The
extensive literature indicates that it has impacts directly on corporate liquidity (Kim, Mauer and
Sherman 1998; and Opler, Pinkowitz, Stulz, and Williamson 1999) and profitability (e.g., Shin
and Soenen 1998; Deloof 2003; Lazaridis and Tryfonidis 2006).
Capital is what makes or breaks a business, and no business can run successfully without enough
capital to cover both short- and long-term needs. Maintaining sufficient levels of short-term
capital is a constantly ongoing challenge, and in today’s turbulent financial markets and
uncertain business climate external financing has become both harder and more costly to obtain.
Companies are therefore increasingly shifting away from traditional sources of external
financing and turning their eyes towards their own organizations for ways of improving liquidity.
7 | P a g e
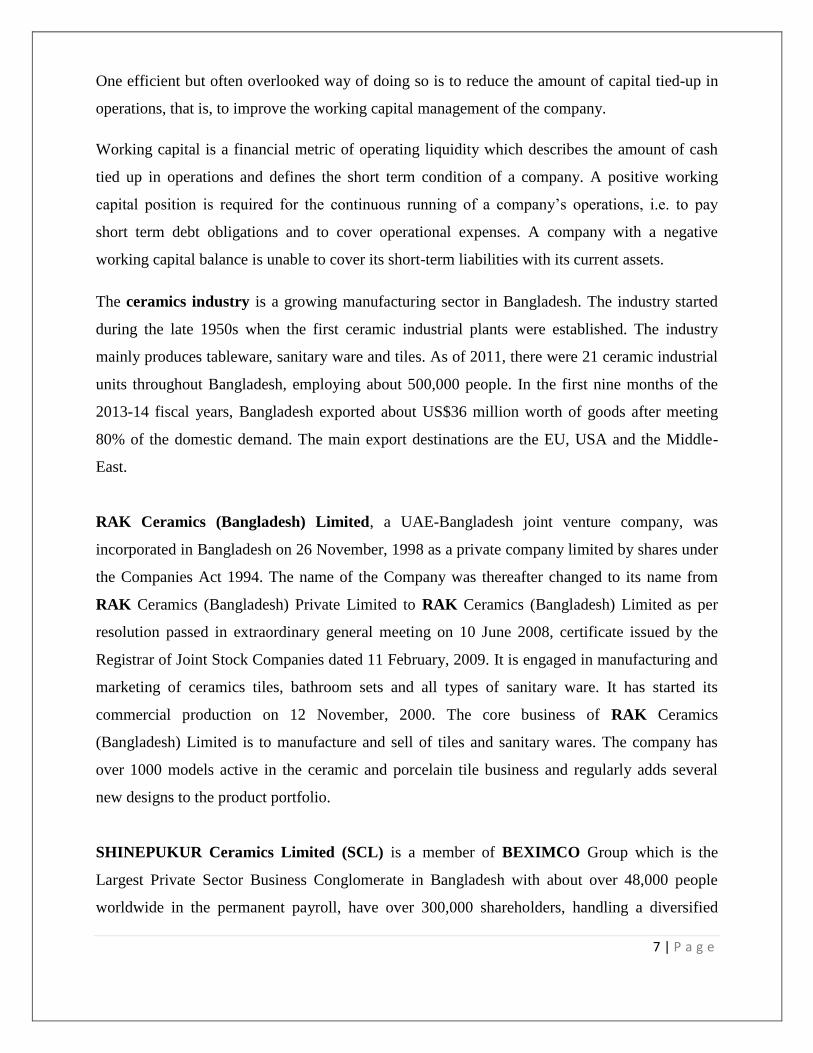
One efficient but often overlooked way of doing so is to reduce the amount of capital tied-up in
operations, that is, to improve the working capital management of the company.
Working capital is a financial metric of operating liquidity which describes the amount of cash
tied up in operations and defines the short term condition of a company. A positive working
capital position is required for the continuous running of a company’s operations, i.e. to pay
short term debt obligations and to cover operational expenses. A company with a negative
working capital balance is unable to cover its short-term liabilities with its current assets.
The ceramics industry is a growing manufacturing sector in Bangladesh. The industry started
during the late 1950s when the first ceramic industrial plants were established. The industry
mainly produces tableware, sanitary ware and tiles. As of 2011, there were 21 ceramic industrial
units throughout Bangladesh, employing about 500,000 people. In the first nine months of the
2013-14 fiscal years, Bangladesh exported about US$36 million worth of goods after meeting
80% of the domestic demand. The main export destinations are the EU, USA and the Middle-
East.
RAK Ceramics (Bangladesh) Limited, a UAE-Bangladesh joint venture company, was
incorporated in Bangladesh on 26 November, 1998 as a private company limited by shares under
the Companies Act 1994. The name of the Company was thereafter changed to its name from
RAK Ceramics (Bangladesh) Private Limited to RAK Ceramics (Bangladesh) Limited as per
resolution passed in extraordinary general meeting on 10 June 2008, certificate issued by the
Registrar of Joint Stock Companies dated 11 February, 2009. It is engaged in manufacturing and
marketing of ceramics tiles, bathroom sets and all types of sanitary ware. It has started its
commercial production on 12 November, 2000. The core business of RAK Ceramics
(Bangladesh) Limited is to manufacture and sell of tiles and sanitary wares. The company has
over 1000 models active in the ceramic and porcelain tile business and regularly adds several
new designs to the product portfolio.
SHINEPUKUR Ceramics Limited (SCL) is a member of BEXIMCO Group which is the
Largest Private Sector Business Conglomerate in Bangladesh with about over 48,000 people
worldwide in the permanent payroll, have over 300,000 shareholders, handling a diversified
8 | P a g e
range of merchandise to and from Bangladesh. SHINEPUKUR Ceramics was registered in
Bangladesh in 1997 and the Plants were commissioned in 1998.Commercial production of
Porcelain Tableware started in April 1999 and Bone China in November 1999. SCL is located in
the BEXIMCO Industrial Park, near Dhaka Export Processing Zone (DEPZ), 40 Km from
Capital Dhaka City.
In such a context, examining the type of working capital financing policies and that of working
capital investment policies is of paramount importance in the ceramics industries in Bangladesh.
Moreover, the question of measuring the impact of these policies on the financial performances
of the firms is also imperative in the context of the sample firms.
Working capital policies are mainly of two types via; working capital investment policy and
working capital financing policy. Working capital investment policy refers to the determination
of the amount of working capital to be invested in various current assets viz; inventory, cash,
receivables, marketable securities, prepaid expenses etc. That is, the allocation of total working
capital in to the major components of working policy is known as working capital investment
policy. But working capital financing policy refers to the policy which is applied in financing the
working capital. That is, in financing the working capital whether the firm would use the hedging
policy, conservative policy or moderate policy.
3. LITERATURE REVIEWS
Kieschnick and LaPlante (2012) provide evidence linking working capital management
to shareholder wealth. They find that the incremental dollar invested in net operating capital is
less valuable than the incremental dollar held in cash for the average firm. The findings
reported in the paper further suggest that the valuation of the incremental dollar invested in net
operating working is significantly influenced by a firm’s future sales expectations, its debt load,
its financial constraints, and its bankruptcy risk.
Zubairi H. J. (2010), in his literature concluded that, a firm can enhance its profitability
9 | P a g e
either by increasing its currents assets or by reducing its current liabilities. He also mentioned
that, the firm size is found to have a significant and direct effect on profitability of automobile
firms in Pakistan. The key factor for improving industry profitability in the future appears to be
increase in capacity utilization which can be got further impetus if interest rates also decline.
Harford, Mansi, Maxwell, D’Mello, Krishnaswami and Larkin (2008) find that the availability
of external financing is a determinant of liquidity. Thus restricted access to capital markets
requires firms to hold larger cash reserves. Other studies show that firms with weaker corporate
governance structures hold smaller cash reserves. Furthermore firms with excess cash holding
as well as weak shareholder rights undertake more acquisitions.
Lazaridis D. I. and Tryfonidis M. D. (2005) mentioned that there is statistical significance
between profitability, measured through gross operating profit, and the cash conversion cycle.
Managers can create profits for their companies by handling correctly the cash conversion
cycle and keeping each different component (accounts receivables, accounts payables,
inventory) to an optimum level.
Eljelly, (2004): elucidated that efficient liquidity management involves planning and controlling
current assets and current liabilities in such a manner that eliminates the risk of inability to meet
due short-term obligations and avoids excessive investment in these assets. The relation between
profitability and liquidity was examined, as measured by current ratio and cash gap (cash
conversion cycle) on a sample of joint stock companies in Saudi Arabia using correlation and
regression analysis. The study found that the cash conversion cycle was of more importance as a
measure of liquidity than the current ratio that affects profitability. The size variable was found
to have significant effect on profitability at the industry level. The results were stable and had
important implications for liquidity management in various Saudi companies. First, it was clear
that there was a negative relationship between profitability and liquidity indicators such as
current ratio and cash gap in the Saudi sample examined. Second, the study also revealed that
there was great variation among industries with respect to the significant measure of liquidity.
Deloof, (2003): discussed that most firms had a large amount of cash invested in working capital.
It can therefore be expected that the way in which working capital is managed will have a
significant impact on profitability of those firms. Using correlation and regression tests he found
a significant negative relationship between gross operating income and the number of days
accounts receivable, inventories and accounts payable of Belgian firms. On basis of these results
10 | P a g e
he suggested that managers could create value for their shareholders by reducing the number of
days’ accounts receivable and inventories to a reasonable minimum. The negative relationship
between accounts payable and profitability is consistent with the view that less profitable firms
wait longer to pay their bills.
Ghosh and Maji, (2003): in this paper made an attempt to examine the efficiency of working
capital management of the Indian cement companies during 1992 – 1993 to 2001 – 2002. For
measuring the efficiency of working capital management, performance, utilization, and overall
efficiency indices were calculated instead of using some common working capital management
ratios. Setting industry norms as target-efficiency levels of the individual firms, this paper also
tested the speed of achieving that target level of efficiency by an individual firm during the
period of study. Findings of the study indicated that the Indian Cement Industry as a whole did
not perform remarkably well during this period.
Kim, Mauer and Sherman (1998) and Opler, Pinkowitz, Stulz, Williamson (1999), Chiou et al.
(2006) and D’Mello, Krishnaswami and Larkin (2008) find that the availability of external
financing is a determinant of liquidity. Thus restricted access to capital markets requires firms to
hold larger cash reserves.
Osisioma (1997) defines proper working capital management as “the regulation, adjustment, and
control of the balance of current assets and current liabilities of a firm such that maturing
obligations are met, and the fixed assets are properly serviced”
Smith and Begemann (1997): emphasized that those who promoted working capital theory
shared that profitability and liquidity comprised the salient goals of working capital
management. The problem arose because the maximization of the firm's returns could seriously
threaten its liquidity, and the pursuit of liquidity had a tendency to dilute returns.
Shin and Soenen, (1998): highlighted that efficient Working Capital Management was very
important for creating value for the shareholders. The way working capital was managed had a
significant impact on both profitability and liquidity. The relationship between the length of Net
Trading Cycle, corporate profitability and risk adjusted stock return was examined using
correlation and regression analysis, by industry and capital intensity. They found a strong
11 | P a g e
negative relationship between lengths of the firm’s net-trading Cycle and its profitability. In
addition, shorter net trade cycles were associated with higher risk adjusted stock returns.
4. Objectives and Methodology
4.1 Objectives
The study aimed at the following objectives which were the questions whose answers we were
investigating throughout the paper:
To identify the existing short term financial objectives and policies of RAK Ceramics
and SHINEPUKUR Ceramics
To examine the factors influencing inventory, receivables and cash policies in the sample
firms
To analyze the actual positions of the working capital in the sample firms during the
study period 2010 to 2012.
To evaluate the working capital financing and investment patterns in the sample firms
in order to measure the effectiveness of the working capital policies during the study
period
To measure the relationship as well as impact of working capital policies on
financial performances measured in terms of Return on Equity (ROE).
4.2 Methodology
4.2.1 Target Population
The target population for fulfilling the objectives was the two leading ceramics Companies
operating in Bangladesh which are enlisted in Dhaka Stock Exchange.
4.2.2 Sample Size
12 | P a g e
The present study has covered two ceramics companies. The Financial Statements of these two
ceramics companies in between the years 2010 and 2012 were analyzed. A total number of two
respondents being the chief of accountants were selected for collecting the primary data.
4.2.3 Collection of Data
Mainly secondary data were used in this study which was collected from the Financial
Statements (Annual Report) of the selected private manufacturing firms. For literature review
and other purposes, different books, articles, manuals, World Wide Web and other secondary
data were used.
5. Data Analysis
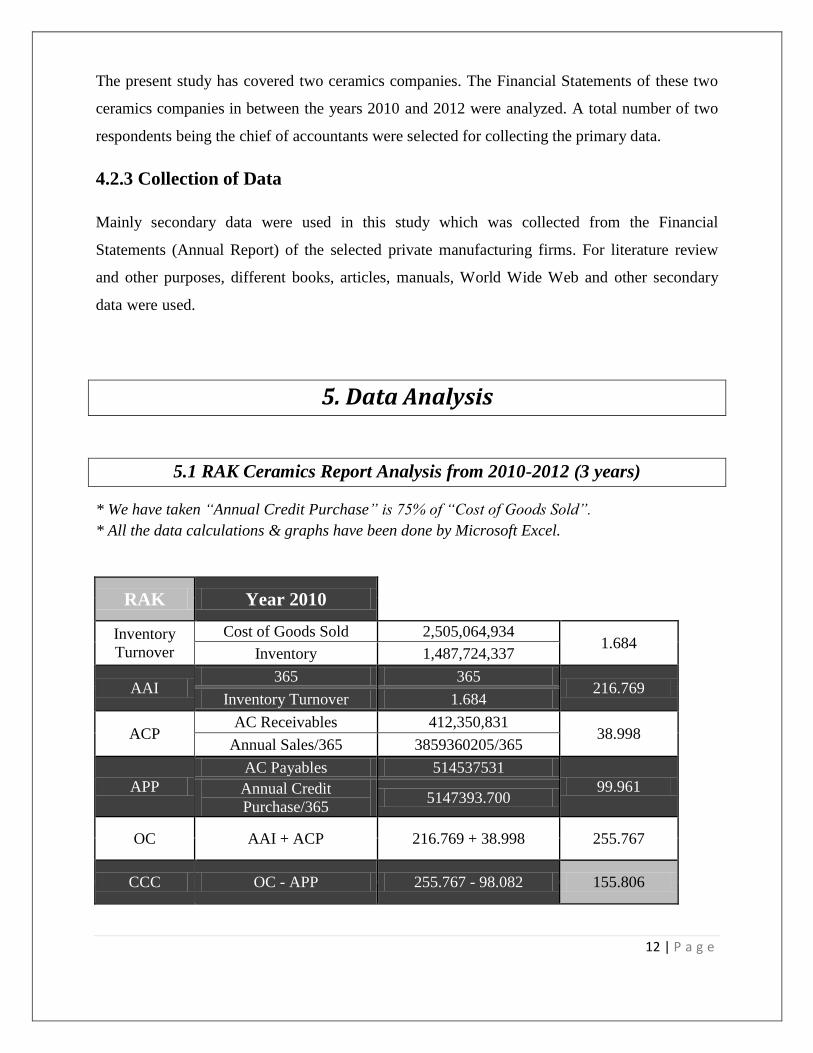
5.1 RAK Ceramics Report Analysis from 2010-2012 (3 years)
* We have taken “Annual Credit Purchase” is 75% of “Cost of Goods Sold”.
* All the data calculations & graphs have been done by Microsoft Excel.
RAK Year 2010
Inventory
Turnover
Cost of Goods Sold 2,505,064,934 1.684
Inventory 1,487,724,337
AAI 365 365
216.769 Inventory Turnover 1.684
ACP AC Receivables 412,350,831
38.998 Annual Sales/365 3859360205/365
APP
AC Payables 514537531
99.961 Annual Credit
Purchase/365 5147393.700
OC AAI + ACP 216.769 + 38.998 255.767
CCC OC - APP 255.767 - 98.082 155.806
13 | P a g e
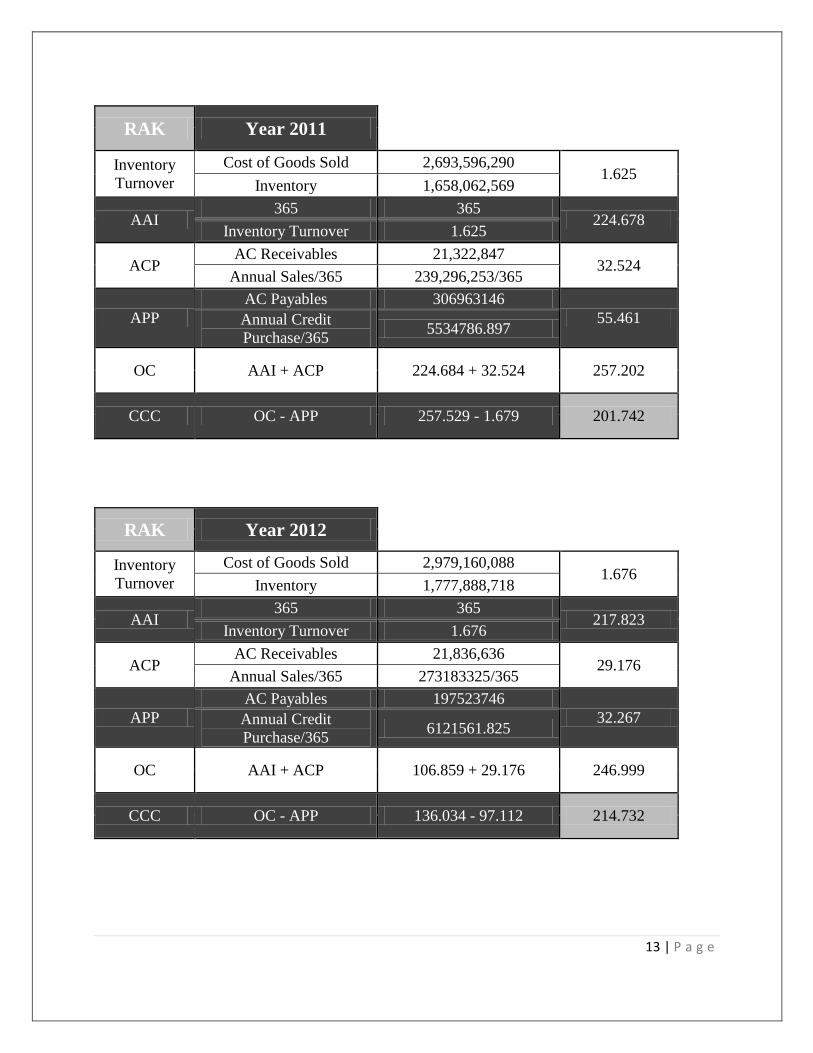
RAK Year 2011
Inventory
Turnover
Cost of Goods Sold 2,693,596,290 1.625
Inventory 1,658,062,569
AAI 365 365
224.678 Inventory Turnover 1.625
ACP AC Receivables 21,322,847
32.524 Annual Sales/365 239,296,253/365
APP
AC Payables 306963146
55.461 Annual Credit
Purchase/365 5534786.897
OC AAI + ACP 224.684 + 32.524 257.202
CCC OC - APP 257.529 - 1.679 201.742
RAK Year 2012
Inventory
Turnover
Cost of Goods Sold 2,979,160,088 1.676
Inventory 1,777,888,718
AAI 365 365
217.823 Inventory Turnover 1.676
ACP AC Receivables 21,836,636
29.176 Annual Sales/365 273183325/365
APP
AC Payables 197523746
32.267 Annual Credit
Purchase/365 6121561.825
OC AAI + ACP 106.859 + 29.176 246.999
CCC OC - APP 136.034 - 97.112 214.732
14 | P a g e
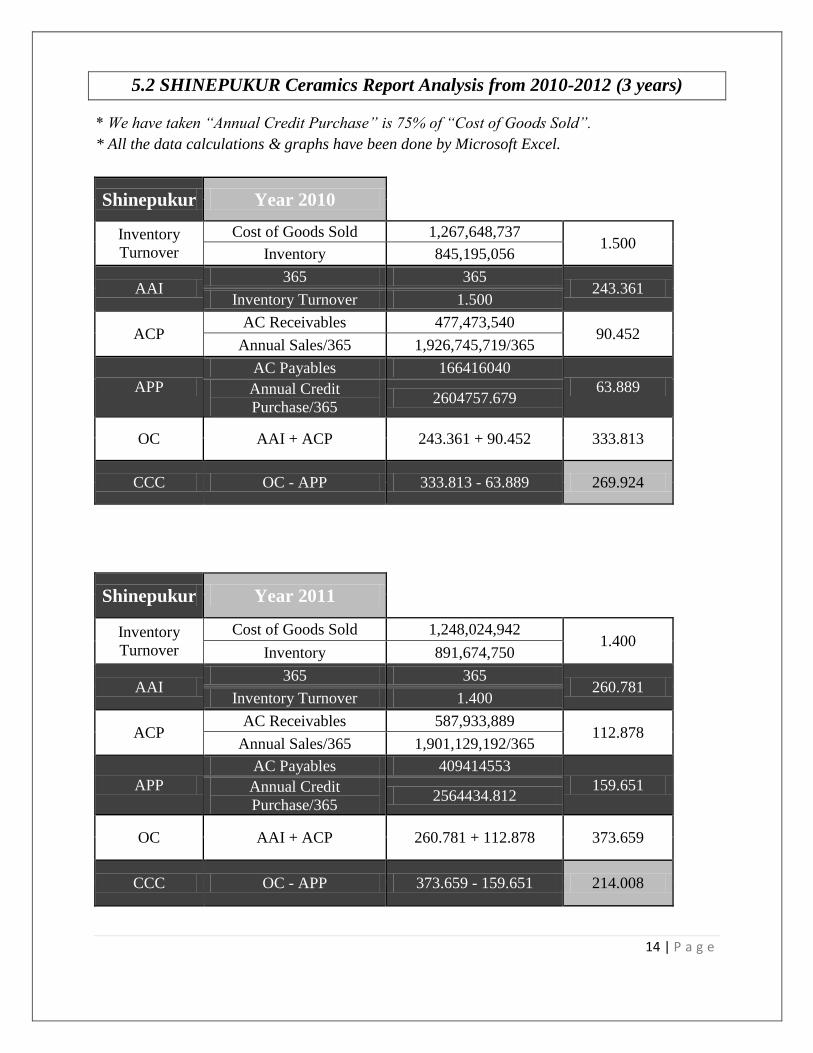
5.2 SHINEPUKUR Ceramics Report Analysis from 2010-2012 (3 years)
* We have taken “Annual Credit Purchase” is 75% of “Cost of Goods Sold”.
* All the data calculations & graphs have been done by Microsoft Excel.
Shinepukur Year 2010
Inventory
Turnover
Cost of Goods Sold 1,267,648,737 1.500
Inventory 845,195,056
AAI 365 365
243.361 Inventory Turnover 1.500
ACP AC Receivables 477,473,540
90.452 Annual Sales/365 1,926,745,719/365
APP
AC Payables 166416040
63.889 Annual Credit
Purchase/365 2604757.679
OC AAI + ACP 243.361 + 90.452 333.813
CCC OC - APP 333.813 - 63.889 269.924
Shinepukur Year 2011
Inventory
Turnover
Cost of Goods Sold 1,248,024,942 1.400
Inventory 891,674,750
AAI 365 365
260.781 Inventory Turnover 1.400
ACP AC Receivables 587,933,889
112.878 Annual Sales/365 1,901,129,192/365
APP
AC Payables 409414553
159.651 Annual Credit
Purchase/365 2564434.812
OC AAI + ACP 260.781 + 112.878 373.659
CCC OC - APP 373.659 - 159.651 214.008
15 | P a g e
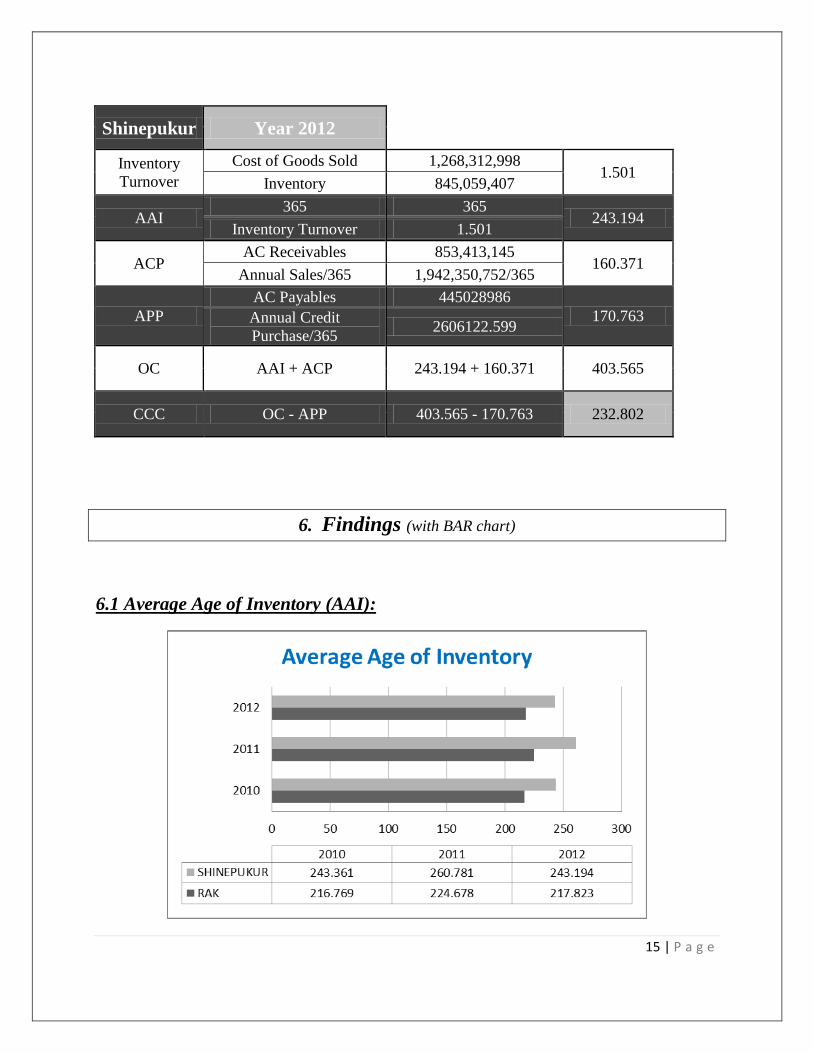
Shinepukur Year 2012
Inventory
Turnover
Cost of Goods Sold 1,268,312,998 1.501
Inventory 845,059,407
AAI 365 365
243.194 Inventory Turnover 1.501
ACP AC Receivables 853,413,145
160.371 Annual Sales/365 1,942,350,752/365
APP
AC Payables 445028986
170.763 Annual Credit
Purchase/365 2606122.599
OC AAI + ACP 243.194 + 160.371 403.565
CCC OC - APP 403.565 - 170.763 232.802
6. Findings (with BAR chart)
6.1 Average Age of Inventory (AAI):
16 | P a g e
Above from the analysis we find out that, In 2010 SHINEPUKUR’s “Avg. Age of Inventory”
was 243.361 days where RAK was 216.769 days, In 2011 SHINEPUKUR was 260.781 days
where RAK was 224.684 days, and In 2012 SHINEPUKUR was 243.194 days where RAK was
217.823 days.
So, RAK is performing better than SHINEPUKUR all those 3 years.
6.2 Average Collection Period (ACP):
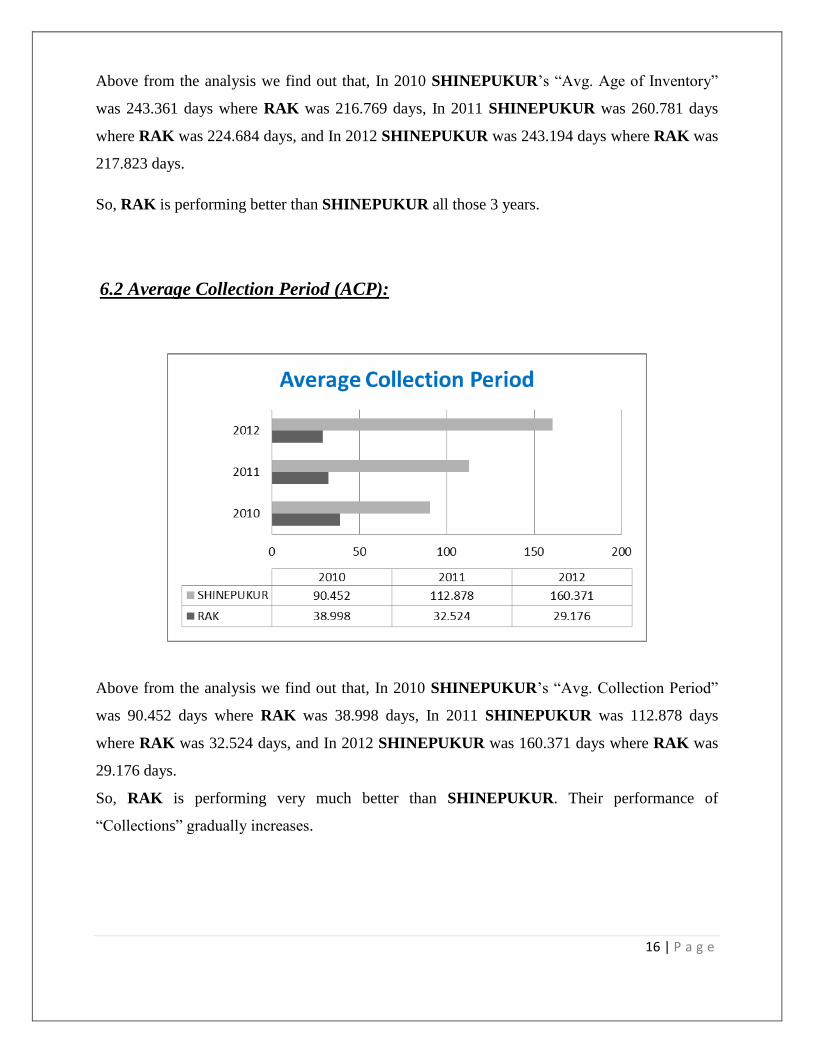
Above from the analysis we find out that, In 2010 SHINEPUKUR’s “Avg. Collection Period”
was 90.452 days where RAK was 38.998 days, In 2011 SHINEPUKUR was 112.878 days
where RAK was 32.524 days, and In 2012 SHINEPUKUR was 160.371 days where RAK was
29.176 days.
So, RAK is performing very much better than SHINEPUKUR. Their performance of
“Collections” gradually increases.
17 | P a g e
6.3 Average Payment Period (APP):
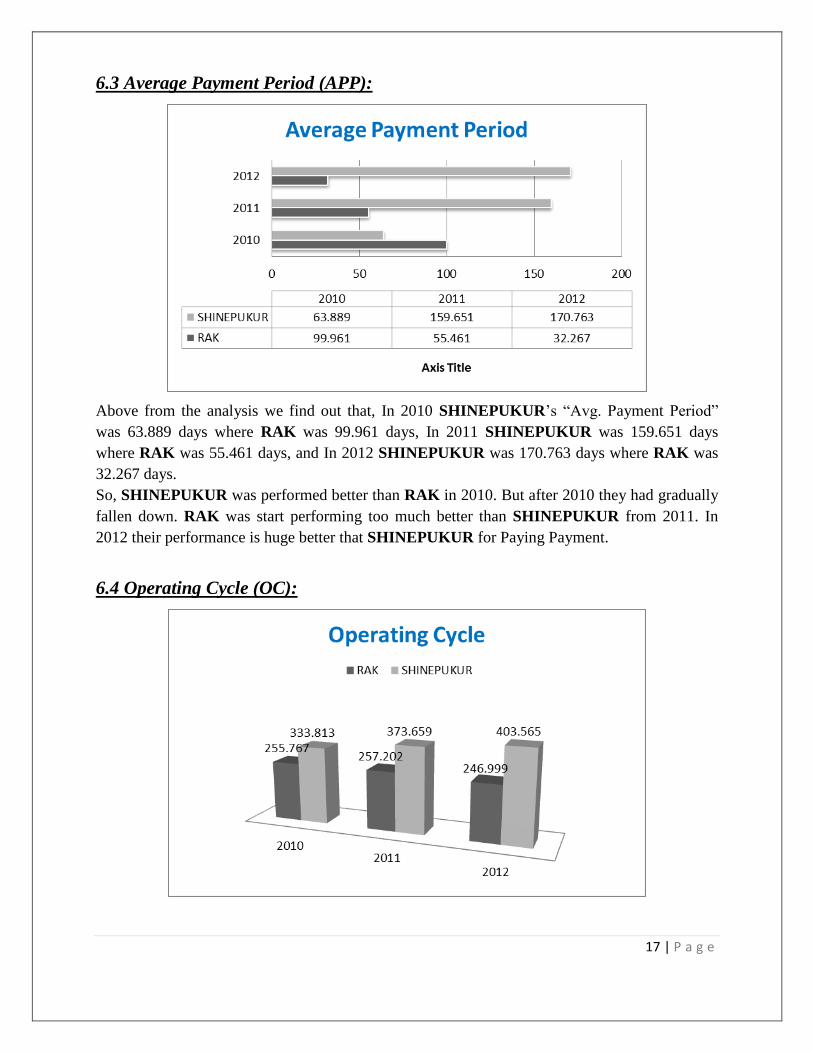
Above from the analysis we find out that, In 2010 SHINEPUKUR’s “Avg. Payment Period”
was 63.889 days where RAK was 99.961 days, In 2011 SHINEPUKUR was 159.651 days
where RAK was 55.461 days, and In 2012 SHINEPUKUR was 170.763 days where RAK was
32.267 days.
So, SHINEPUKUR was performed better than RAK in 2010. But after 2010 they had gradually
fallen down. RAK was start performing too much better than SHINEPUKUR from 2011. In
2012 their performance is huge better that SHINEPUKUR for Paying Payment.
6.4 Operating Cycle (OC):
18 | P a g e
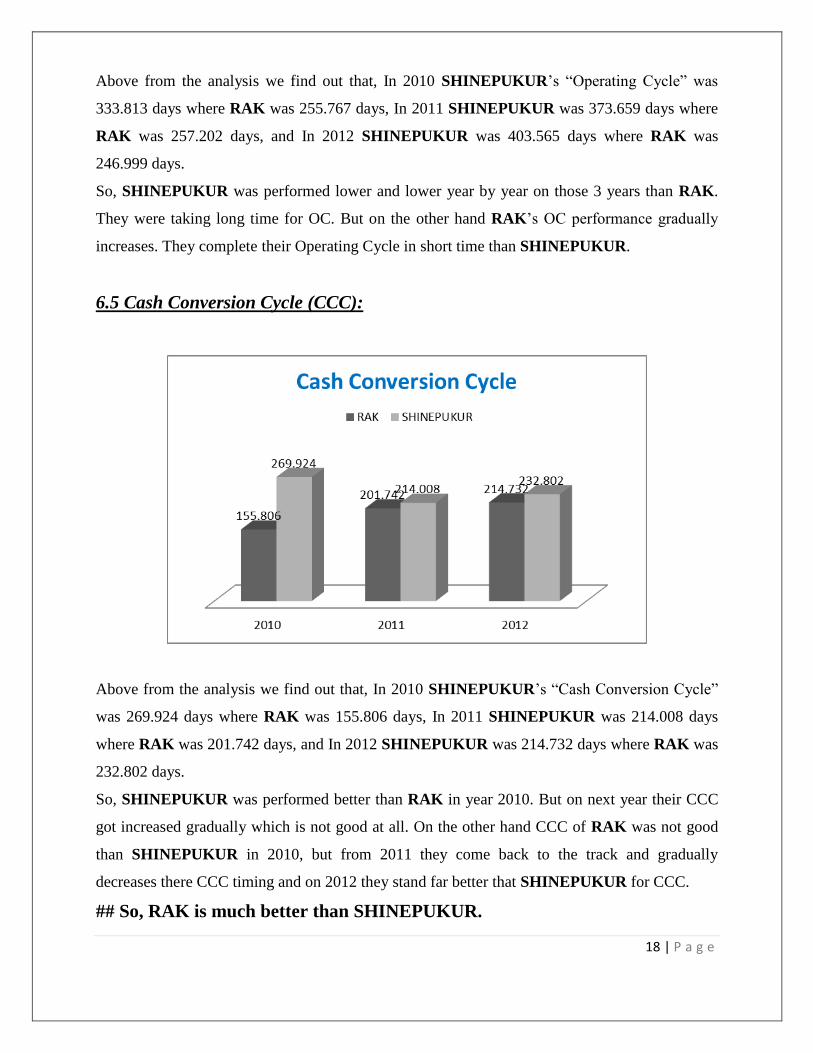
Above from the analysis we find out that, In 2010 SHINEPUKUR’s “Operating Cycle” was
333.813 days where RAK was 255.767 days, In 2011 SHINEPUKUR was 373.659 days where
RAK was 257.202 days, and In 2012 SHINEPUKUR was 403.565 days where RAK was
246.999 days.
So, SHINEPUKUR was performed lower and lower year by year on those 3 years than RAK.
They were taking long time for OC. But on the other hand RAK’s OC performance gradually
increases. They complete their Operating Cycle in short time than SHINEPUKUR.
6.5 Cash Conversion Cycle (CCC):
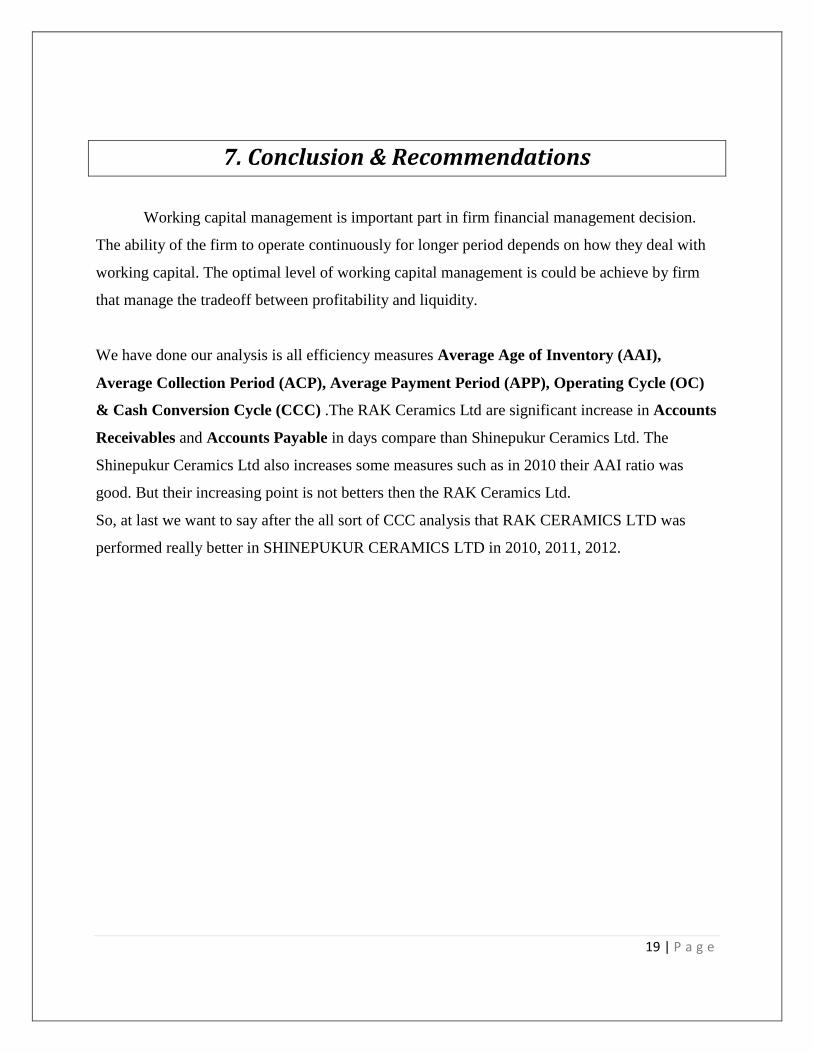
Above from the analysis we find out that, In 2010 SHINEPUKUR’s “Cash Conversion Cycle”
was 269.924 days where RAK was 155.806 days, In 2011 SHINEPUKUR was 214.008 days
where RAK was 201.742 days, and In 2012 SHINEPUKUR was 214.732 days where RAK was
232.802 days.
So, SHINEPUKUR was performed better than RAK in year 2010. But on next year their CCC
got increased gradually which is not good at all. On the other hand CCC of RAK was not good
than SHINEPUKUR in 2010, but from 2011 they come back to the track and gradually
decreases there CCC timing and on 2012 they stand far better that SHINEPUKUR for CCC.
## So, RAK is much better than SHINEPUKUR.
19 | P a g e
7. Conclusion & Recommendations
Working capital management is important part in firm financial management decision.
The ability of the firm to operate continuously for longer period depends on how they deal with
working capital. The optimal level of working capital management is could be achieve by firm
that manage the tradeoff between profitability and liquidity.
We have done our analysis is all efficiency measures Average Age of Inventory (AAI),
Average Collection Period (ACP), Average Payment Period (APP), Operating Cycle (OC)
& Cash Conversion Cycle (CCC) .The RAK Ceramics Ltd are significant increase in Accounts
Receivables and Accounts Payable in days compare than Shinepukur Ceramics Ltd. The
Shinepukur Ceramics Ltd also increases some measures such as in 2010 their AAI ratio was
good. But their increasing point is not betters then the RAK Ceramics Ltd.
So, at last we want to say after the all sort of CCC analysis that RAK CERAMICS LTD was
performed really better in SHINEPUKUR CERAMICS LTD in 2010, 2011, 2012.
20 | P a g e
8. References (APA format)
1. Annual Reports (2010, 2011, 2012) of RAK Ceramics Ltd. Available at
http://rakcerambd.com/investors_anual.php
2. Annual Reports (2010, 2011, 2012) of Shinepukur Ceramics Ltd. Available at
http://www.shinepukur.com/index.php?p=inv_annual
3. Deloof, M. (2003). Does working capital management affect profitability of Belgian
firms? Journal of Business Finance & Accounting 30 (4), pp. 573-587.
4. Gitman & Zutter (Eds .). (2014), Principal of Managerial Finance, 13th
Edition, Boston,
United States: Pearson.
5. Harford, J. (1999). Corporate cash reserves and acquisitions. Journal of Finance 54, pp.
1969–1997.
6. Kieschnick, Robert L., Laplante, Mark and Moussawi, Rabih, Working Capital
Management and Shareholder Wealth (April 27, 2012). Available at
SSRN:http://ssrn.com/abstract=1431165 or http://dx.doi.org/10.2139/ssrn.1431165.
7. Kim, Chang-Soo, David Mauer, and Ann Sherman, 1998, the determinants of corporate
liquidity: Theory and evidence, Journal of Financial and Quantitative Analysis 33, 335-
359.
8. Opler, Tim, Lee Pinkowitz, René Stulz, and Rohan Williamson, 1999, The determinants
and implications of corporate cash holdings, Journal of Financial Economics 52, 3-46.
9. Shin, Hyun-Han, and René Stulz, 1998, Are internal capital markets efficient? Quarterly
Journal of Economics 113, 531-552.
10. Zubairi, H. J. (2010), Impact of working capital management and capital structure
on profitability of automobile firms in Pakistan, www.ssrn.com.