Embed Size (px)
Citation preview
PULSES
Presented by:Anand S. Thokal
Rakesh B. R.
Flow of Presentation:
• Introduction
• India and world scenario
• Trends in supply and consumption
• Trends in organization of food systems
• References
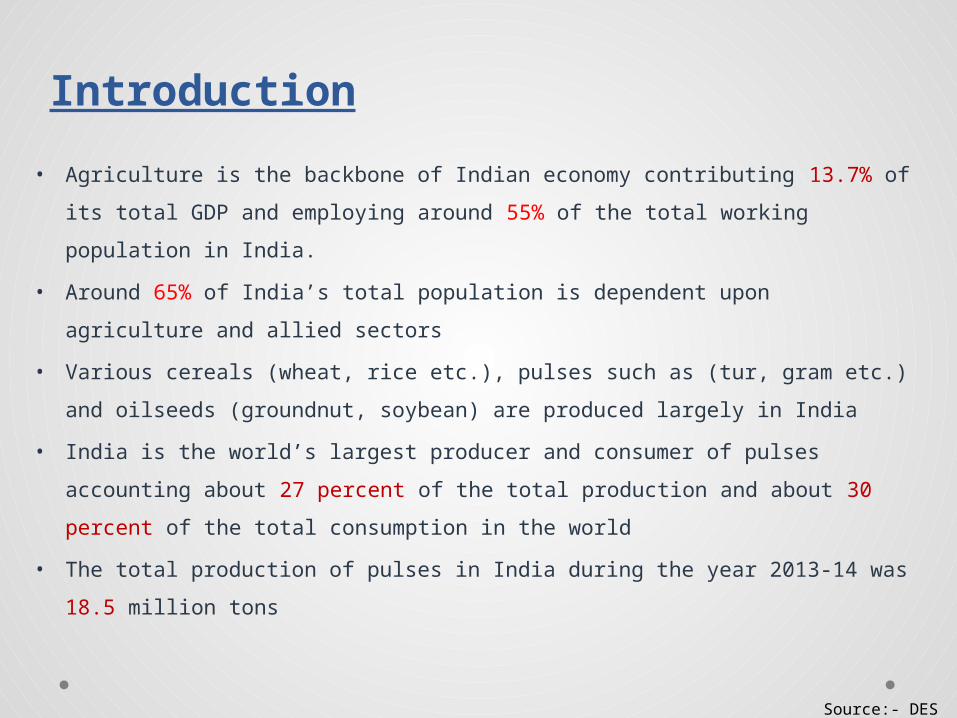
• Agriculture is the backbone of Indian economy contributing 13.7% of its total
GDP and employing around 55% of the total working population in India.
• Around 65% of India’s total population is dependent upon agriculture and allied
sectors
• Various cereals (wheat, rice etc.), pulses such as (tur, gram etc.) and oilseeds
(groundnut, soybean) are produced largely in India
• India is the world’s largest producer and consumer of pulses accounting about
27 percent of the total production and about 30 percent of the total consumption
in the world
• The total production of pulses in India during the year 2013-14 was 18.5 million
tons
Introduction
Source:- DES
2009-10 2010-11 2011-12 2012-13 2013-140
20
40
60
80
100
7079 79 78 79
6470 68 70 71
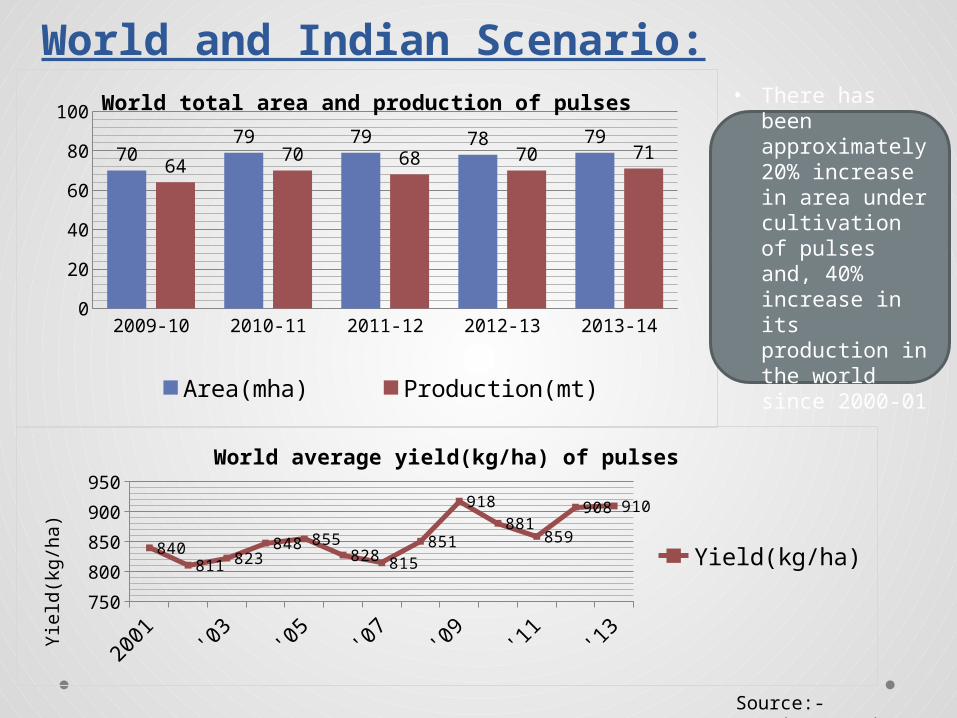
World total area and production of pulses
Area(mha) Production(mt)
World and Indian Scenario:
• There has been approximately 20% increase in area under cultivation of pulses and, 40% increase in its production in the world since 2000-01
2001
'02
'03
'04
'05
'06
'07
'08
'09
'10
'11
'12
'13
750
800
850
900
950
840811 823
848 855828 815
851
918
881859
908 910
World average yield(kg/ha) of pulses
Yield(kg/ha)
Yie
ld(k
g/h
a)
Source:- www.ipga.co.in
India Burma Canada China Australia0
5
10
15
20 18.5
6.02 4.96 4.34 3.89
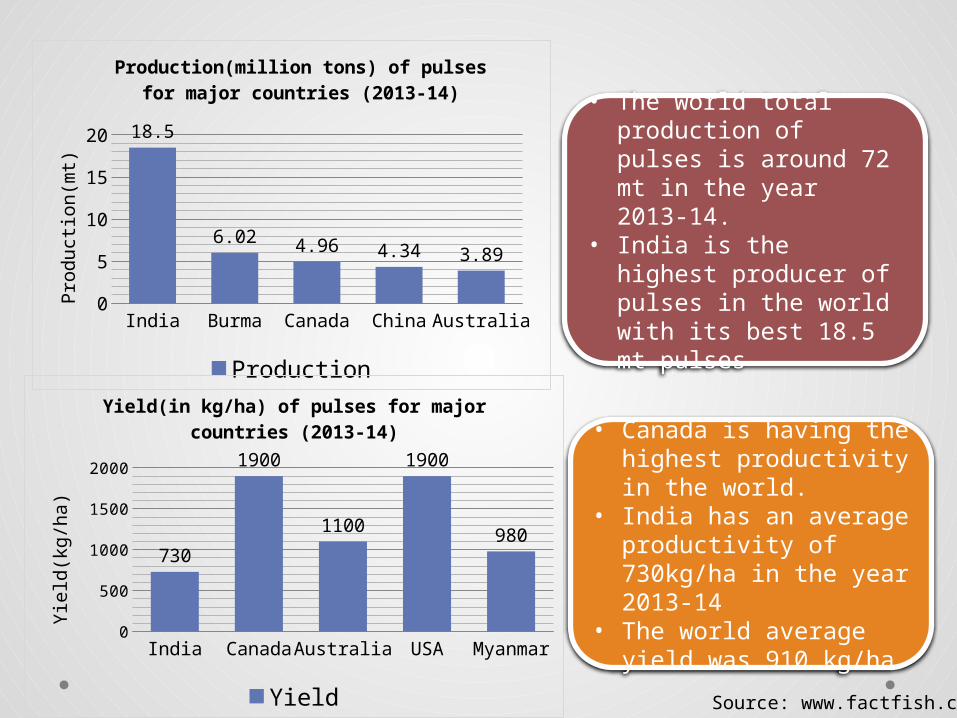
Production(million tons) of pulses for major countries (2013-14)
Production
Pro
du
ctio
n(m
t)
• The world total production of pulses is around 72 mt in the year 2013-14.
• India is the highest producer of pulses in the world with its best 18.5 mt pulses
India Canada Australia USA Myanmar0
400
800
1200
1600
2000
730
1900
1100
1900
980
Yield(in kg/ha) of pulses for major countries (2013-14)
Yield
Yie
ld(k
g/h
a)
• Canada is having the highest productivity in the world.
• India has an average productivity of 730kg/ha in the year 2013-14
• The world average yield was 910 kg/ha
Source: www.factfish.com
Canad
a
China
Austral
ia
Mya
nmar
USA
Indi
a0
1000000
2000000
3000000
0
400
800
1200
1600
20001722
854 808 795 719513
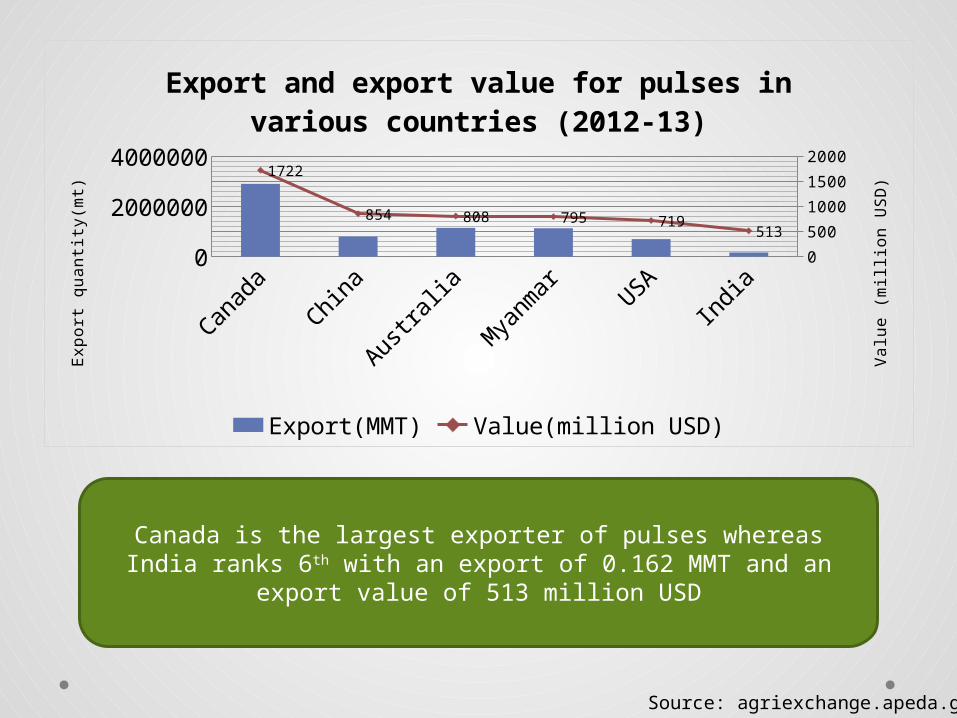
Export and export value for pulses in var-ious countries (2012-13)
Export(MMT) Value(million USD)
Exp
ort
qu
an
tity(
mt)
Va
lue
(m
illio
n U
SD
)
Source: agriexchange.apeda.gov.in
Canada is the largest exporter of pulses whereas India ranks 6th with an export of 0.162 MMT and an export value of 513 million USD
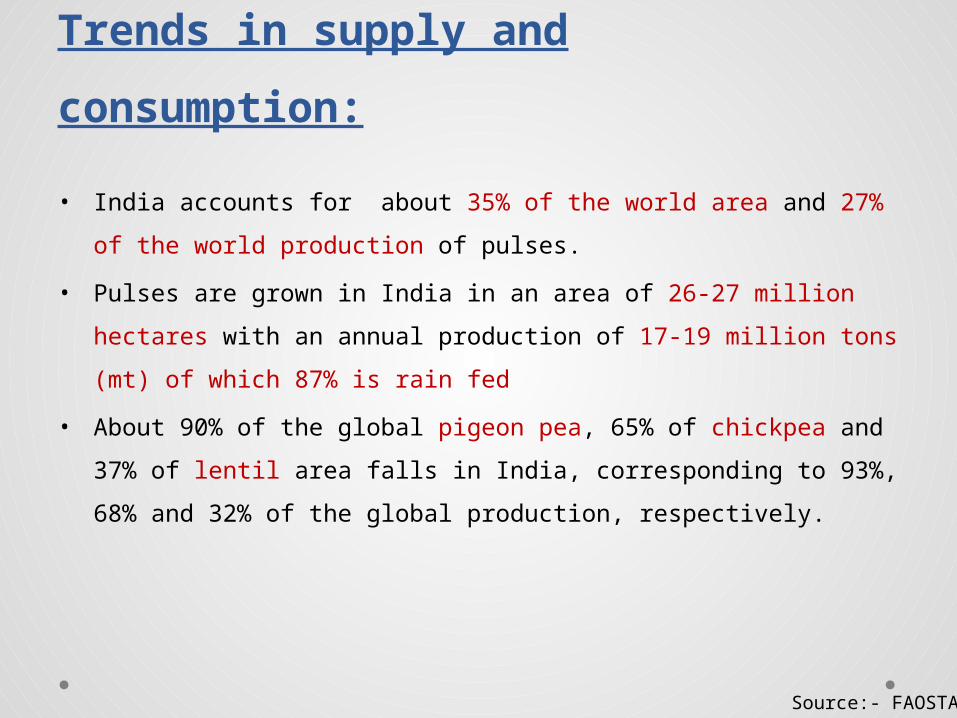
• India accounts for about 35% of the world area and 27% of the world
production of pulses.
• Pulses are grown in India in an area of 26-27 million hectares with an
annual production of 17-19 million tons (mt) of which 87% is rain fed
• About 90% of the global pigeon pea, 65% of chickpea and 37% of lentil area
falls in India, corresponding to 93%, 68% and 32% of the global production,
respectively.
Trends in supply and consumption:
Source:- FAOSTAT
2007-08 2008-09 2009-10 2010-11 2011-12 2012-13 2013-1402468
101214161820
6.44.69 4.2
7.126.06 6.19 7
8.369.88 10.46 11.12 11.03 11.26 11.5
14.76 14.57 14.66
18.2417.09 17.45
18.5
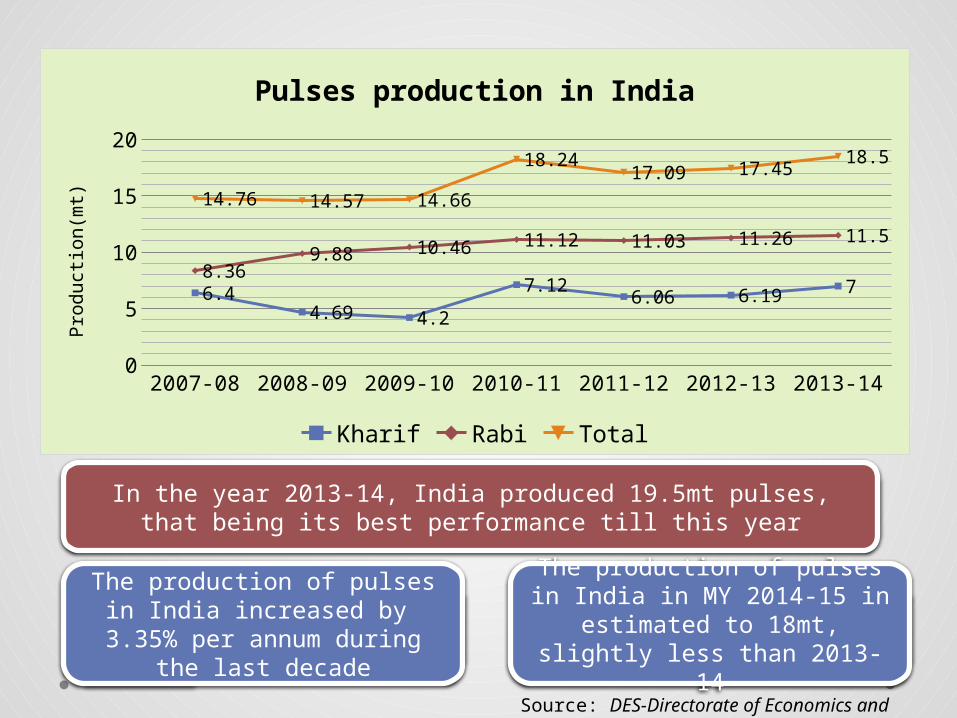
Pulses production in India
Kharif Rabi Total
Pro
du
ctio
n(m
t)
Source: DES-Directorate of Economics and Statistics
The production of pulses in India increased by 3.35% per annum during the last decade
In the year 2013-14, India produced 19.5mt pulses, that being its best performance till this year
The production of pulses in India in MY 2014-15 in
estimated to 18mt, slightly less than 2013-14
2009-10 2010-11 2011-12 2012-13 2013-140
100200300400500600700800
21
22
23
24
25
26
27
28
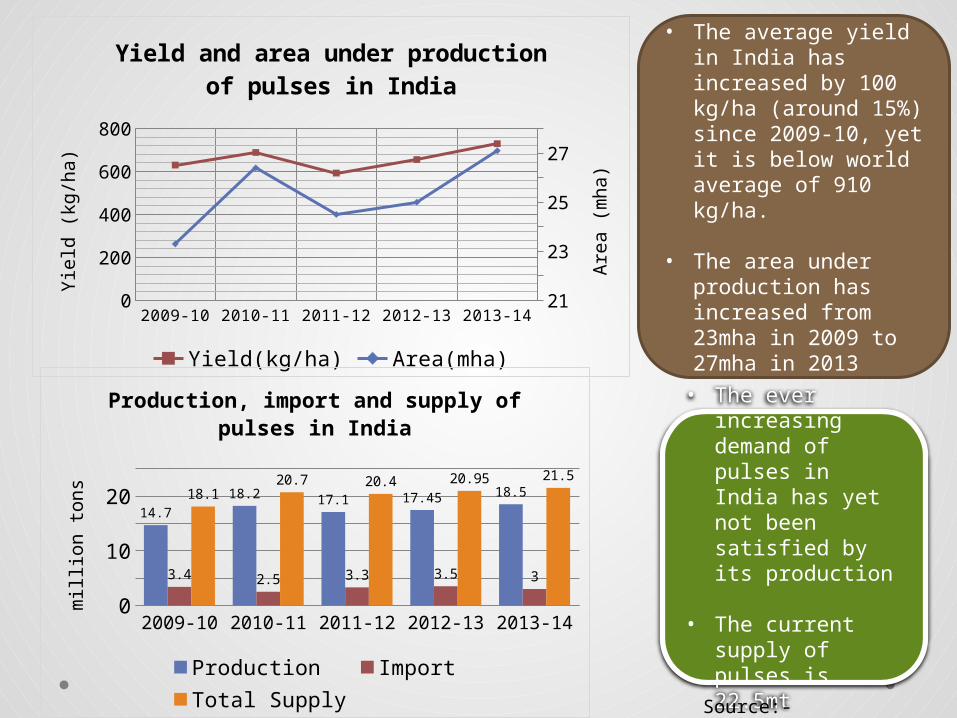
Yield and area under production of pulses in India
Yield(kg/ha) Area(mha)
Yie
ld (
kg/h
a)
Are
a (
mh
a)
• The average yield in India has increased by 100 kg/ha (around 15%) since 2009-10, yet it is below world average of 910 kg/ha.
• The area under production has increased from 23mha in 2009 to 27mha in 2013
2009-10 2010-11 2011-12 2012-13 2013-140
5
10
15
20
25
14.7
18.217.1 17.45
18.5
3.4 2.5 3.3 3.5 3
18.120.7 20.4 20.95 21.5
Production, import and supply of pulses in India
Production Import Total Supply
mill
ion
ton
s
• The ever increasing demand of pulses in India has yet not been satisfied by its production
• The current supply of pulses is 22.5mt
Source:- www.indiastat.com
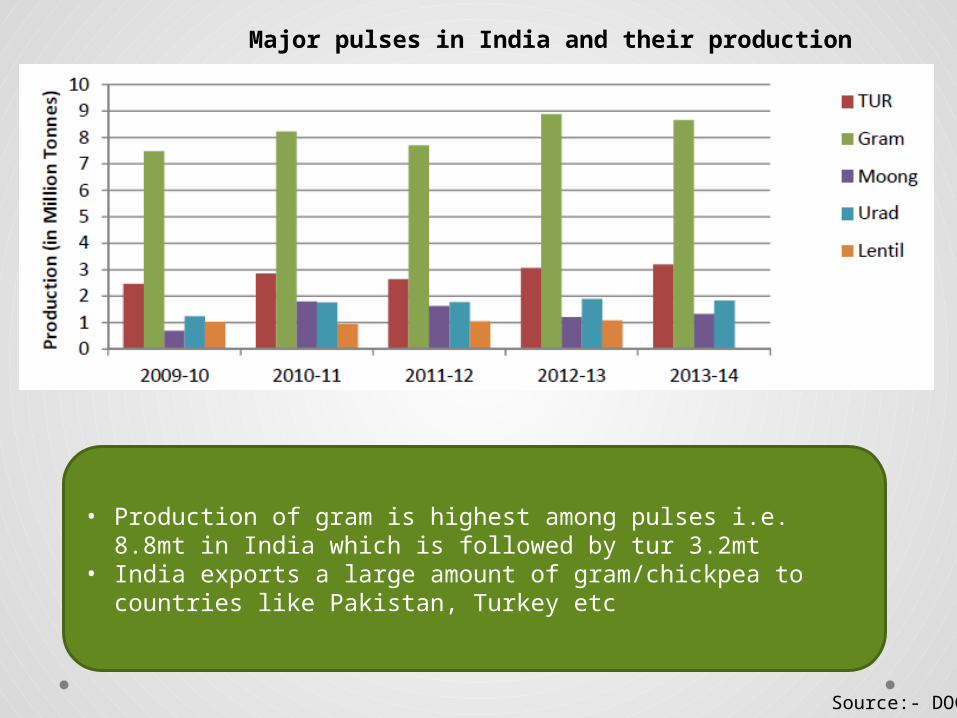
Major pulses in India and their production
• Production of gram is highest among pulses i.e. 8.8mt in India which is followed by tur 3.2mt
• India exports a large amount of gram/chickpea to countries like Pakistan, Turkey etc
Source:- DOC
2009-10 2010-11 2011-12 2012-13 2013-140
0.51
1.52
2.53
3.54
1.6 1.5
2.03
1.37 1.33
3.29
2.53
3.23
3.73.38
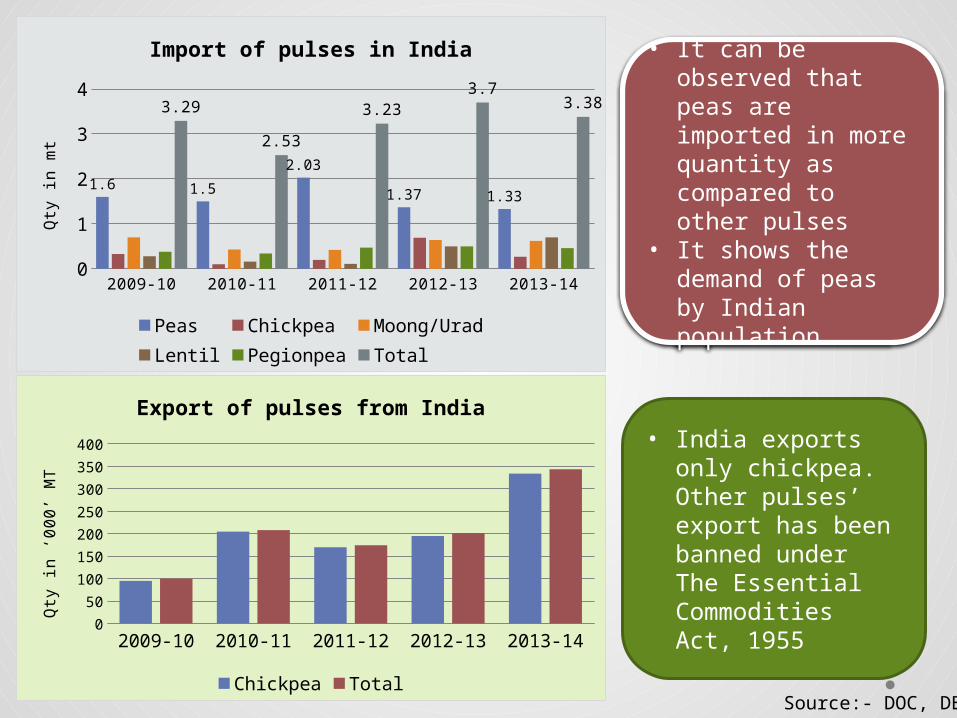
Import of pulses in India
Peas Chickpea Moong/UradLentil Pegionpea Total
Qty
in m
t
• It can be observed that peas are imported in more quantity as compared to other pulses
• It shows the demand of peas by Indian population
2009-10 2010-11 2011-12 2012-13 2013-140
50
100
150
200
250
300
350
400
Export of pulses from India
Chickpea Total
Qty
in ‘0
00
’ MT
• India exports only chickpea. Other pulses’ export has been banned under The Essential Commodities Act, 1955
Source:- DOC, DEC
Source:- DOC
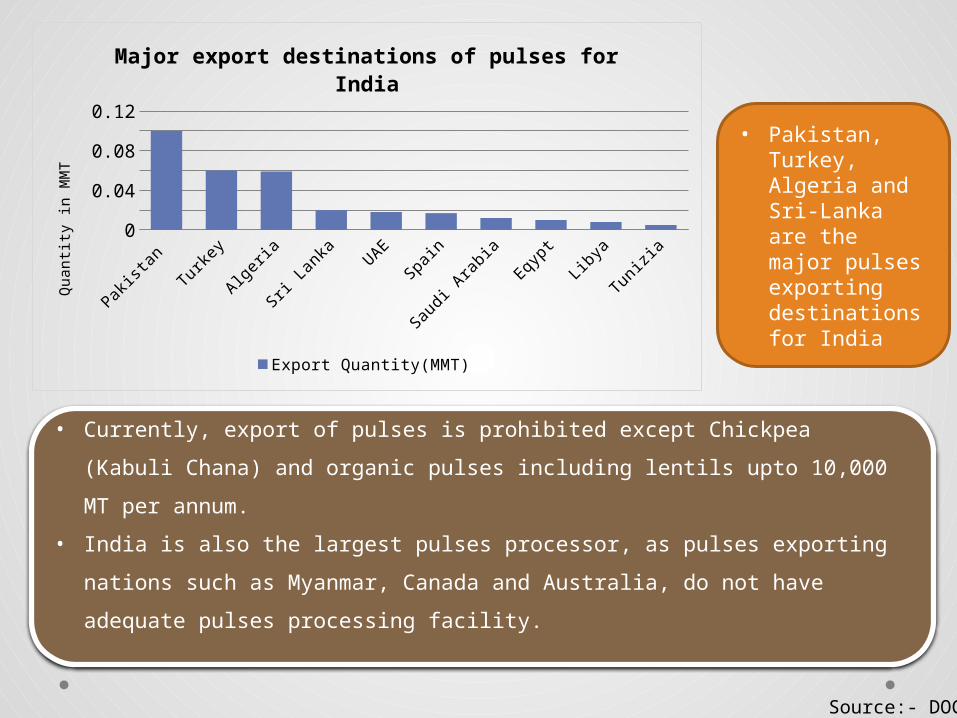
• Currently, export of pulses is prohibited except Chickpea (Kabuli Chana) and organic
pulses including lentils upto 10,000 MT per annum.
• India is also the largest pulses processor, as pulses exporting nations such as
Myanmar, Canada and Australia, do not have adequate pulses processing facility.
• Pakistan, Turkey, Algeria and Sri-Lanka are the major pulses exporting destinations for IndiaPak
istan
Turke
y
Alger
ia
Sri Lan
kaUAE
Spain
Saudi
Ara
bia
Eqypt
Libya
Tunizi
a0
0.02
0.04
0.06
0.08
0.1
0.12
Major export destinations of pulses for India
Export Quantity(MMT)
Qua
ntity
in M
MT
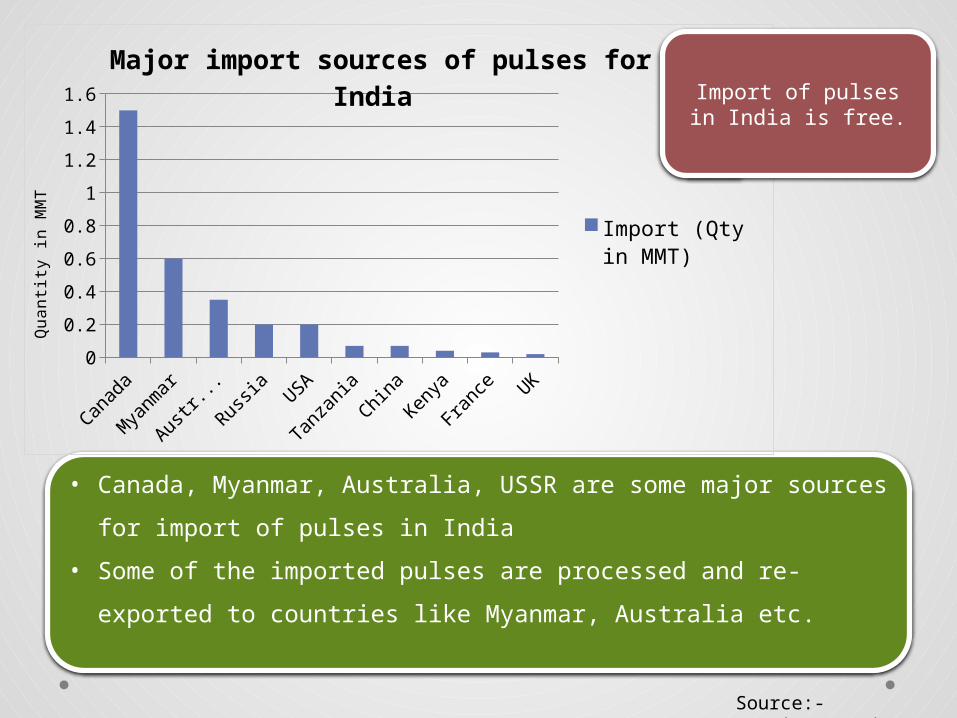
• Canada, Myanmar, Australia, USSR are some major sources for import of
pulses in India
• Some of the imported pulses are processed and re-exported to countries
like Myanmar, Australia etc.
Canad
a
Mya
nmar
Austr
alia
Russia
USA
Tanza
nia
China
Kenya
Franc
eUK
0
0.2
0.4
0.6
0.8
1
1.2
1.4
1.6
Major import sources of pulses for India
Import (Qty in MMT)
Qu
an
tity
in M
MT
Source:- www.ipga.co.in
Import of pulses in India is free.
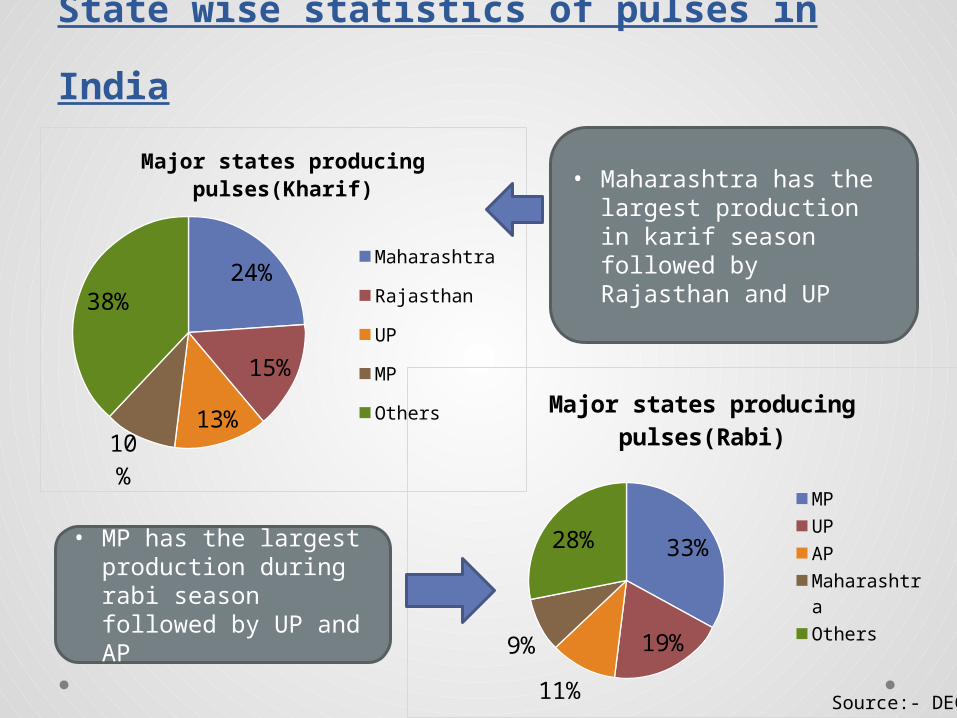
State wise statistics of pulses in India
24%
15%
13%10%
38%
Major states producing pulses(Kharif)
Maharashtra
Rajasthan
UP
MP
Others
33%
19%
11%
9%
28%
Major states producing pulses(Rabi)
MP
UP
AP
Maha-rashtra
Others
• Maharashtra has the largest production in karif season followed by Rajasthan and UP
• MP has the largest production during rabi season followed by UP and AP
Source:- DEC
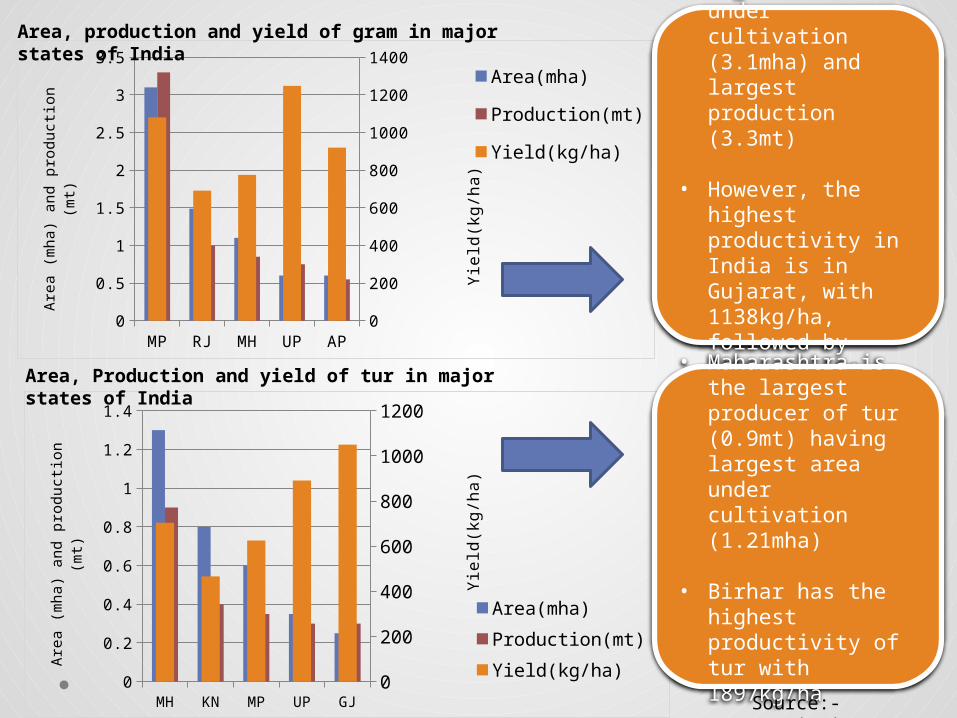
MP RJ MH UP AP0
0.5
1
1.5
2
2.5
3
3.5
0
200
400
600
800
1000
1200
1400Area(mha)
Production(mt)
Yield(kg/ha)
Are
a (m
ha)
and
prod
uctio
n (m
t)
Yie
ld(k
g/h
a)
Area, production and yield of gram in major states of India• MP has the highest
area under cultivation (3.1mha) and largest production (3.3mt)
• However, the highest productivity in India is in Gujarat, with 1138kg/ha, followed by Bihar having 1134kg/ha
MH KN MP UP GJ0
0.2
0.4
0.6
0.8
1
1.2
1.4
0
200
400
600
800
1000
1200
Area(mha)
Production(mt)
Yield(kg/ha)
Are
a (m
ha)
and
prod
uctio
n (m
t)
Yie
ld(k
g/h
a)
• Maharashtra is the largest producer of tur (0.9mt) having largest area under cultivation (1.21mha)
• Birhar has the highest productivity of tur with 1897kg/ha
Area, Production and yield of tur in major states of India
Source:- oar.icrisat.org
Trends in organization of food systems:
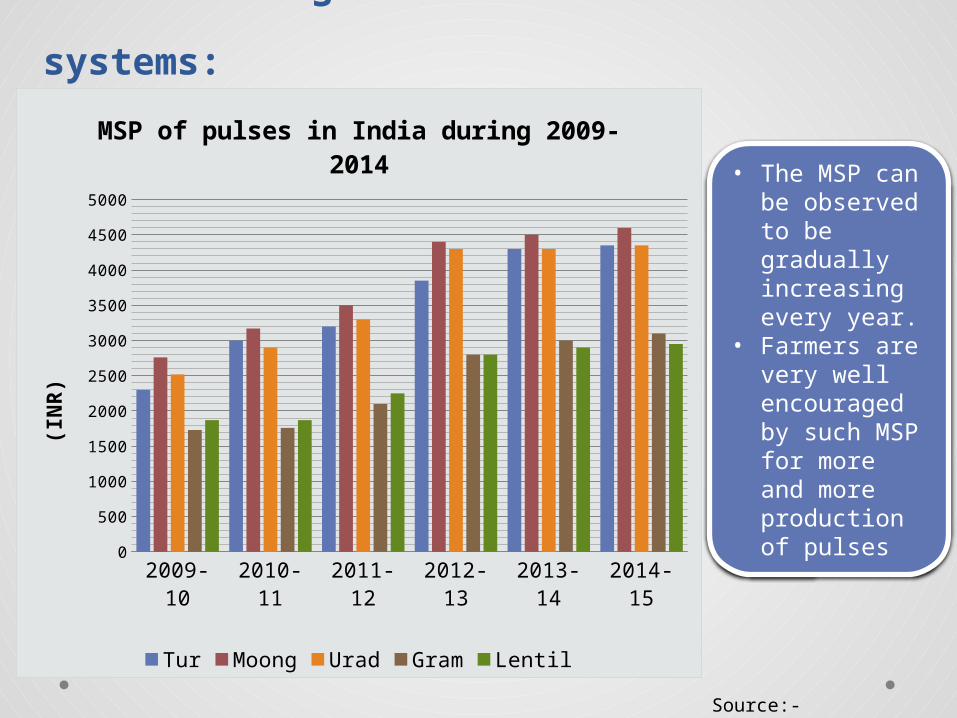
2009-10
2010-11
2011-12
2012-13
2013-14
2014-15
Tur 2300 3000 3200 3850 4300 4350
Moong
2760 3170 3500 4400 4500 4600
Urad
2520 2900 3300 4300 4300 4350
Gram
1730 1760 2100 2800 3000 3100
Lentil
1870 1870 2250 2800 2900 2950
250
1250
2250
3250
4250
MSP of pulses in India during 2009-2014
Tur Moong Urad Gram Lentil
(IN
R)
• The MSP can be observed to be gradually increasing every year.
• Farmers are very well encouraged by such MSP for more and more production of pulses
Source:- www.indiastat.com
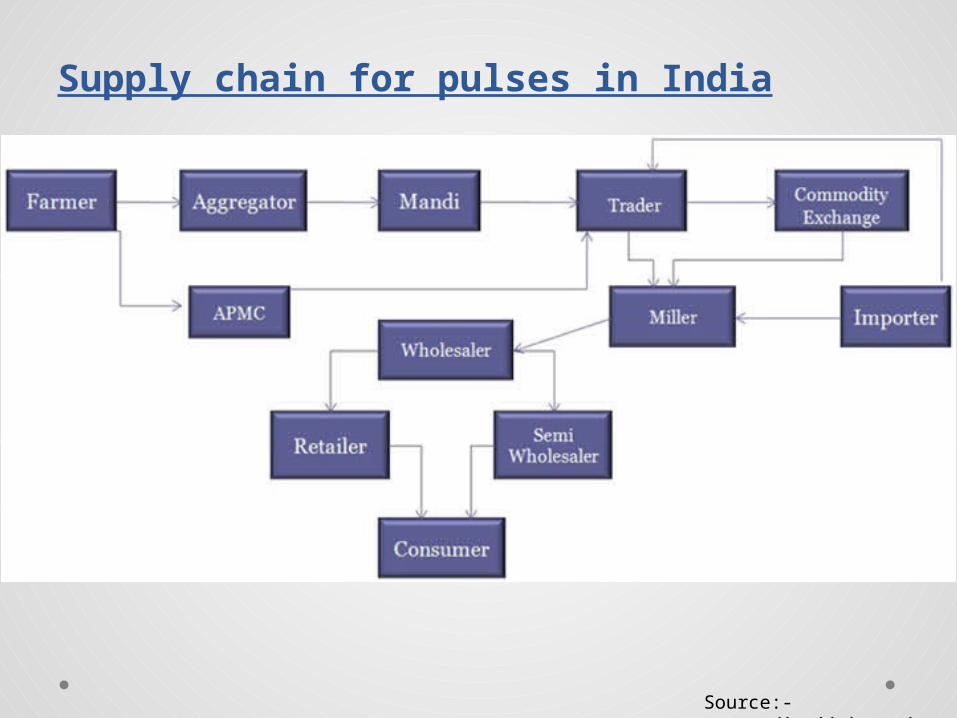
Supply chain for pulses in India
Source:-agropedia.iitk.ac.in
Schemes for pulses in India
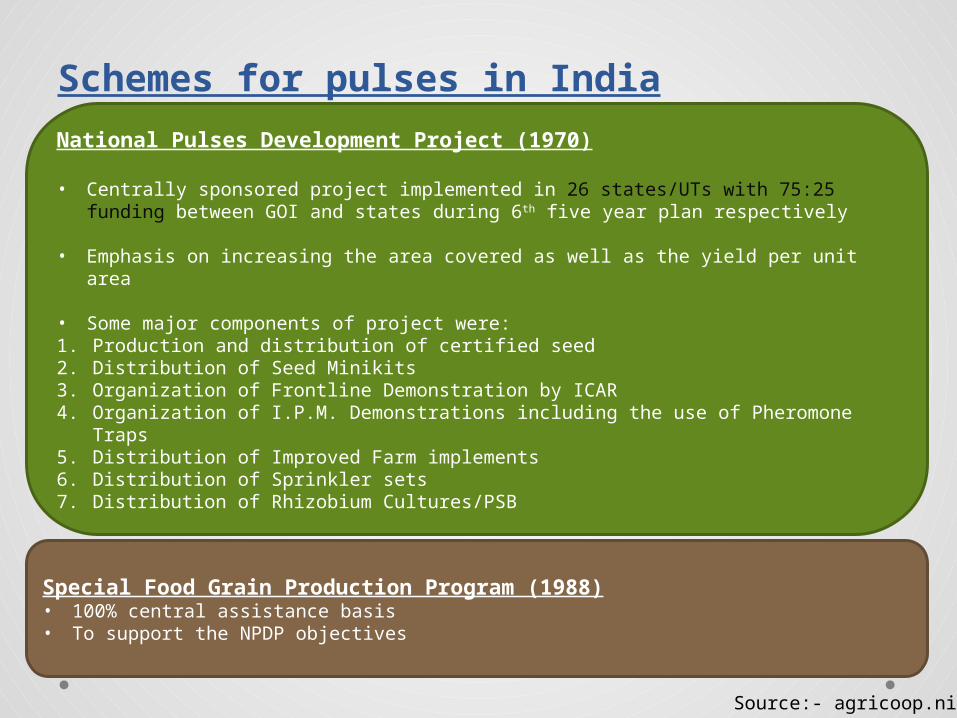
National Pulses Development Project (1970)
• Centrally sponsored project implemented in 26 states/UTs with 75:25 funding between GOI and states during 6th five year plan respectively
• Emphasis on increasing the area covered as well as the yield per unit area
• Some major components of project were:1. Production and distribution of certified seed2. Distribution of Seed Minikits3. Organization of Frontline Demonstration by ICAR4. Organization of I.P.M. Demonstrations including the use of Pheromone Traps5. Distribution of Improved Farm implements6. Distribution of Sprinkler sets7. Distribution of Rhizobium Cultures/PSB
Special Food Grain Production Program (1988)• 100% central assistance basis• To support the NPDP objectives
Source:- agricoop.nic.in
Schemes cont..
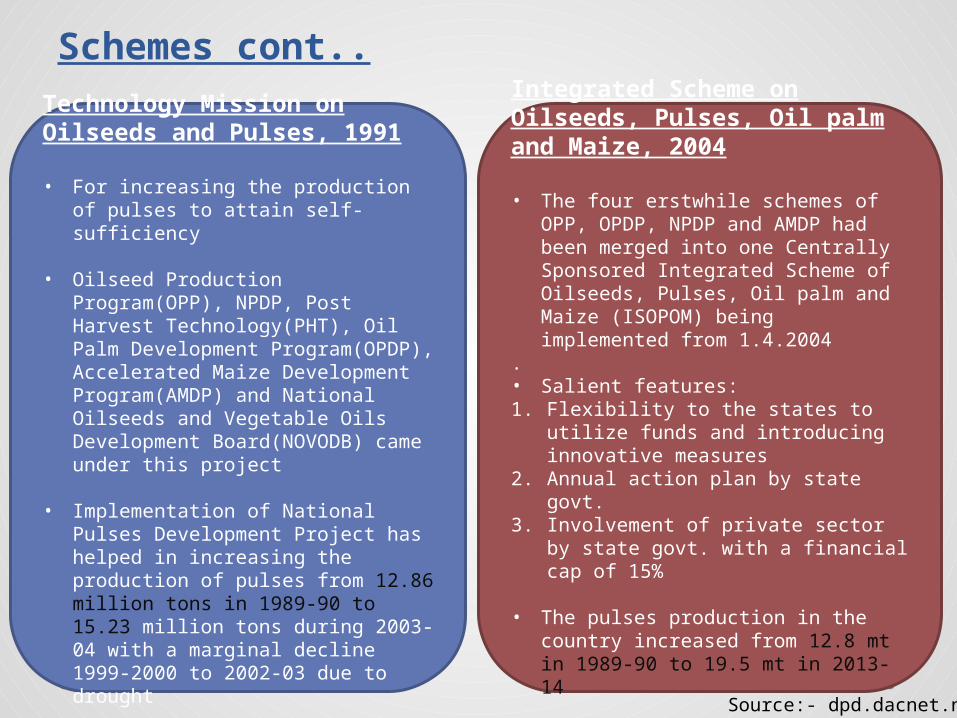
Technology Mission on Oilseeds and Pulses, 1991
• For increasing the production of pulses to attain self-sufficiency
• Oilseed Production Program(OPP),
NPDP, Post Harvest Technology(PHT), Oil Palm Development Program(OPDP), Accelerated Maize Development Program(AMDP) and National Oilseeds and Vegetable Oils Development Board(NOVODB) came under this project
• Implementation of National Pulses Development Project has helped in increasing the production of pulses from 12.86 million tons in 1989-90 to 15.23 million tons during 2003-04 with a marginal decline 1999-2000 to 2002-03 due to drought
Integrated Scheme on Oilseeds, Pulses, Oil palm and Maize, 2004
• The four erstwhile schemes of OPP, OPDP, NPDP and AMDP had been merged into one Centrally Sponsored Integrated Scheme of Oilseeds, Pulses, Oil palm and Maize (ISOPOM) being implemented from 1.4.2004
.• Salient features:1. Flexibility to the states to utilize funds and
introducing innovative measures2. Annual action plan by state govt.3. Involvement of private sector by state
govt. with a financial cap of 15%
• The pulses production in the country increased from 12.8 mt in 1989-90 to 19.5 mt in 2013-14
Source:- dpd.dacnet.nic.in
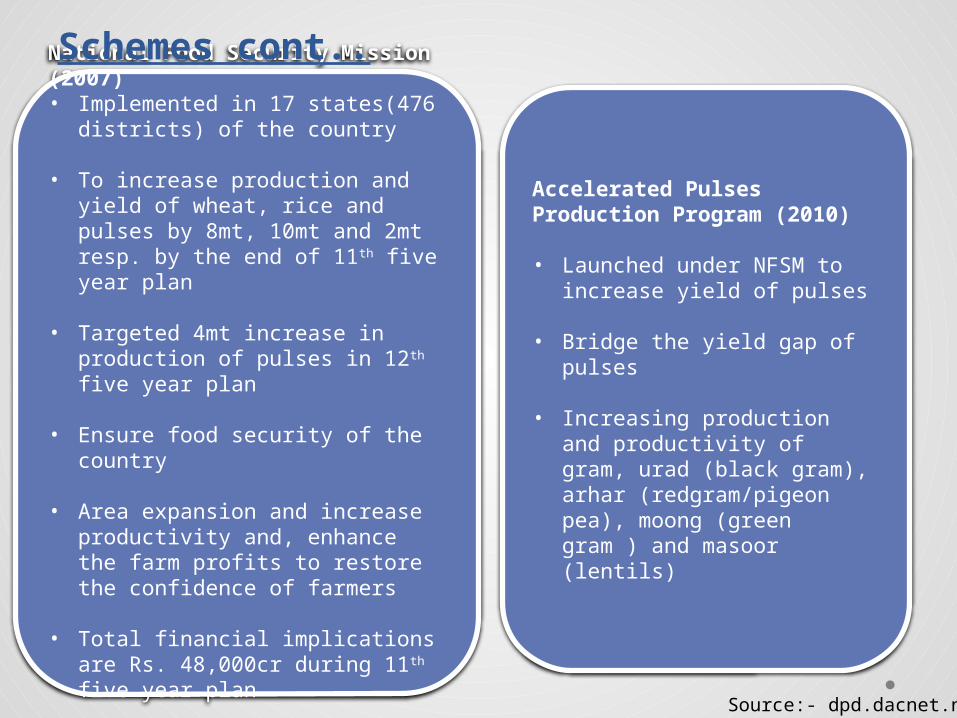
National Food Security Mission (2007)• Implemented in 17 states(476 districts)
of the country
• To increase production and yield of wheat, rice and pulses by 8mt, 10mt and 2mt resp. by the end of 11th five year plan
• Targeted 4mt increase in production of pulses in 12th five year plan
• Ensure food security of the country
• Area expansion and increase productivity and, enhance the farm profits to restore the confidence of farmers
• Total financial implications are Rs. 48,000cr during 11th five year plan
Accelerated Pulses Production Program (2010)
• Launched under NFSM to increase yield of pulses
• Bridge the yield gap of pulses
• Increasing production and productivity of gram, urad (black gram), arhar (redgram/pigeon pea), moong (green gram ) and masoor (lentils)
Schemes cont..
Source:- dpd.dacnet.nic.in
REFERENCES
• www.ipga.• www.indiastat.nic.in• dpd.dacnet.nic.in• oar.icrisat.org• agricoop.nic.in• agropedia.iitk.ac.in• agriexchange.apeda.gov.in

THANK YOU
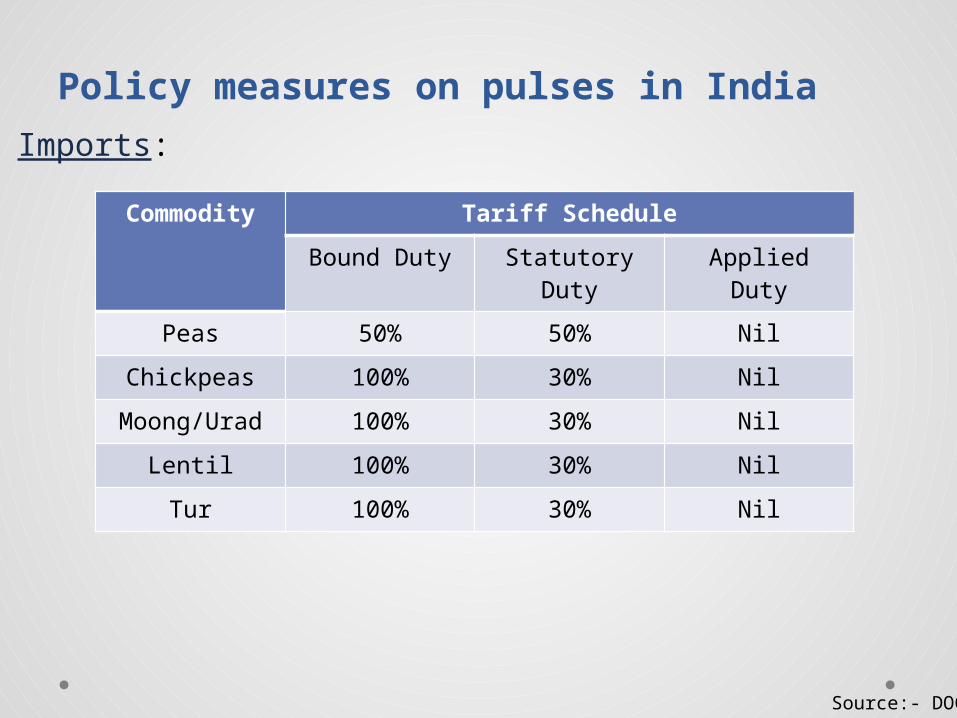
Policy measures on pulses in India
Imports:
Commodity Tariff Schedule
Bound Duty Statutory Duty Applied Duty
Peas 50% 50% Nil
Chickpeas 100% 30% Nil
Moong/Urad 100% 30% Nil
Lentil 100% 30% Nil
Tur 100% 30% Nil
Source:- DOC