Embed Size (px)
Citation preview
ADAP-GC: Deconvolution of Co-Eluting Metabolites from GC/TOF-MS
Data for Metabolomics Studies
Xiuxia Du
Department of Bioinformatics and Genomics University of North Carolina at Charlotte
Outline
• Background
• Why is deconvolution necessary?
• How is deconvolution done in ADAP-GC?
• ADAP-GC software
• Next step
2
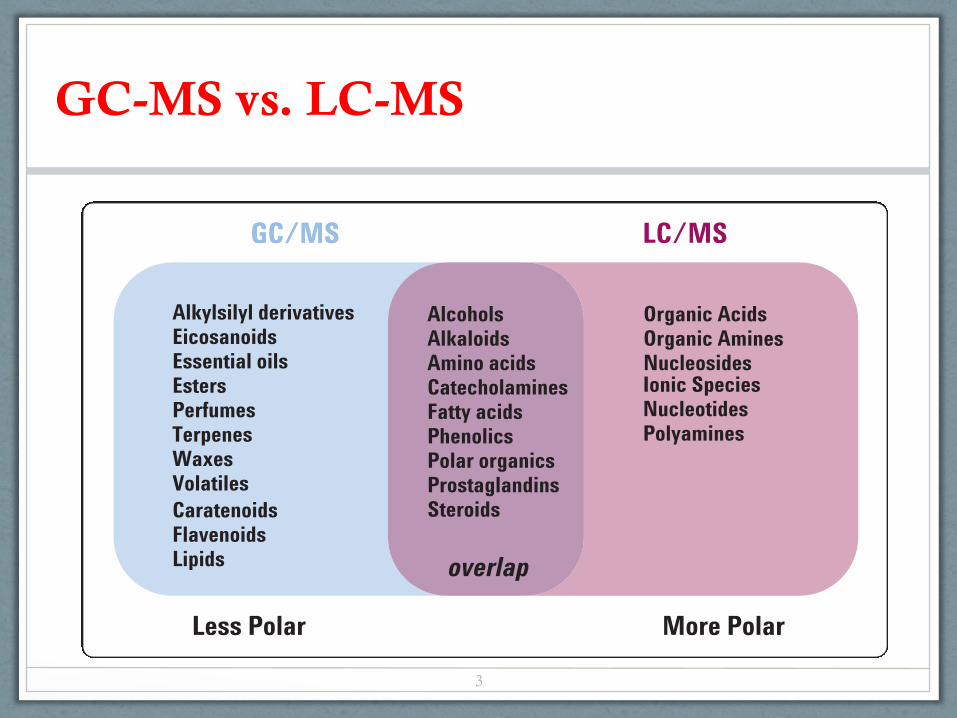
GC-MS vs. LC-MS M E T A B O L O M I C SO N C H N S C O H P C N S H C O
2
Selection Guide
Alkylsilyl derivativesEicosanoidsEssential oilsEstersPerfumesTerpenesWaxesVolatilesCaratenoidsFlavenoidsLipids
AlcoholsAlkaloidsAmino acidsCatecholaminesFatty acidsPhenolicsPolar organics ProstaglandinsSteroids
Organic AcidsOrganic AminesNucleosidesIonic SpeciesNucleotidesPolyamines
Less Polar More Polar
GC/MSGC/MS LC/MS
overlap
Figure 1. Classes of chemicals and the analytical techniques with which they aremost compatible.
A simple identification method uses onlythe background-subtracted EI spectraand a search of a general-purpose EIlibrary such as the NIST library. A morepowerful identification method involvessearching both chromatographicretention time and mass spectra of ananalyte against an application-specificlibrary containing expected retentiontimes and EI spectra for compounds.Currently, there are no publicly availableEI libraries devoted exclusively toendogenous metabolites.
With EI, the molecular ion is often lost.If the metabolite spectrum is not in thelibrary being searched, the absence ofmass information for the molecular ionmakes it difficult to limit the number ofchemical possibilities. Complementarychemical ionization (CI) can be used topreserve the molecular ion, but it comeswith the loss of the structural informationthat EI fragmentation provides. Therefore,GC/MS is best suited for targetingknown or anticipated metabolites.
The cost of GC/MS systems issubstantially less than that of LC/MSsystems.
LC/MS analysis
Liquid chromatography can separatemetabolites that are not volatile andhave not been derivatized. As a result,LC/MS can analyze a much wider rangeof chemical species than GC/MS.Samples commonly analyzed by LC/MSinclude amino acids (18 out of 20 aminoacids can be derivatized, but theremaining two can not) and sugarslarger than trimers.
Electrospray ionization (ESI) andatmospheric pressure chemicalionization (APCI) are the two ionizationtechniques most commonly used inLC/MS. Unlike EI for GC/MS, ionsuppression can occur with both ESI andAPCI so co-eluting compounds may beunderestimated or not detected at all.Therefore, for complex samples, greaterseparation is necessary for the reliableLC/MS results. Unlike GC/MS, LC/MSalmost always produces a molecular ionthat can be used to limit the possibleidentities of a given analyte.
There are no spectral libraries forLC/MS identification. However, becausethe molecular ion is usually present inLC/MS analyses, it's mass can be usedto search a database of metabolitessuch as the METLIN database. Inaddition, the development of accurate-mass time-of-flight mass spectrometershas enabled the calculation of anempirical formula from the molecularion. To truly address unknownmetabolites, MS/MS fragmentation on a Q-TOF with manual de novointerpretation is the next step in theidentification process.
LC/MS is best suited for a discovery-based approach when researchingunknown metabolites, or when many ofthe targeted metabolites are not readilyamenable to GC/MS analysis due tovolatility issues.
The cost of an LC/MS system issubstantially more than that of a GC/MS system.
3
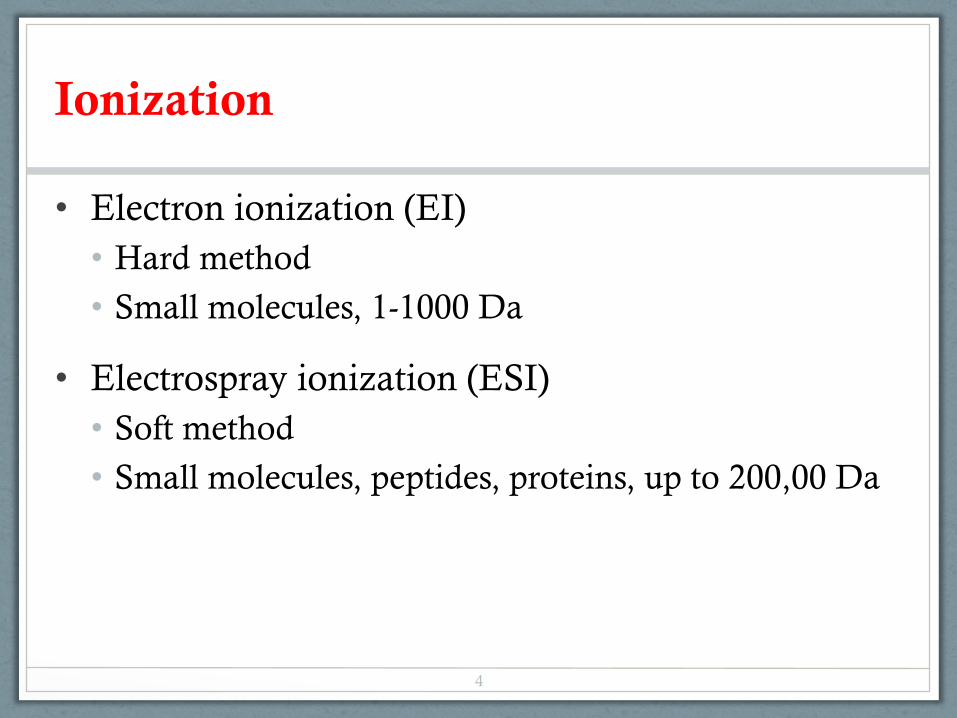
Ionization
• Electron ionization (EI) • Hard method
• Small molecules, 1-1000 Da
• Electrospray ionization (ESI) • Soft method
• Small molecules, peptides, proteins, up to 200,00 Da
4
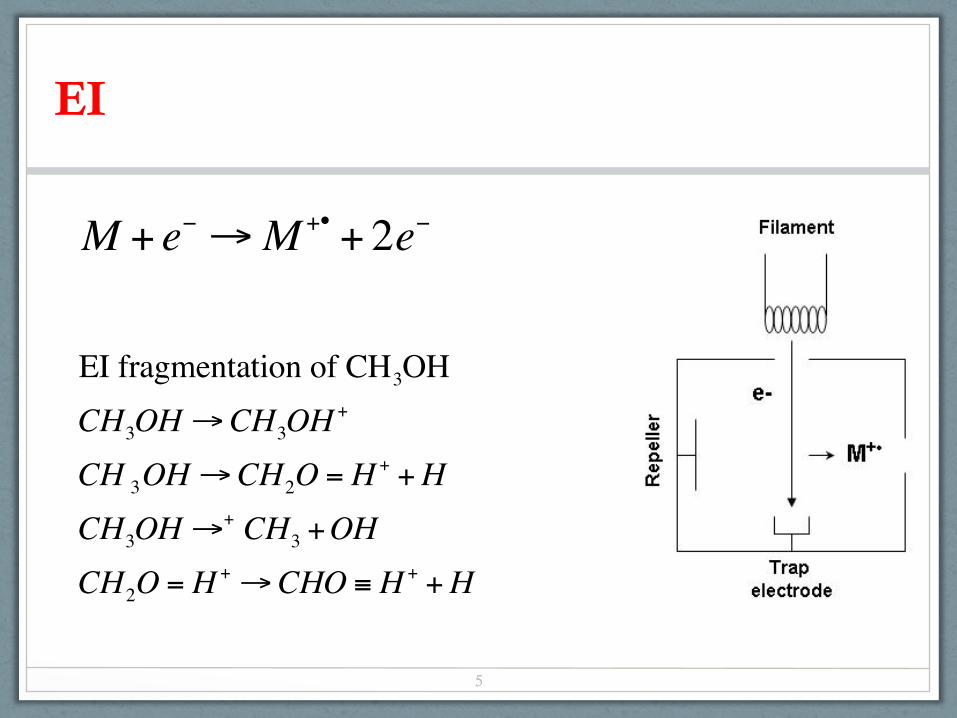
EI
M + e− →M +• + 2e−
EI fragmentation of CH3OHCH3OH→CH3OH
+
CH 3OH→CH2O = H + +HCH3OH→+ CH3 +OHCH2O = H + →CHO ≡ H + +H
5
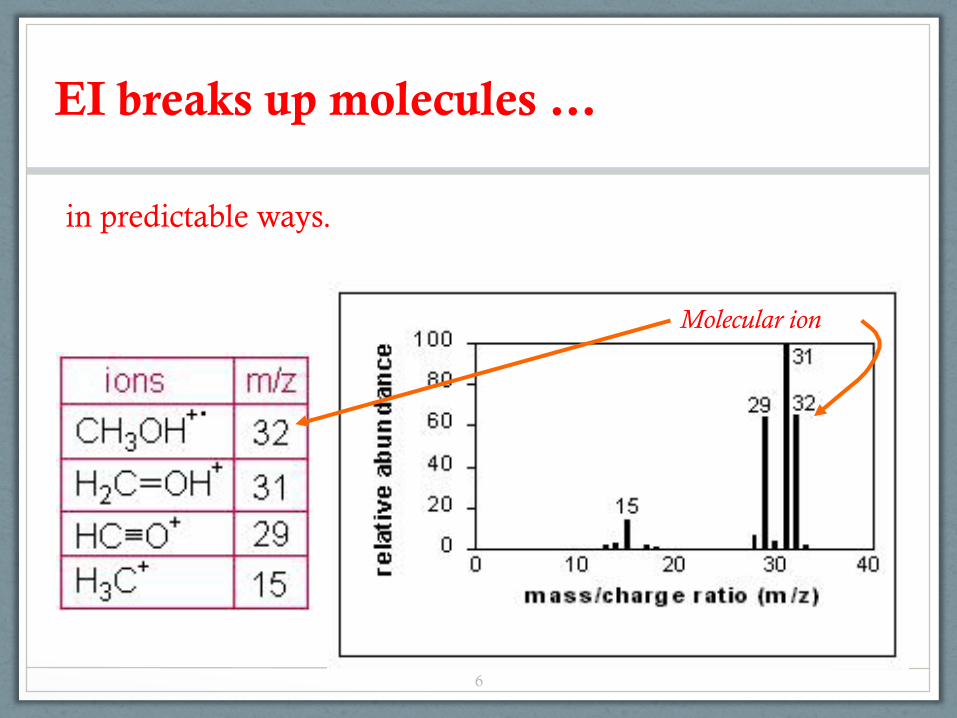
EI breaks up molecules …
Molecular ion
in predictable ways.
6
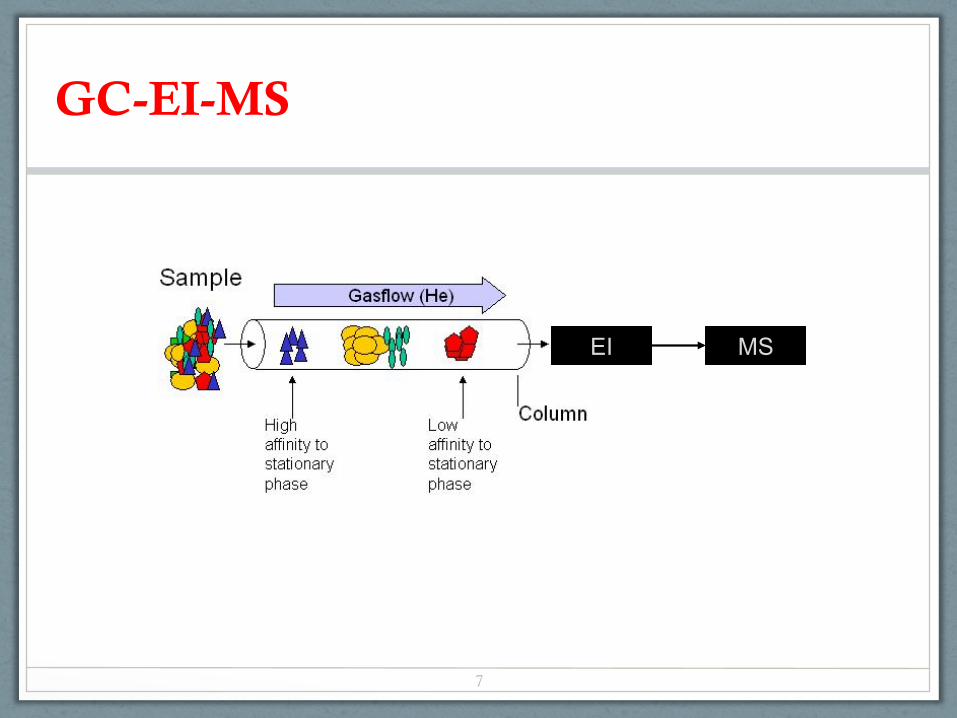
GC-EI-MS
EI MS
7
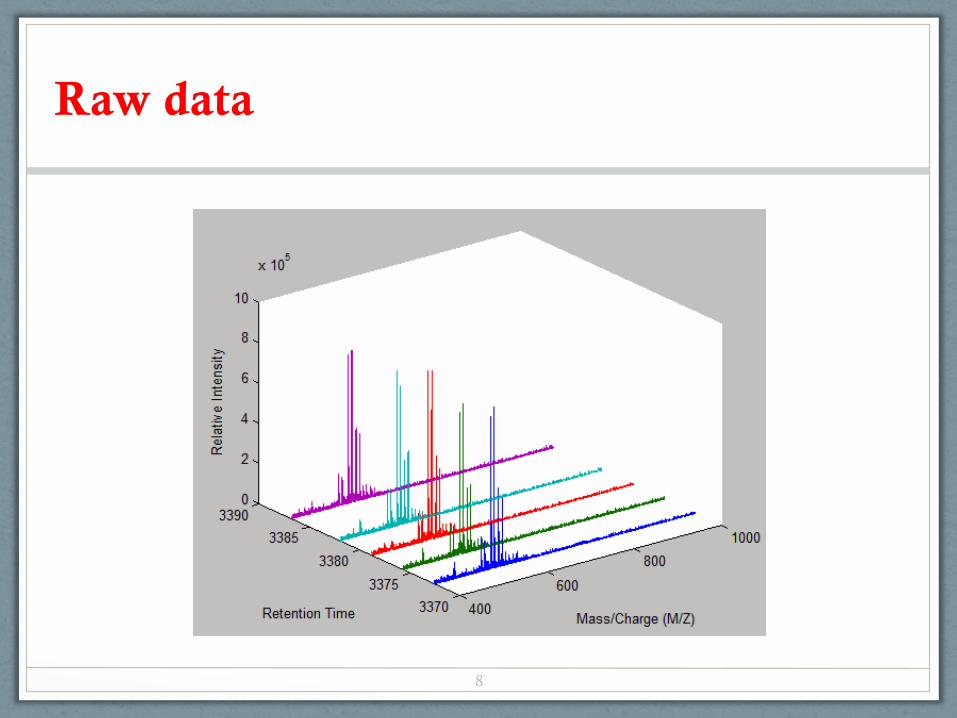
Raw data
8
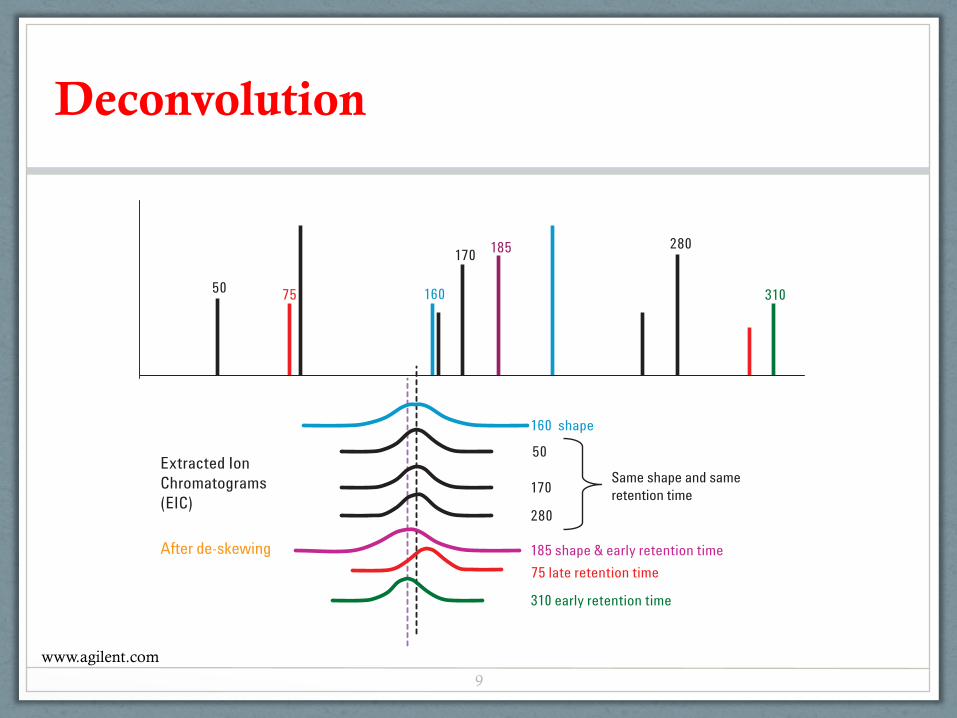
Deconvolution
3
As a review, let's look at the deconvolution process. AMDISconsiders the peak shapes of all extracted ions and their apexretention times (RT). In this example, only some of theextracted ion chromatograms (EICs) are overlaid for claritywith the apex spectrum (Figure 1A).
Figure 1A-1C. Simplified deconvolution process (continued).
Figure 1A
50
170280
31075
185
160
Extracted IonChromatograms(EIC)
After de-skewing
50
170
280
75 late retention time
185 shape & early retention time
310 early retention time
160 shape
Same shape and sameretention time
50
170280
31075
185
160
Extracted IonChromatograms(EIC)
Figure 1B
50
170
280
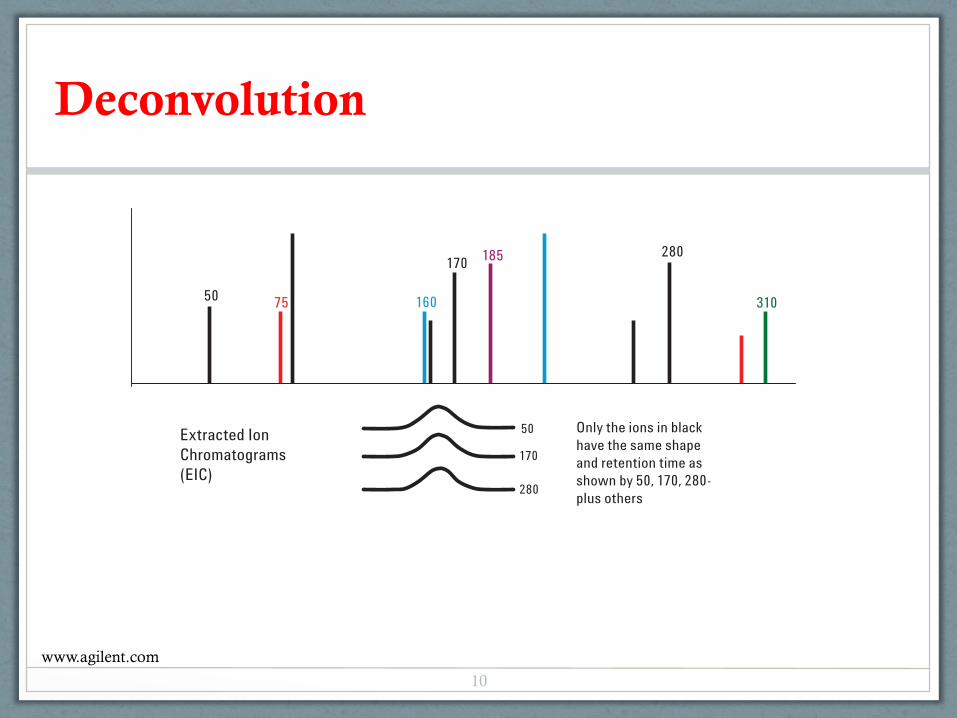
Only the ions in blackhave the same shapeand retention time asshown by 50, 170, 280-plus others
Figure 1B shows the EICs after the different peak shapes or RTs are eliminated from Figure 1A. Ions 50, 170, 280 and a few others remain.
Ion 160 EIC has the same RT as ions 50, 170 and 280, but hasa different peak shape. Ion 185 has a different peak shape andan earlier RT. Ions 75 and 310 have similar peak shapes butthey have different RTs.
www.agilent.com
9
Deconvolution
3
As a review, let's look at the deconvolution process. AMDISconsiders the peak shapes of all extracted ions and their apexretention times (RT). In this example, only some of theextracted ion chromatograms (EICs) are overlaid for claritywith the apex spectrum (Figure 1A).
Figure 1A-1C. Simplified deconvolution process (continued).
Figure 1A
50
170280
31075
185
160
Extracted IonChromatograms(EIC)
After de-skewing
50
170
280
75 late retention time
185 shape & early retention time
310 early retention time
160 shape
Same shape and sameretention time
50
170280
31075
185
160
Extracted IonChromatograms(EIC)
Figure 1B
50
170
280
Only the ions in blackhave the same shapeand retention time asshown by 50, 170, 280-plus others
Figure 1B shows the EICs after the different peak shapes or RTs are eliminated from Figure 1A. Ions 50, 170, 280 and a few others remain.
Ion 160 EIC has the same RT as ions 50, 170 and 280, but hasa different peak shape. Ion 185 has a different peak shape andan earlier RT. Ions 75 and 310 have similar peak shapes butthey have different RTs.
www.agilent.com
10
Deconvolution
4
Deconvolution finds the components from a complex TIC.Each component is searched against a retention time locking(RTL) library in AMDIS format. In addition to spectral match-ing, the locked RT can also be used as a criterion for hits.Depending on the match factor from the search, target com-pounds can be identified or flagged in a complex TIC. Thepower of deconvolution is appreciated while comparing thetop two spectra in Figure 2. The raw scan or original nonde-convoluted scan is shown on top. The clean scan, that is the
deconvoluted component, is shown in the middle. The bottomscan is the identified compound in the AMDIS library.Without deconvolution, the analyst would visually comparethe background subtracted raw scan and library scans forconfirmation. It would be very difficult, if not impossible, tosay that Fenbuconazole, the target compound in this example,is present using that type of comparison.
50
170280
Extracted IonChromatograms(EIC)
Figure 1C
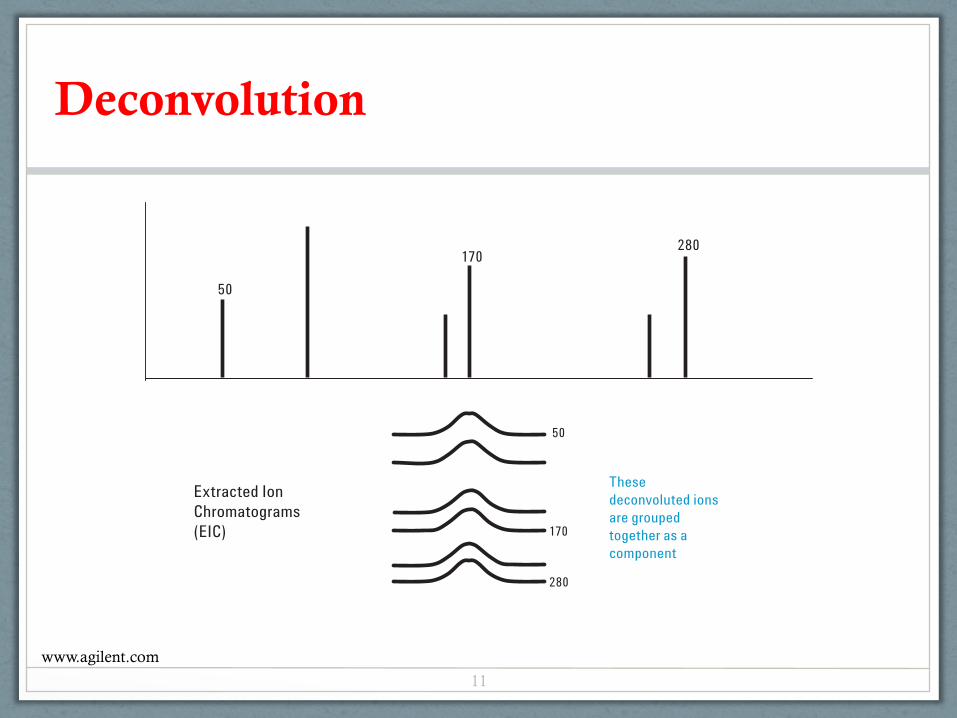
Thesedeconvoluted ions are groupedtogether as a component
50
170
280
Figure 1C shows all of the ions in black that have similar peak shapes and RTs, within the criteria set earlier by the analyst. These aregrouped together and referred to as a component by AMDIS.
Figure 1A-1C. Simplified deconvolution process (continued). www.agilent.com
11
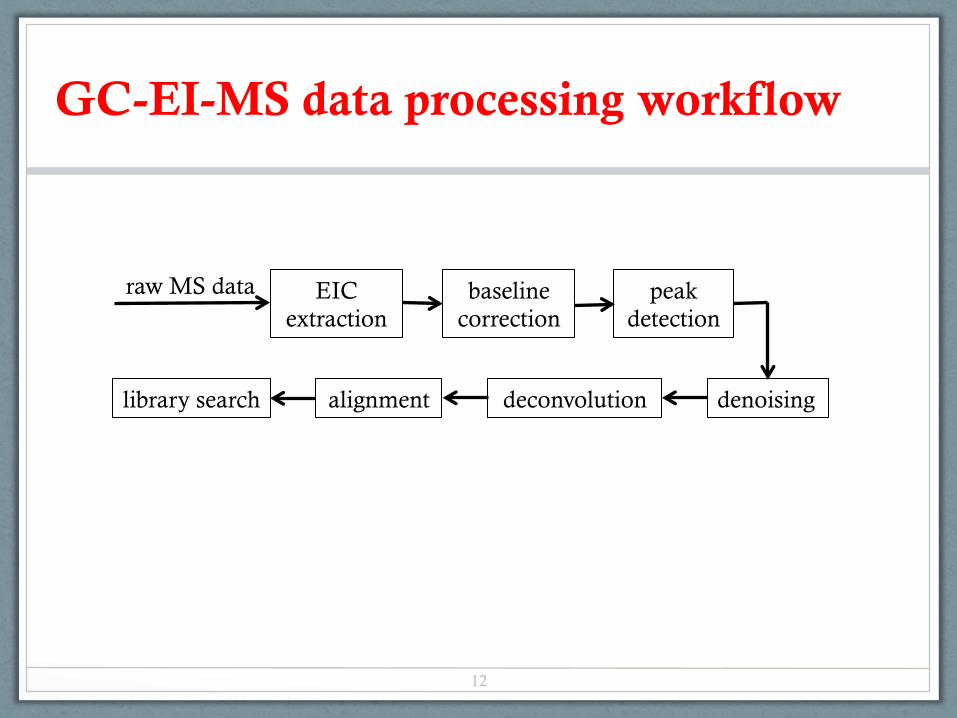
GC-EI-MS data processing workflow
peak detection
deconvolution alignment denoising
baseline correction
library search
EIC extraction
raw MS data
12
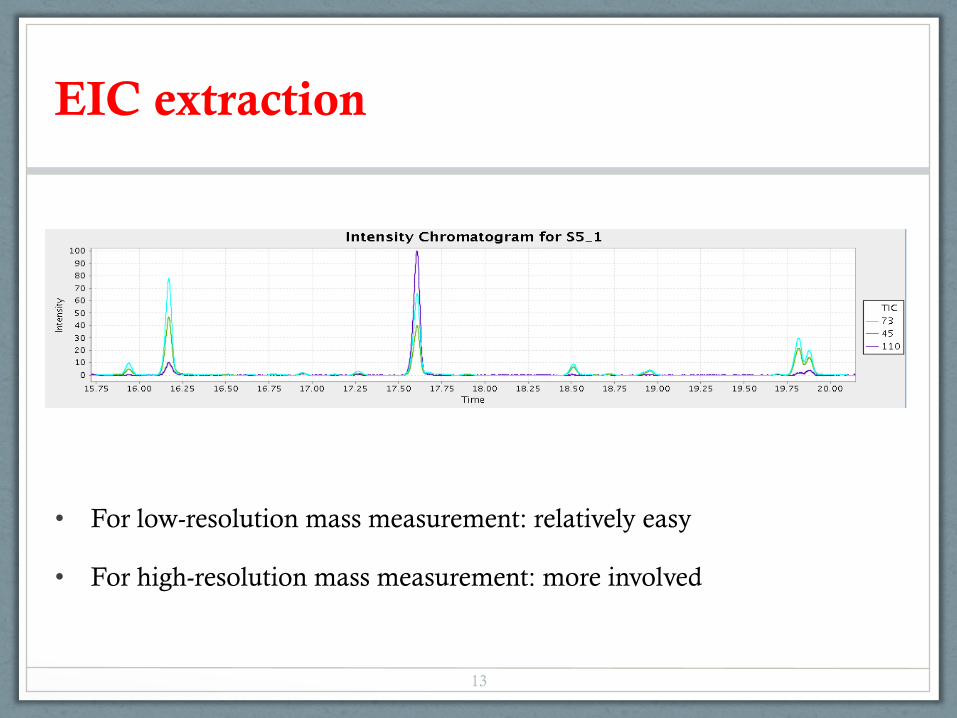
• For low-resolution mass measurement: relatively easy
• For high-resolution mass measurement: more involved
EIC extraction
13
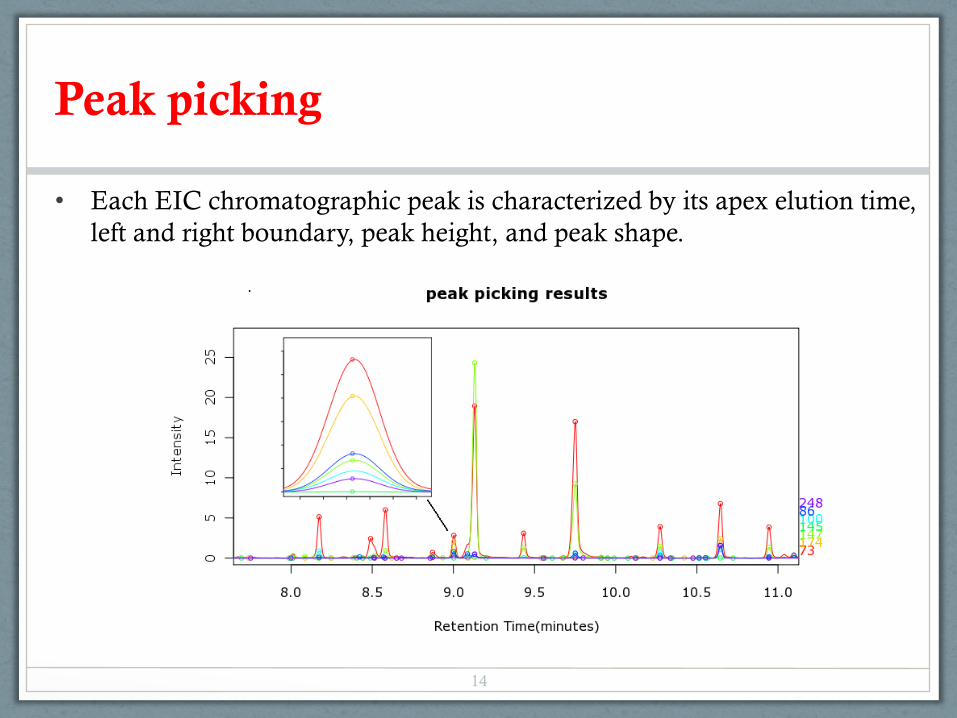
Peak picking
• Each EIC chromatographic peak is characterized by its apex elution time, left and right boundary, peak height, and peak shape.
!14
Background ADAP-GC ADAP-LC ADAP-Stats ADAP-CAGT
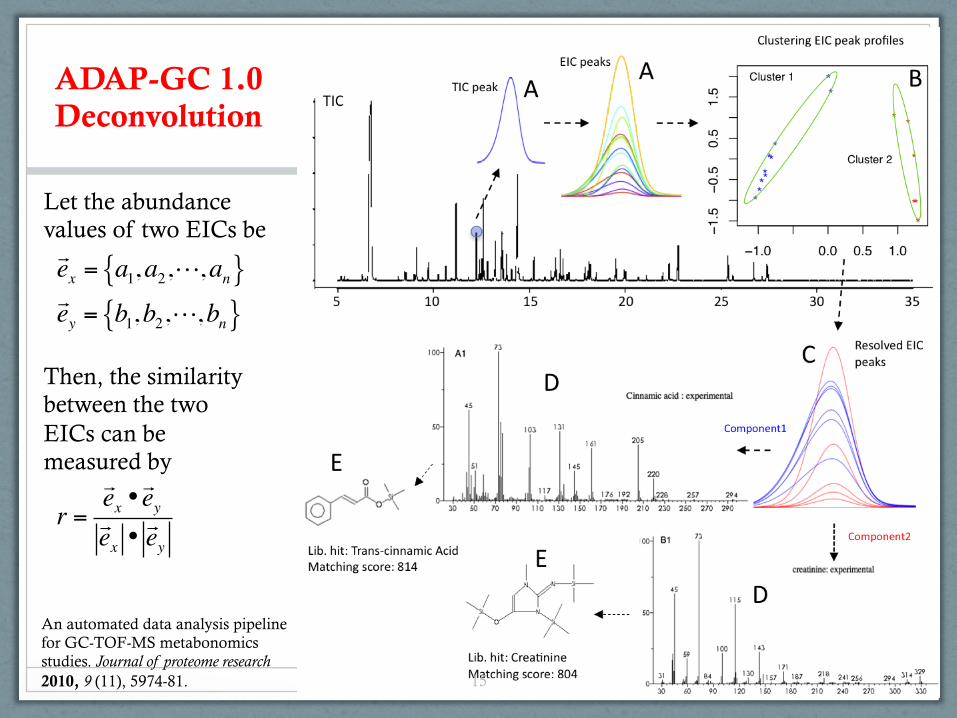
An automated data analysis pipeline for GC-TOF-MS metabonomics studies. Journal of proteome research 2010, 9 (11), 5974-81. !
ADAP-GC 1.0 Deconvolution
ex = a1,a2,,an{ }ey = b1,b2,,bn{ }
Let the abundance values of two EICs be
Then, the similarity between the two EICs can be measured by
r =ex •ey
ex •ey
15
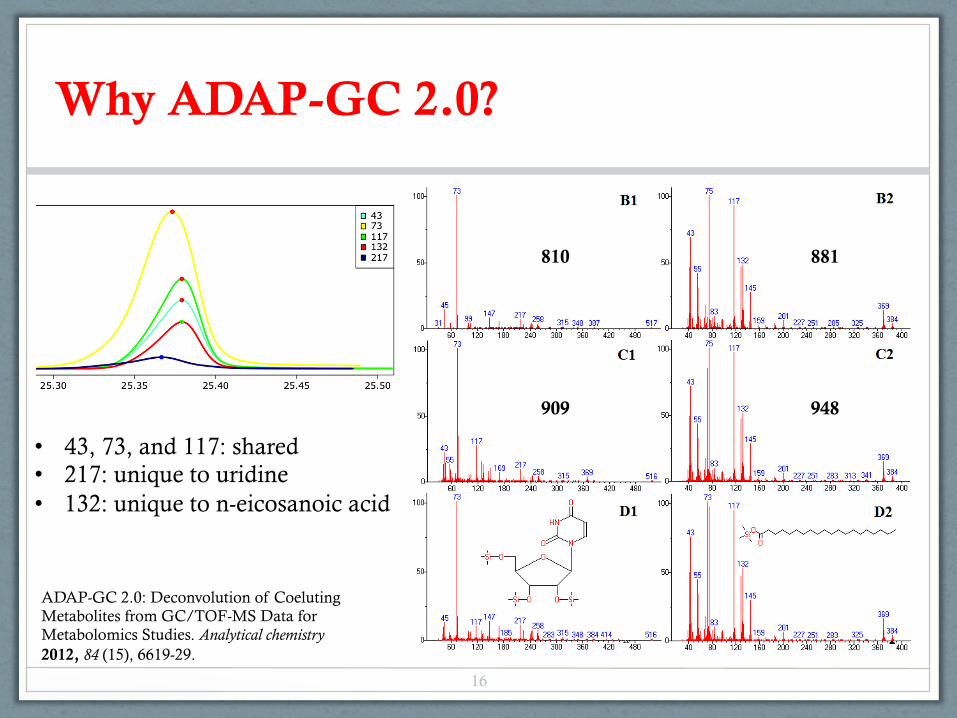
Why ADAP-GC 2.0?
ADAP-GC 2.0: Deconvolution of Coeluting Metabolites from GC/TOF-MS Data for Metabolomics Studies. Analytical chemistry 2012, 84 (15), 6619-29.
• 43, 73, and 117: shared • 217: unique to uridine • 132: unique to n-eicosanoic acid
810 881
909 948
16
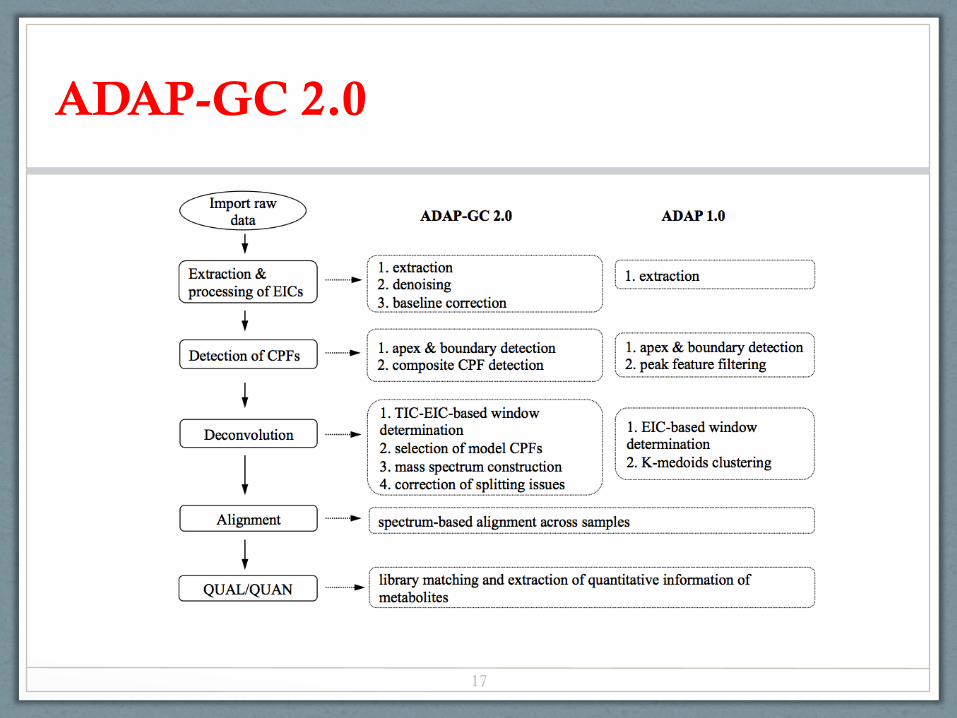
ADAP-GC 2.0
17
ADAP-GC 2.0
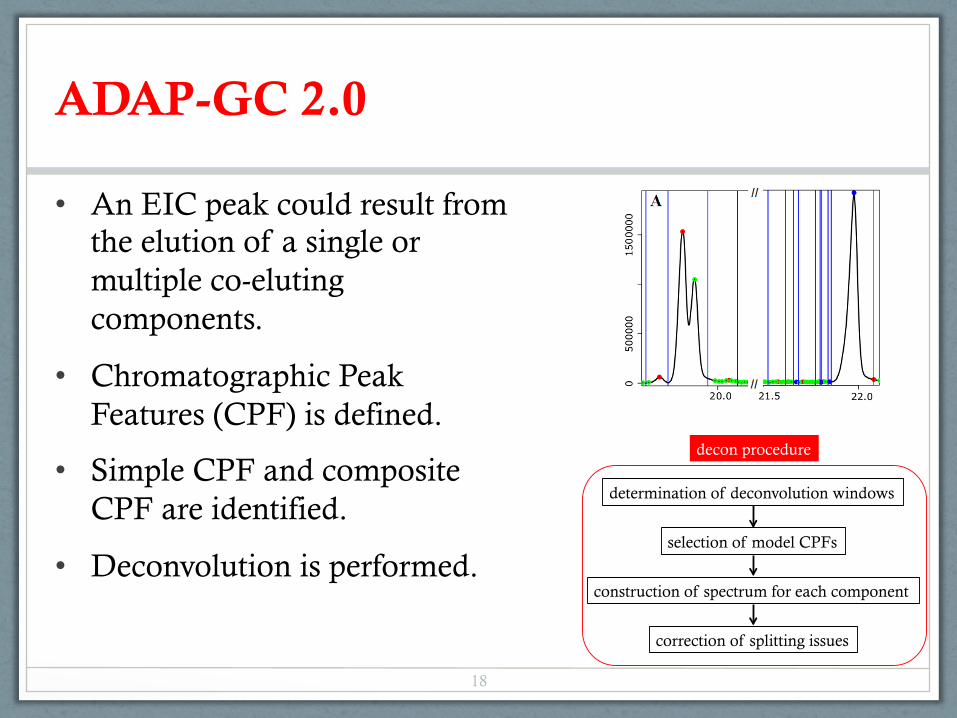
• An EIC peak could result from the elution of a single or multiple co-eluting components.
• Chromatographic Peak Features (CPF) is defined.
• Simple CPF and composite CPF are identified.
• Deconvolution is performed.
determination of deconvolution windows
selection of model CPFs
construction of spectrum for each component
correction of splitting issues
decon procedure
18
Selection of Model CPFs
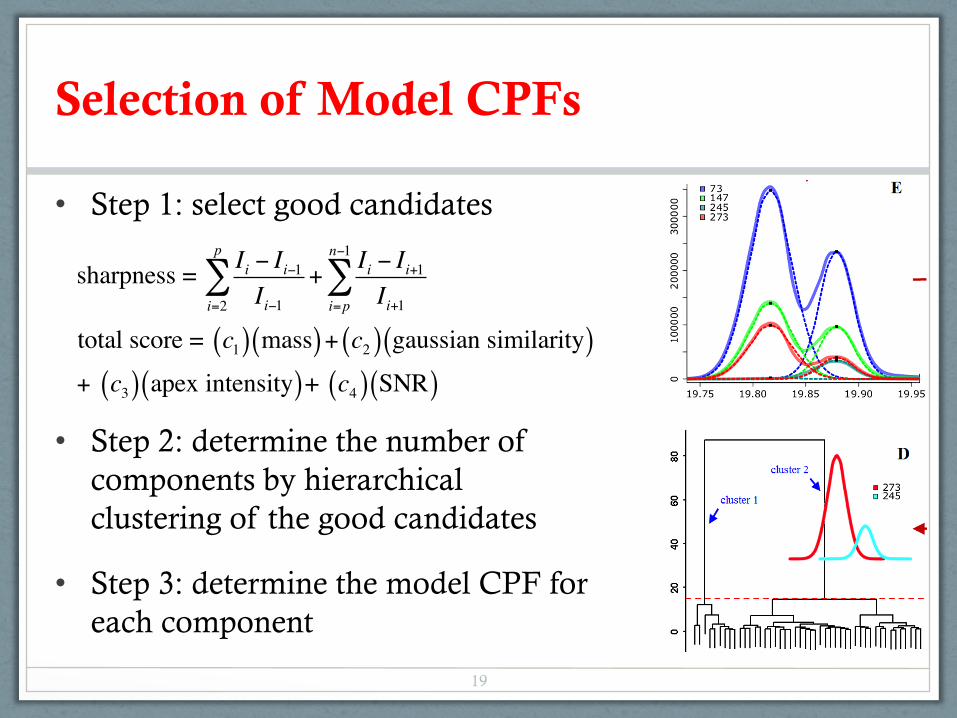
• Step 1: select good candidates
• Step 2: determine the number of components by hierarchical clustering of the good candidates
• Step 3: determine the model CPF for each component
sharpness = Ii − Ii−1
Ii−1i=2
p
∑ +Ii − Ii+1
Ii+1i=p
n−1
∑
total score = c1( ) mass( )+ c2( ) gaussian similarity( )+ c3( ) apex intensity( )+ c4( ) SNR( )
19
Construction of Spectrum
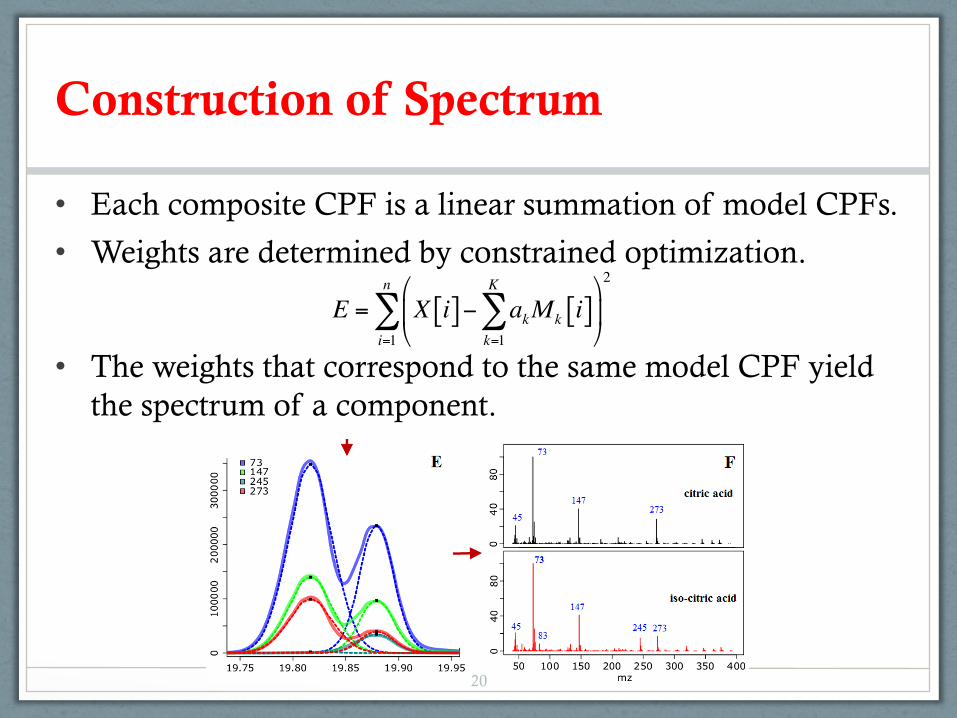
• Each composite CPF is a linear summation of model CPFs.
• Weights are determined by constrained optimization.
• The weights that correspond to the same model CPF yield the spectrum of a component.
E = X i[ ]− akMk i[ ]k=1
K
∑#
$%
&
'(
i=1
n
∑2
20
ADAP-GC 2.0 Deconvolution
Background ADAP-GC ADAP-LC ADAP-Stats ADAP-CAGT
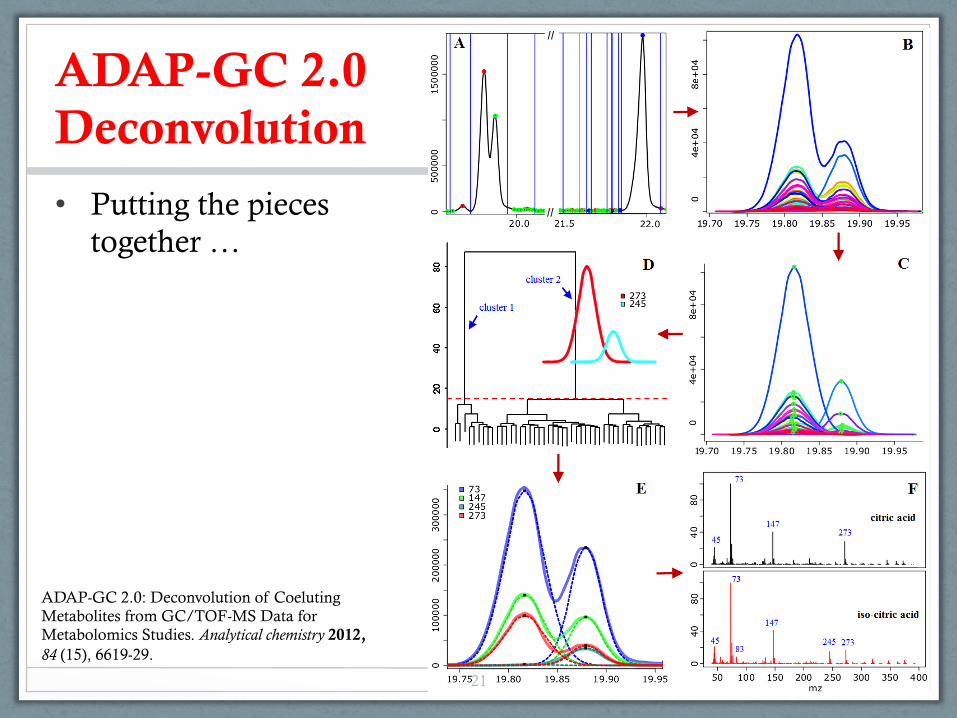
• Putting the pieces together …
ADAP-GC 2.0: Deconvolution of Coeluting Metabolites from GC/TOF-MS Data for Metabolomics Studies. Analytical chemistry 2012, 84 (15), 6619-29.
21
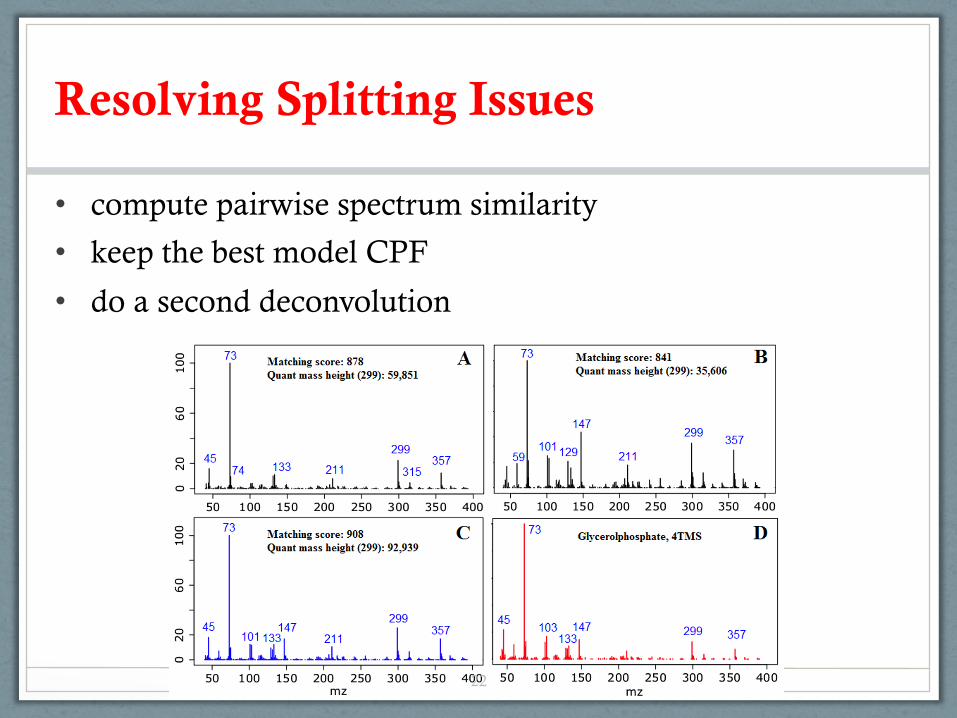
• compute pairwise spectrum similarity
• keep the best model CPF
• do a second deconvolution
Resolving Splitting Issues
22
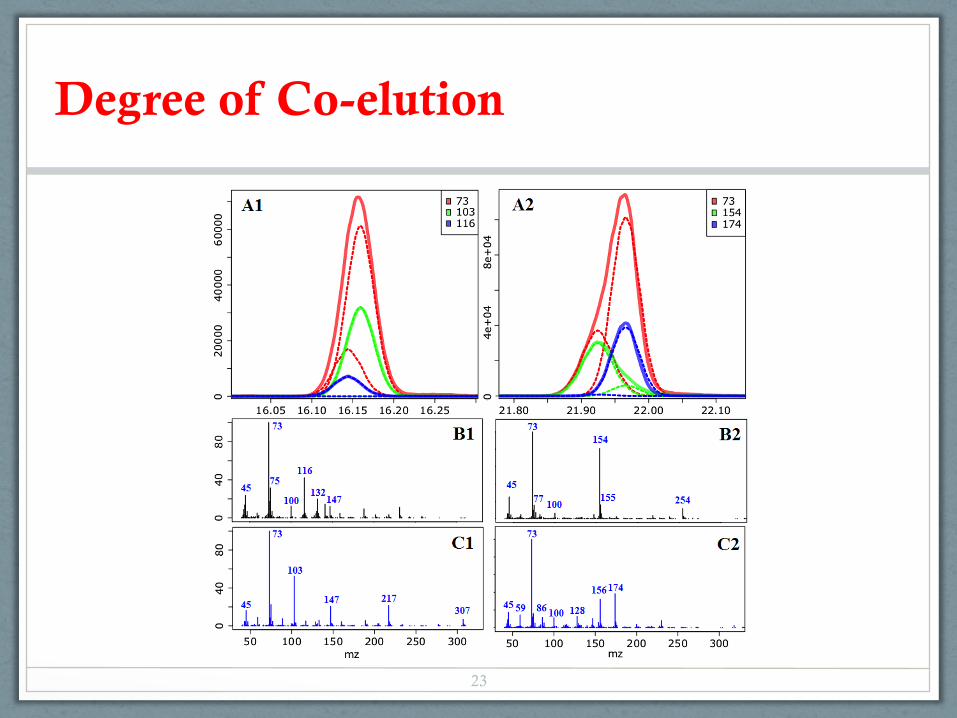
Degree of Co-elution
23
Alignment
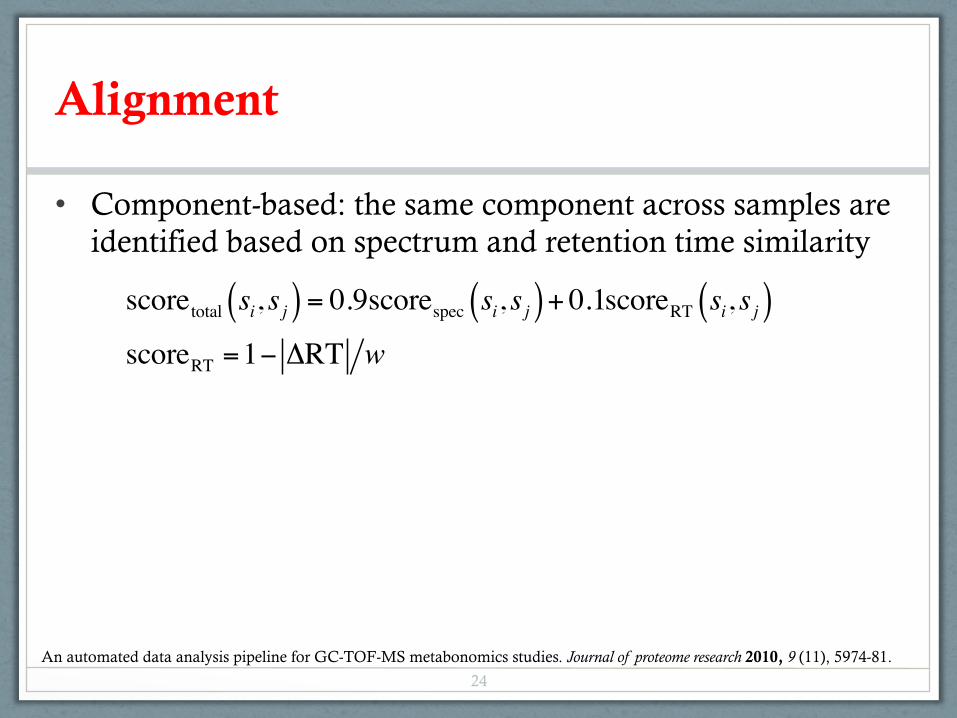
• Component-based: the same component across samples are identified based on spectrum and retention time similarity
scoretotal si, sj( ) = 0.9scorespec si, sj( )+ 0.1scoreRT si, sj( )scoreRT =1− ΔRT w
An automated data analysis pipeline for GC-TOF-MS metabonomics studies. Journal of proteome research 2010, 9 (11), 5974-81.
24
Alignment
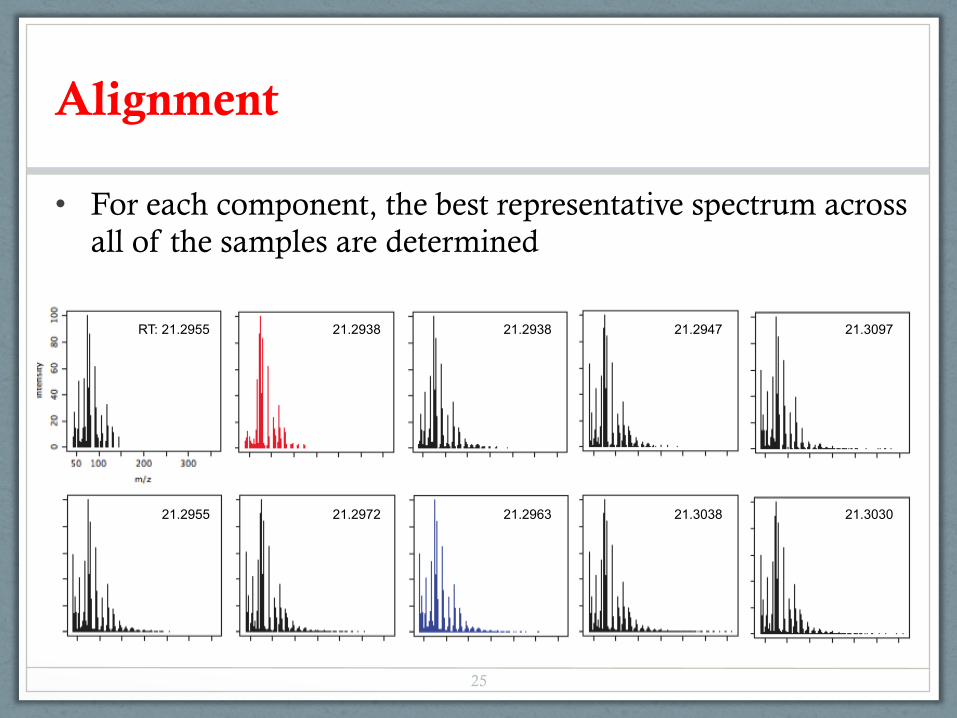
• For each component, the best representative spectrum across all of the samples are determined
RT: 21.2955 21.2938 21.2938 21.2947 21.3097
21.2955 21.2972 21.2963 21.3038 21.3030
25
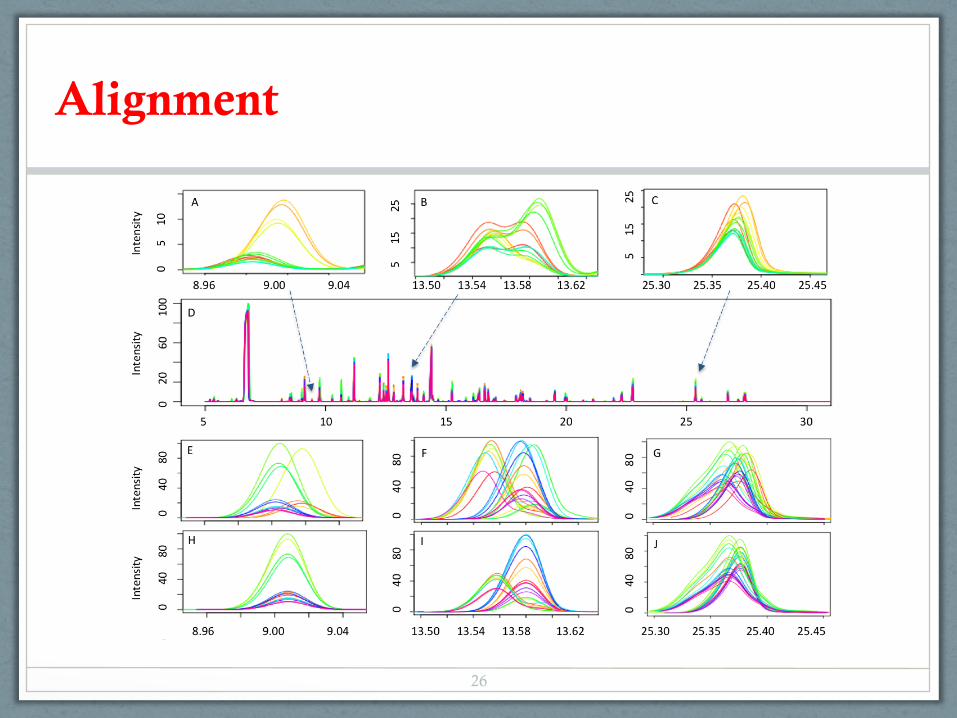
Alignment
!
26
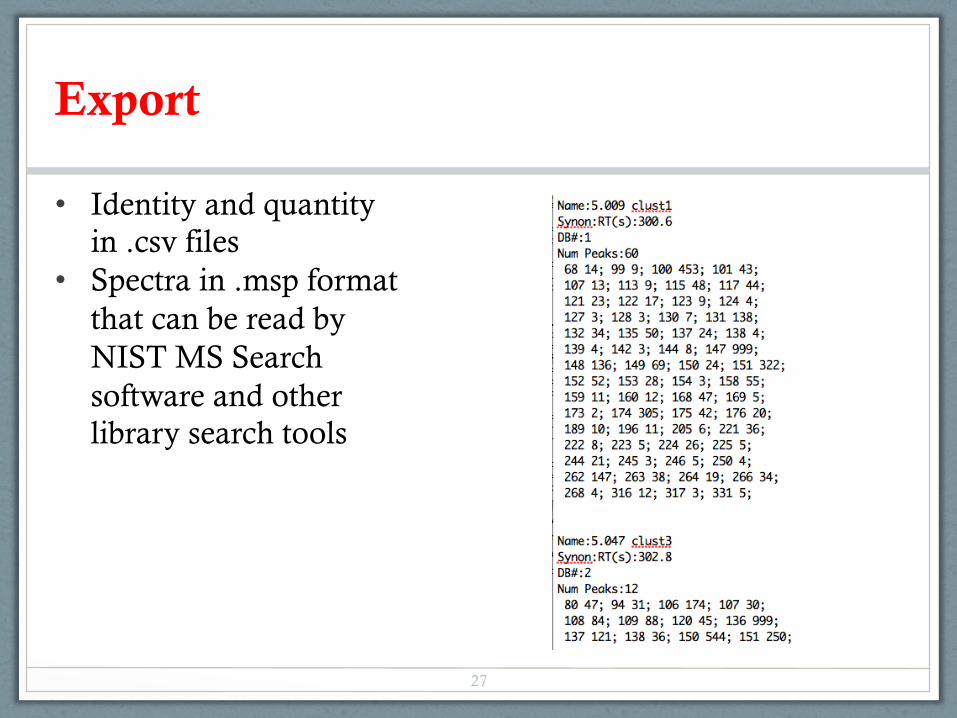
Export
• Identity and quantity in .csv files
• Spectra in .msp format that can be read by NIST MS Search software and other library search tools
27
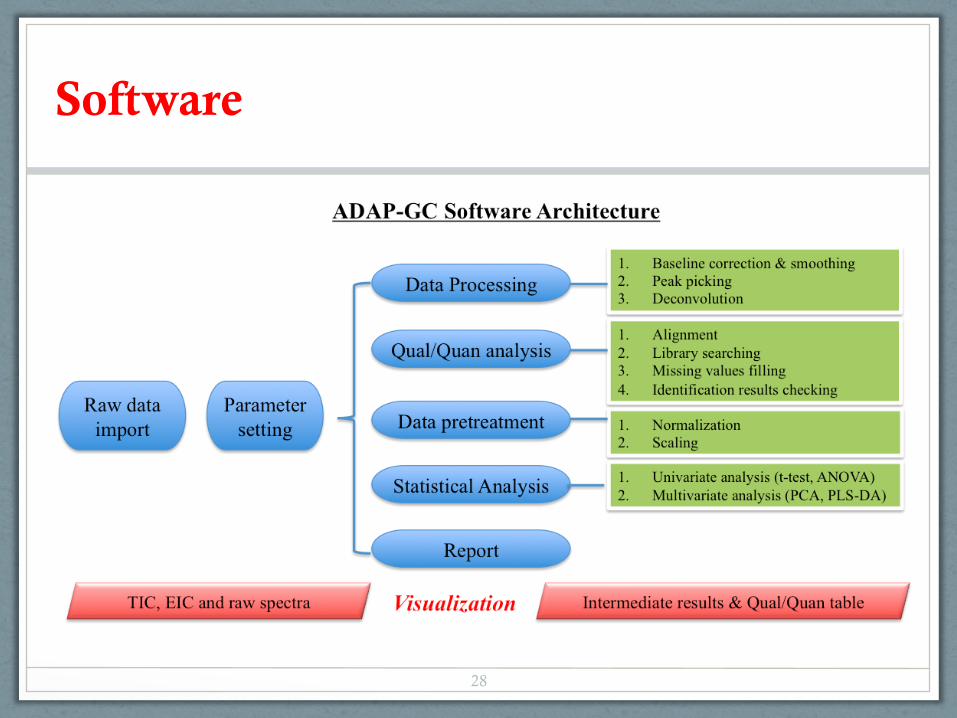
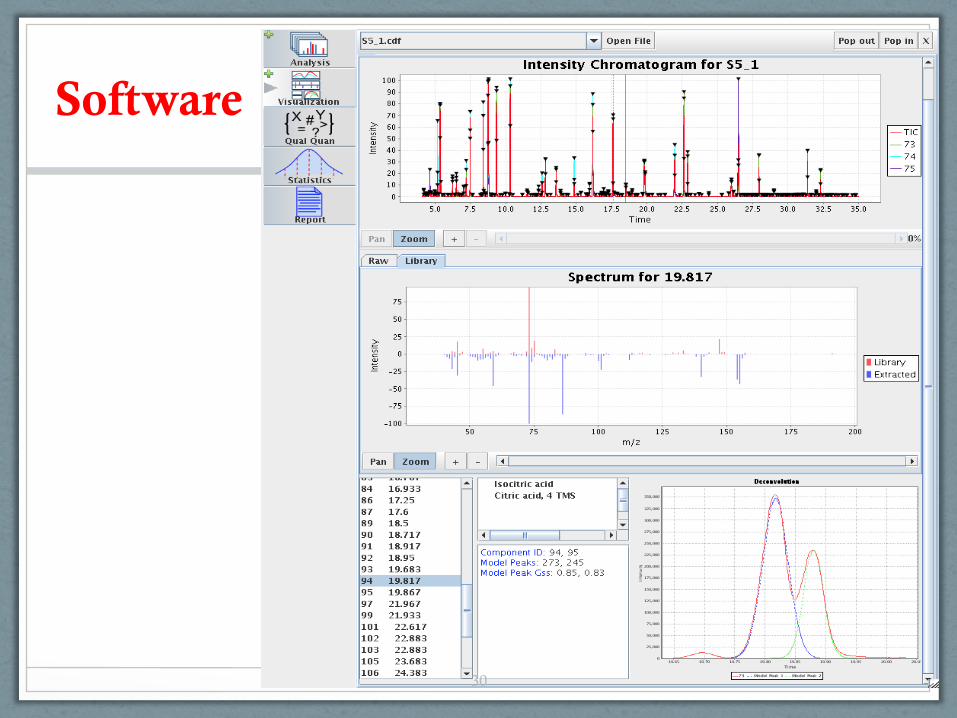
Software
28
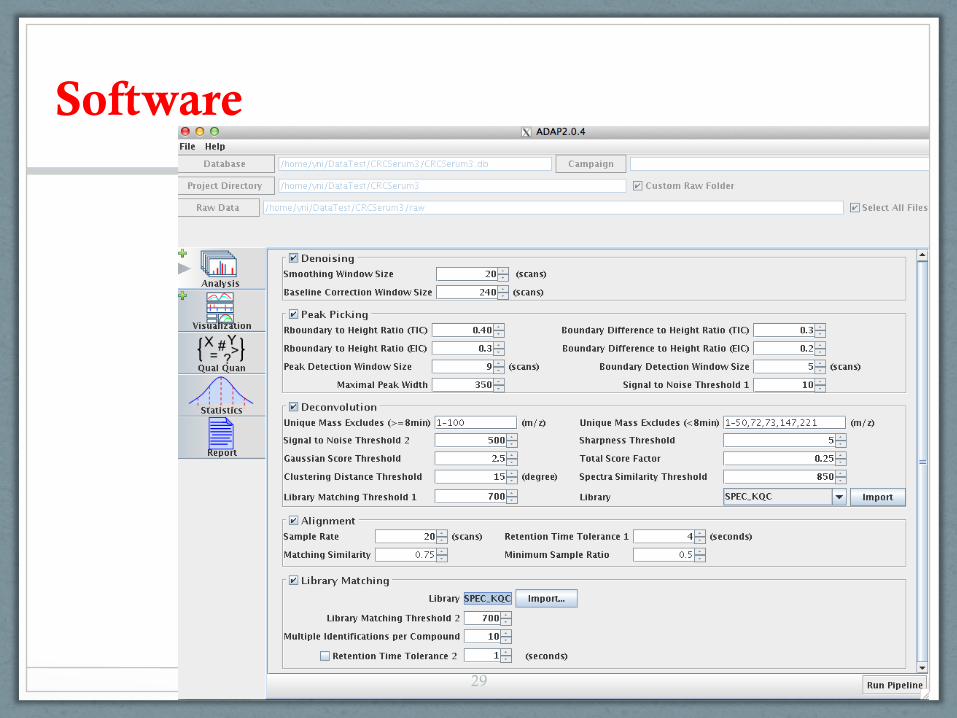
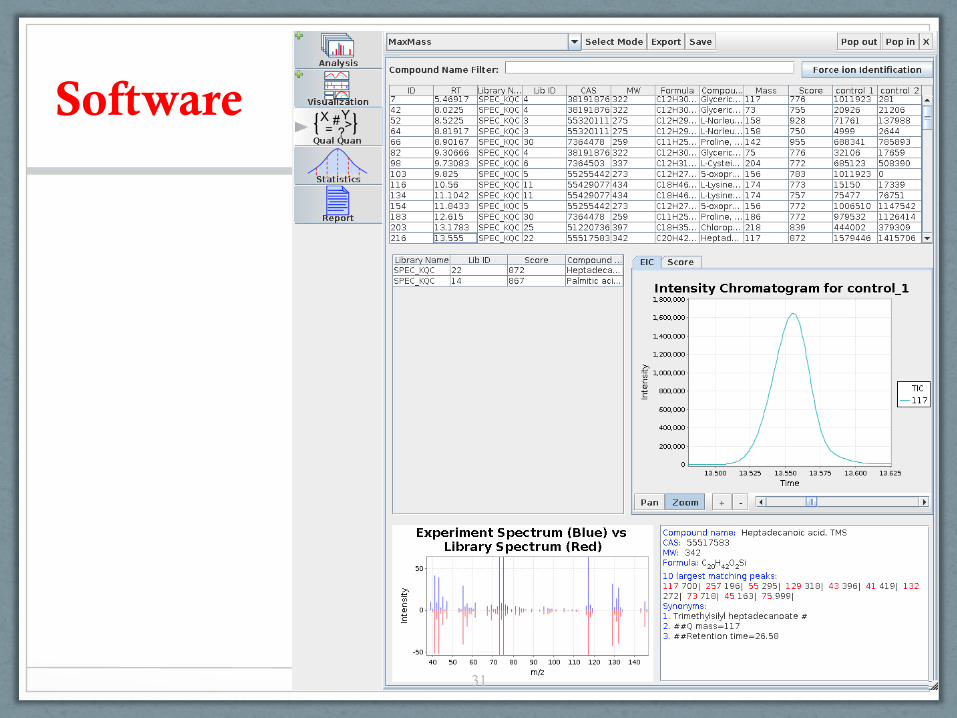
Software
29
Software Background ADAP-GC ADAP-LC ADAP-Stats ADAP-CAGT
30
Software Background ADAP-GC ADAP-LC ADAP-Stats ADAP-CAGT
31
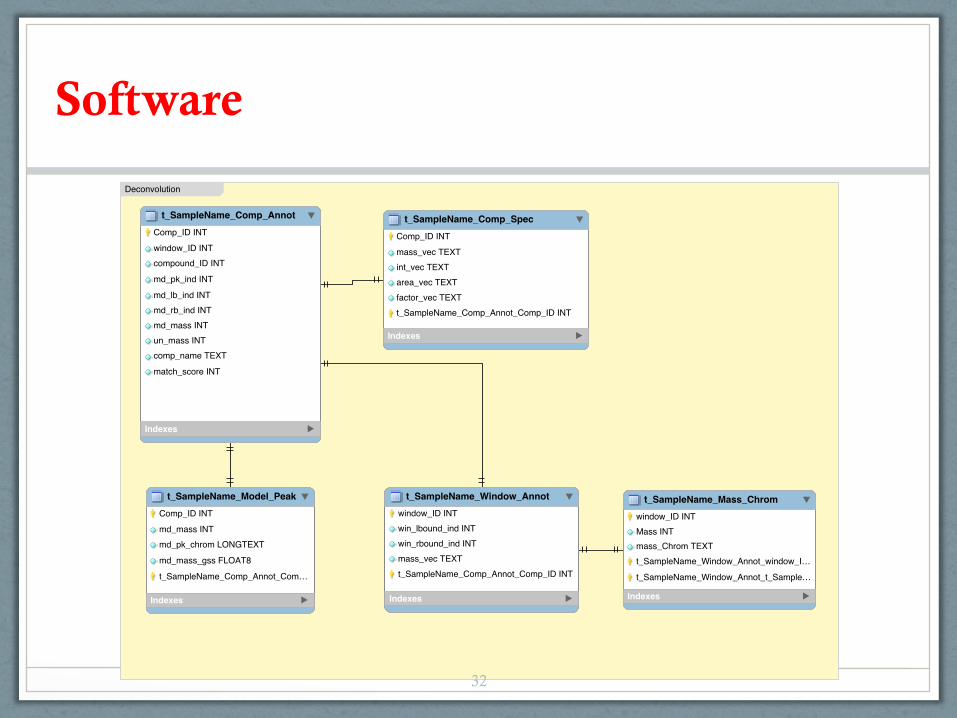
Software
32
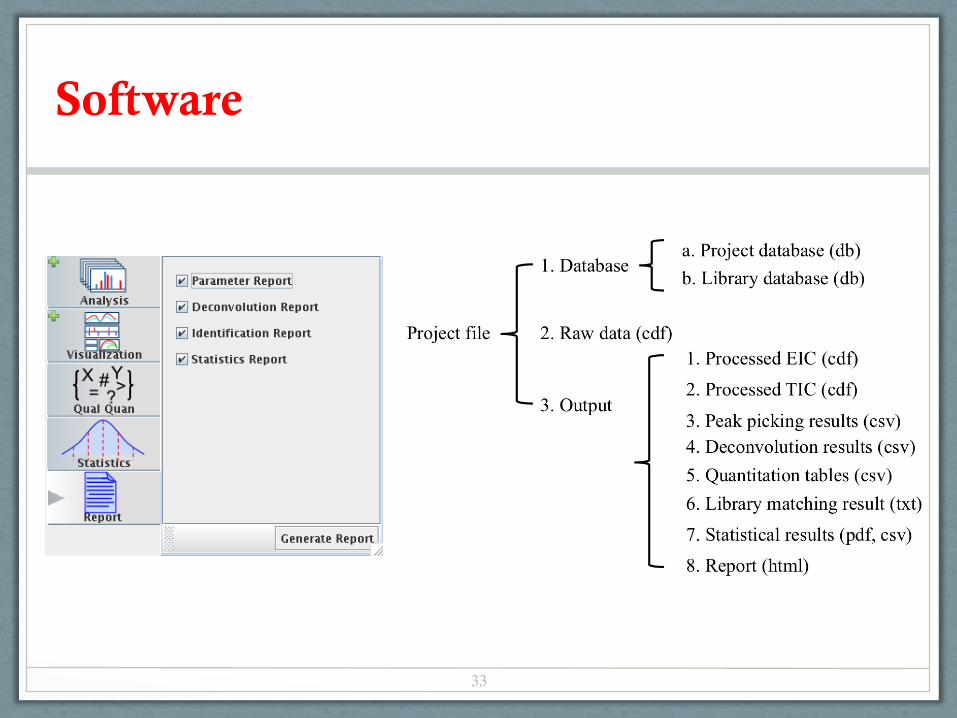
Software
33
Next step
• Many parameters must be pre-specified in the current data processing.
• How to reduce reliance on parameter settings?
• Is an adaptive workflow possible?
34
Acknowledgement
• Du lab § Wenxin Jiang
§ Yan Ni
§ Peter Pham
§ Kyle Suttlemyre
§ Fei Xu
§ Wenchao Zhang
35
Acknowledgement
• Dr. Wei Jia’s group @ UNC-Greensboro § Yunping Qiu
§ Guoxiang Xie
§ Xiaojiao Zheng
• Dr. Steve Zeisel’s group @ UNC-Chapel Hill
• Mingming Su @ DHMRI
36

Thank you!
37