Embed Size (px)
Citation preview

July 15, 2014
Open Source PQ Data Visualization

2 © 2014 Electric Power Research Institute, Inc. All rights reserved.
EPRI Smart Distribution and Power Quality 2014 Conference and Exhibition
Presentation Overview
• GPA
• Open Source Software (OSS) Trends and Value
• Dashboard vs Analytic Software
• Unique Values of a Dashboard
•PQ Dashboard Beta
• Questions

3 © 2014 Electric Power Research Institute, Inc. All rights reserved.
EPRI Smart Distribution and Power Quality 2014 Conference and Exhibition
Grid Protection Alliance
• Mission – to improve the reliability and resiliency
of the electric grid
• Purpose – to advance the technology of the
electric grid by providing services and systems
that create lasting value for electric energy
producers, transmission & distribution companies,
and consumers.
GPA is a not-for-profit corporation creating open source software, and
advancing electric grid operations through the development of secure,
extensible, high-performing, and freely available production-grade solutions.

4 © 2014 Electric Power Research Institute, Inc. All rights reserved.
EPRI Smart Distribution and Power Quality 2014 Conference and Exhibition
GPA Timeline
• Formed in 2010
• NERC contract to support and refine the openPDC
• Development clients include:
DOE, EPRI, WECC, FP&L,
Entergy, MISO, Dominion, NSF,
ISO-NE, PG&E, Duke, TVA, and others
• Currently 7 employees
• 4th Annual User’s Forum – August 12&13, 2014
Richmond, VA – Hosted by Dominion Virginia Power

5 © 2014 Electric Power Research Institute, Inc. All rights reserved.
EPRI Smart Distribution and Power Quality 2014 Conference and Exhibition
Open Source Software (OSS) Trends
shared by infografik on Apr 10, 2013 in Technology

6 © 2014 Electric Power Research Institute, Inc. All rights reserved.
EPRI Smart Distribution and Power Quality 2014 Conference and Exhibition
Open Source Software (OSS) Trends
2014 Future of Open Source Survey http://tinyurl.com/nchua8e
7 © 2014 Electric Power Research Institute, Inc. All rights reserved.
EPRI Smart Distribution and Power Quality 2014 Conference and Exhibition
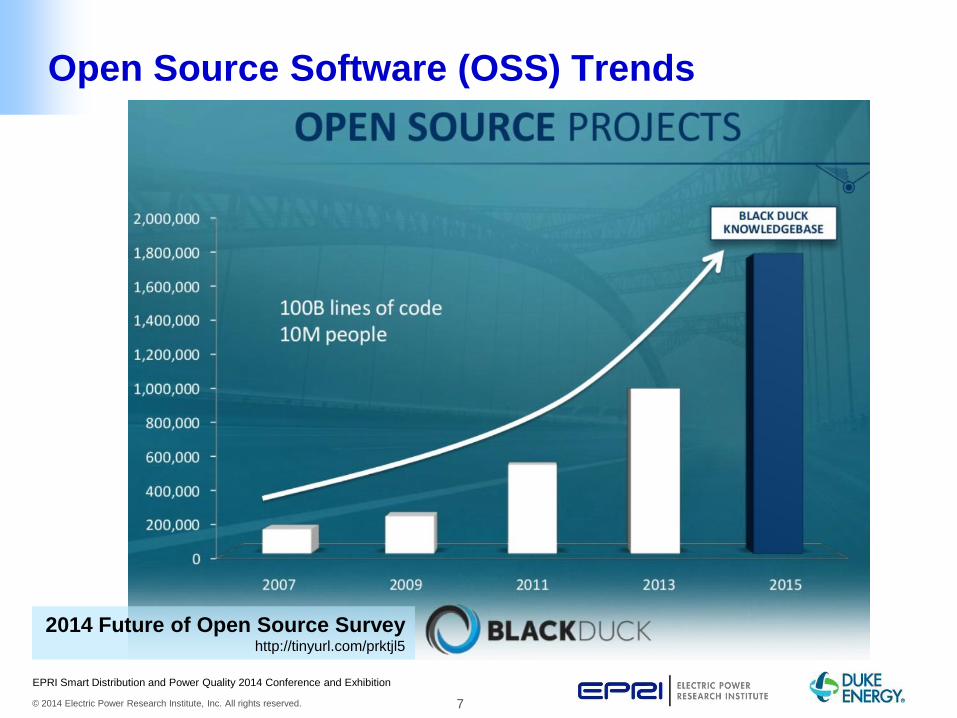
Open Source Software (OSS) Trends
2014 Future of Open Source Survey http://tinyurl.com/prktjl5

8 © 2014 Electric Power Research Institute, Inc. All rights reserved.
EPRI Smart Distribution and Power Quality 2014 Conference and Exhibition
Open Source Software (OSS) Trends
DRIVING TECHNOLOGY
…”in the spirit of the open source movement”

9 © 2014 Electric Power Research Institute, Inc. All rights reserved.
EPRI Smart Distribution and Power Quality 2014 Conference and Exhibition
Open Source Software (OSS) Value
• Better security
• Higher quality
• Ease of deployment and
extensibility
• No vendor lock In
• Fosters innovation
• Competitive features /
technical capabilities
• Lower acquisition and
maintenance costs
• Facilitates collaboration
• Lower total cost of
ownership
• Improved efficiency
• Decreased development
time
• Retain competitive
advantage
• Access to source code and
large software libraries
• Employee participation in
development and community

10 © 2014 Electric Power Research Institute, Inc. All rights reserved.
EPRI Smart Distribution and Power Quality 2014 Conference and Exhibition
Dashboard vs Analytic Software
http://www.exceldashboardwidgets.com/
Analytics is the discovery and communication of meaningful patterns in
data. Especially valuable in areas rich with recorded information,
analytics relies on the simultaneous application of statistics, computer
programming and operations research to quantify performance. Analytics
often favors data visualization to communicate insight. (wikipedia)

11 © 2014 Electric Power Research Institute, Inc. All rights reserved.
EPRI Smart Distribution and Power Quality 2014 Conference and Exhibition
Dashboard
• Easy to read
• Single page
• Graphical
• Current status
• Historical trends of key
performance indicators
• Informed decisions can be
made at a glance
Dashboard vs Analytic Software
Analytic Software
• Desktop or heavy client
• Manual steps
• Graphical or tabular
• Historical investigation
• Historical trends and
details of specific events
• Typically used to gather
reporting information

12 © 2014 Electric Power Research Institute, Inc. All rights reserved.
EPRI Smart Distribution and Power Quality 2014 Conference and Exhibition
Unique Values of a Dashboard
• A view of the entire fleet
• Quick assessment of PQ situation
• Saves time compared manual tools
• Identify negative trends and link to management process
for correction
• Present consistent view of information
• Make informed decisions based on specified meter groups
• Quickly identify data outliers

13 © 2014 Electric Power Research Institute, Inc. All rights reserved.
EPRI Smart Distribution and Power Quality 2014 Conference and Exhibition
Unique Values of a Dashboard
• Beautiful North Carolina Location
• Near US 64 with easy access
• Mountainside Cabin
• Sleeps 2
• Beautiful views
• 100 yards from mountain stream

14 © 2014 Electric Power Research Institute, Inc. All rights reserved.
EPRI Smart Distribution and Power Quality 2014 Conference and Exhibition
Unique Values of a Dashboard

15 © 2014 Electric Power Research Institute, Inc. All rights reserved.
EPRI Smart Distribution and Power Quality 2014 Conference and Exhibition
Unique Values of a Dashboard

16 © 2014 Electric Power Research Institute, Inc. All rights reserved.
EPRI Smart Distribution and Power Quality 2014 Conference and Exhibition
PQ Dashboard Beta
Background
• PQ monitoring goals:
– Quickly assimilate large quantities of data
– Provide actionable information
– Effectively display data from a large number of sites
– Provide value from a broad context with drill down to
details
– Integrate PQ and GIS displays

17 © 2014 Electric Power Research Institute, Inc. All rights reserved.
EPRI Smart Distribution and Power Quality 2014 Conference and Exhibition
PQ Dashboard Beta
Background
• Challenges:
– Increasing number of monitors
– Large data volumes
– Ineffective data distillation
– Bad data

18 © 2014 Electric Power Research Institute, Inc. All rights reserved.
EPRI Smart Distribution and Power Quality 2014 Conference and Exhibition
PQ Dashboard Beta
Background
• Objectives
– An OSS application (built on existing OSS where
possible)
– Develop OpenPQ Dashboard framework
– Implement key features as a proof-of-concept
– Demonstrate the value of a PQ Dashboard
– Easily deployable
– Easy integration with legacy systems
– Extensible
19 © 2014 Electric Power Research Institute, Inc. All rights reserved.
EPRI Smart Distribution and Power Quality 2014 Conference and Exhibition
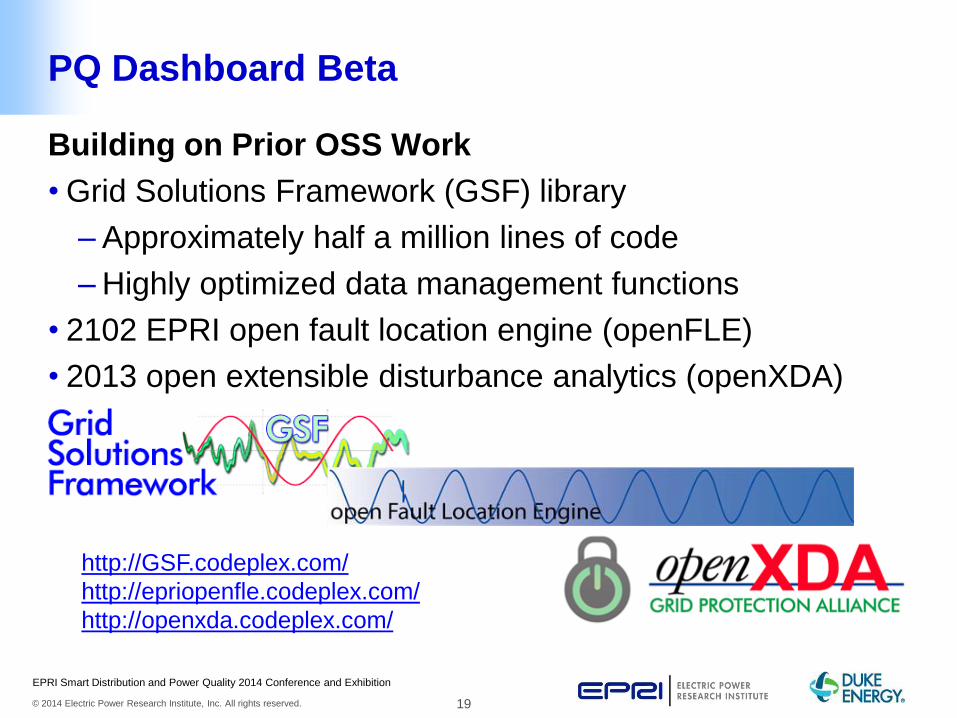
PQ Dashboard Beta
Building on Prior OSS Work
• Grid Solutions Framework (GSF) library
– Approximately half a million lines of code
– Highly optimized data management functions
• 2102 EPRI open fault location engine (openFLE)
• 2013 open extensible disturbance analytics (openXDA)
http://GSF.codeplex.com/
http://epriopenfle.codeplex.com/
http://openxda.codeplex.com/

20 © 2014 Electric Power Research Institute, Inc. All rights reserved.
EPRI Smart Distribution and Power Quality 2014 Conference and Exhibition
Context
– Initial displays have daily context
– Map and grid display entire fleet
– Default displays show yesterday’s data
– 30 day summary chart
– Limited drill-down for some detail
PQ Dashboard Beta

21 © 2014 Electric Power Research Institute, Inc. All rights reserved.
EPRI Smart Distribution and Power Quality 2014 Conference and Exhibition
Where we are now
– Architectural framework complete
– Displays complete:
• Overall layout
• Events
• Simple trends
– TVA Test data positioned
PQ Dashboard Beta

22 © 2014 Electric Power Research Institute, Inc. All rights reserved.
EPRI Smart Distribution and Power Quality 2014 Conference and Exhibition
The contract called for a minimum of 6 display ‘widgets’,
we have already exceeded that number.
Additional planned functions
– Complex trend displays
• Summary of trend ‘events’
• Trend chart to include standard and local limits
– Data quality displays
• Next slide for list of possible data quality tests
– Compatibility curves
– Option for automatic Link to PQWeb for analytic detail
PQ Dashboard Beta

23 © 2014 Electric Power Research Institute, Inc. All rights reserved.
EPRI Smart Distribution and Power Quality 2014 Conference and Exhibition
Simple Interface with Powerful Controls
• Spark line in grid control indicates events for each site on
the selected day
PQ Dashboard Beta

24 © 2014 Electric Power Research Institute, Inc. All rights reserved.
EPRI Smart Distribution and Power Quality 2014 Conference and Exhibition
Simple Interface with Powerful Controls
• Intelligent calendar control shows day selected and which
days have events
• Select base map and category of data to display
PQ Dashboard Beta

25 © 2014 Electric Power Research Institute, Inc. All rights reserved.
EPRI Smart Distribution and Power Quality 2014 Conference and Exhibition
Simple Interface with Powerful Controls
• Switch between map and grid
• Standard map zoom and pan
• Drag to zoom
• Flexible site selection, list, click or drag
PQ Dashboard Beta

26 © 2014 Electric Power Research Institute, Inc. All rights reserved.
EPRI Smart Distribution and Power Quality 2014 Conference and Exhibition
Simple Interface with Powerful Controls
• Mouse-over tool tip
• Click daily bar for
event detail table
PQ Dashboard Beta

27 © 2014 Electric Power Research Institute, Inc. All rights reserved.
EPRI Smart Distribution and Power Quality 2014 Conference and Exhibition
PQ Dashboard Beta Initial test data provided by TVA

28 © 2014 Electric Power Research Institute, Inc. All rights reserved.
EPRI Smart Distribution and Power Quality 2014 Conference and Exhibition
PQ Dashboard Beta
Initial test data provided by TVA

29 © 2014 Electric Power Research Institute, Inc. All rights reserved.
EPRI Smart Distribution and Power Quality 2014 Conference and Exhibition
Conclusions
• A dashboard approach for visualization brings new value to
PQ data
• OSS development strategy ensures flexibility and
extensibility
• Seamless integration to existing tools such as PQWeb and
possibly the PQ Investigator will enhance the value of the
dashboard and existing tools

30 © 2014 Electric Power Research Institute, Inc. All rights reserved.
EPRI Smart Distribution and Power Quality 2014 Conference and Exhibition
Questions