Embed Size (px)
Citation preview
CLICK TO EDIT MASTER TITLE STYLE
NEW PRESIDENT RAISES EXPECTATIONS
FOR STRUGGLING SMALL BUSINESS OWNERSA N AT I O N A L S U RV E Y B Y L A N G E R R E S E A R C H A S S O C I AT E S & S S R S
CLICK TO EDIT MASTER TITLE STYLEPERCEIVED IMPACT OF TRUMP’S ELECTIONO N YO U R S M A L L B U S I N E S S
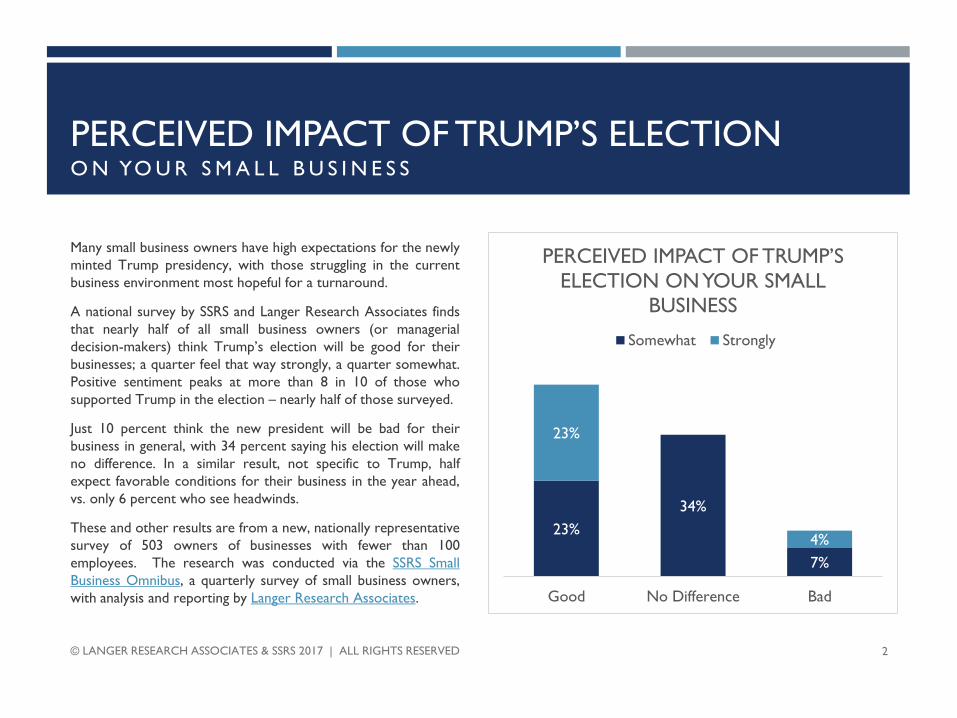
Many small business owners have high expectations for the newly
minted Trump presidency, with those struggling in the current
business environment most hopeful for a turnaround.
A national survey by SSRS and Langer Research Associates finds
that nearly half of all small business owners (or managerial
decision-makers) think Trump’s election will be good for their
businesses; a quarter feel that way strongly, a quarter somewhat.
Positive sentiment peaks at more than 8 in 10 of those who
supported Trump in the election – nearly half of those surveyed.
Just 10 percent think the new president will be bad for their
business in general, with 34 percent saying his election will make
no difference. In a similar result, not specific to Trump, half
expect favorable conditions for their business in the year ahead,
vs. only 6 percent who see headwinds.
These and other results are from a new, nationally representative
survey of 503 owners of businesses with fewer than 100
employees. The research was conducted via the SSRS Small
Business Omnibus, a quarterly survey of small business owners,
with analysis and reporting by Langer Research Associates.
23%
34%
7%
23%
4%
Good No Difference Bad
PERCEIVED IMPACT OF TRUMP’S
ELECTION ON YOUR SMALL
BUSINESS
Somewhat Strongly
© LANGER RESEARCH ASSOCIATES & SSRS 2017 | ALL RIGHTS RESERVED 2
CLICK TO EDIT MASTER TITLE STYLEBUSINESS OWNERS’ ASSESSMENTS O F C U R R E N T C O N D I T I O N S
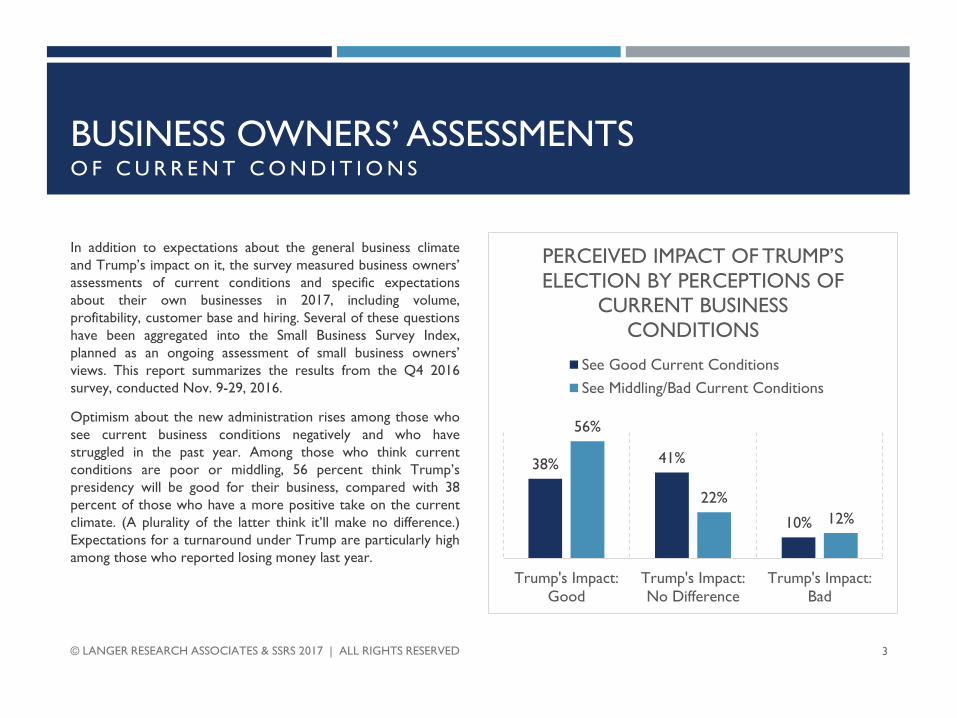
In addition to expectations about the general business climate
and Trump’s impact on it, the survey measured business owners’
assessments of current conditions and specific expectations
about their own businesses in 2017, including volume,
profitability, customer base and hiring. Several of these questions
have been aggregated into the Small Business Survey Index,
planned as an ongoing assessment of small business owners’
views. This report summarizes the results from the Q4 2016
survey, conducted Nov. 9-29, 2016.
Optimism about the new administration rises among those who
see current business conditions negatively and who have
struggled in the past year. Among those who think current
conditions are poor or middling, 56 percent think Trump’s
presidency will be good for their business, compared with 38
percent of those who have a more positive take on the current
climate. (A plurality of the latter think it’ll make no difference.)
Expectations for a turnaround under Trump are particularly high
among those who reported losing money last year.
© LANGER RESEARCH ASSOCIATES & SSRS 2017 | ALL RIGHTS RESERVED 3
38% 41%
10%
56%
22%
12%
Trump's Impact:
Good
Trump's Impact:
No Difference
Trump's Impact:
Bad
PERCEIVED IMPACT OF TRUMP’S
ELECTION BY PERCEPTIONS OF
CURRENT BUSINESS
CONDITIONS
See Good Current Conditions
See Middling/Bad Current Conditions
CLICK TO EDIT MASTER TITLE STYLEEXPECTED CHANGESI N Y E A R A H E A D
One key factor in higher expectations for Trump is a belief that the tax
climate will turn more favorable in the coming year. Among those who see a
favorable tax climate in the next year, 61 percent expect Trump’s presidency
to be good for their business, vs. only 38 percent among those who
anticipate an unfavorable or neutral tax climate. And 70 percent of those who
think the tax climate will be favorable in 2017 say the same about expected
economic conditions overall, compared with 42 percent of those who think
the tax climate will be unfavorable or somewhere in between.
While it’s struggling small business owners and those with favorable
expectations about the tax climate who are more hopeful about the incoming
administration, other results indicate positive current conditions in general,
informing expectations about the coming year. Six in 10 small business
owners rated economic conditions at the close of the Obama administration
as good (43 percent) or very good (18 percent) for their businesses. A similar
number reported making a profit in the last year, and only 13 percent said
they lost money. (The rest broke even.)
Among those who rated conditions in Q4 2016 as good, 59 percent
anticipate favorable conditions in 2017, vs. 41 percent who rated last-quarter
conditions as bad or middling. Likewise, 62 percent of small business owners
made a profit in the past year have positive expectations for business
conditions, vs. 37 percent of those who broke even or lost money.
53%
47%
43%
19%
42%
46%
47%
75%
4%
6%
8%
4%
Customer Base
Volume
Profitability
Staff
EXPECTED CHANGES IN
YEAR AHEAD
Expand No Change Contract
© LANGER RESEARCH ASSOCIATES & SSRS 2017 | ALL RIGHTS RESERVED 4
CLICK TO EDIT MASTER TITLE STYLEEXPECTED CHANGESI N Y E A R A H E A D
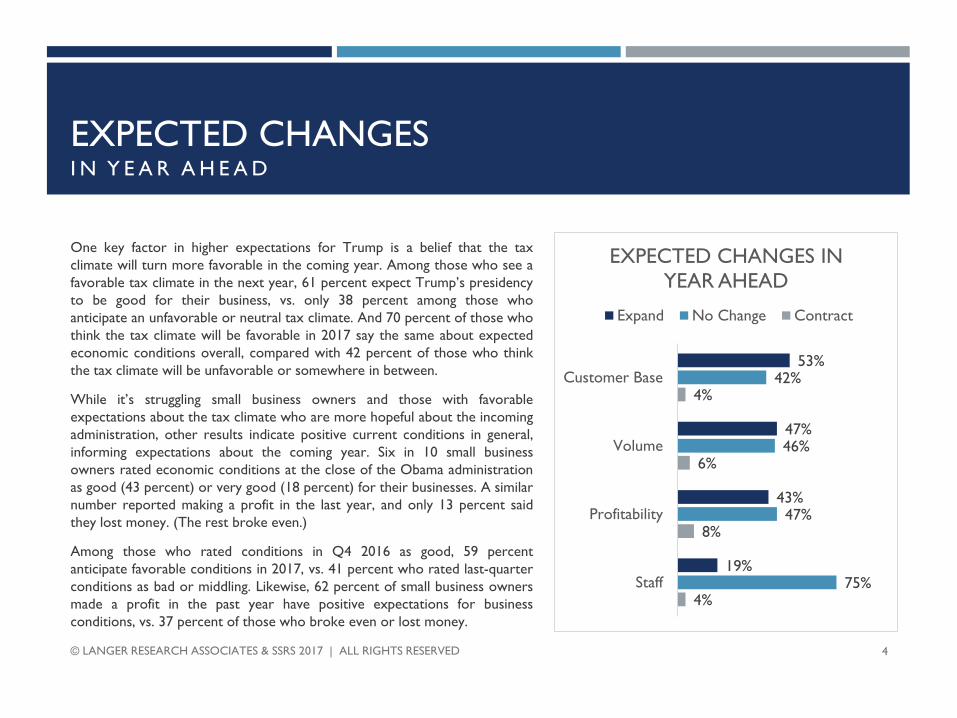
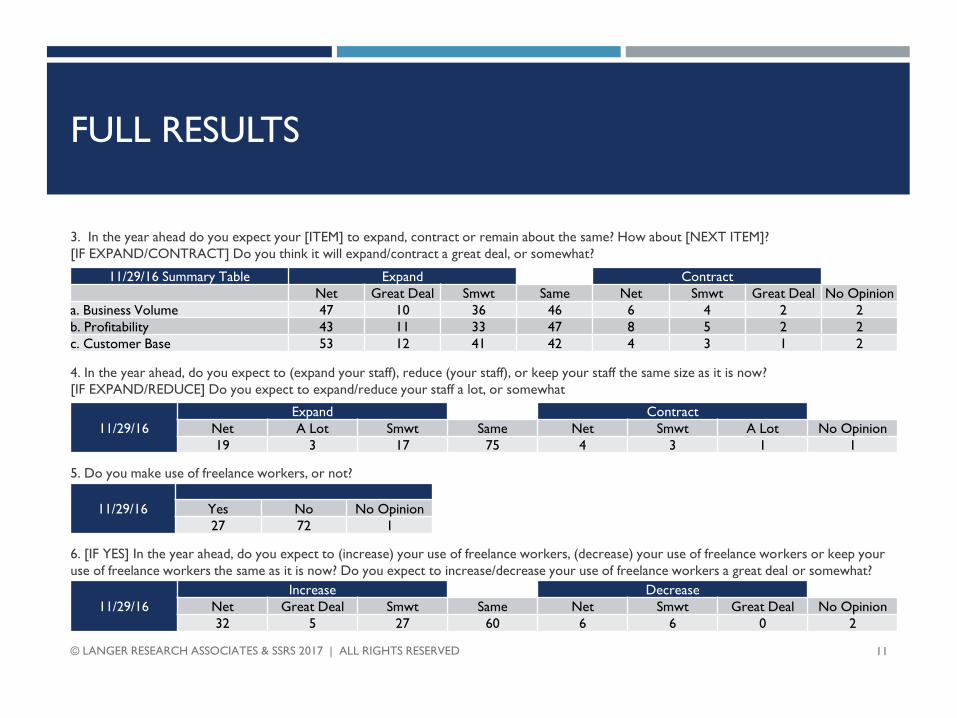
Similarly, few business owners expect contraction in the coming year. Only 4 to 8 percent see declines in their business volume,
profitability or customer base. Instead, business owners split nearly evenly between expanding and remaining the same in terms of
volume and profitability, while 53 percent see their customer base expanding, compared with 42 percent staying the same.
Expected hiring is substantially higher than expected staff reductions. Nineteen percent think their business will add staff in the upcoming
year, compared with 4 percent who see staffing cuts. Among the 27 percent of firms that report employing freelance workers, nearly a
third expect to increase their use of freelancers in the coming year.
While three-quarters of small business owners do not expect the size of their staffs to change, expected hiring increases with firm
revenue. Just 10 percent of firms with revenue of $200,000 or less (44 percent of all small businesses) expect hiring to increase next year,
versus 30 percent of firms with revenue of $2 million or more a year (8 percent of the sample).
Most small business owners express neutral to positive views about the policy environment in the year ahead. About a third see the
regulatory climate, tax climate and interest rates as being very or somewhat favorable in 2017; somewhat more in each case see these as
mixed, but fewer expect them to be negatives – 11, 20 and 10 percent, respectively.
As noted, views of the tax climate in particular are related strongly to overall expectations for the coming year. That’s also true about
expectations for business volume, profitability and customer base: Half or more of those with favorable views of the tax climate expect
higher volume, profitability and customer bases in the coming year.
© LANGER RESEARCH ASSOCIATES & SSRS 2017 | ALL RIGHTS RESERVED 5
CLICK TO EDIT MASTER TITLE STYLESMALL BUSINESS SURVEY INDEX
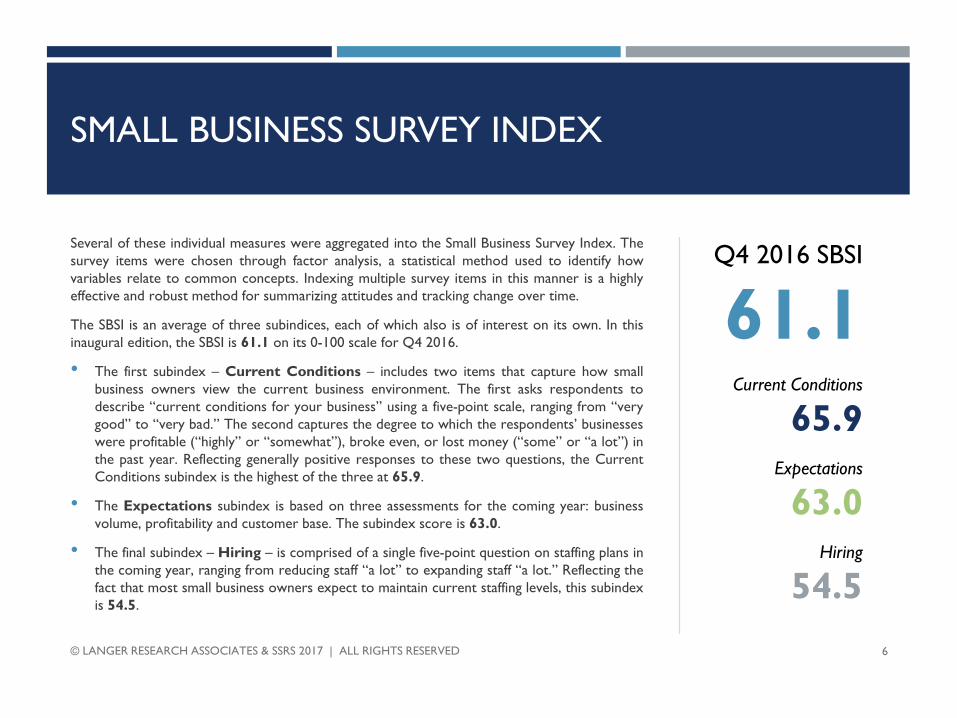
Several of these individual measures were aggregated into the Small Business Survey Index. The
survey items were chosen through factor analysis, a statistical method used to identify how
variables relate to common concepts. Indexing multiple survey items in this manner is a highly
effective and robust method for summarizing attitudes and tracking change over time.
The SBSI is an average of three subindices, each of which also is of interest on its own. In this
inaugural edition, the SBSI is 61.1 on its 0-100 scale for Q4 2016.
• The first subindex – Current Conditions – includes two items that capture how small
business owners view the current business environment. The first asks respondents to
describe “current conditions for your business” using a five-point scale, ranging from “very
good” to “very bad.” The second captures the degree to which the respondents’ businesses
were profitable (“highly” or “somewhat”), broke even, or lost money (“some” or “a lot”) in
the past year. Reflecting generally positive responses to these two questions, the Current
Conditions subindex is the highest of the three at 65.9.
• The Expectations subindex is based on three assessments for the coming year: business
volume, profitability and customer base. The subindex score is 63.0.
• The final subindex – Hiring – is comprised of a single five-point question on staffing plans in
the coming year, ranging from reducing staff “a lot” to expanding staff “a lot.” Reflecting the
fact that most small business owners expect to maintain current staffing levels, this subindex
is 54.5.
© LANGER RESEARCH ASSOCIATES & SSRS 2017 | ALL RIGHTS RESERVED 6
Q4 2016 SBSI
61.1Current Conditions
65.9
Expectations
63.0
Hiring
54.5
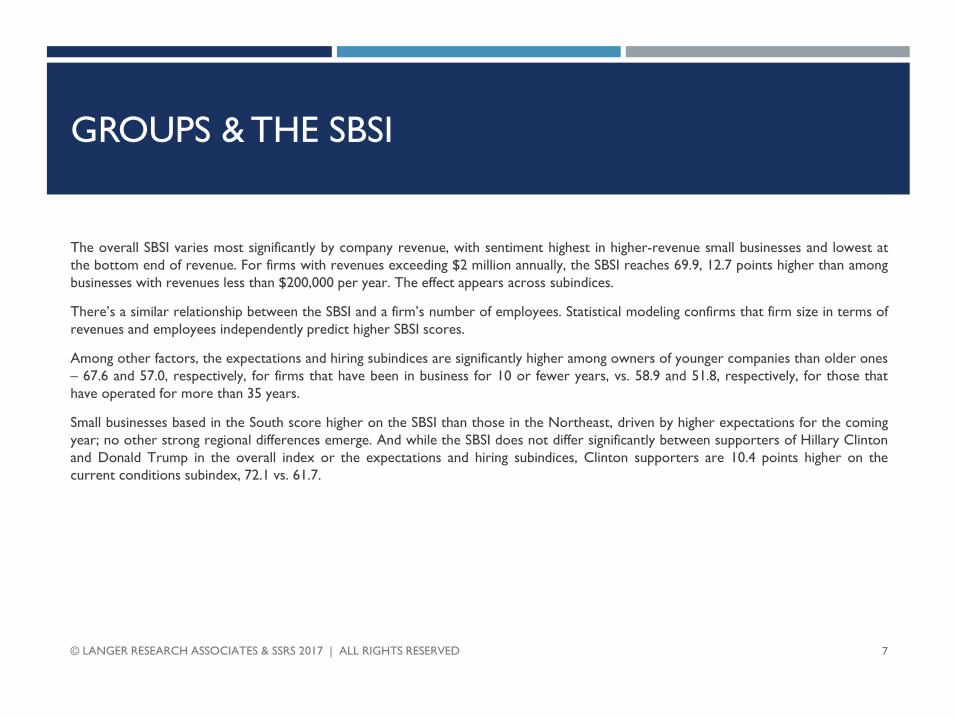
CLICK TO EDIT MASTER TITLE STYLEGROUPS & THE SBSI
The overall SBSI varies most significantly by company revenue, with sentiment highest in higher-revenue small businesses and lowest at
the bottom end of revenue. For firms with revenues exceeding $2 million annually, the SBSI reaches 69.9, 12.7 points higher than among
businesses with revenues less than $200,000 per year. The effect appears across subindices.
There’s a similar relationship between the SBSI and a firm’s number of employees. Statistical modeling confirms that firm size in terms of
revenues and employees independently predict higher SBSI scores.
Among other factors, the expectations and hiring subindices are significantly higher among owners of younger companies than older ones
– 67.6 and 57.0, respectively, for firms that have been in business for 10 or fewer years, vs. 58.9 and 51.8, respectively, for those that
have operated for more than 35 years.
Small businesses based in the South score higher on the SBSI than those in the Northeast, driven by higher expectations for the coming
year; no other strong regional differences emerge. And while the SBSI does not differ significantly between supporters of Hillary Clinton
and Donald Trump in the overall index or the expectations and hiring subindices, Clinton supporters are 10.4 points higher on the
current conditions subindex, 72.1 vs. 61.7.
© LANGER RESEARCH ASSOCIATES & SSRS 2017 | ALL RIGHTS RESERVED 7
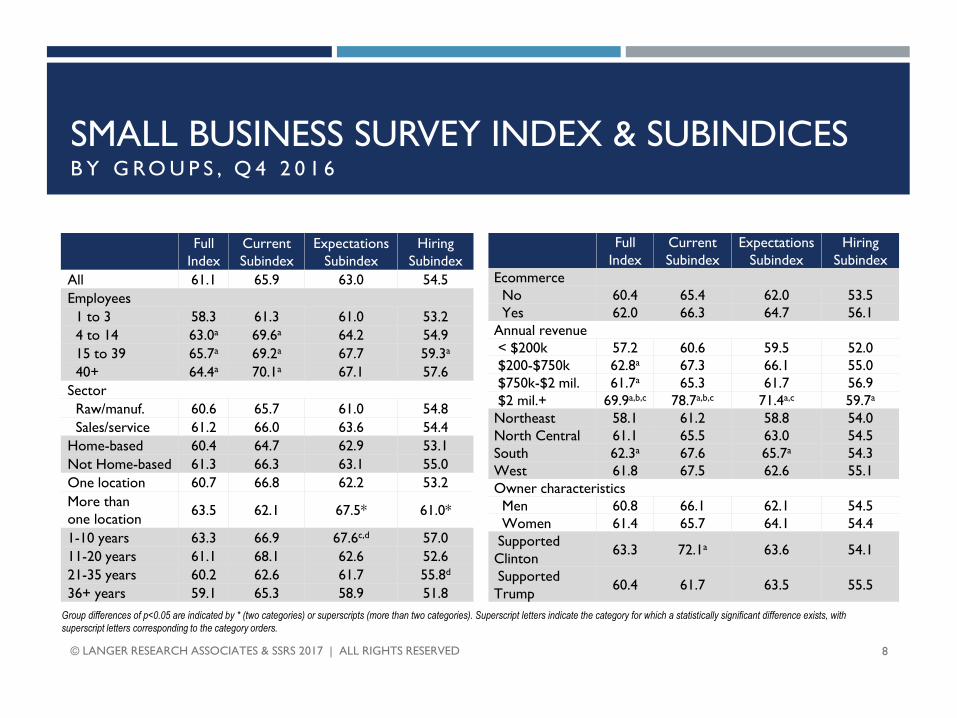
CLICK TO EDIT MASTER TITLE STYLESMALL BUSINESS SURVEY INDEX & SUBINDICES B Y G RO U P S , Q 4 2 0 1 6
Full
Index
Current
Subindex
Expectations
Subindex
Hiring
Subindex
All 61.1 65.9 63.0 54.5
Employees
1 to 3 58.3 61.3 61.0 53.2
4 to 14 63.0a 69.6a 64.2 54.9
15 to 39 65.7a 69.2a 67.7 59.3a
40+ 64.4a 70.1a 67.1 57.6
Sector
Raw/manuf. 60.6 65.7 61.0 54.8
Sales/service 61.2 66.0 63.6 54.4
Home-based 60.4 64.7 62.9 53.1
Not Home-based 61.3 66.3 63.1 55.0
One location 60.7 66.8 62.2 53.2
More than
one location63.5 62.1 67.5* 61.0*
1-10 years 63.3 66.9 67.6c,d 57.0
11-20 years 61.1 68.1 62.6 52.6
21-35 years 60.2 62.6 61.7 55.8d
36+ years 59.1 65.3 58.9 51.8
Full
Index
Current
Subindex
Expectations
Subindex
Hiring
Subindex
Ecommerce
No 60.4 65.4 62.0 53.5
Yes 62.0 66.3 64.7 56.1
Annual revenue
< $200k 57.2 60.6 59.5 52.0
$200-$750k 62.8a 67.3 66.1 55.0
$750k-$2 mil. 61.7a 65.3 61.7 56.9
$2 mil.+ 69.9a,b,c 78.7a,b,c 71.4a,c 59.7a
Northeast 58.1 61.2 58.8 54.0
North Central 61.1 65.5 63.0 54.5
South 62.3a 67.6 65.7a 54.3
West 61.8 67.5 62.6 55.1
Owner characteristics
Men 60.8 66.1 62.1 54.5
Women 61.4 65.7 64.1 54.4
Supported
Clinton63.3 72.1a 63.6 54.1
Supported
Trump60.4 61.7 63.5 55.5
© LANGER RESEARCH ASSOCIATES & SSRS 2017 | ALL RIGHTS RESERVED 8
Group differences of p<0.05 are indicated by * (two categories) or superscripts (more than two categories). Superscript letters indicate the category for which a statistically significant difference exists, with
superscript letters corresponding to the category orders.
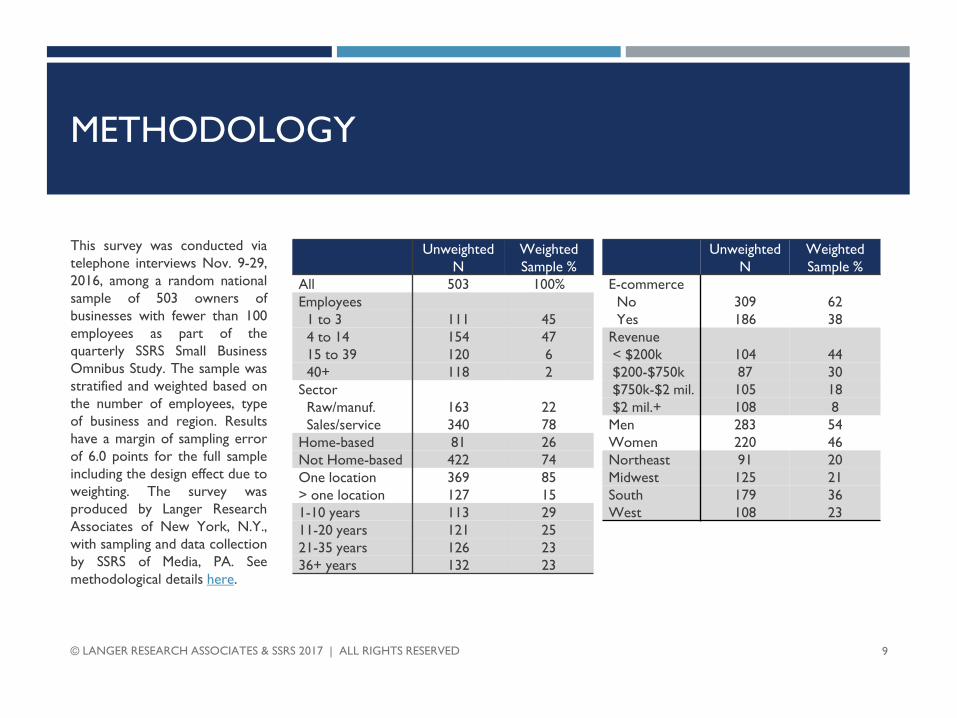
CLICK TO EDIT MASTER TITLE STYLEMETHODOLOGY
This survey was conducted via
telephone interviews Nov. 9-29,
2016, among a random national
sample of 503 owners of
businesses with fewer than 100
employees as part of the
quarterly SSRS Small Business
Omnibus Study. The sample was
stratified and weighted based on
the number of employees, type
of business and region. Results
have a margin of sampling error
of 6.0 points for the full sample
including the design effect due to
weighting. The survey was
produced by Langer Research
Associates of New York, N.Y.,
with sampling and data collection
by SSRS of Media, PA. See
methodological details here.
© LANGER RESEARCH ASSOCIATES & SSRS 2017 | ALL RIGHTS RESERVED 9
Unweighted
N
Weighted
Sample %
All 503 100%
Employees
1 to 3 111 45
4 to 14 154 47
15 to 39 120 6
40+ 118 2
Sector
Raw/manuf. 163 22
Sales/service 340 78
Home-based 81 26
Not Home-based 422 74
One location 369 85
> one location 127 15
1-10 years 113 29
11-20 years 121 25
21-35 years 126 23
36+ years 132 23
Unweighted
N
Weighted
Sample %
E-commerce
No 309 62
Yes 186 38
Revenue
< $200k 104 44
$200-$750k 87 30
$750k-$2 mil. 105 18
$2 mil.+ 108 8
Men 283 54
Women 220 46
Northeast 91 20
Midwest 125 21
South 179 36
West 108 23
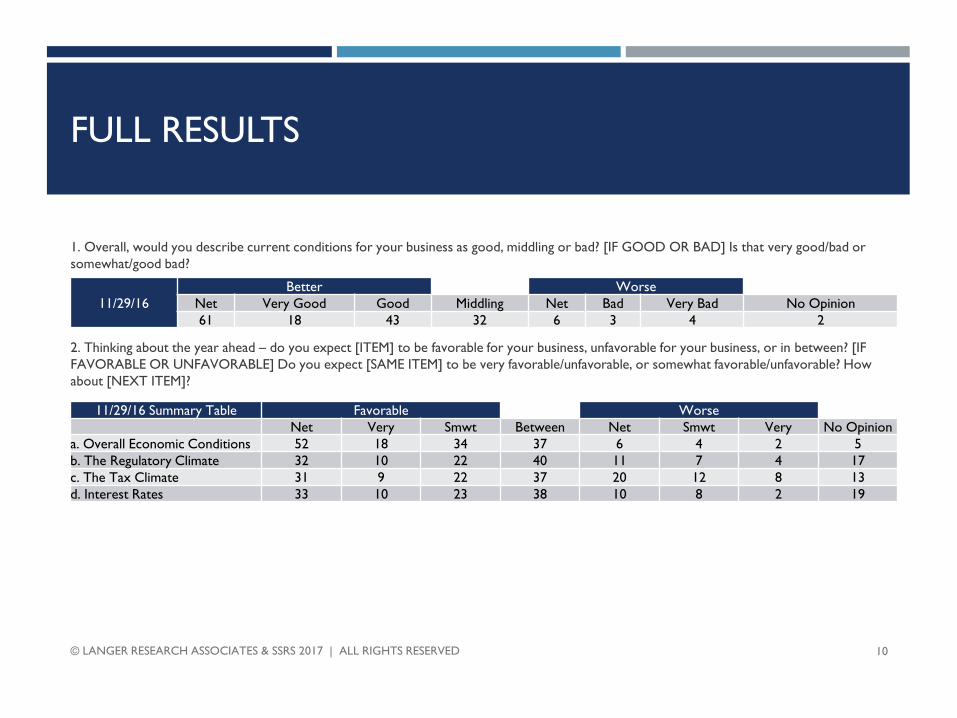
CLICK TO EDIT MASTER TITLE STYLEFULL RESULTS
1. Overall, would you describe current conditions for your business as good, middling or bad? [IF GOOD OR BAD] Is that very good/bad or
somewhat/good bad?
2. Thinking about the year ahead – do you expect [ITEM] to be favorable for your business, unfavorable for your business, or in between? [IF
FAVORABLE OR UNFAVORABLE] Do you expect [SAME ITEM] to be very favorable/unfavorable, or somewhat favorable/unfavorable? How
about [NEXT ITEM]?
© LANGER RESEARCH ASSOCIATES & SSRS 2017 | ALL RIGHTS RESERVED 10
11/29/16
Better Worse
Net Very Good Good Middling Net Bad Very Bad No Opinion
61 18 43 32 6 3 4 2
11/29/16 Summary Table Favorable Worse
Net Very Smwt Between Net Smwt Very No Opinion
a. Overall Economic Conditions 52 18 34 37 6 4 2 5
b. The Regulatory Climate 32 10 22 40 11 7 4 17
c. The Tax Climate 31 9 22 37 20 12 8 13
d. Interest Rates 33 10 23 38 10 8 2 19
CLICK TO EDIT MASTER TITLE STYLE
3. In the year ahead do you expect your [ITEM] to expand, contract or remain about the same? How about [NEXT ITEM]?
[IF EXPAND/CONTRACT] Do you think it will expand/contract a great deal, or somewhat?
4. In the year ahead, do you expect to (expand your staff), reduce (your staff), or keep your staff the same size as it is now?
[IF EXPAND/REDUCE] Do you expect to expand/reduce your staff a lot, or somewhat
5. Do you make use of freelance workers, or not?
6. [IF YES] In the year ahead, do you expect to (increase) your use of freelance workers, (decrease) your use of freelance workers or keep your
use of freelance workers the same as it is now? Do you expect to increase/decrease your use of freelance workers a great deal or somewhat?
FULL RESULTS
© LANGER RESEARCH ASSOCIATES & SSRS 2017 | ALL RIGHTS RESERVED 11
11/29/16 Summary Table Expand Contract
Net Great Deal Smwt Same Net Smwt Great Deal No Opinion
a. Business Volume 47 10 36 46 6 4 2 2
b. Profitability 43 11 33 47 8 5 2 2
c. Customer Base 53 12 41 42 4 3 1 2
11/29/16
Expand Contract
Net A Lot Smwt Same Net Smwt A Lot No Opinion
19 3 17 75 4 3 1 1
11/29/16 Yes No No Opinion
27 72 1
11/29/16
Increase Decrease
Net Great Deal Smwt Same Net Smwt Great Deal No Opinion
32 5 27 60 6 6 0 2
CLICK TO EDIT MASTER TITLE STYLEFULL RESULTS
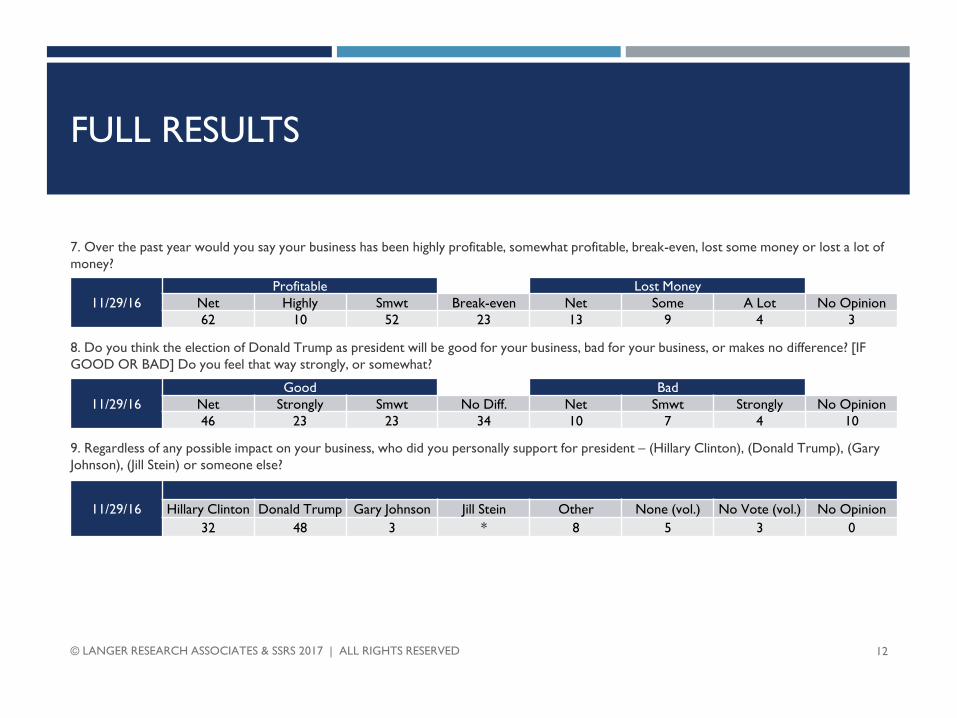
7. Over the past year would you say your business has been highly profitable, somewhat profitable, break-even, lost some money or lost a lot of
money?
8. Do you think the election of Donald Trump as president will be good for your business, bad for your business, or makes no difference? [IF
GOOD OR BAD] Do you feel that way strongly, or somewhat?
9. Regardless of any possible impact on your business, who did you personally support for president – (Hillary Clinton), (Donald Trump), (Gary
Johnson), (Jill Stein) or someone else?
© LANGER RESEARCH ASSOCIATES & SSRS 2017 | ALL RIGHTS RESERVED 12
11/29/16
Profitable Lost Money
Net Highly Smwt Break-even Net Some A Lot No Opinion
62 10 52 23 13 9 4 3
11/29/16
Good Bad
Net Strongly Smwt No Diff. Net Smwt Strongly No Opinion
46 23 23 34 10 7 4 10
11/29/16 Hillary Clinton Donald Trump Gary Johnson Jill Stein Other None (vol.) No Vote (vol.) No Opinion
32 48 3 * 8 5 3 0
CLICK TO EDIT MASTER TITLE STYLE
CONTACT USW I T H A N Y Q U E S T I O N S
@ssrs_solutions | 484.840.4300
@LangerResearch | 212.456.2621