Embed Size (px)
Citation preview
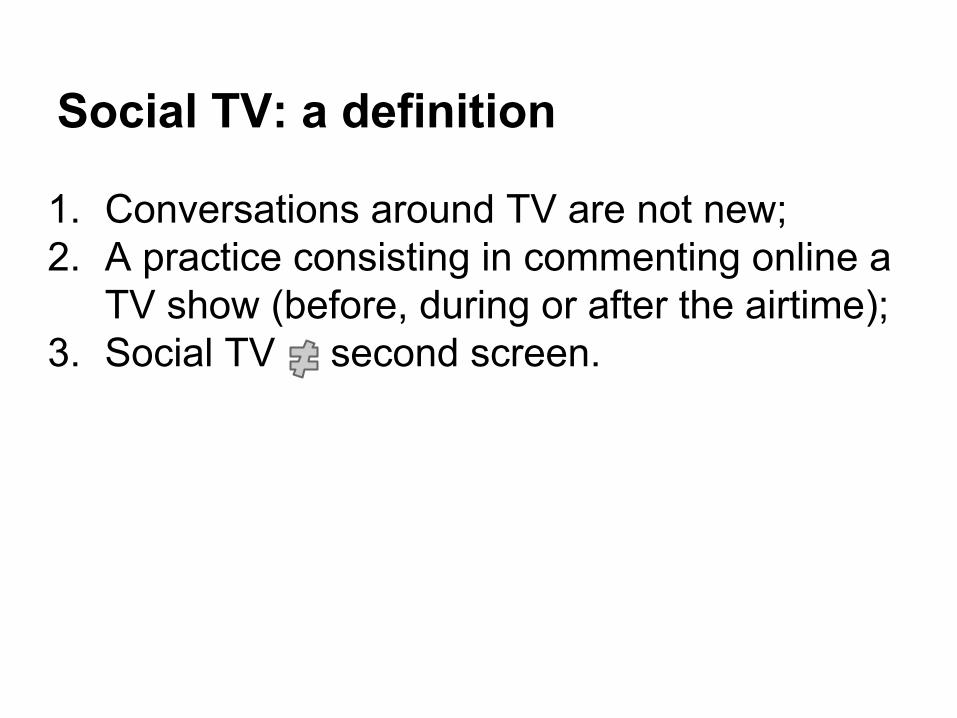
Social TV: a definition
1. Conversations around TV are not new;2. A practice consisting in commenting online a
TV show (before, during or after the airtime);3. Social TV second screen.

How big is it?
Source: News-Italia, January 20-February 2 2015. N=1,021 adults ages 18 and older, including 259 interviews conducted on respondent's cell phone. Margin or errors is +/- 3 percentage points (n=767).
35%
29
In Italy (n=767)
24
28
16
6
10

What we can observe and where
Twitter comments aggregated by an #hashtagActivities in a Facebook PageYouTube comments...

How Big is Twitter Social TV (in Italy)
● 19% of Italian population 18+ on Twitter, 46% on Facebook (source: News-Italia 2015);
● 28,000 unique average daily Social TV contributors (source: Nielsen Twitter TV Ratings September-December 2014);
● 73,800 unique contributors vs 11,843,000 TV viewers for the last night of Sanremo ‘15 (source: Nielsen-Netrating and Auditel).
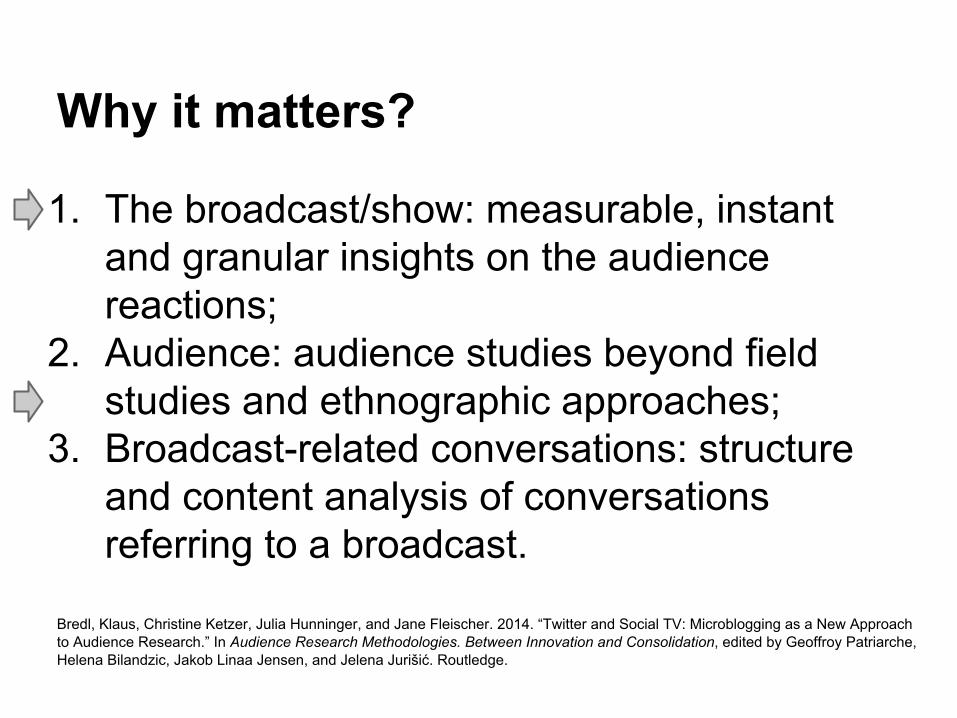
Why it matters?
1. The broadcast/show: measurable, instant and granular insights on the audience reactions;
2. Audience: audience studies beyond field studies and ethnographic approaches;
3. Broadcast-related conversations: structure and content analysis of conversations referring to a broadcast.
Bredl, Klaus, Christine Ketzer, Julia Hunninger, and Jane Fleischer. 2014. “Twitter and Social TV: Microblogging as a New Approach to Audience Research.” In Audience Research Methodologies. Between Innovation and Consolidation, edited by Geoffroy Patriarche, Helena Bilandzic, Jakob Linaa Jensen, and Jelena Jurišić. Routledge.
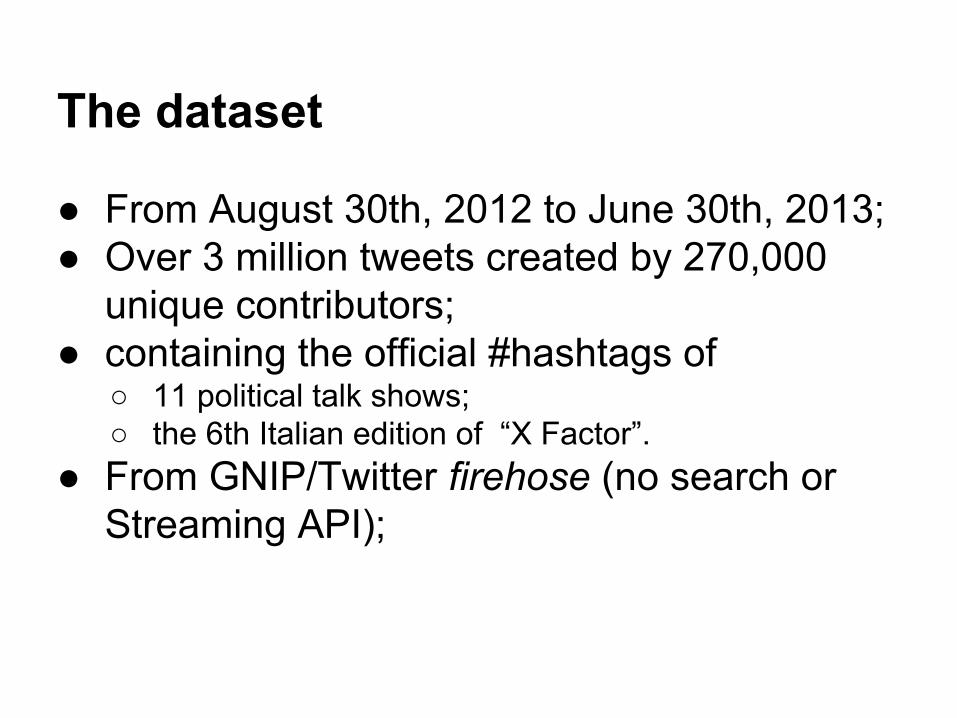
The dataset
● From August 30th, 2012 to June 30th, 2013;● Over 3 million tweets created by 270,000
unique contributors;● containing the official #hashtags of
○ 11 political talk shows;○ the 6th Italian edition of “X Factor”.
● From GNIP/Twitter firehose (no search or Streaming API);

My experiences on Twitter Social TV
1. Can we predict the audience size of an episode using Twitter? (http://goo.gl/nLB1zh)
2. Twitter commentaries on political talk shows are situated at the crossroad between political and audience participation. What is the prevalent form of participation found in these tweets? Is this participation affected by the talked about party? (http://goo.gl/cPkibz & http://goo.gl/moHCnz)
3. What kind of TV scene drives online audience engagement? Are these drivers playing the same role in political talk shows and talent shows? (http://goo.gl/AopjBZ)
Predicting TV Audience

Dataset preparation
1. Subset of Tweets (1) created during the on air time of the episodes (+15 mins) and (2) containing the corresponding program #hashtag (n= 1,881,873);
2. 1,077 aired episodes with respective average audience and rating as estimated by Auditel;
3. Twitter metrics for each episode (Tweets, contributors, reach, ReTweet, Reply, Tweet-per-minute, contributors-per-minute).

Correlation coefficients
Audience n p
Tweet .54 1077 < .01
Contributors .64 1077 < .01
Reach .51 1077 < .01
ReTweet .54 1077 < .01
Reply .6 1077 < .01
Tweet-per-minute (TPM) .57 1077 < .01
Contributors-per-minute (CPM) .67 1077 < .01
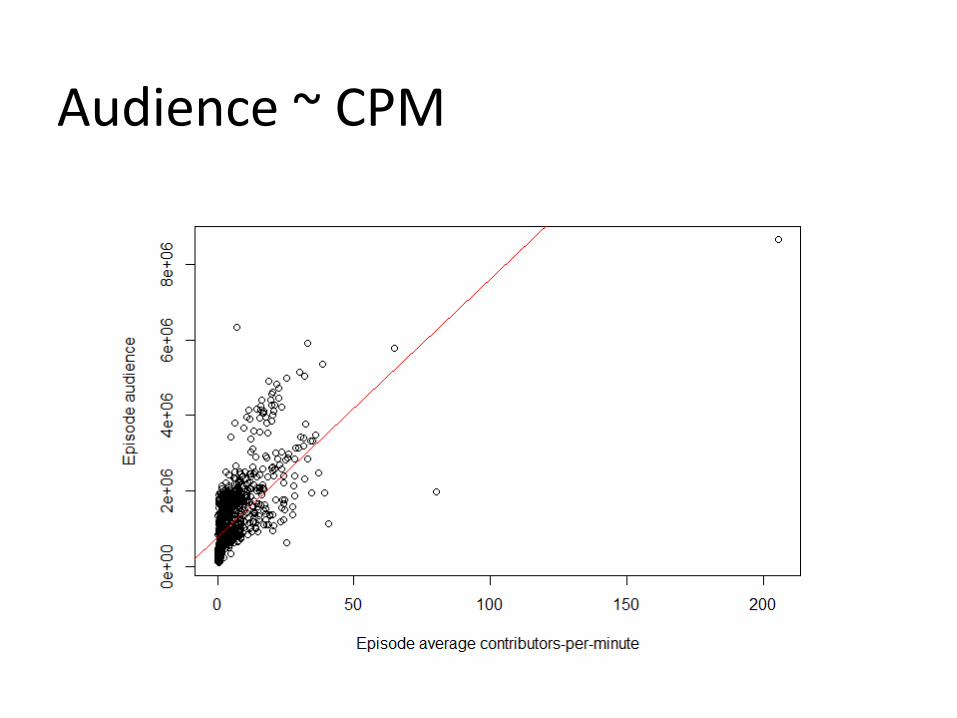
Audience ~ CPM
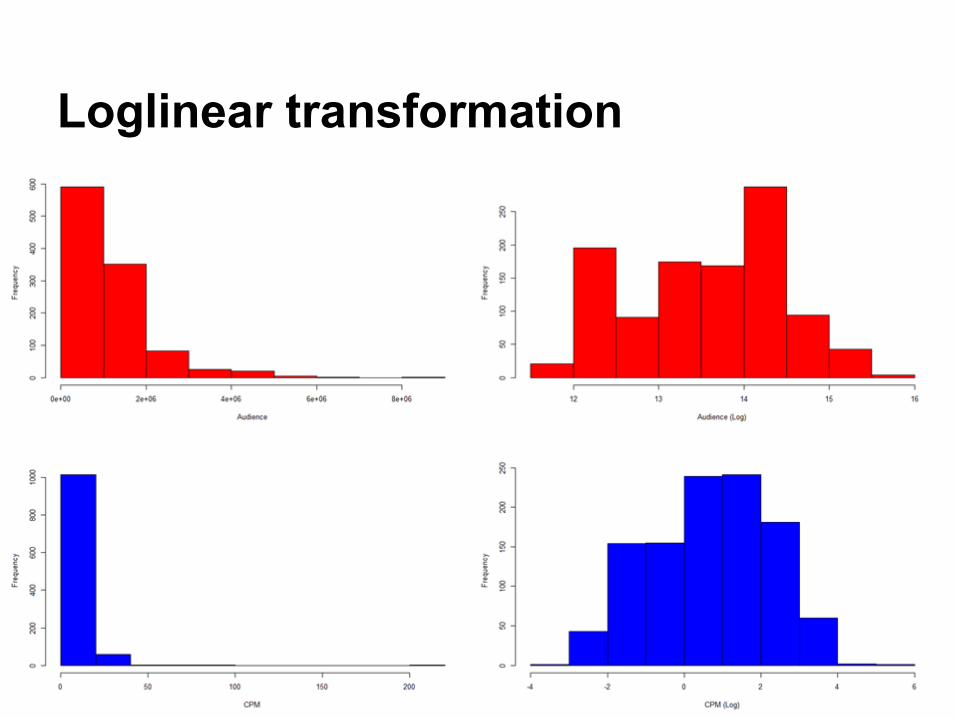
Loglinear transformation

Log(Audience) ~ Log(CPM)
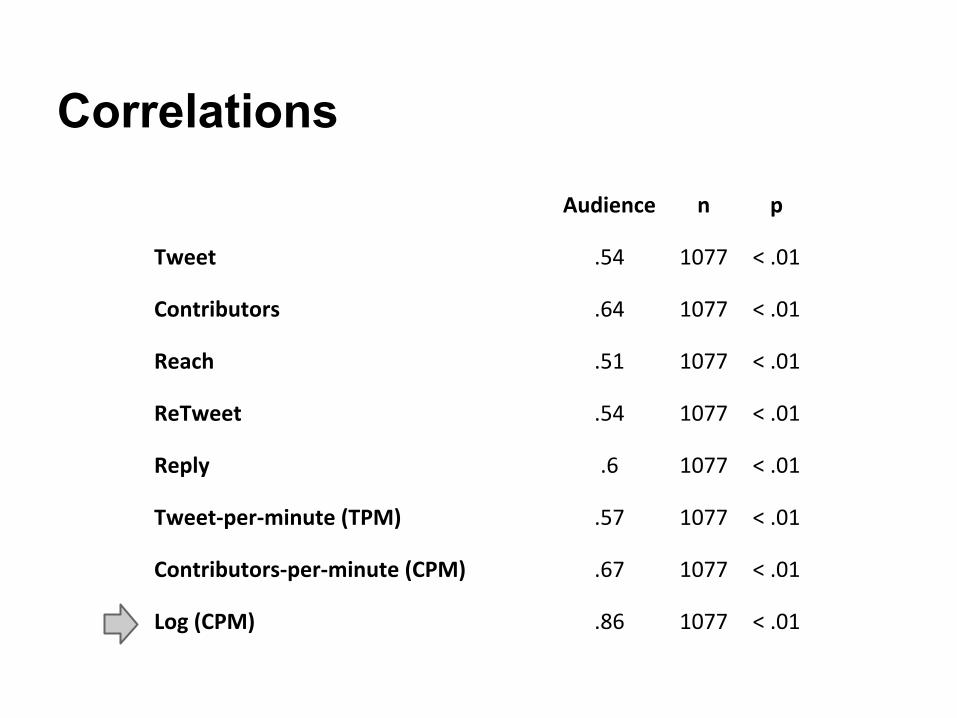
Correlations
Audience n p
Tweet .54 1077 < .01
Contributors .64 1077 < .01
Reach .51 1077 < .01
ReTweet .54 1077 < .01
Reply .6 1077 < .01
Tweet-per-minute (TPM) .57 1077 < .01
Contributors-per-minute (CPM) .67 1077 < .01
Log (CPM) .86 1077 < .01

Results (1/3)
1. Over the eight different metrics tested, the
observed correlation coefficient with the
audience was > 0.5;
2. The rate of Tweet per minute (TPM) and
contributors per minute (CPM) correlate
remarkably well with audience (when log
transformed respectively r=0.83 and 0.86) thus
suggesting a strong non linear correlation;
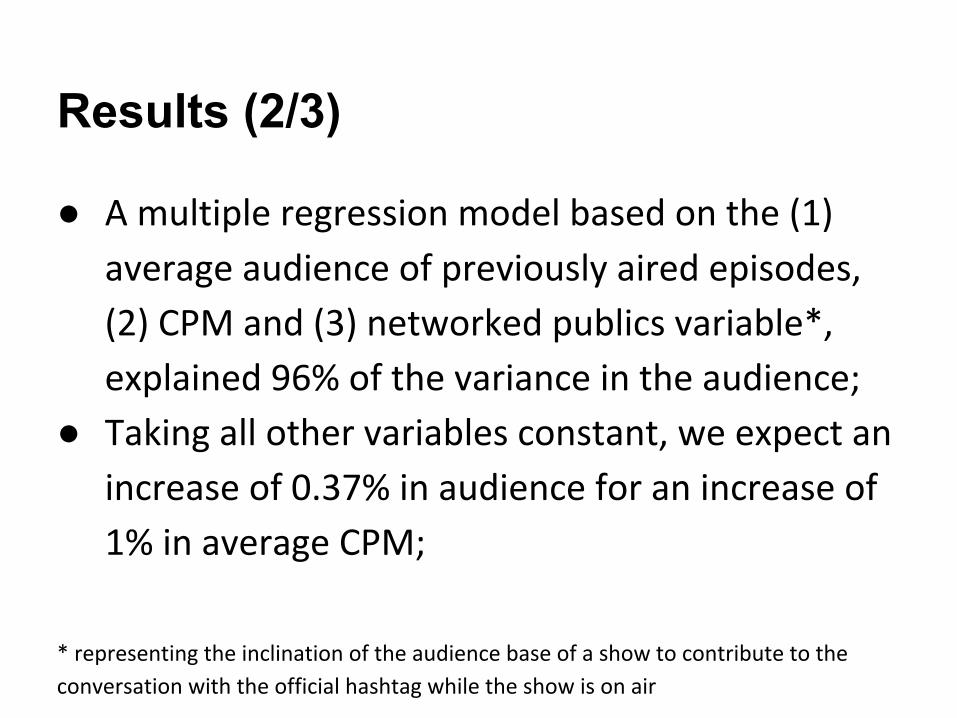
Results (2/3)
● A multiple regression model based on the (1)
average audience of previously aired episodes,
(2) CPM and (3) networked publics variable*,
explained 96% of the variance in the audience;
● Taking all other variables constant, we expect an
increase of 0.37% in audience for an increase of
1% in average CPM;
* representing the inclination of the audience base of a show to contribute to the
conversation with the official hashtag while the show is on air
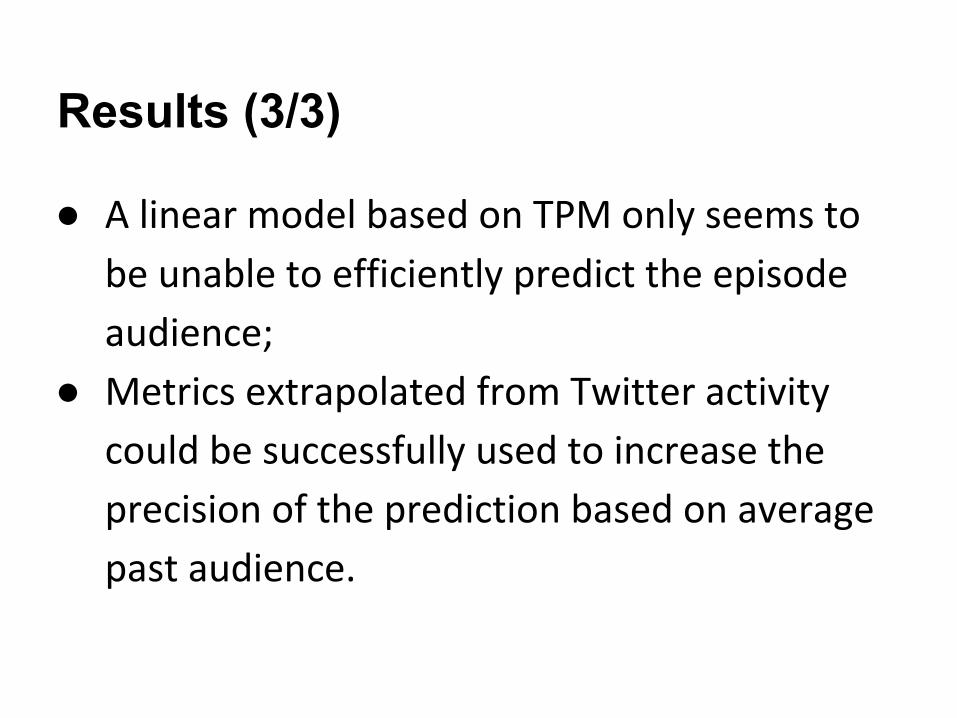
Results (3/3)
● A linear model based on TPM only seems to
be unable to efficiently predict the episode
audience;
● Metrics extrapolated from Twitter activity
could be successfully used to increase the
precision of the prediction based on average
past audience.

Audience vs Political Participation
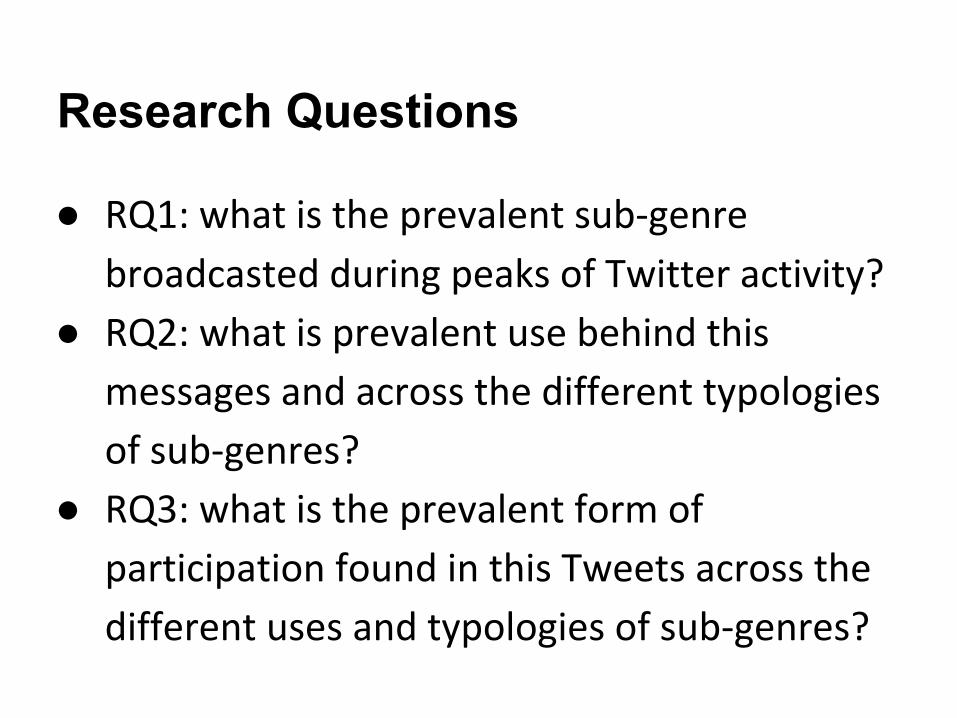
Research Questions
● RQ1: what is the prevalent sub-genre
broadcasted during peaks of Twitter activity?
● RQ2: what is prevalent use behind this
messages and across the different typologies
of sub-genres?
● RQ3: what is the prevalent form of
participation found in this Tweets across the
different uses and typologies of sub-genres?

Dataset
● 11 political talk-shows;
● Raw n. of Tweets collected: 2,489,669 (76% onair - 187.031
unique onair contributors);
● 1,076 episodes with Twitter (tweet, rt, reply, contributors,
reach, original tweets) metrics and audience ratings;
● Twitter metrics per minutes from 30 August 2012 to 30 June
2013 (n=439,204).
Definitions
● Original Tweets < Tweet-(RT+Reply);
● Engagement < Peaks in Original Tweets;
● Window < span of n minutes around the peak;
● TV scene < excerpt of a TV program aired
during a window.
Methods
● Peaks detection (Marcus et al 2011);
● Text-mining of Tweets created during each window to find
the top 5 frequently used term (tf-idf) and automatic label
the window;
● Manual classification of windows in six typologies of political
talk-shows sub-genres broadcasted during the corresponding
scene;
● Content analysis of Tweets (in the context of the scene)
created during one window for each sub-genre.

RQ1 ResultsVARIABLE N AVERAGE TWEETS
AVERAGE WINDOW SPAN
(MINUTE)AVERAGE TWEETS-PER-MINUTE
Group discussion 135 501 3 163.9
Interview 86 1,876 3 584.6
One-on-one interview 51 768 2.6 288.6
Pre-recorded video 5 525 2.8 184.7
Satire 5 258 2.4 176.2
External intervention 4 696 5.5 194.4

RQ2 Sampling
PEAK TIME TWEETS ORIGINAL TWEETS SPAN (MINUTE)
Group discussion 11/10/2012 22:36 123 102 1
Interview 04/02/2013 21:56 151 103 1
One-on-one interview20/09/2012 21:53:03 843 598 7
Pre-recorded video16/05/2013 21:33:02 828 523 5
Satire05/02/2013 21:20:02 819 476 4
External intervention 21/03/2012 22:59 255 126 1
3,019 2,017

Codebook
FORM
Objectivity Subjectivity
CONTENT Inbound Attention seeking Emotion
Outbound Pure
information
Interpretation
Objectivised
opinion
Opinion
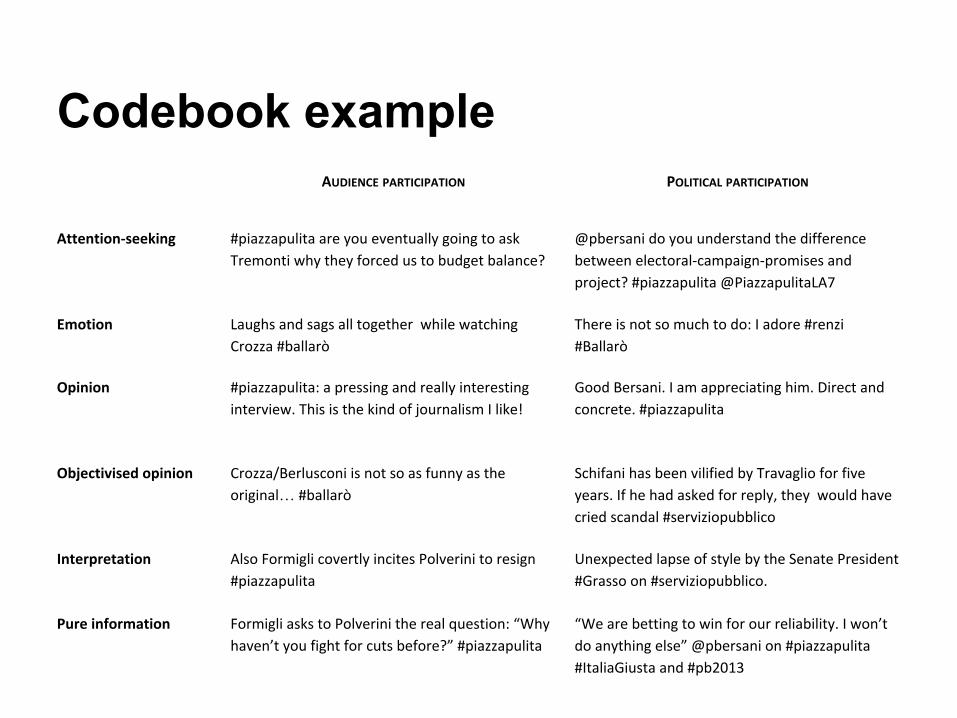
Codebook example AUDIENCE PARTICIPATION POLITICAL PARTICIPATION
Attention-seeking #piazzapulita are you eventually going to ask
Tremonti why they forced us to budget balance?
@pbersani do you understand the difference
between electoral-campaign-promises and
project? #piazzapulita @PiazzapulitaLA7
Emotion Laughs and sags all together while watching
Crozza #ballarò
There is not so much to do: I adore #renzi
#Ballarò
Opinion #piazzapulita: a pressing and really interesting
interview. This is the kind of journalism I like!
Good Bersani. I am appreciating him. Direct and
concrete. #piazzapulita
Objectivised opinion Crozza/Berlusconi is not so as funny as the
original… #ballarò
Schifani has been vilified by Travaglio for five
years. If he had asked for reply, they would have
cried scandal #serviziopubblico
Interpretation Also Formigli covertly incites Polverini to resign
#piazzapulita
Unexpected lapse of style by the Senate President
#Grasso on #serviziopubblico.
Pure information Formigli asks to Polverini the real question: “Why
haven’t you fight for cuts before?” #piazzapulita
“We are betting to win for our reliability. I won’t
do anything else” @pbersani on #piazzapulita
#ItaliaGiusta and #pb2013
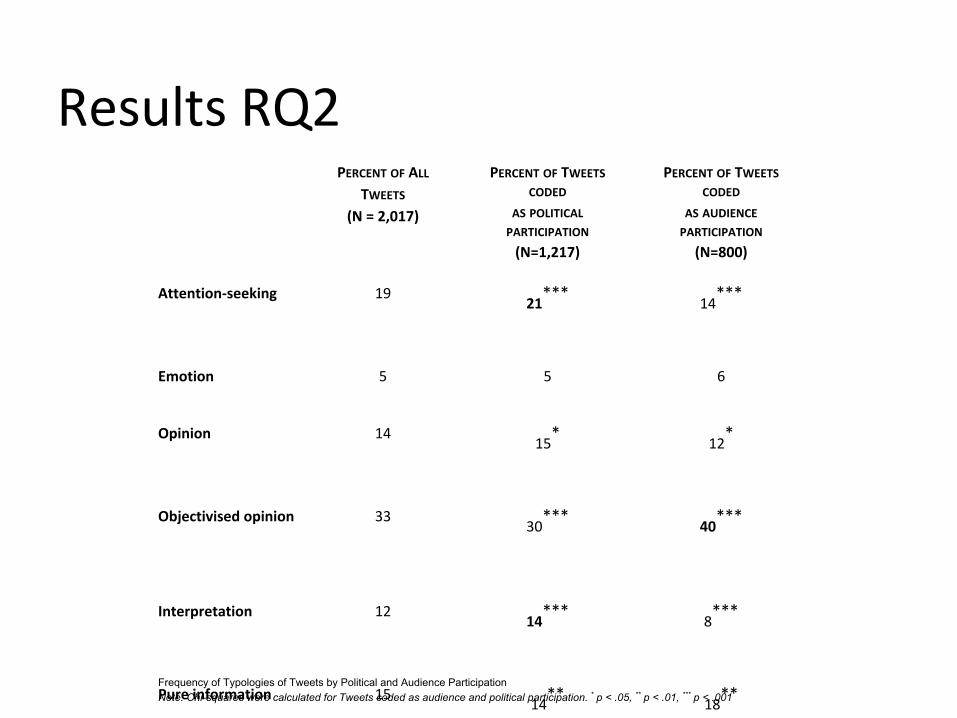
Results RQ2 PERCENT OF ALL
TWEETS
(N = 2,017)
PERCENT OF TWEETS CODED
AS POLITICAL PARTICIPATION
(N=1,217)
PERCENT OF TWEETS CODED
AS AUDIENCE PARTICIPATION
(N=800)
Attention-seeking 1921
***14
***
Emotion 5 5 6
Opinion 1415
*12
*
Objectivised opinion 3330
***40
***
Interpretation 1214
***8
***
Pure information 1514
**18
**Frequency of Typologies of Tweets by Political and Audience ParticipationNote: Chi-squares were calculated for Tweets coded as audience and political participation. * p < .05, ** p < .01, *** p < .001
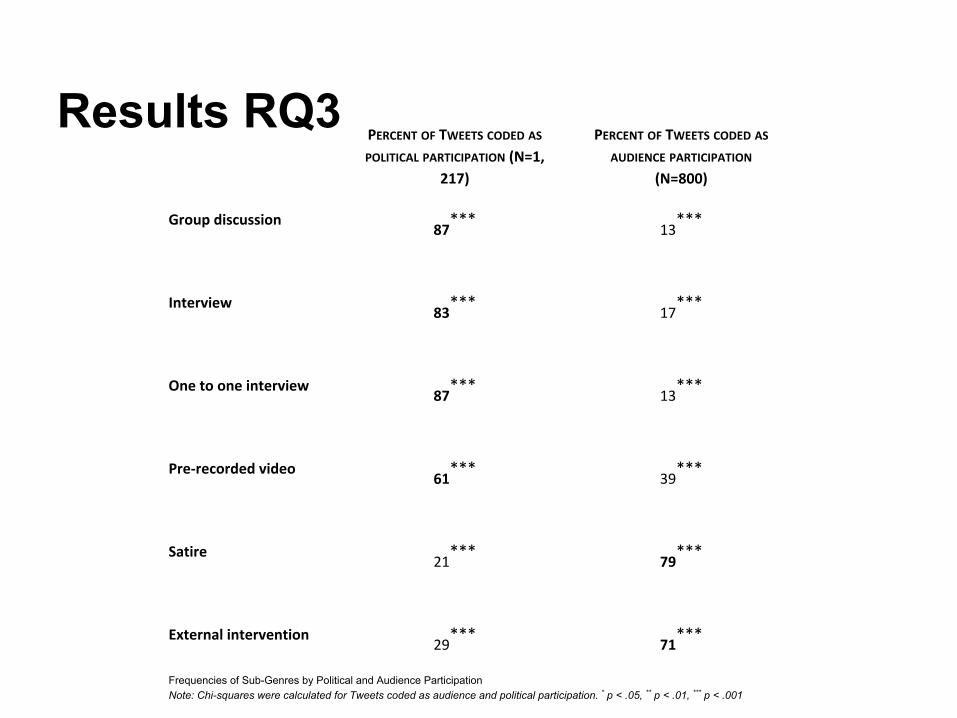
Results RQ3 PERCENT OF TWEETS CODED AS
POLITICAL PARTICIPATION (N=1,
217)
PERCENT OF TWEETS CODED AS
AUDIENCE PARTICIPATION
(N=800)
Group discussion87
***13
***
Interview83
***17
***
One to one interview87
***13
***
Pre-recorded video61
***39
***
Satire21
***79
***
External intervention29
***71
***
Frequencies of Sub-Genres by Political and Audience ParticipationNote: Chi-squares were calculated for Tweets coded as audience and political participation. * p < .05, ** p < .01, *** p < .001
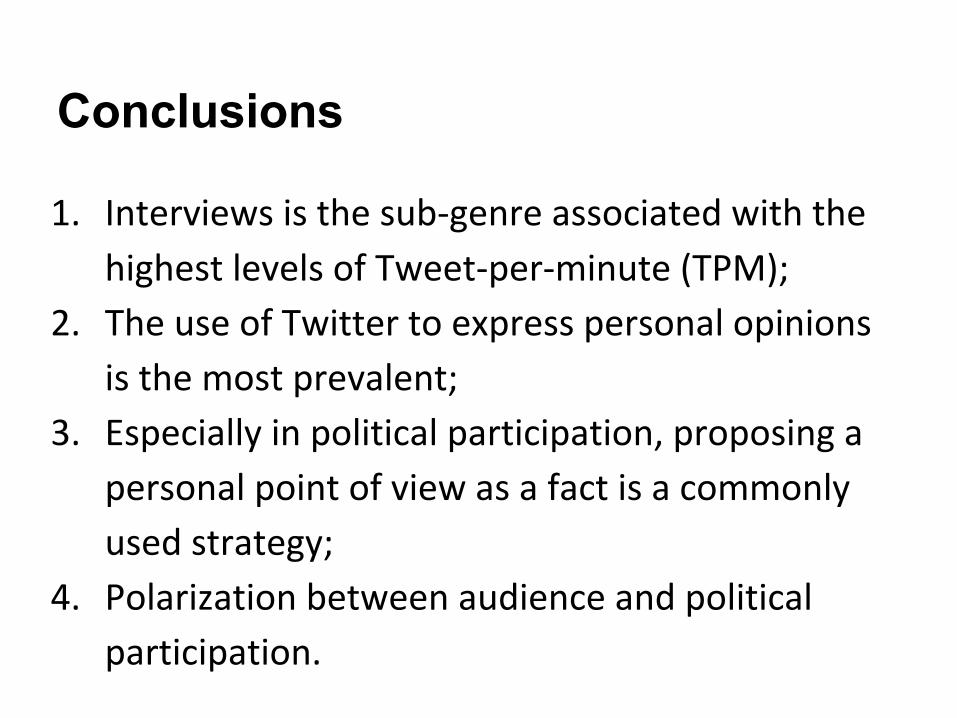
Conclusions
1. Interviews is the sub-genre associated with the
highest levels of Tweet-per-minute (TPM);
2. The use of Twitter to express personal opinions
is the most prevalent;
3. Especially in political participation, proposing a
personal point of view as a fact is a commonly
used strategy;
4. Polarization between audience and political
participation.

Hybrid Space of Politics
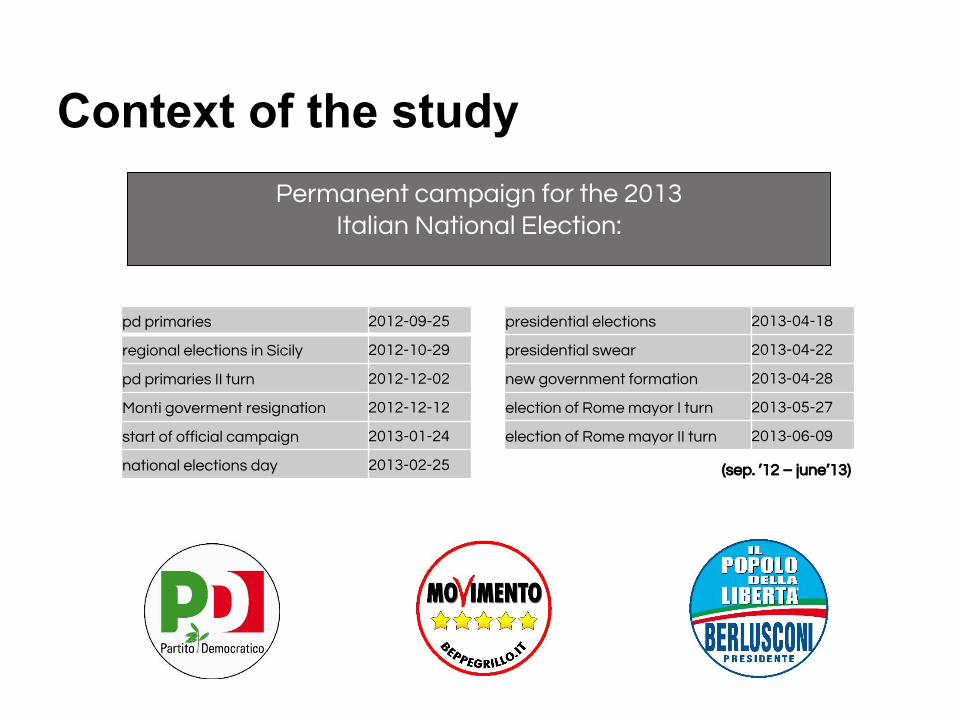
Permanent campaign for the 2013Italian National Election:
pd primaries 2012-09-25
regional elections in Sicily 2012-10-29
pd primaries II turn 2012-12-02
Monti goverment resignation 2012-12-12
start of official campaign 2013-01-24
national elections day 2013-02-25
presidential elections 2013-04-18
presidential swear 2013-04-22
new government formation 2013-04-28
election of Rome mayor I turn 2013-05-27
election of Rome mayor II turn 2013-06-09
(sep. ’12 – june’13)
Context of the study

Research Questions
Q1: What was the number of active contributors to
conversations ignited by political talk-shows in Italy during the
permanent campaign? How this number compares to the TV
audience of this shows and to Twitter in Italy figures?
Q2: Are the show host or staff, politicians and non political
guests taking part to the online conversation around their
shows?
Q3: Is the form of participation activated by ‘connected
audiences’ affected by the political party talked about?
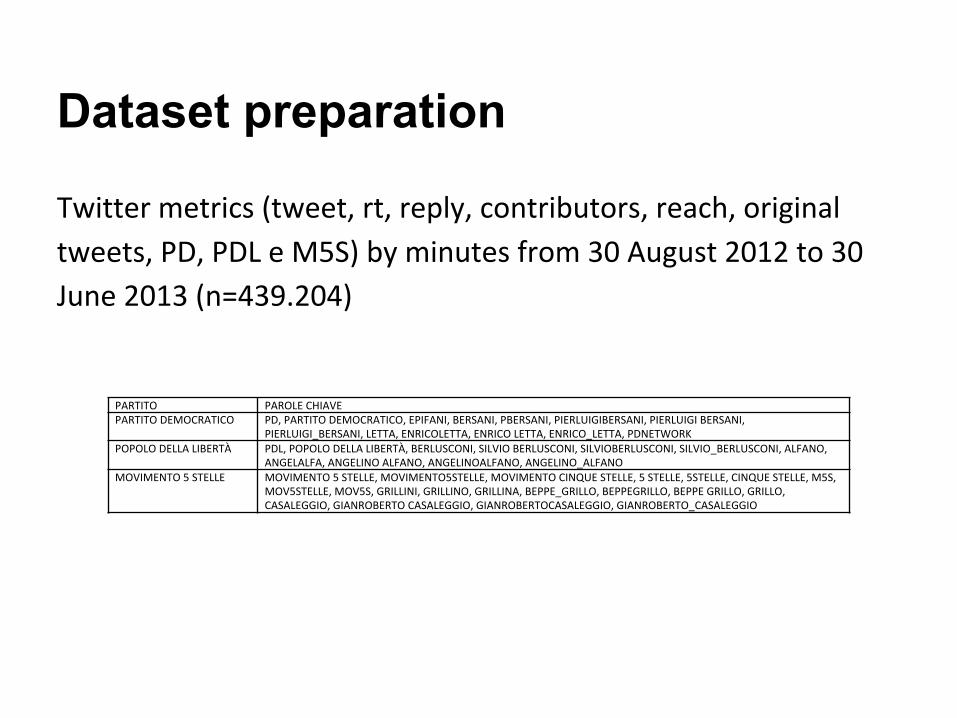
PARTITO PAROLE CHIAVEPARTITO DEMOCRATICO PD, PARTITO DEMOCRATICO, EPIFANI, BERSANI, PBERSANI, PIERLUIGIBERSANI, PIERLUIGI BERSANI,
PIERLUIGI_BERSANI, LETTA, ENRICOLETTA, ENRICO LETTA, ENRICO_LETTA, PDNETWORKPOPOLO DELLA LIBERTÀ PDL, POPOLO DELLA LIBERTÀ, BERLUSCONI, SILVIO BERLUSCONI, SILVIOBERLUSCONI, SILVIO_BERLUSCONI, ALFANO,
ANGELALFA, ANGELINO ALFANO, ANGELINOALFANO, ANGELINO_ALFANOMOVIMENTO 5 STELLE MOVIMENTO 5 STELLE, MOVIMENTO5STELLE, MOVIMENTO CINQUE STELLE, 5 STELLE, 5STELLE, CINQUE STELLE, M5S,
MOV5STELLE, MOV5S, GRILLINI, GRILLINO, GRILLINA, BEPPE_GRILLO, BEPPEGRILLO, BEPPE GRILLO, GRILLO, CASALEGGIO, GIANROBERTO CASALEGGIO, GIANROBERTOCASALEGGIO, GIANROBERTO_CASALEGGIO
Twitter metrics (tweet, rt, reply, contributors, reach, original
tweets, PD, PDL e M5S) by minutes from 30 August 2012 to 30
June 2013 (n=439.204)
Dataset preparation

Party related conversations

SAMPLEDALL
8,031 Tweets
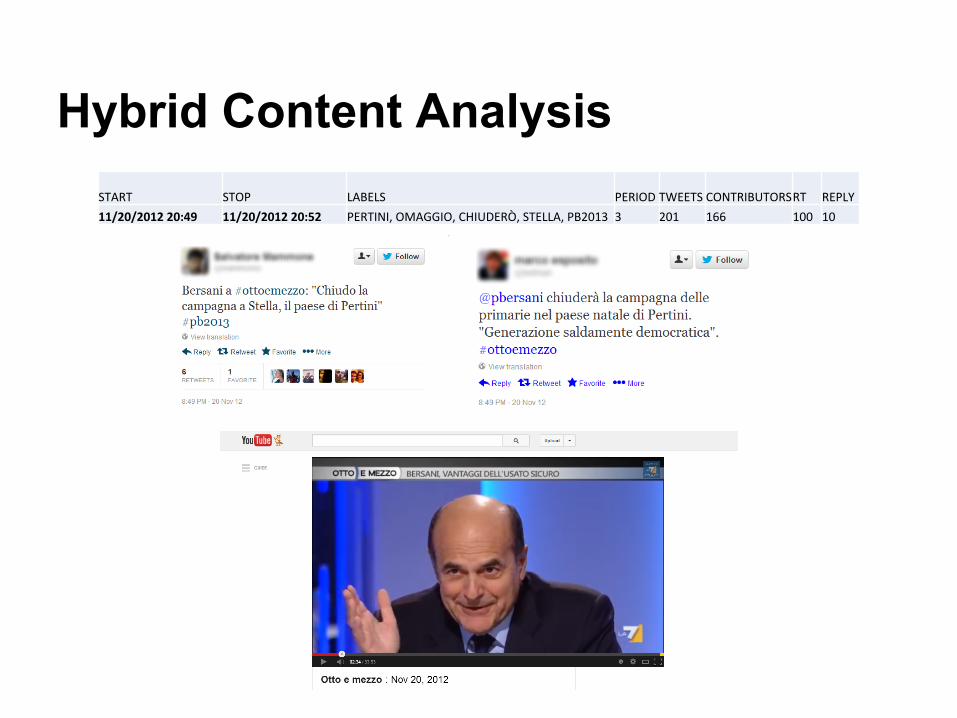
START STOP LABELS PERIOD TWEETS CONTRIBUTORSRT REPLY
11/20/2012 20:49 11/20/2012 20:52 PERTINI, OMAGGIO, CHIUDERÒ, STELLA, PB2013 3 201 166 100 10
Hybrid Content Analysis
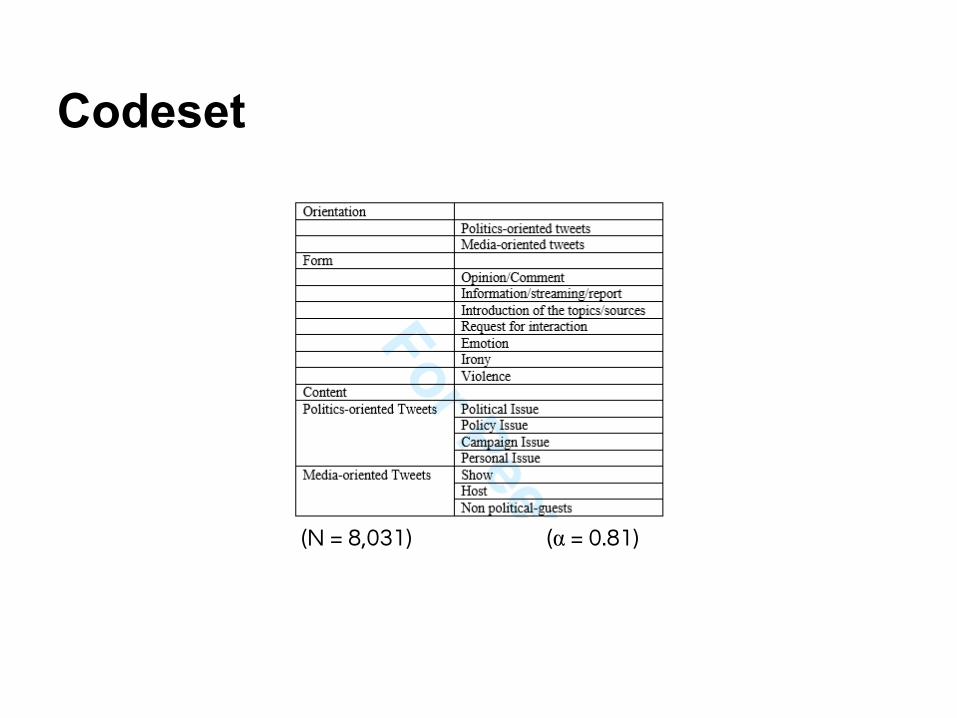
(α = 0.81)(N = 8,031)
Codeset

Q3. Is the form of participation activated by ‘connected audiences’ affected by the political
party talked about?
Data Analysis
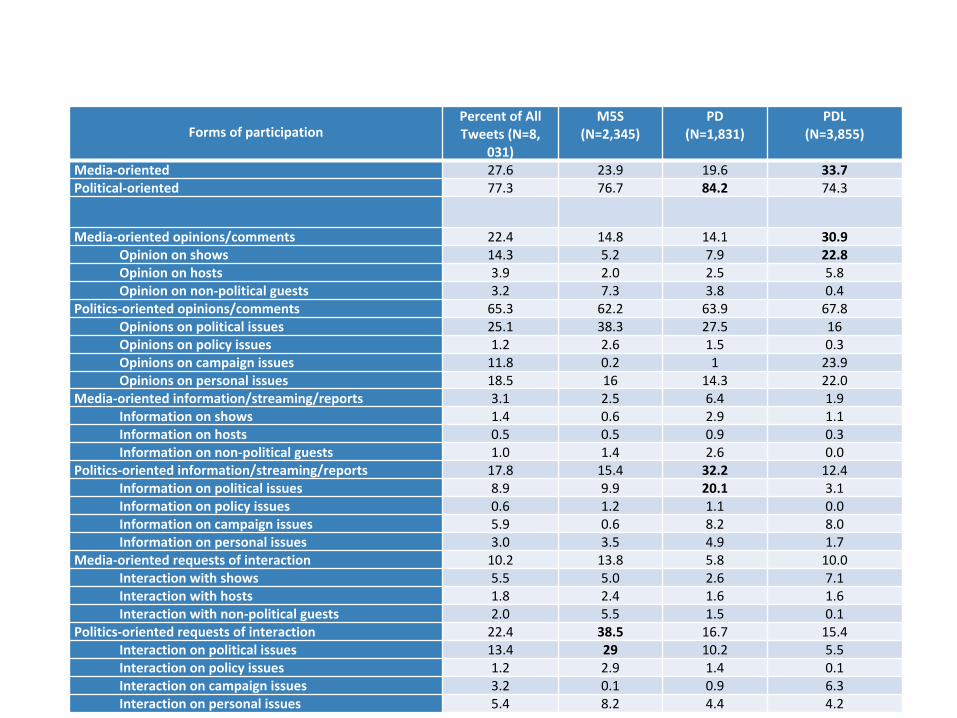
Forms of participationPercent of All Tweets (N=8,
031)
M5S(N=2,345)
PD(N=1,831)
PDL(N=3,855)
Media-oriented 27.6 23.9 19.6 33.7Political-oriented 77.3 76.7 84.2 74.3
Media-oriented opinions/comments 22.4 14.8 14.1 30.9Opinion on shows 14.3 5.2 7.9 22.8Opinion on hosts 3.9 2.0 2.5 5.8Opinion on non-political guests 3.2 7.3 3.8 0.4
Politics-oriented opinions/comments 65.3 62.2 63.9 67.8Opinions on political issues 25.1 38.3 27.5 16Opinions on policy issues 1.2 2.6 1.5 0.3Opinions on campaign issues 11.8 0.2 1 23.9Opinions on personal issues 18.5 16 14.3 22.0
Media-oriented information/streaming/reports 3.1 2.5 6.4 1.9Information on shows 1.4 0.6 2.9 1.1Information on hosts 0.5 0.5 0.9 0.3Information on non-political guests 1.0 1.4 2.6 0.0
Politics-oriented information/streaming/reports 17.8 15.4 32.2 12.4Information on political issues 8.9 9.9 20.1 3.1Information on policy issues 0.6 1.2 1.1 0.0Information on campaign issues 5.9 0.6 8.2 8.0Information on personal issues 3.0 3.5 4.9 1.7
Media-oriented requests of interaction 10.2 13.8 5.8 10.0Interaction with shows 5.5 5.0 2.6 7.1Interaction with hosts 1.8 2.4 1.6 1.6Interaction with non-political guests 2.0 5.5 1.5 0.1
Politics-oriented requests of interaction 22.4 38.5 16.7 15.4Interaction on political issues 13.4 29 10.2 5.5Interaction on policy issues 1.2 2.9 1.4 0.1Interaction on campaign issues 3.2 0.1 0.9 6.3Interaction on personal issues 5.4 8.2 4.4 4.2
The overall volume of tweets quoting the three main parties followed media agenda. Talk shows agenda and the ‘older’ mediatization of politics (media events, spectacularization of inner struggles) influenced the volume of tweets produced around the three parties.
Both the form and the content of the online conversations around political talk-shows, seems to be affected by the political party talked about. However, going beyond numbers, the observed differences, once again, appear to be mainly driven by political and media events more than by the political party itself.
Conclusions
Understanding TV Genre Engagement and Willingness to Speak Up

Research Questions
- RQ1. What are specific moments of political talk show ”Servizio Pubblico” as well as of the entertainment Tv format “XFactor” that trigger audience engagement?
- RQ2. What are the most significant elements of continuity or discontinuity between these Tv show-based active audience regarding contents or communicative styles?
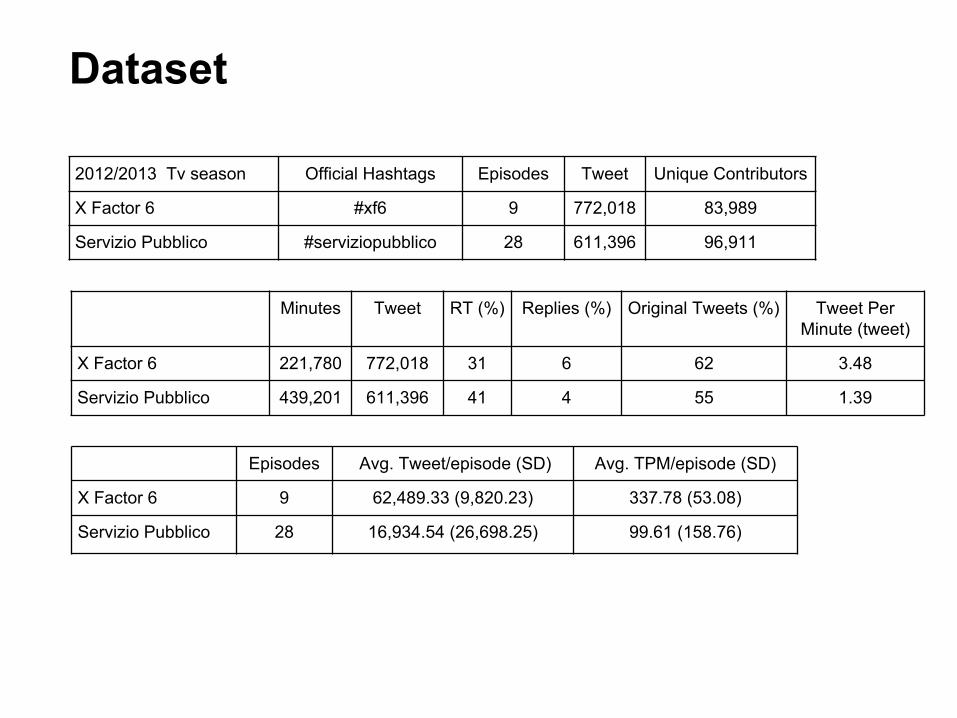
Dataset
2012/2013 Tv season Official Hashtags Episodes Tweet Unique Contributors
X Factor 6 #xf6 9 772,018 83,989
Servizio Pubblico #serviziopubblico 28 611,396 96,911
Minutes Tweet RT (%) Replies (%) Original Tweets (%) Tweet Per Minute (tweet)
X Factor 6 221,780 772,018 31 6 62 3.48
Servizio Pubblico 439,201 611,396 41 4 55 1.39
Episodes Avg. Tweet/episode (SD) Avg. TPM/episode (SD)
X Factor 6 9 62,489.33 (9,820.23) 337.78 (53.08)
Servizio Pubblico 28 16,934.54 (26,698.25) 99.61 (158.76)
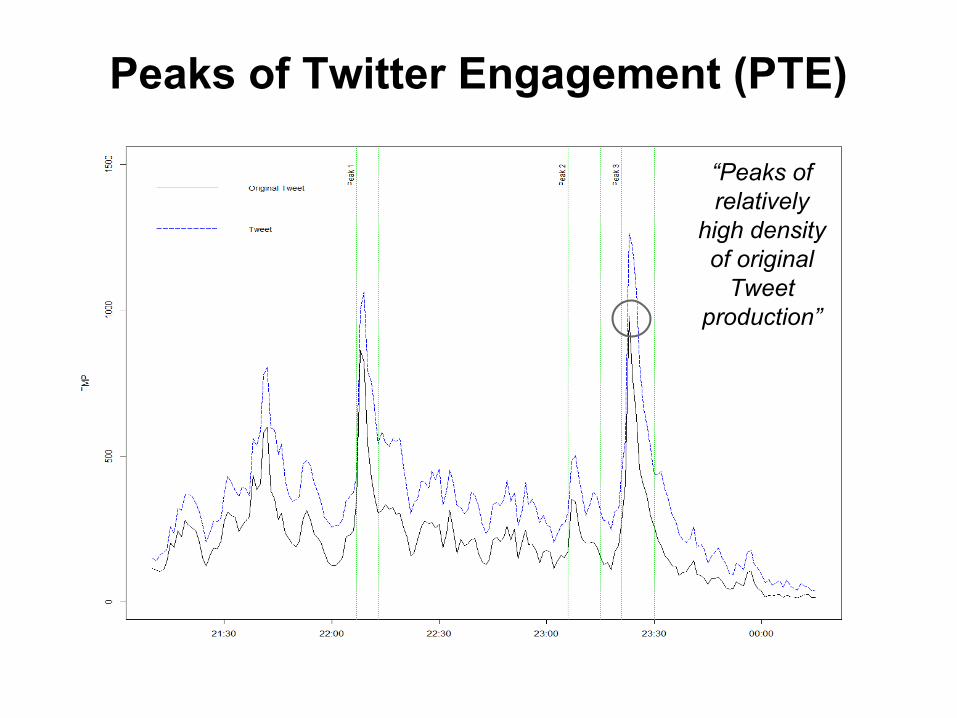
Peaks of Twitter Engagement (PTE)
“Peaks of relatively
high density of original
Tweet production”

Peak Analysis: Procedure & Codeset
TV scene summary
Routine of the show
Luhmann’s media system “selector”
criteria
Tweet RT @replies Original tweet
TPM

RQ1 Data Analysis (1/3)
Peaks (N) Surprise - break with existing expectations (%)
Suspense - space of limited possibilities kept open (%)
X Factor 6 16 50 56.2
Servizio Pubblico 39 48.7 5.1
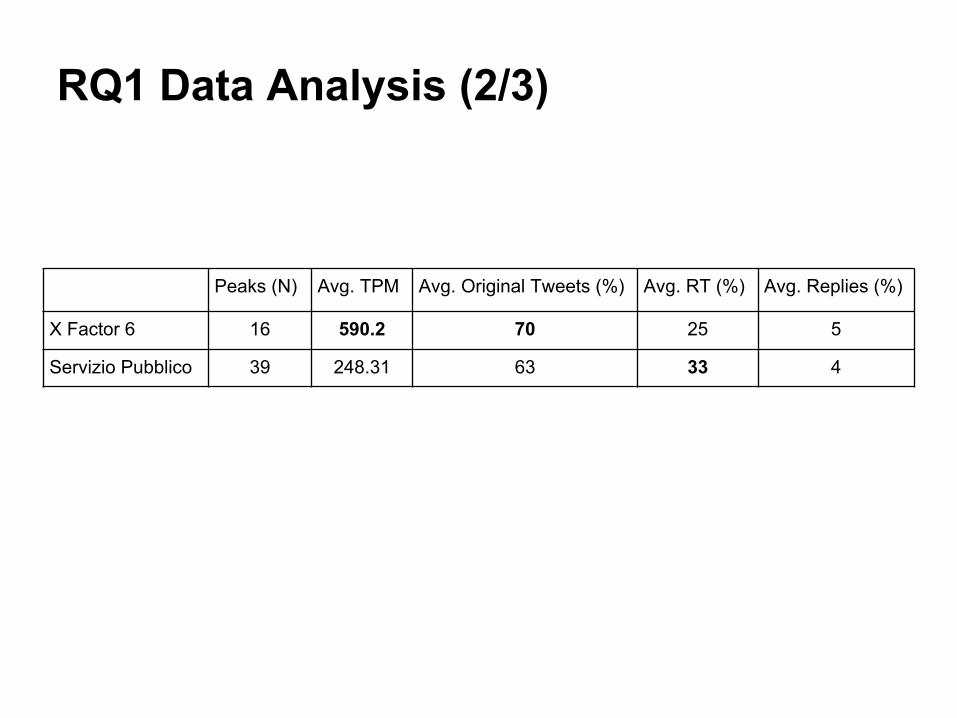
RQ1 Data Analysis (2/3)
Peaks (N) Avg. TPM Avg. Original Tweets (%) Avg. RT (%) Avg. Replies (%)
X Factor 6 16 590.2 70 25 5
Servizio Pubblico 39 248.31 63 33 4
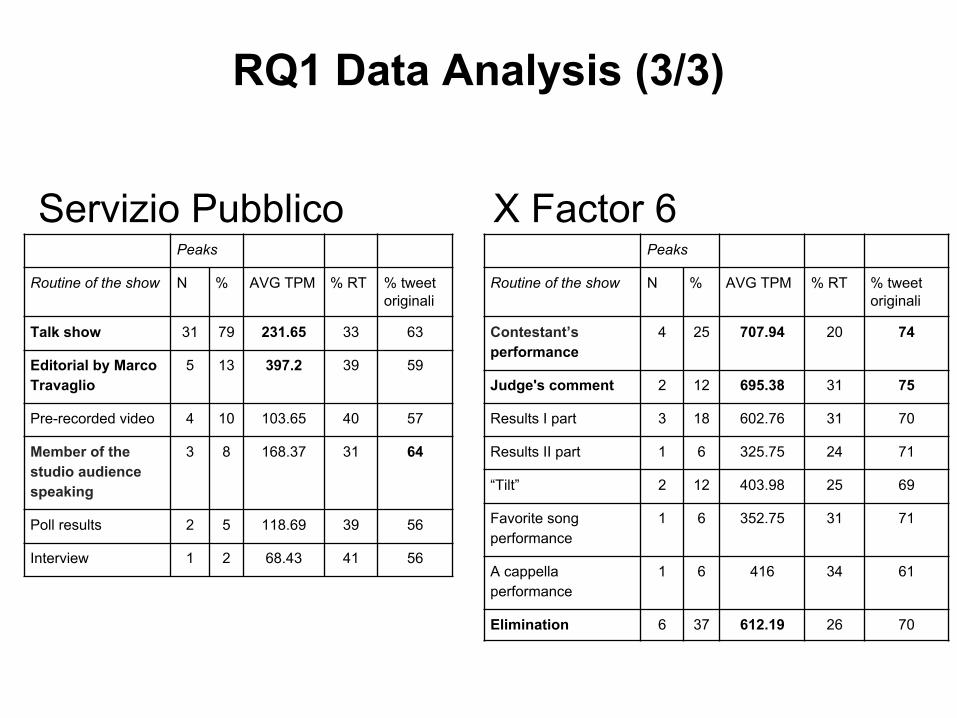
X Factor 6Servizio PubblicoPeaks
Routine of the show N % AVG TPM % RT % tweet originali
Talk show 31 79 231.65 33 63
Editorial by Marco Travaglio
5 13 397.2 39 59
Pre-recorded video 4 10 103.65 40 57
Member of the studio audience speaking
3 8 168.37 31 64
Poll results 2 5 118.69 39 56
Interview 1 2 68.43 41 56
Peaks
Routine of the show N % AVG TPM % RT % tweet originali
Contestant’s performance
4 25 707.94 20 74
Judge's comment 2 12 695.38 31 75
Results I part 3 18 602.76 31 70
Results II part 1 6 325.75 24 71
“Tilt” 2 12 403.98 25 69
Favorite song performance
1 6 352.75 31 71
A cappella performance
1 6 416 34 61
Elimination 6 37 612.19 26 70
RQ1 Data Analysis (3/3)

Research Questions
- RQ1. What are specific moments of political talk show ”Servizio Pubblico” as well as of the entertainment Tv format “XFactor” that trigger audiences engagement?
- RQ2. What are the most significant elements of continuity or discontinuity between these Tv show-based active audiences regarding contents or communicative styles?- RQ2a. Do people tend to delegate and/or cover up the
expression of opinions, when the show deals with politics rather than entertainment?
- RQ2b. Is there a significant difference in the amount of Twitter expressions combined with informations when looking at peaks with high or low percentages of original tweets?
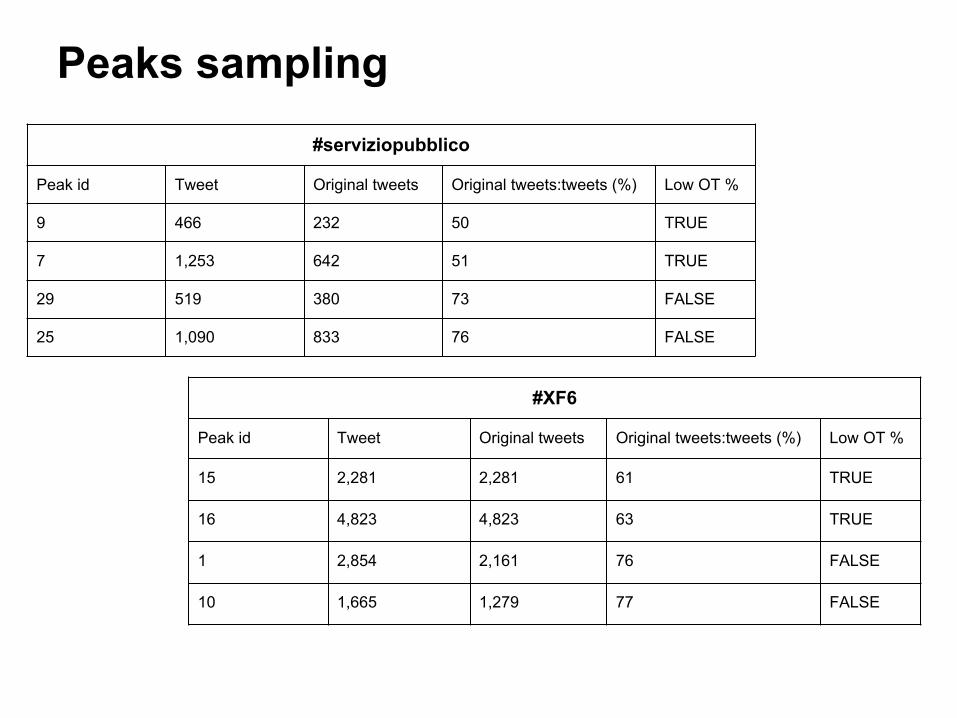
Peaks sampling#serviziopubblico
Peak id Tweet Original tweets Original tweets:tweets (%) Low OT %
9 466 232 50 TRUE
7 1,253 642 51 TRUE
29 519 380 73 FALSE
25 1,090 833 76 FALSE
#XF6
Peak id Tweet Original tweets Original tweets:tweets (%) Low OT %
15 2,281 2,281 61 TRUE
16 4,823 4,823 63 TRUE
1 2,854 2,161 76 FALSE
10 1,665 1,279 77 FALSE
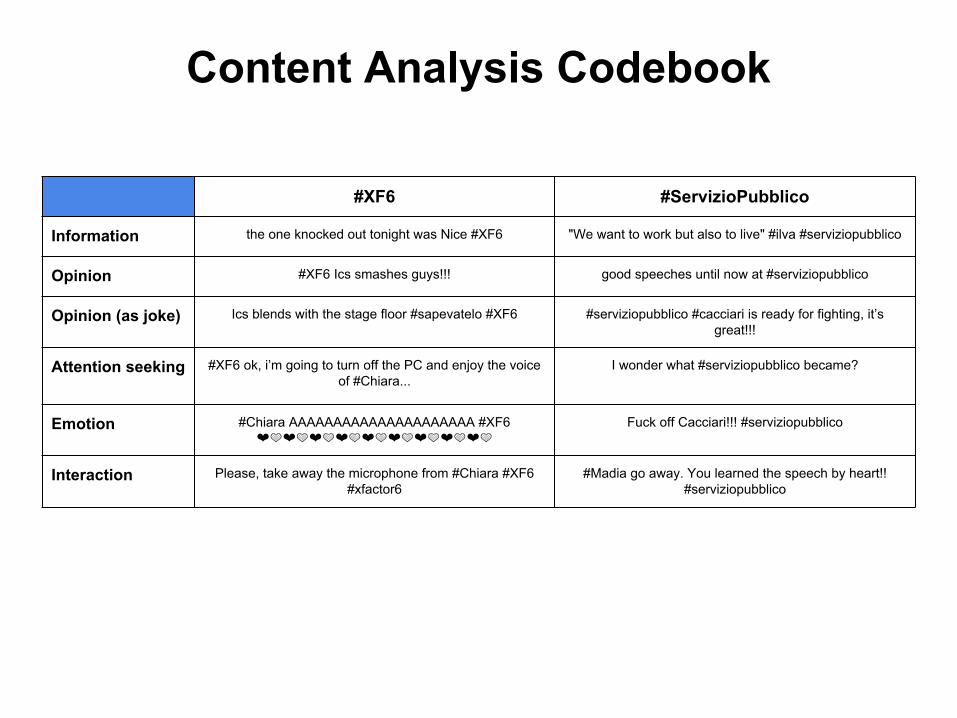
Content Analysis Codebook
#XF6 #ServizioPubblico
Information the one knocked out tonight was Nice #XF6 "We want to work but also to live" #ilva #serviziopubblico
Opinion #XF6 Ics smashes guys!!! good speeches until now at #serviziopubblico
Opinion (as joke) Ics blends with the stage floor #sapevatelo #XF6 #serviziopubblico #cacciari is ready for fighting, it’s great!!!
Attention seeking #XF6 ok, i’m going to turn off the PC and enjoy the voice of #Chiara...
I wonder what #serviziopubblico became?
Emotion #Chiara AAAAAAAAAAAAAAAAAAAAA #XF6 ❤ ❤ ❤ ❤ ❤ ❤ ❤ ❤ ❤
Fuck off Cacciari!!! #serviziopubblico
Interaction Please, take away the microphone from #Chiara #XF6 #xfactor6
#Madia go away. You learned the speech by heart!! #serviziopubblico
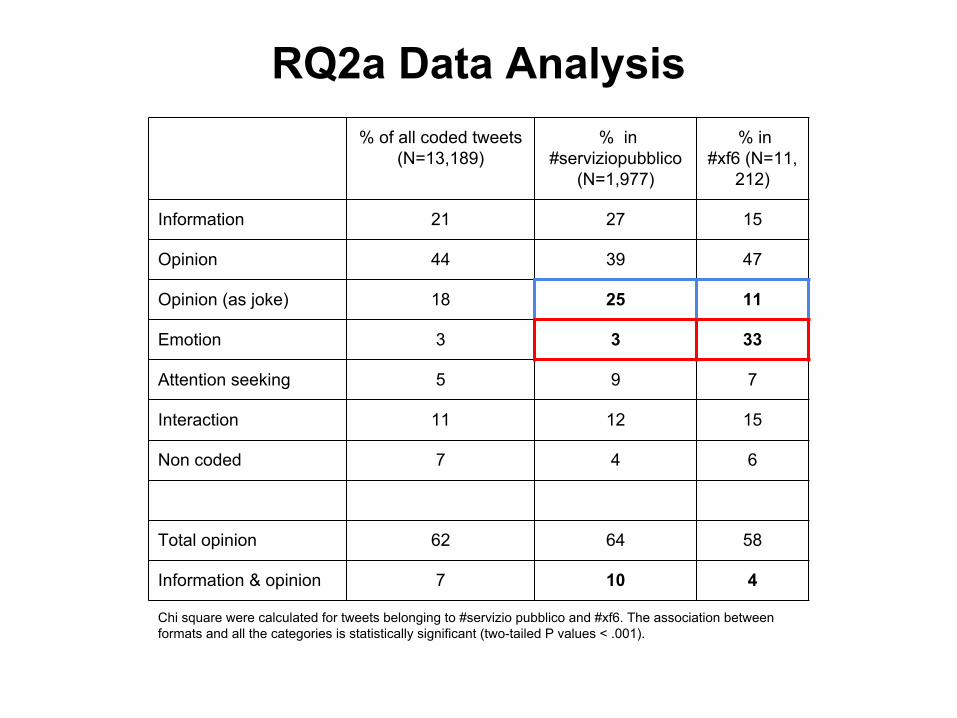
RQ2a Data Analysis% of all coded tweets
(N=13,189) % in
#serviziopubblico (N=1,977)
% in #xf6 (N=11,
212)
Information 21 27 15
Opinion 44 39 47
Opinion (as joke) 18 25 11
Emotion 3 3 33
Attention seeking 5 9 7
Interaction 11 12 15
Non coded 7 4 6
Total opinion 62 64 58
Information & opinion 7 10 4
Chi square were calculated for tweets belonging to #servizio pubblico and #xf6. The association between formats and all the categories is statistically significant (two-tailed P values < .001).

RQ2b Data Analysis
#serviziopubblico
Tweets in peaks with LOW Original Tweets (N=909)
Tweets in peaks with HIGH Original Tweets (N=1,068)
Information + opinion (%) 13* 7*
#XF6
Tweets in peaks with LOW Original Tweets (N=3,699)
Tweets in peaks with HIGH Original Tweets (N=7,513)
Information + opinion (%) 5 4
Chi square were calculated for tweets in low and high originali tweets. * p < .05, ** p < .01, *** p> .001

Conclusions (1/2)
1. Framing effect of Tv formats on Twitter active audiences
2. In both political and talent show, peaks of Twitter engagement are generated by surprise;
3. Suspense is a key engagement for talent show;4. Original tweets are more frequent during talent show
than political talk show thus suggesting a form of coaching participation. When an audience’s peer is on screen (member of in-studio audience or contestant) original tweets are also more frequent;

Conclusions (2/2)
5. Opinions are more frequently expressed as a joke or linked to information during political talk-shows rather than talent-shows;
6. In political talk-show, peaks with less original tweets also have more tweets coded as “information+opinion”;
7. Tweets expressing emotions are frequent during talent show and rare during political talk-shows.
Summary
1. Brief introduction to R and R Studio;2. Getting the data from Twitter Streaming API;3. Structure of a Twitter data-frame;4. Counting unique contributors;5. Counting RT and @replies;6. Creating a timeline chart;7. Detecting breakouts and peaks;8. Setup for a content analysis of tweets in a
peak.