Embed Size (px)
Citation preview

Map Technologies
PRESENTED BY
Joerg Reichert
Licensed under cc-by v3.0 (any jurisdiction)

Map concepts
{ "type": "Feature", "properties": { "name": "Oper", "url": "www.oper-leipzig.de/",
... }, "geometry": { "type": "Point", "coordinates": [ 12.381291389465332, 51.34005275863635 ] } }
Features

Map conceptsPoints

Map conceptsLabels / Hovers

Map conceptsLines
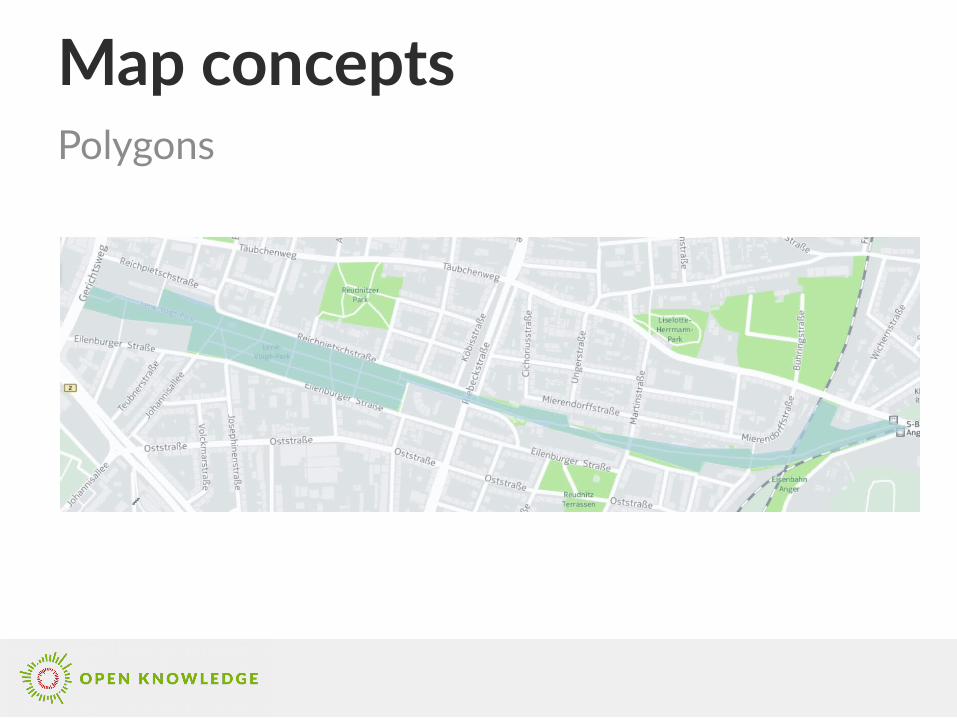
Map conceptsPolygons

Map conceptsStyles

Map conceptsZoom

Map conceptsBasemap

Map conceptsProjection

Map conceptsLayers

Map typesSimple

Map typesCategory Maps

Map typesChoropleth Maps

Map typesCluster

Map typesBubbles

Map typesDensity Maps

Map typesIntensity Map

Map typesHeat Maps

Map typesRaster Maps

Map typesTorque Maps – Animation, Transition over time
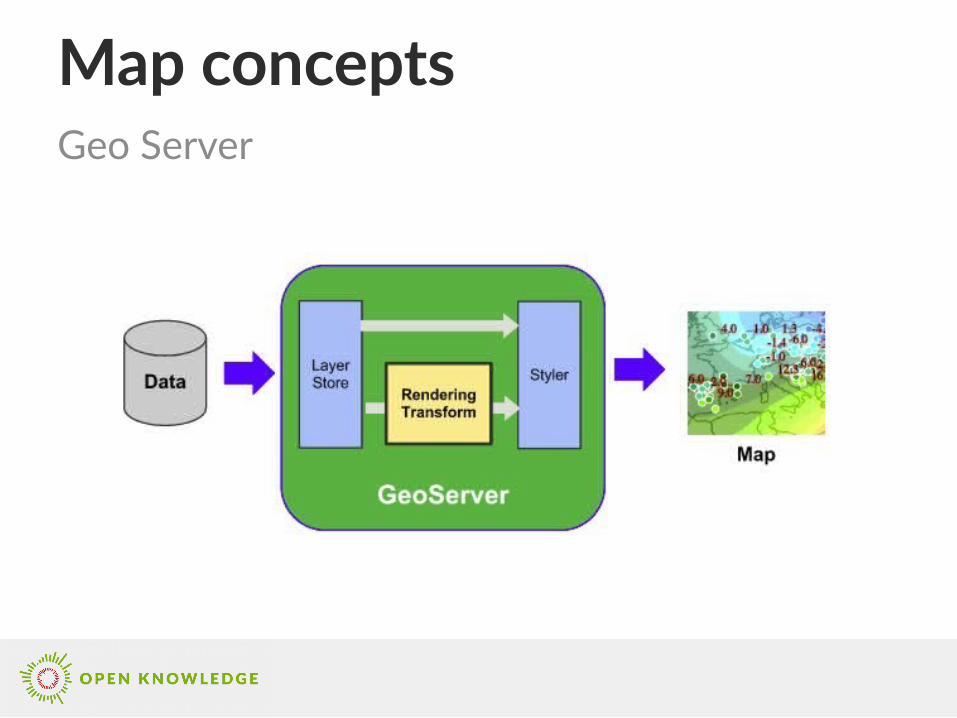
Map conceptsGeo Server
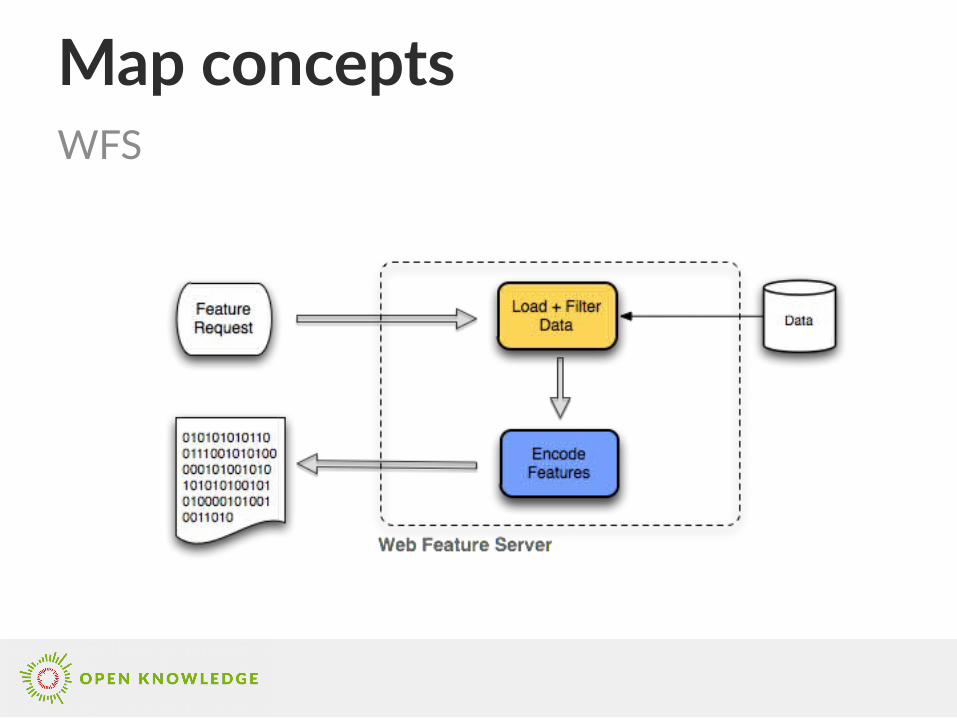
Map conceptsWFS

Map conceptsWMS
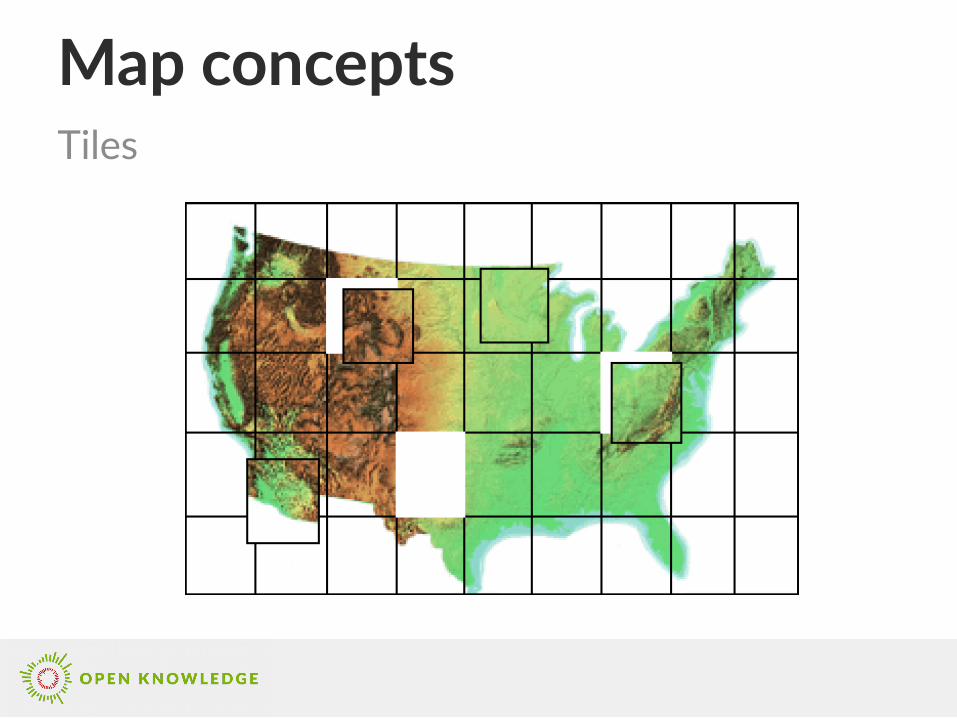
Map conceptsTiles

Map description standardsShapefile

Map description standards
<?xml version="1.0" encoding="UTF-8"?><kml xmlns="http://www.opengis.net/kml/2.2"> <Style id="MyStyle"> <IconStyle><Icon><href>icon.png</href></Icon></IconStyle> </Style> <Placemark> <name>Simple placemark</name> <description>...</description> <styleUrl>#MyStyle</styleUrl> <Point> <coordinates>-122.0822035425683,37.42228990140251,0</coordinates> </Point> </Placemark></kml>
KML

Map description standards
{ "type": "FeatureCollection", "features": [ { "type": "Feature", "properties": { "name": "Oper", "url": "www.oper-leipzig.de/" }, "geometry": { "type": "Point", "coordinates": [ 12.381291389465332, 51.34005275863635 ] } }, ...
GeoJSON
Map description standardsOthers

Web integrationMapbox GL JS
https://www.mapbox.com/mapbox-gl-js/

Web integrationCarto.JS
https://carto.com/docs/carto-engine/carto-js

Web integrationD3.js
https://d3js.org/
https://www.phase2technology.com/blog/using-d3-quadtrees-to-power-an-interactive-map-for-bonnier-corporation/

Map StylingWhat to style
● Symbolizer● Symbolizer rotation● Color● Label / Fonts● Hatching (Fill)● Line styles● Decorators● Placement● Border● Opacity

Map StylingInfluencer types
● Data driven styles● Interaction driven styles
● Zoom● Property values● Zoom and property
Influencers

Map Styling
<FeatureTypeStyle> <Rule> <PointSymbolizer> <Graphic> <Mark> <WellKnownName>circle</WellKnownName> <Fill> <CssParameter name="fill">#FF0000</CssParameter> </Fill> <Stroke> <CssParameter name="stroke">#000000</CssParameter> <CssParameter name="stroke-width">2</CssParameter> </Stroke> </Mark> <Size>6</Size> </Graphic> </PointSymbolizer> </Rule> </FeatureTypeStyle>
SLD
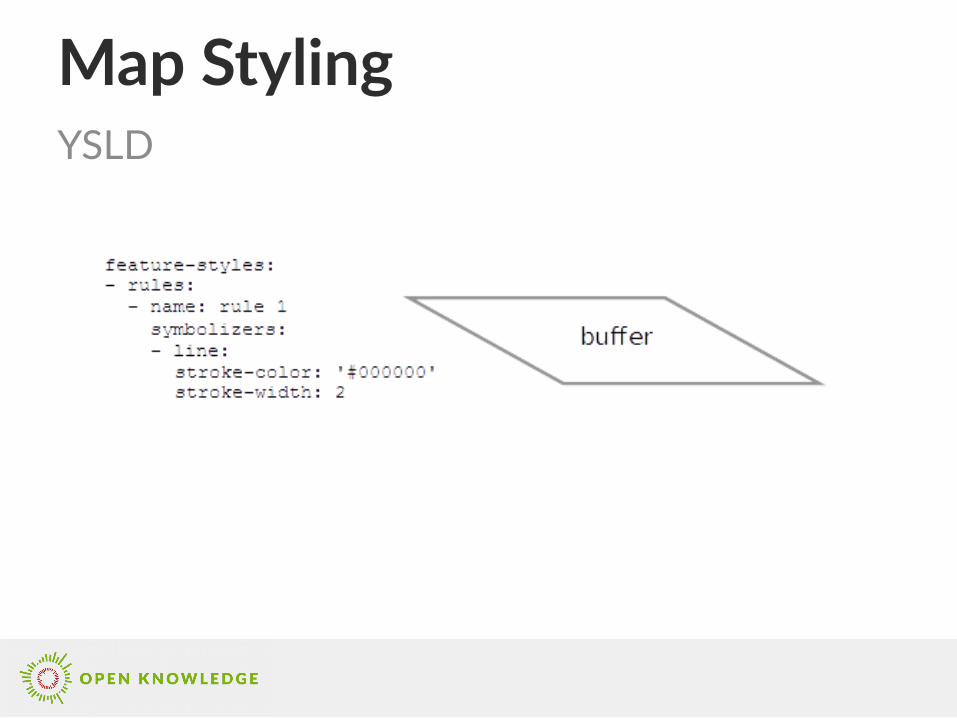
Map Styling
YSLD

Map StylingCarto CSS (discontinued) MapCSS

Map StylingMapbox GL JS Style API
visited.countries.forEach(function(country) { var id = country.name.replace(' ', '-').toLowerCase(); var countryLayer = { "id": id, "type": "fill", "source": "countries", "source-layer": "countries", "filter": ["==", "name", country.name], "paint": { "fill-color": "rgba(241,163,64," + alphaForYear(country.last) + ")" }, "interactive": true }; countryLayer["paint.selected-" + id] = { "fill-color": "red" }; style.layers.splice(3, 0, countryLayer);});

Map StylingD3.js
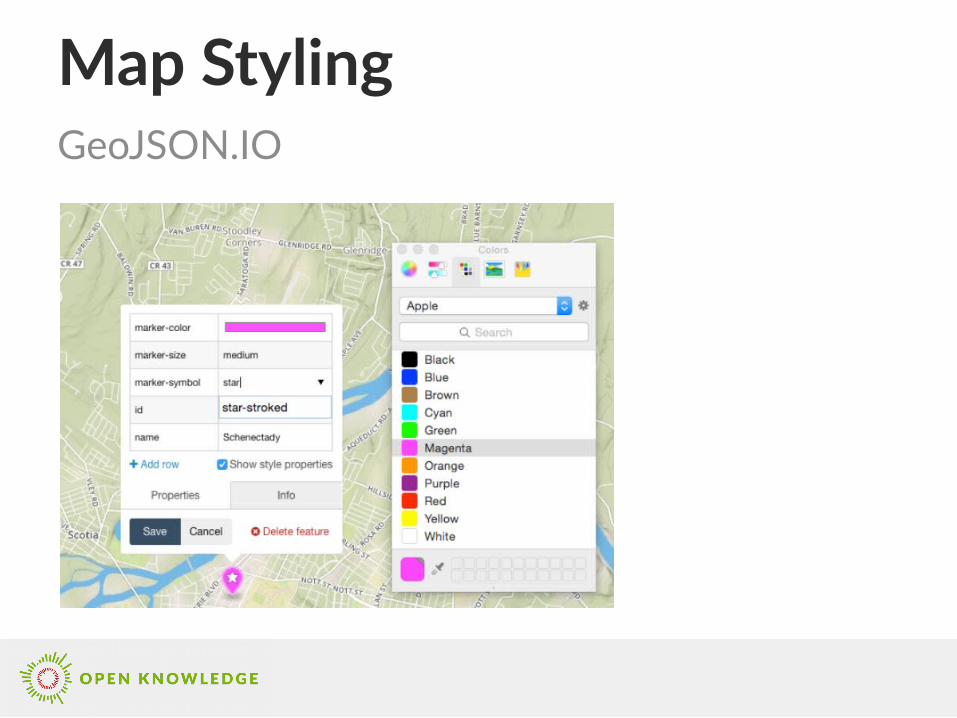
Map StylingGeoJSON.IO

Map InteractionClick / Hover

Map Interaction
● Feature (multi) selection● Search by properties ● Filtering● Feature property editing● Creating new features● Interaction with Forms● Interaction with Diagrams● Feature import / export
Other interactions

Map InteractionKiosk / Workbench

Map Data
● Google Maps● coodinates must be shown on Google Maps● coordinates must not be shown longer than 30 days● if the maps are free accessible, APIs are allowed to be used free of
charge● http://sun.exnatura.de/GM/coords.php
● OpenStreetMap● http://wiki.openstreetmap.org/wiki/Nominatim● http://boundingbox.klokantech.com/● https://geocode.xyz/
Geo Coding

Map Data
● http://noc.to/geodecode● http://www.geonames.org/export/reverse-geocoding.html● https://developers.google.com/maps/documentation/javascript/examples/g
eocoding-reverse?hl=de
Reverse Geo coding

Map Data
● http://www.landesvermessung.sachsen.de/inhalt/aaa/alkis/alkis.html● https://www.geomis.sachsen.de/● www.geoportal.de/● https://openaddresses.io/● www.geodatenzentrum.de/geodaten/
Sources

Map ToolsGeoJSON.IO

Map ToolsOverpass Turbo

Map Tools
● http://overpass-api.de (Language guide)● Finding possible keys and values to search for:
http://taginfo.openstreetmap.org/ ● http://wiki.openstreetmap.org/wiki/DE:Overpass_API/Beispielsammlung
Overpass Turbo associates

Javascript ToolsJSFiddle

Javascript ToolsBl.ocks

Javascript Tools
● Plunker: https://plnkr.co/● http://codepen.io● https://www.codeply.com/
Other tools

Journalism / Story telling
● https://github.com/MapStory/story-tools/● http://webkid.io/● https://github.com/wbkd/awesome-interactive-journalism● http://datenjournalist.de/● http://datadrivenjournalism.net/● http://datajournalismhandbook.org/● http://www.morgenpost.de/interaktiv/● http://katalog.datenjournalismus.net/● http://howto.ddjdach.de/
Examples