Embed Size (px)
Citation preview

Making sense of (big) data -visual analytics and provenance
Dr Kai Xu
Associate Professor in Data Analytics
Middlesex University, London, UK
[email protected] https://kaixu.me
Outline
• Introduction
• What is Sensemaking
• Supporting Sensemaking: VAST Challenge 2014
• What is (Analytic) Provenance
• Navigating Big Data: SenseMap

Outline
• Introduction
• What is Sensemaking
• Supporting Sensemaking: VAST Challenge 2014
• What is (Analytic) Provenance
• Navigating Big Data: SenseMap

Data Visualisation – Simple
• Leverage visual cognition for data analysis

Data Visualisation – less simple

Design new visualisations

Evaluate them

Outline
• Introduction
• What is Sensemaking
• Supporting Sensemaking: VAST Challenge 2014
• What is (Analytic) Provenance
• Navigating Big Data: SenseMap

What is sensemaking?
• Making sense of data, reasoning, and make decisions
• It is something we do everyday:• Plan a holiday, buy a car, understand an illness, …• Defence, policing, investment, medical diagnosis, …
• The task is usually not well defined • Can’t run a google search or SQL query to find the
answer
• Involve many different data
• Explorative and iterative

Sensemaking
Data Analysis & Visualisation
Reasoning Decision

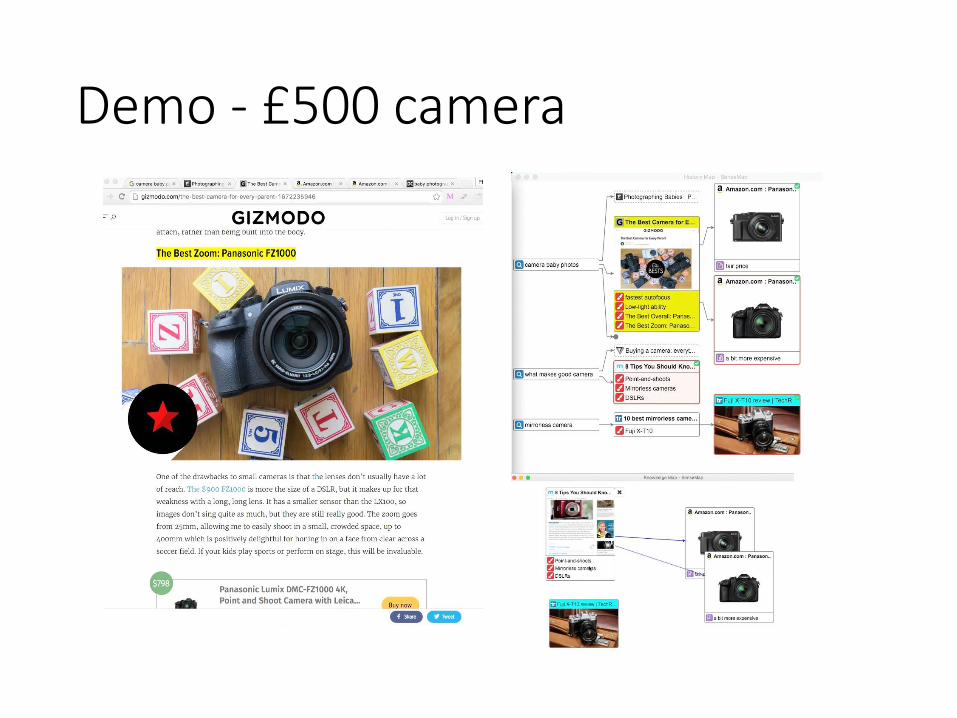
Sensemaking example: what is the best camera for about £500?
What is the best camera for £500?
Pixel number
Sensor size
Image qualitychromatic aberration?!
Noise reduction
What does experts say?
Online reviews
What does my friend say?
Smart phone
Compact
Full frame?
Micro 4/3?
Sony RX100
Nikon D750Samsung Galaxy S7
What are the price?
How do I compare? Panasonic
LX100
Form factor
Models

Making Sense of Data

Outline
• Introduction
• What is Sensemaking
• Supporting Sensemaking: VAST Challenge 2014
• What is (Analytic) Provenance
• Navigating Big Data: SenseMap
VAST Challenge 2014
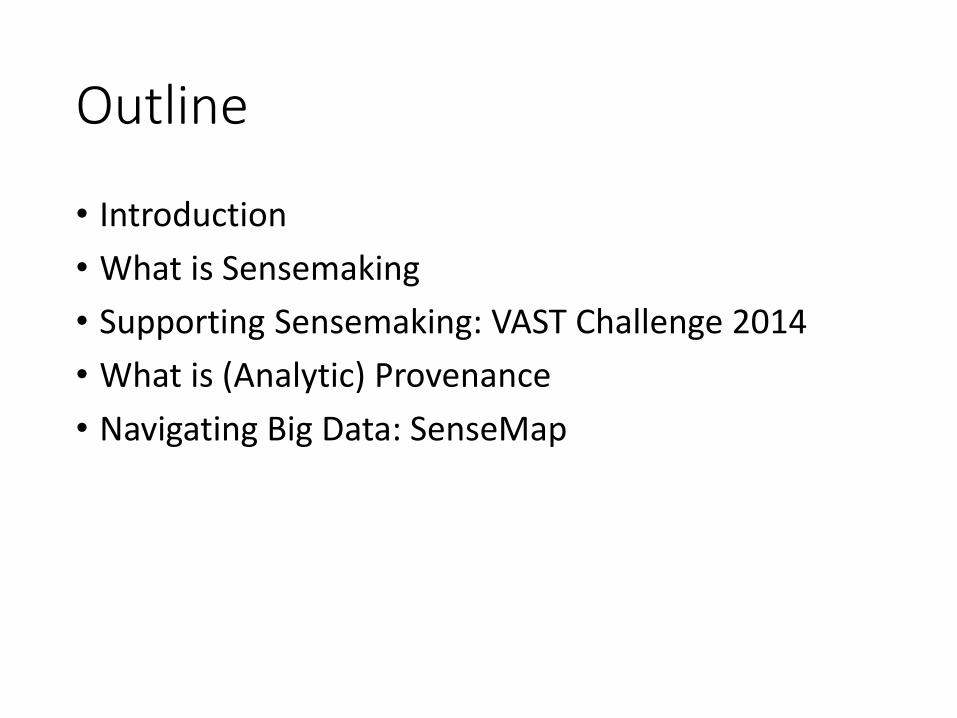
• Visual Analytics Science & Technology (VAST) Challenge• Provide dataset and analysis tasks• Entry: visual analytics systems
• VAST Challenge 2014 – Mini Challenge 3• Data: tweets• Task: solve a kidnap case
Making sense of data, reasoning, and make decisions
The task is usually not well defined Can’t run a google search or SQL query to find the answer
× Involve many different data
Explorative and iterative

The Data

Our Entry
• Honourable mention: “Effective Support for Analytic Sensemaking”
• SAVI: Social Analytics Visualisation• Temporal, geo-spatial, and text analysis visualisation
• SenseMap: SenseMaking with analytic provenance• Notes and findings
• Visual reasoning
• Visual narrative construction
• Collaboration
• Analytic provenance

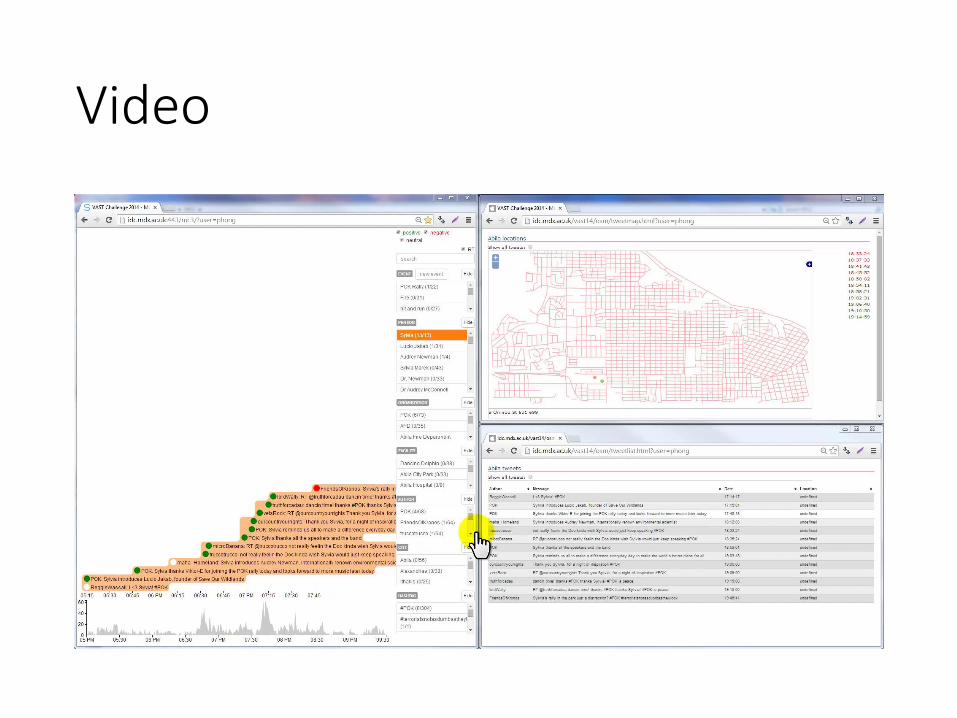
SAVI – Social Analytics VIsualisation

SAVI – Histogram
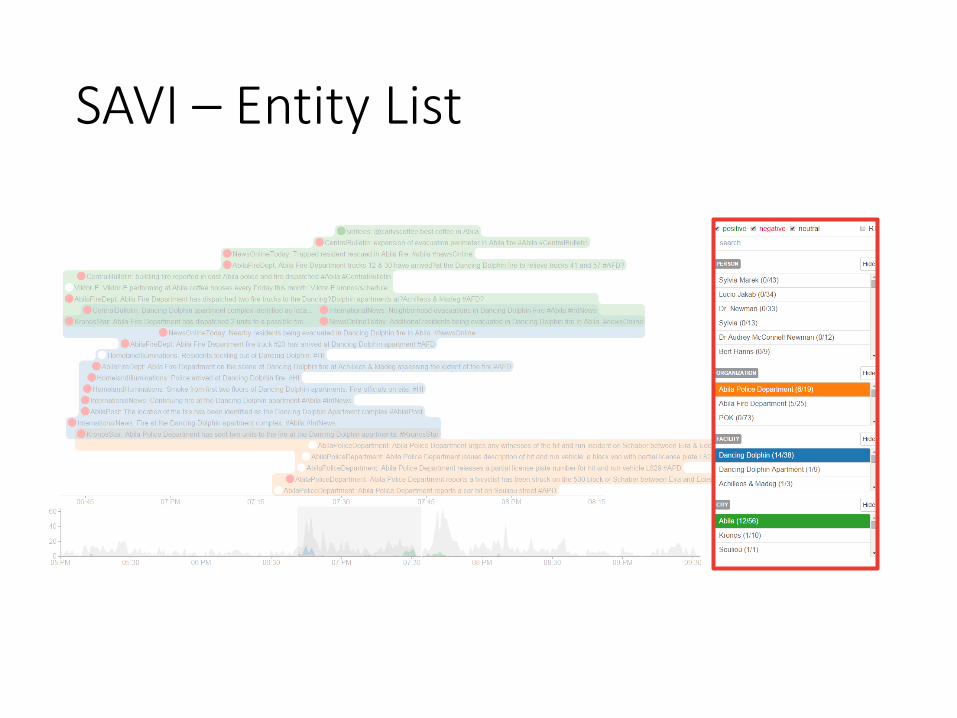
SAVI – Entity List

SAVI – Message Timeline
Nguyen, P. H., Xu, K., Walker, R., and Wong, B. W. TimeSets: Timeline visualization with set relations. Information Visualization (2016)

SAVI – Map View

SAVI – Map
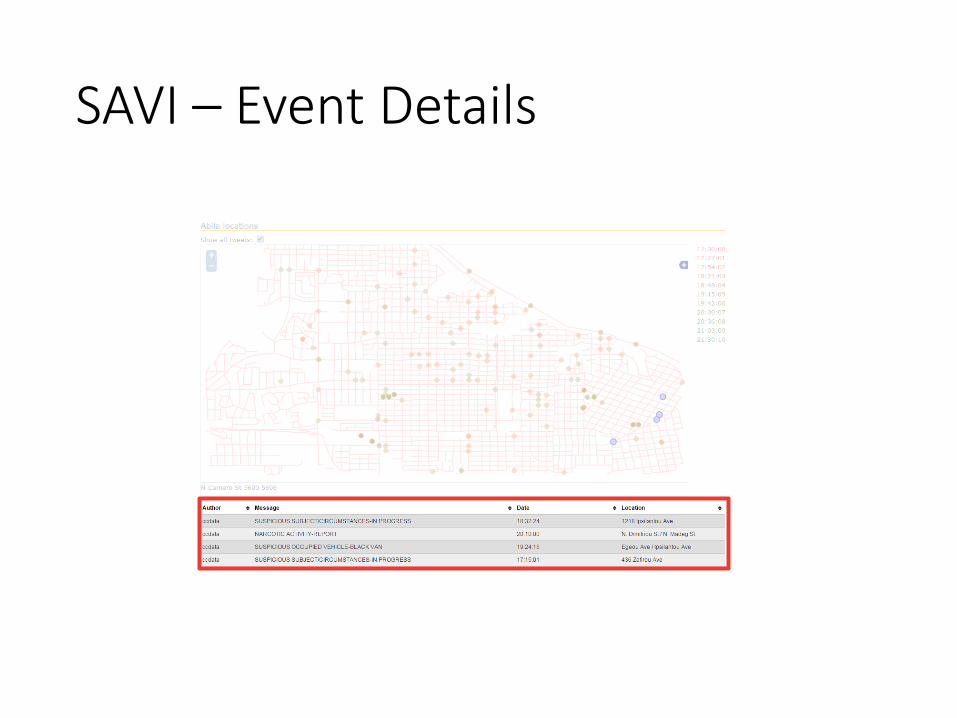
SAVI – Event Details

SenseMAP - SenseMaking with Analytic Provenance
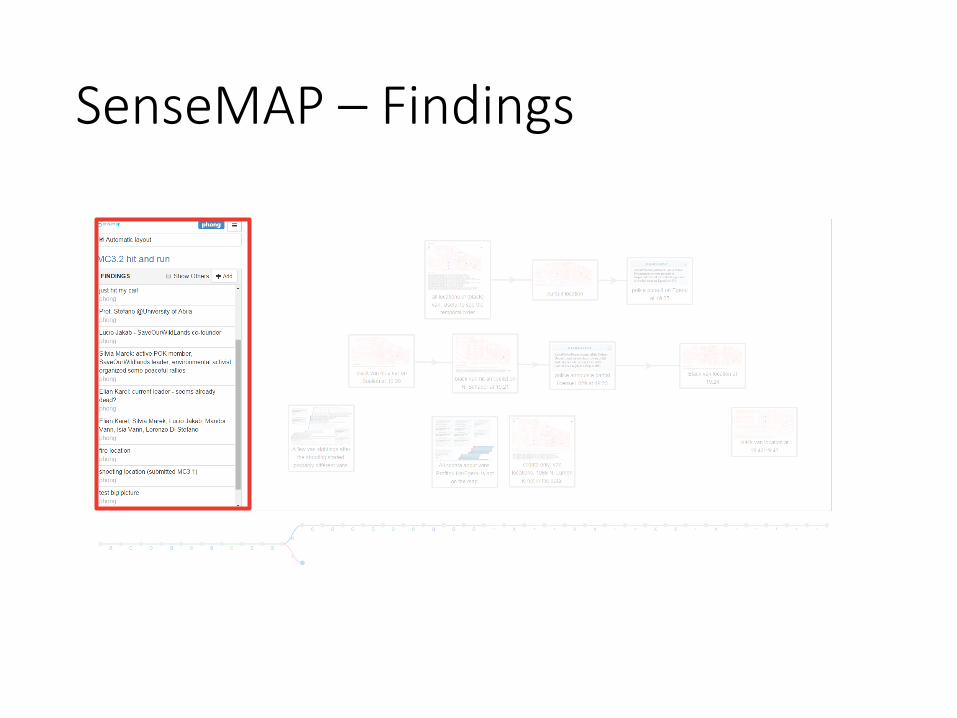
SenseMAP – Findings

SenseMAP – Reasoning Space

SenseMAP – Process Provenance

Discussions
• Sensemaking is not just one visualisation• Timeline, entity list, map, visual narrative, etc.
• Many aspects of the underlying data
• The visual analytics tool needs to support different types of sensemaking tasks• Help identify starting point
• Capture/record findings
• Connection between different views/data items
• Reasoning and construct narrative

Outline
• Introduction
• What is Sensemaking
• Supporting Sensemaking: VAST Challenge 2014
• What is (Analytic) Provenance
• Navigating Big Data: SenseMap
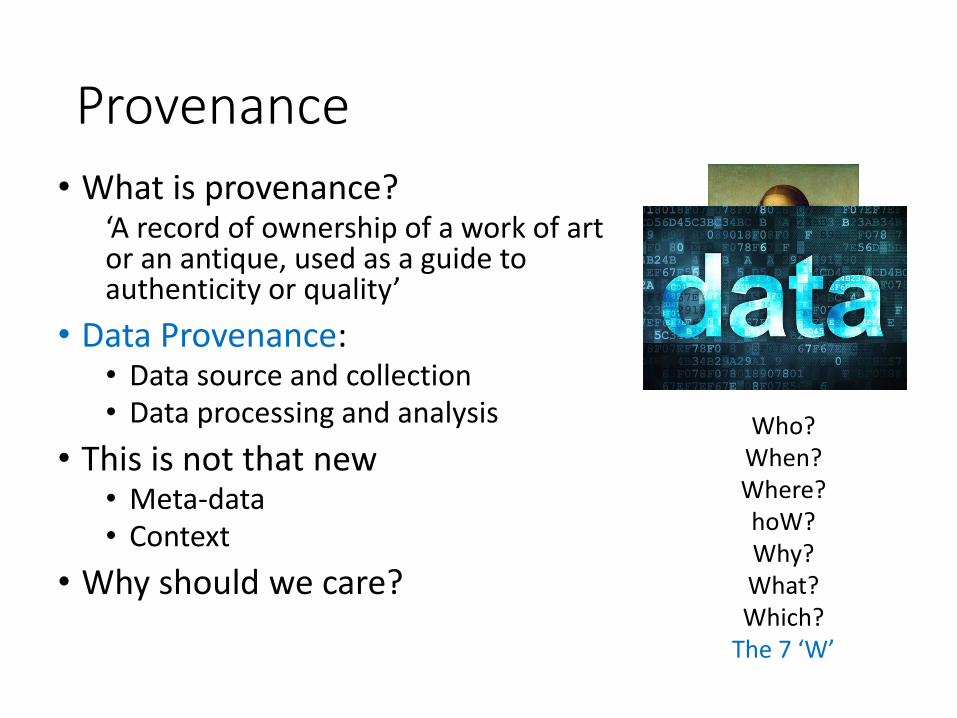
Provenance
• What is provenance?‘A record of ownership of a work of art or an antique, used as a guide to authenticity or quality’
• Data Provenance:• Data source and collection• Data processing and analysis
• This is not that new• Meta-data• Context
• Why should we care?
Who?When?Where?hoW?Why?What?Which?
The 7 ‘W’
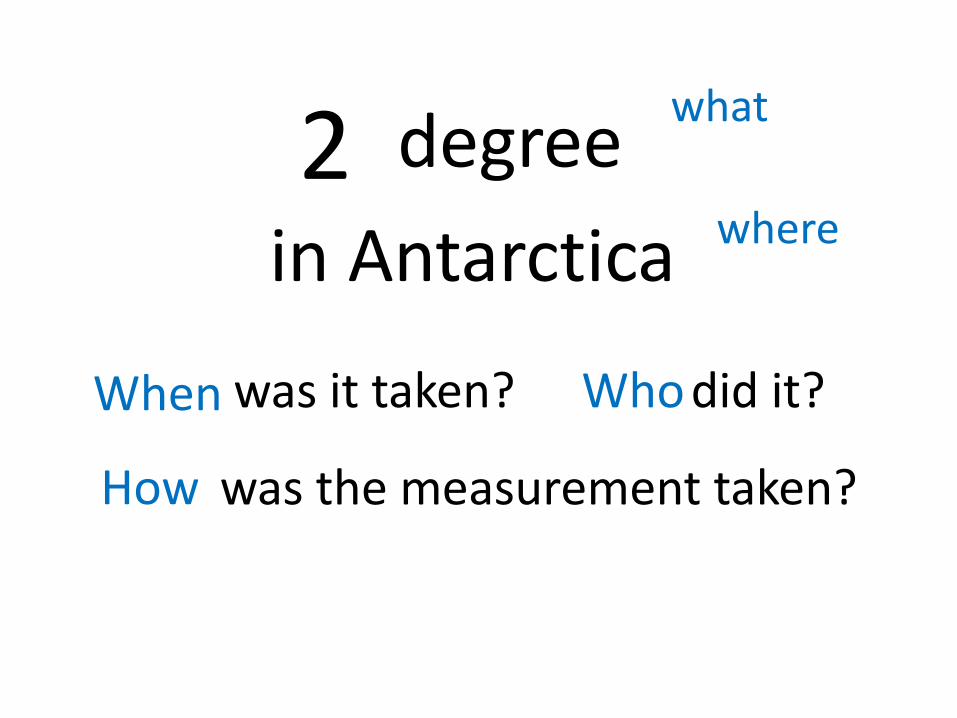
2 degree
in Antarctica
was it taken? did it?
was the measurement taken?
what
where
When Who
How

Analytic provenance
• How users make sense of data• The data and visualisations used
• The findings
• The hypothesis and evidence
• The reasoning process and conclusions
• Example: Should we invade Iraq?• It is always easier after the event
• The actual question: was it the right decision to invade Iraq with the information and time available then.
• Can be used to support Sensemaking
Who?When?Where?hoW?Why?What?Which?
The 7 ‘W’
Outline
• Introduction
• What is Sensemaking
• Supporting Sensemaking: VAST Challenge 2014
• What is (Analytic) Provenance
• Navigating Big Data: SenseMap

Sensemaking example: what is the best camera for about £500?
What is the best camera for £500?
Pixel number
Sensor size
Image qualitychromatic aberration?!
Noise reduction
What does experts say?
Online reviews
What does my friend say?
Smart phone
Compact
Full frame?
Micro 4/3?
Sony RX100
Nikon D750Samsung Galaxy S7
What are the price?
How do I compare? Panasonic
LX100
Form factor
Models

This is usually what it looks like after one hour
• What is relevant and what is not?• Where are information about image quality?• How to compare the models?• Where did I left off two days ago?• How do I explain to my wife?

SenseMap – a map of analytic provenance• What can you do when you don’t have a map to
start with• Track where you have been
• Build the map as you go

SenseMap – A map of sensemaking
Browser enhancement
History Map
Knowledge Map

Browser View
• Sensemaking support• highlight, take note
• set representative image in History Map
• Provenance capture• action type, timing,
context, relationship

History Map (information collection)

Knowledge Map (information curation)

Discussion
• SenseMap to support browser-based online sensemaking
• Capture and visualise the analytic provenance
• Support information collection and curation• Early stage of the
sensemaking process

Summary
• Sensemaking is how people understand, reason, and make decisions with data
• Analytic provenance captures the rich context of this process: seven ‘W’s
• There are still many open problems for sensemaking support
• Data visualisation tools based on analytic provenance can potentially provide a solution• SAVI (TimeSets) + SenseMap
• SenseMap2: navigating information place

• SenseMap2 is available as a Chrome extension• Just search for ‘SenseMap’ in chrome web store.
• Looking for collaboration• Research: data visualisation in general.
• Development: new tools or existing ones.
• Others: PhD, joint funding proposal, etc.
• Contact• [email protected]
• https://kaixu.me