Embed Size (px)
Citation preview
Making Data Accessible
Mercè CrosasChief Data Science and Technology Officer
Institute for Quantitative Social ScienceHarvard University
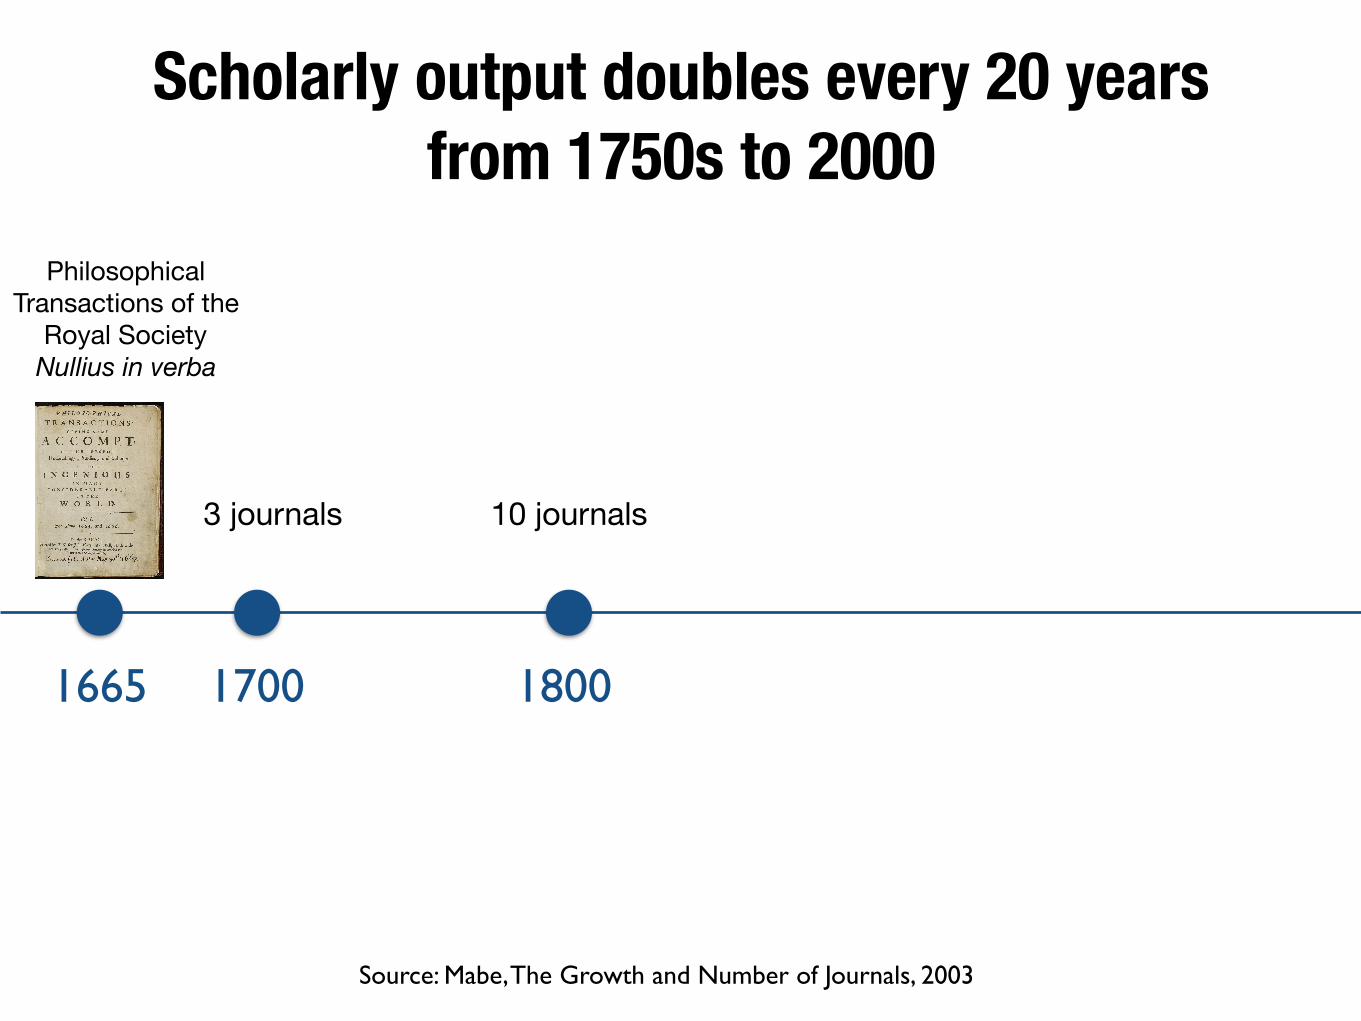
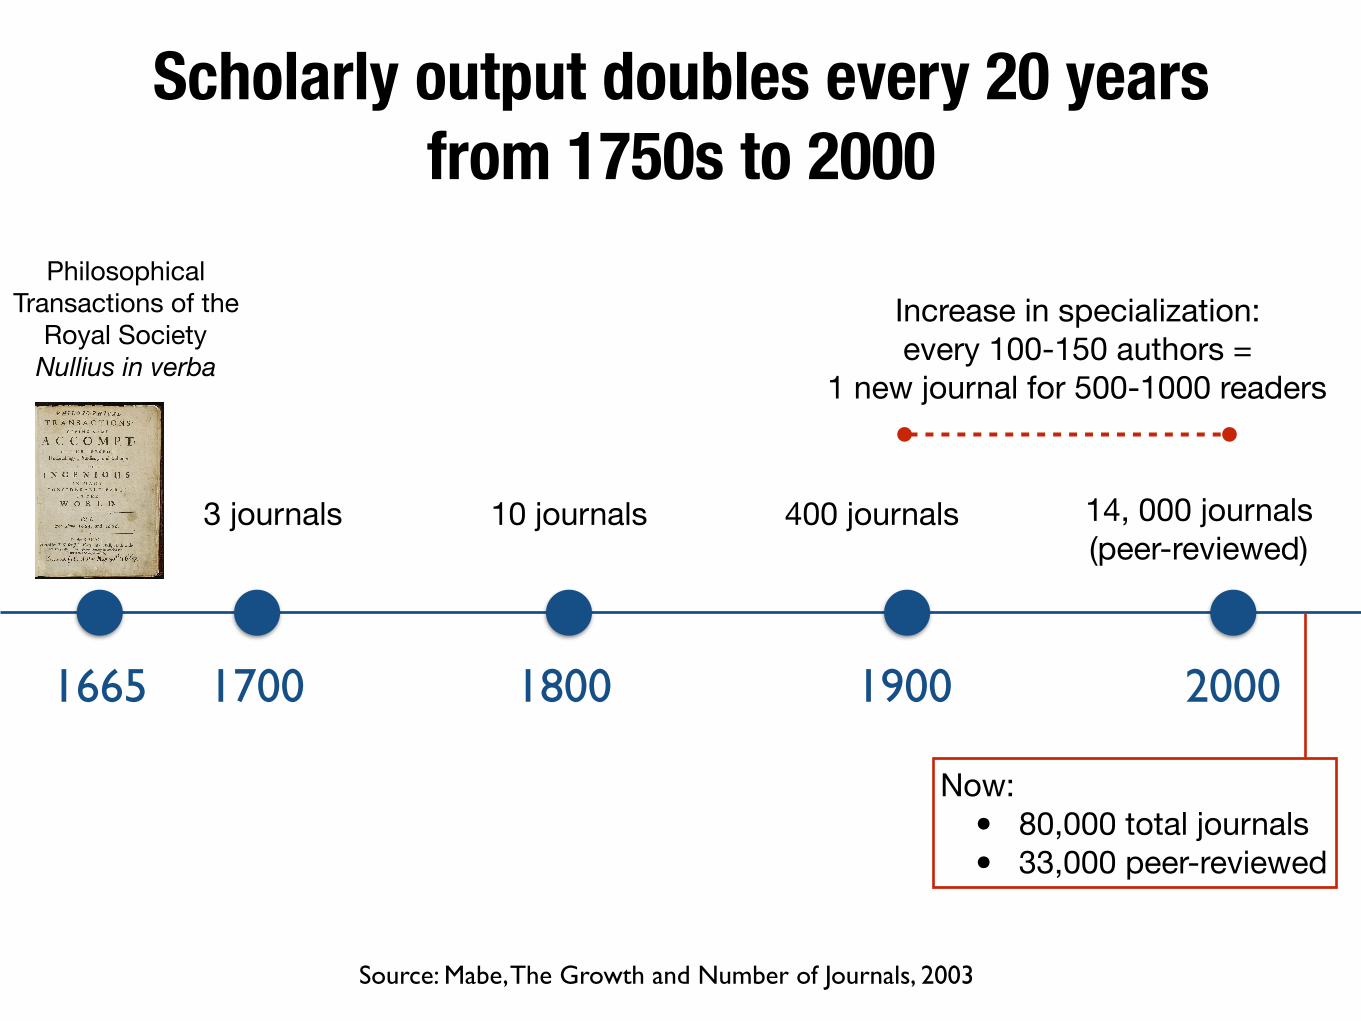
Scholarly output doubles every 20 years from 1750s to 2000
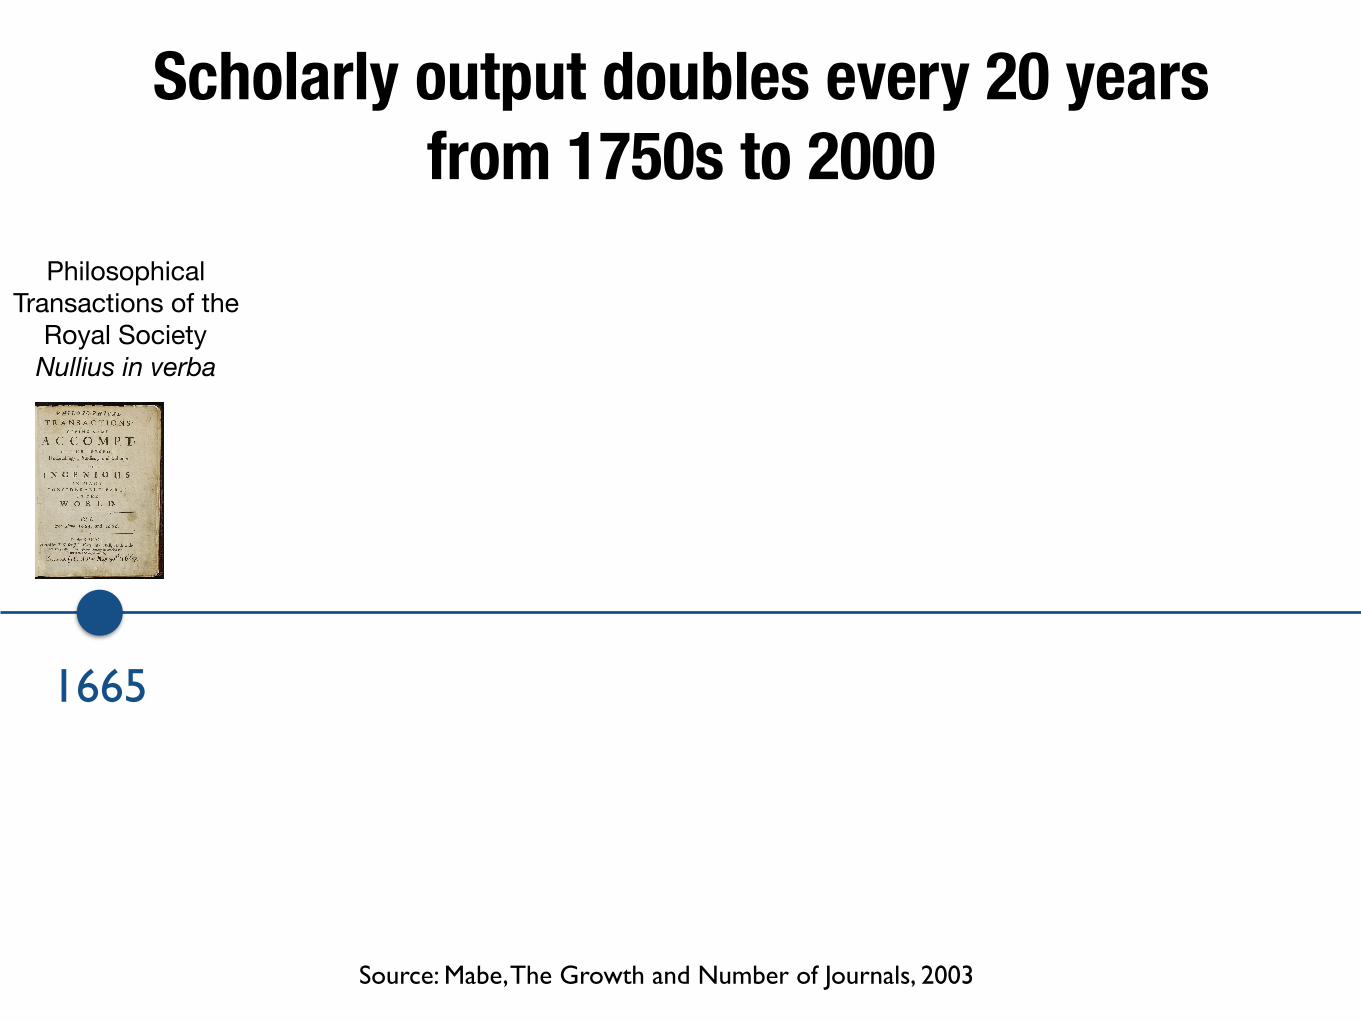
Scholarly output doubles every 20 years from 1750s to 2000
1665
Source: Mabe, The Growth and Number of Journals, 2003
Philosophical Transactions of the
Royal SocietyNullius in verba
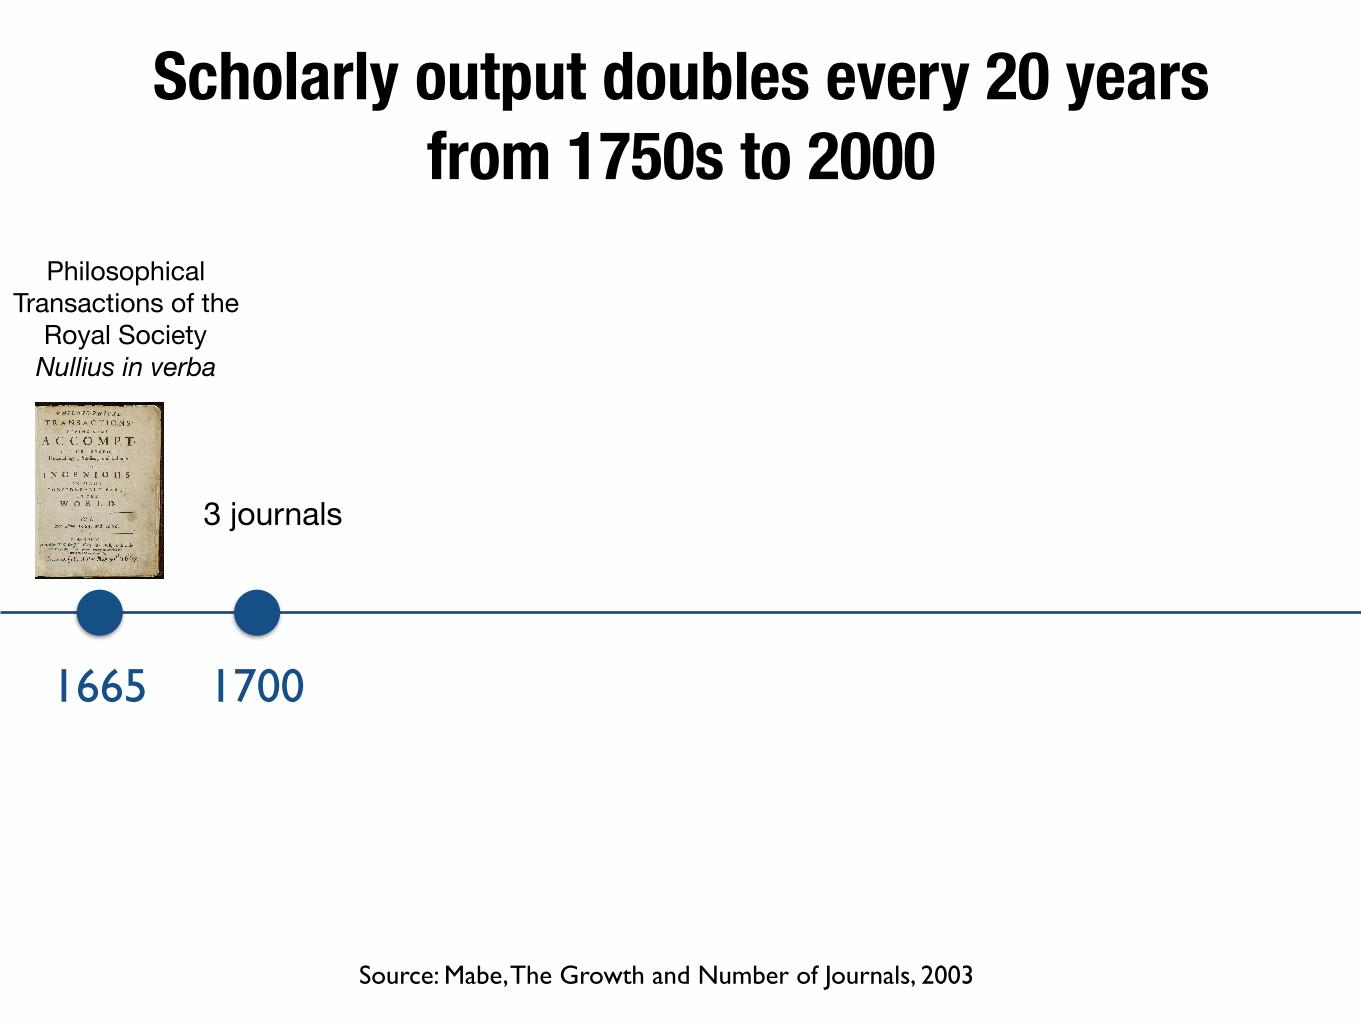
Scholarly output doubles every 20 years from 1750s to 2000
1665 1700
3 journals
Source: Mabe, The Growth and Number of Journals, 2003
Philosophical Transactions of the
Royal SocietyNullius in verba
Scholarly output doubles every 20 years from 1750s to 2000
1665 1700 1800
3 journals 10 journals
Source: Mabe, The Growth and Number of Journals, 2003
Philosophical Transactions of the
Royal SocietyNullius in verba
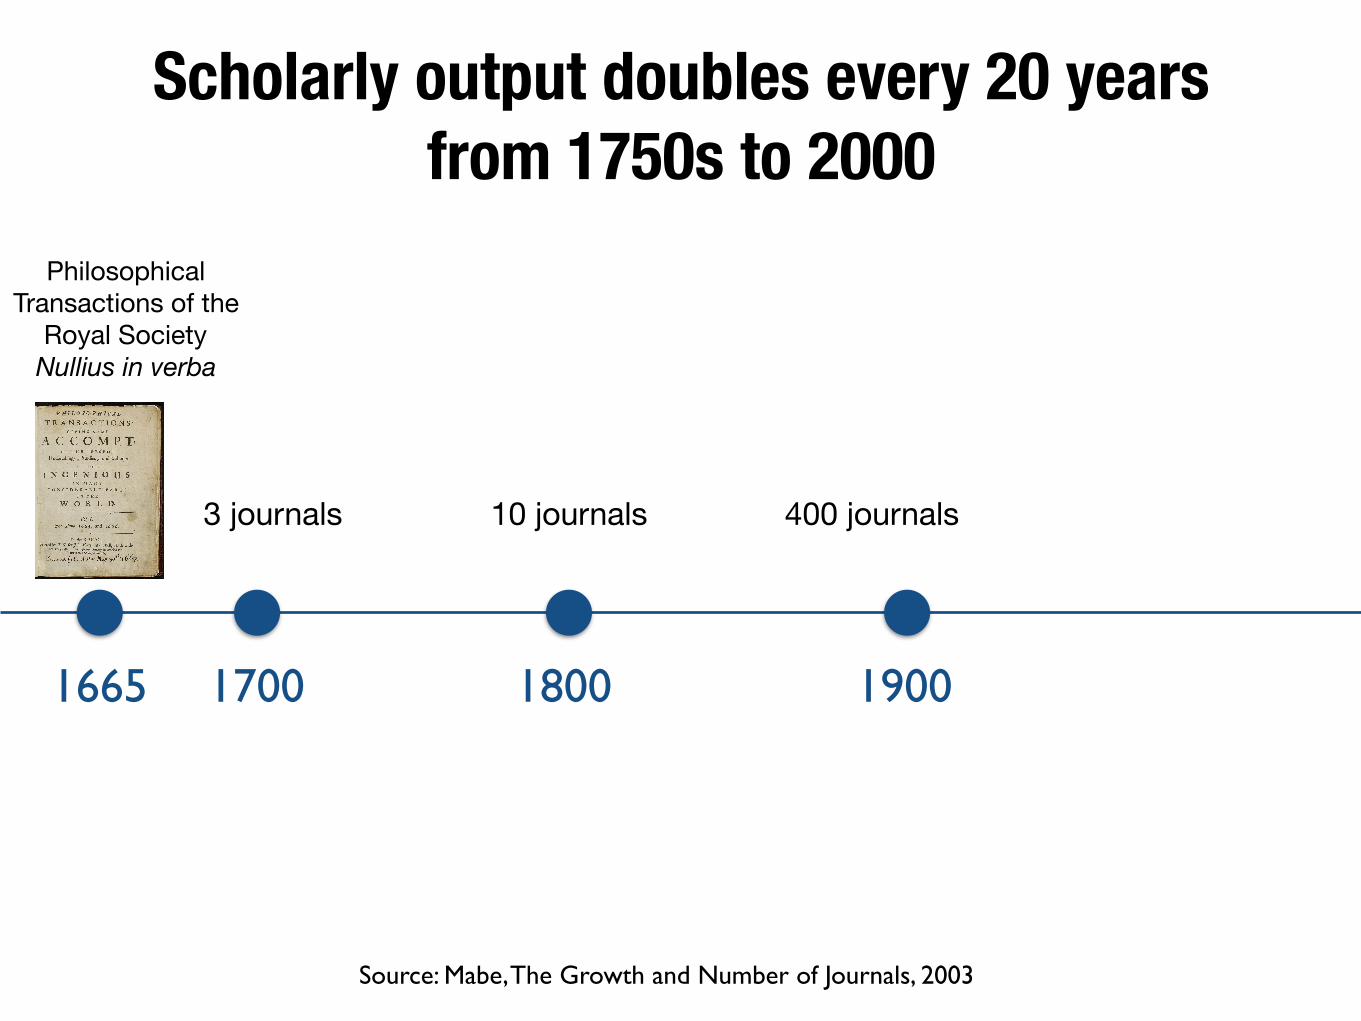
Scholarly output doubles every 20 years from 1750s to 2000
1665 1700 1800 1900
3 journals 10 journals 400 journals
Source: Mabe, The Growth and Number of Journals, 2003
Philosophical Transactions of the
Royal SocietyNullius in verba
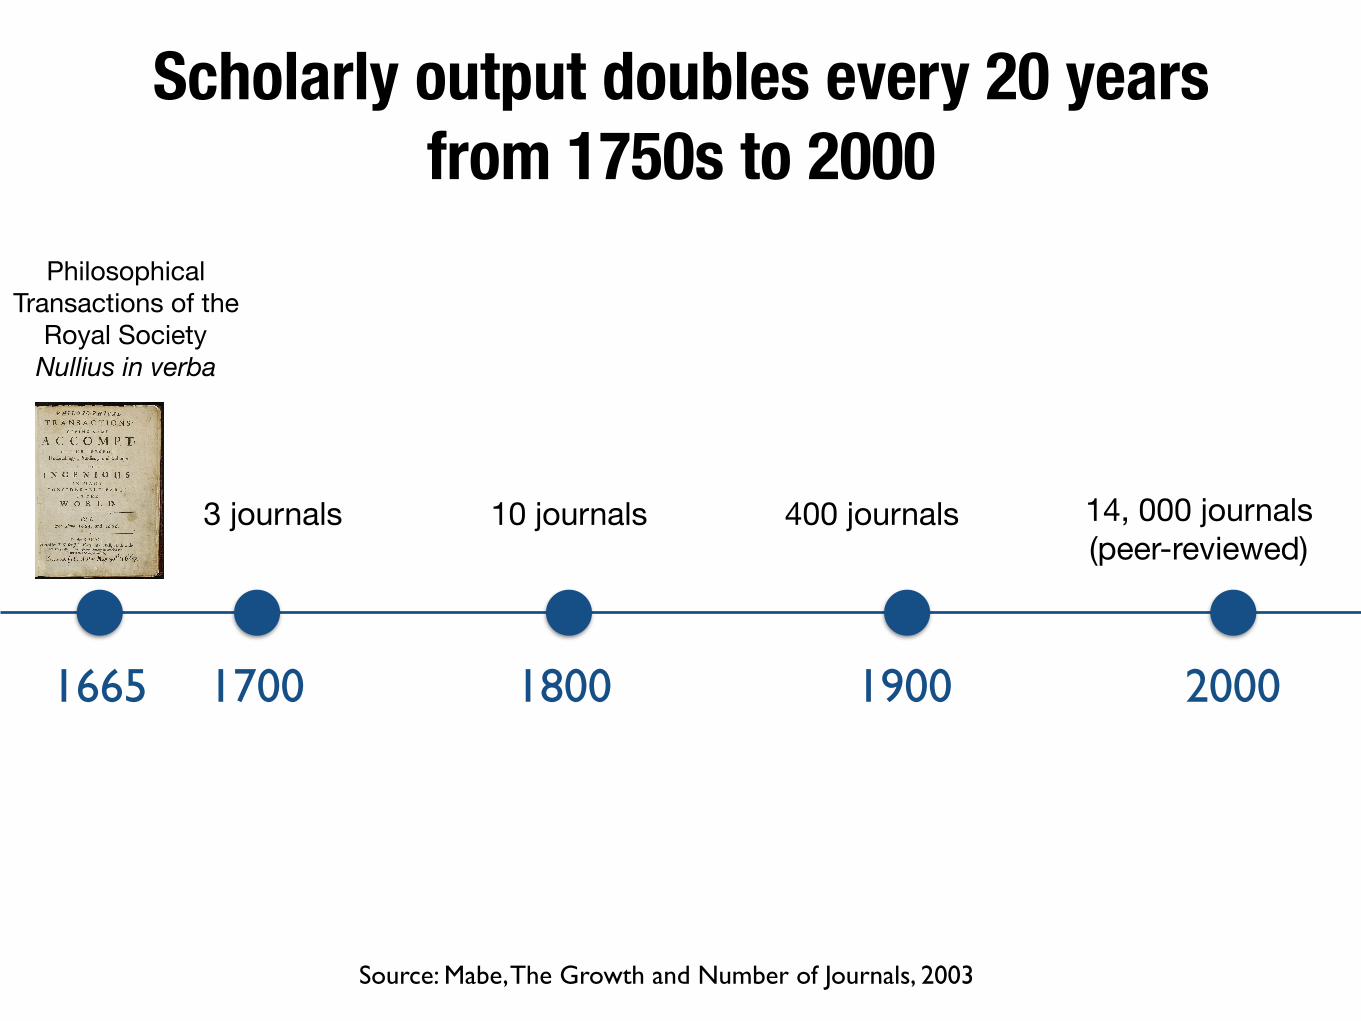
Scholarly output doubles every 20 years from 1750s to 2000
1665 1700 1800 1900 2000
3 journals 10 journals 14, 000 journals(peer-reviewed)
400 journals
Source: Mabe, The Growth and Number of Journals, 2003
Philosophical Transactions of the
Royal SocietyNullius in verba
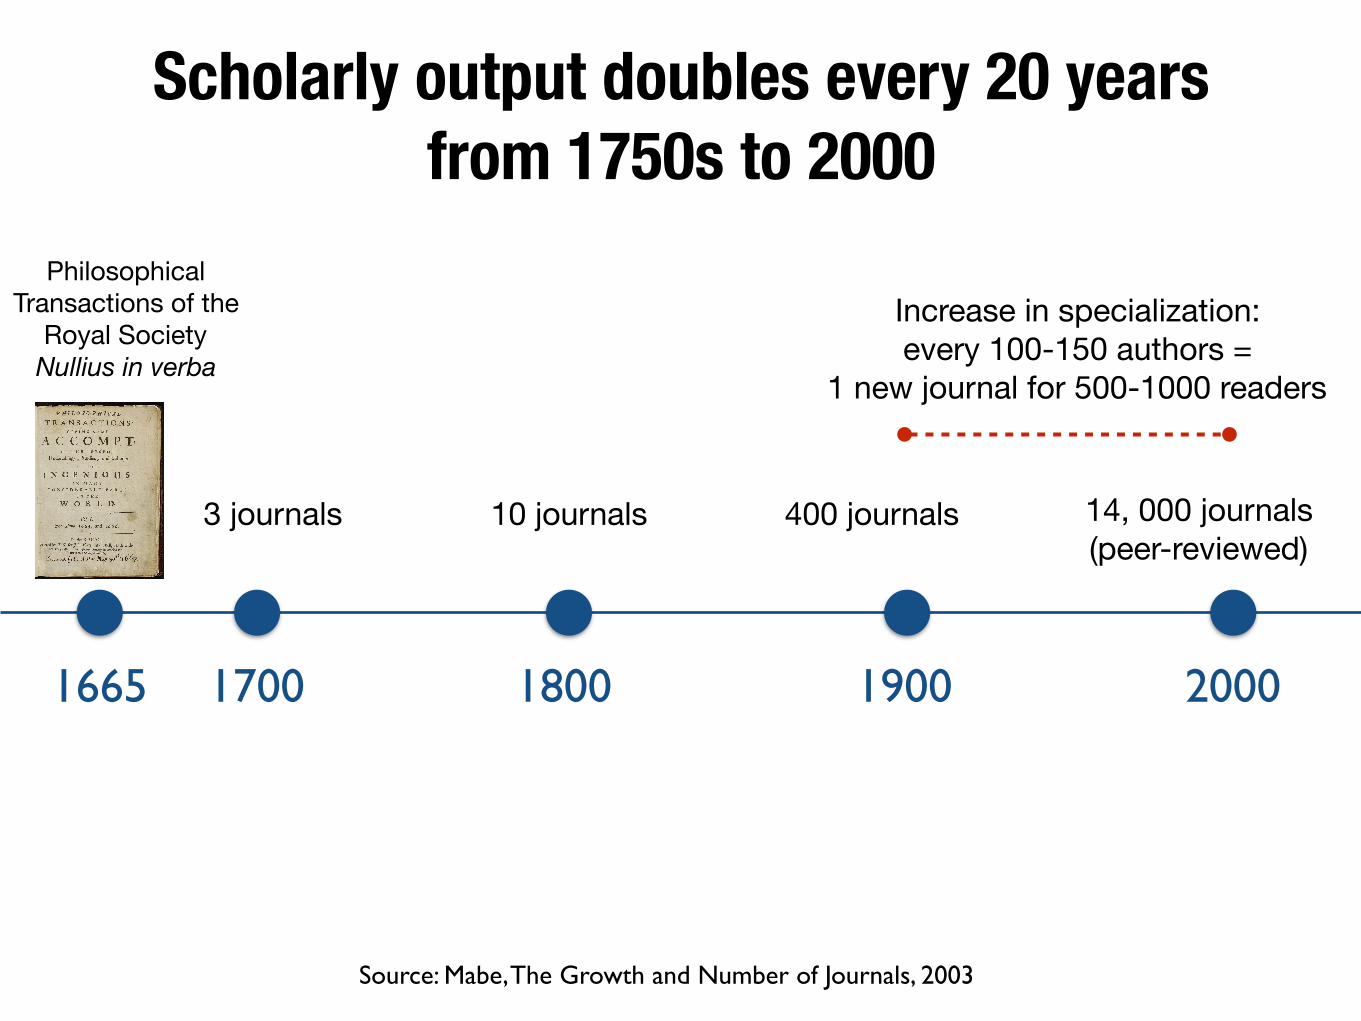
Scholarly output doubles every 20 years from 1750s to 2000
1665 1700 1800 1900 2000
3 journals 10 journals 14, 000 journals(peer-reviewed)
400 journals
Source: Mabe, The Growth and Number of Journals, 2003
Increase in specialization: every 100-150 authors =
1 new journal for 500-1000 readers
Philosophical Transactions of the
Royal SocietyNullius in verba
Scholarly output doubles every 20 years from 1750s to 2000
1665 1700 1800 1900 2000
3 journals 10 journals 14, 000 journals(peer-reviewed)
400 journals
Source: Mabe, The Growth and Number of Journals, 2003
Now:• 80,000 total journals• 33,000 peer-reviewed
Increase in specialization: every 100-150 authors =
1 new journal for 500-1000 readers
Philosophical Transactions of the
Royal SocietyNullius in verba
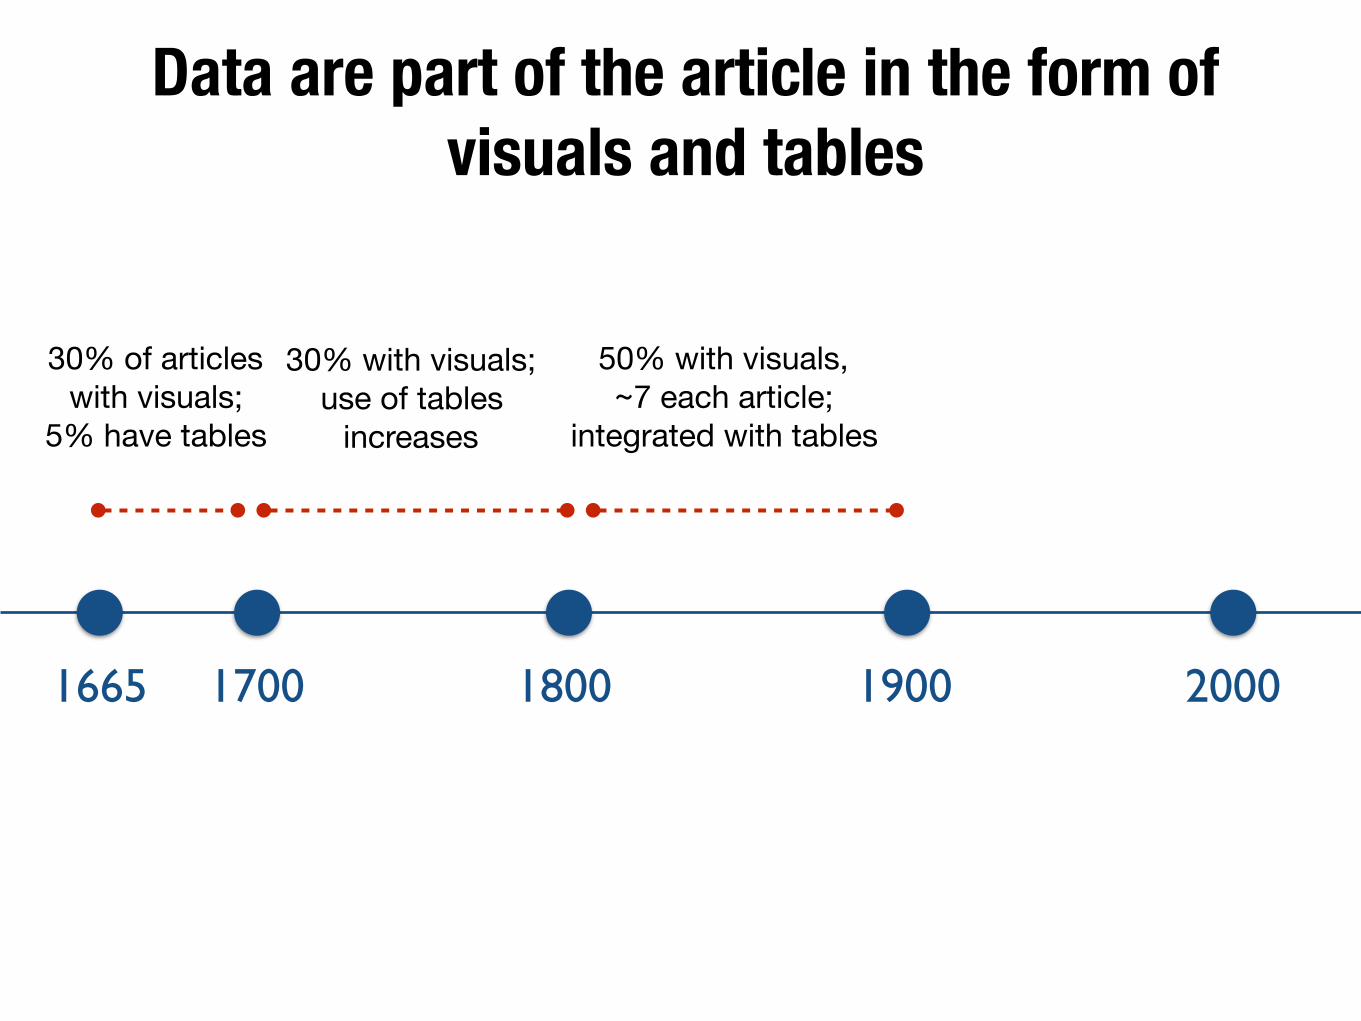
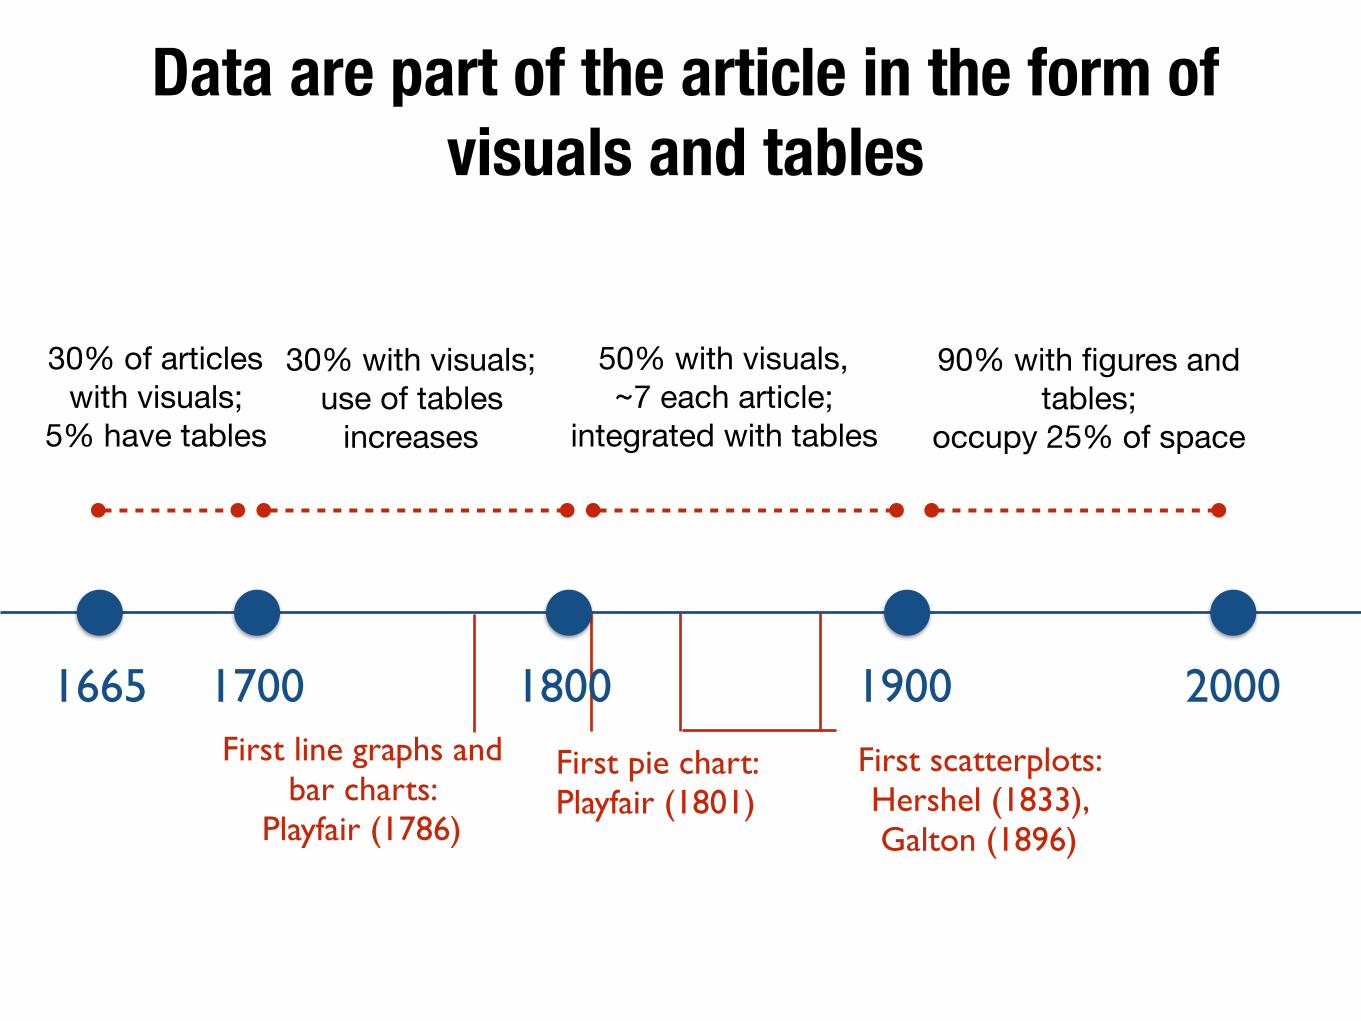
Data are part of the article in the form of visuals and tables
1665 1700 1800 1900 2000
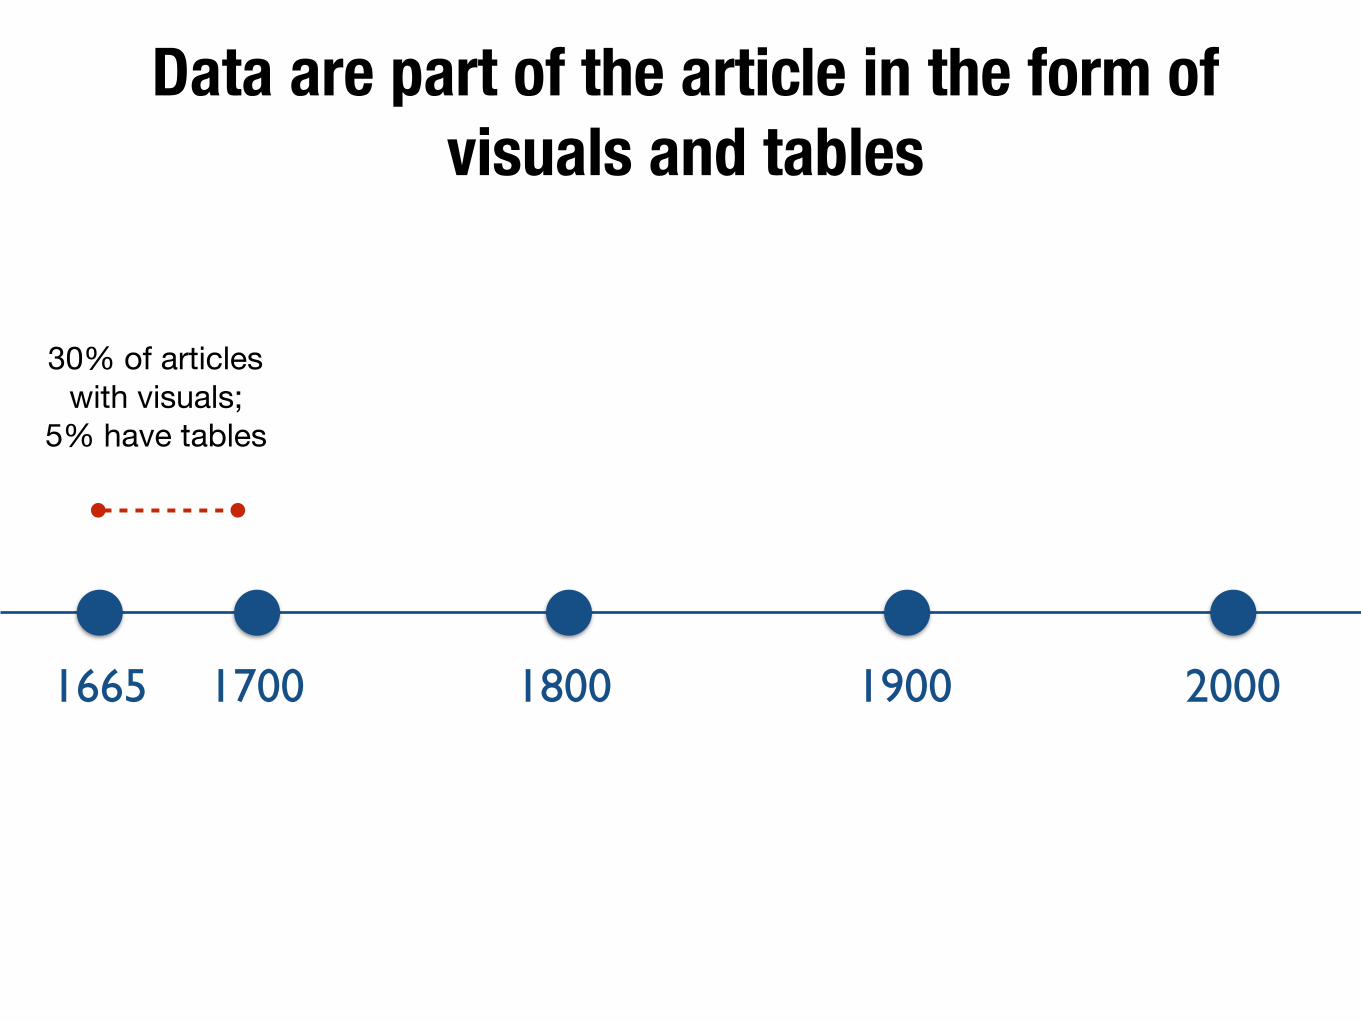
Data are part of the article in the form of visuals and tables
30% of articles with visuals;
5% have tables
1665 1700 1800 1900 2000
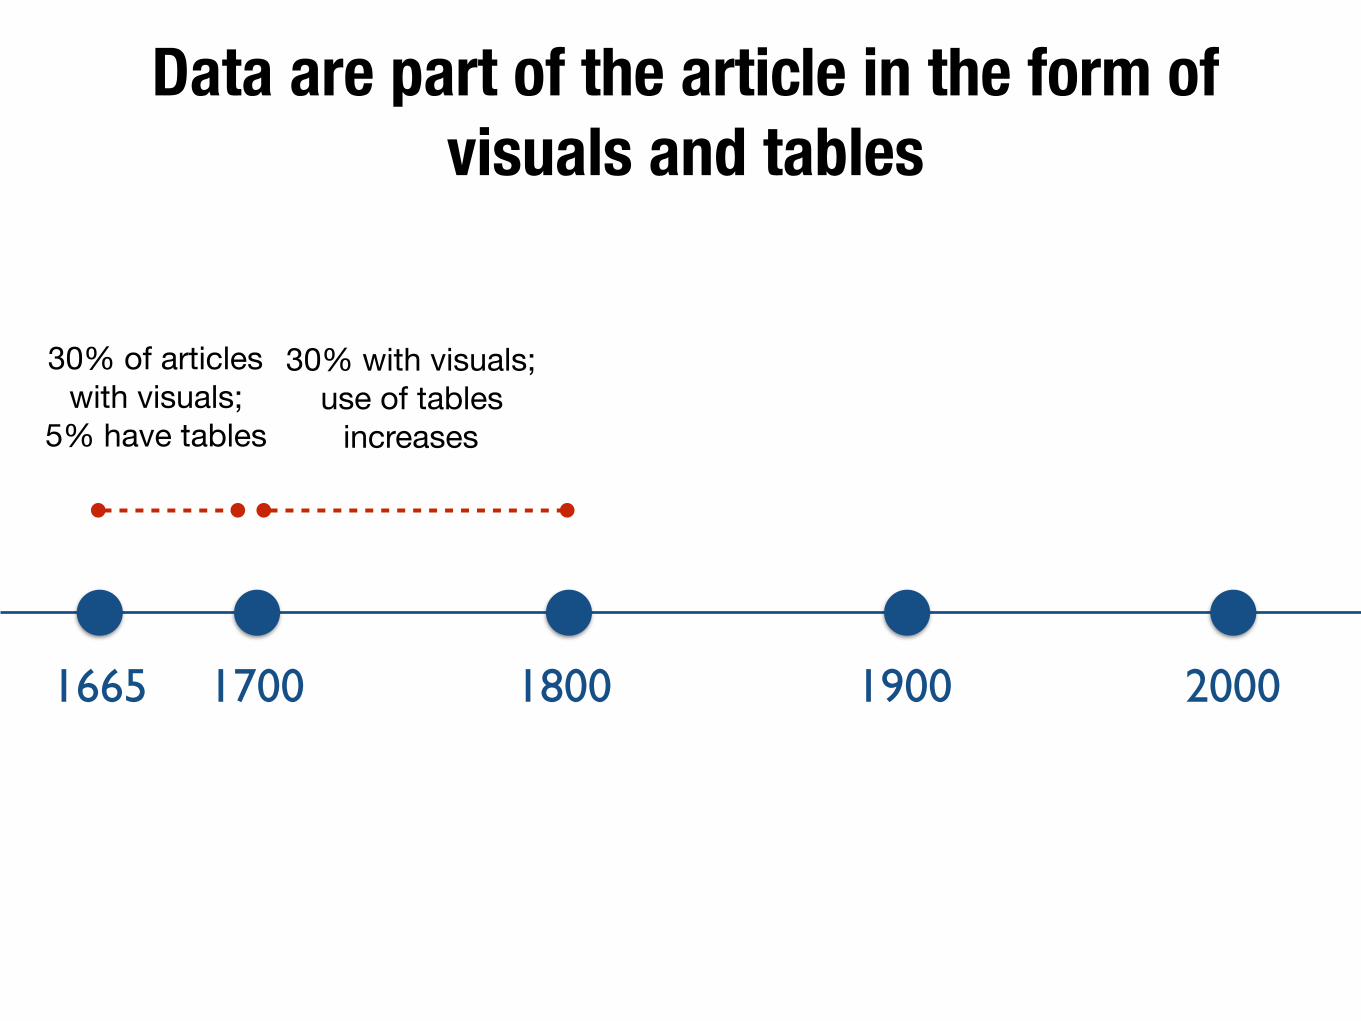
Data are part of the article in the form of visuals and tables
30% of articles with visuals;
5% have tables
30% with visuals; use of tables
increases
1665 1700 1800 1900 2000
Data are part of the article in the form of visuals and tables
30% of articles with visuals;
5% have tables
30% with visuals; use of tables
increases
50% with visuals, ~7 each article;
integrated with tables
1665 1700 1800 1900 2000
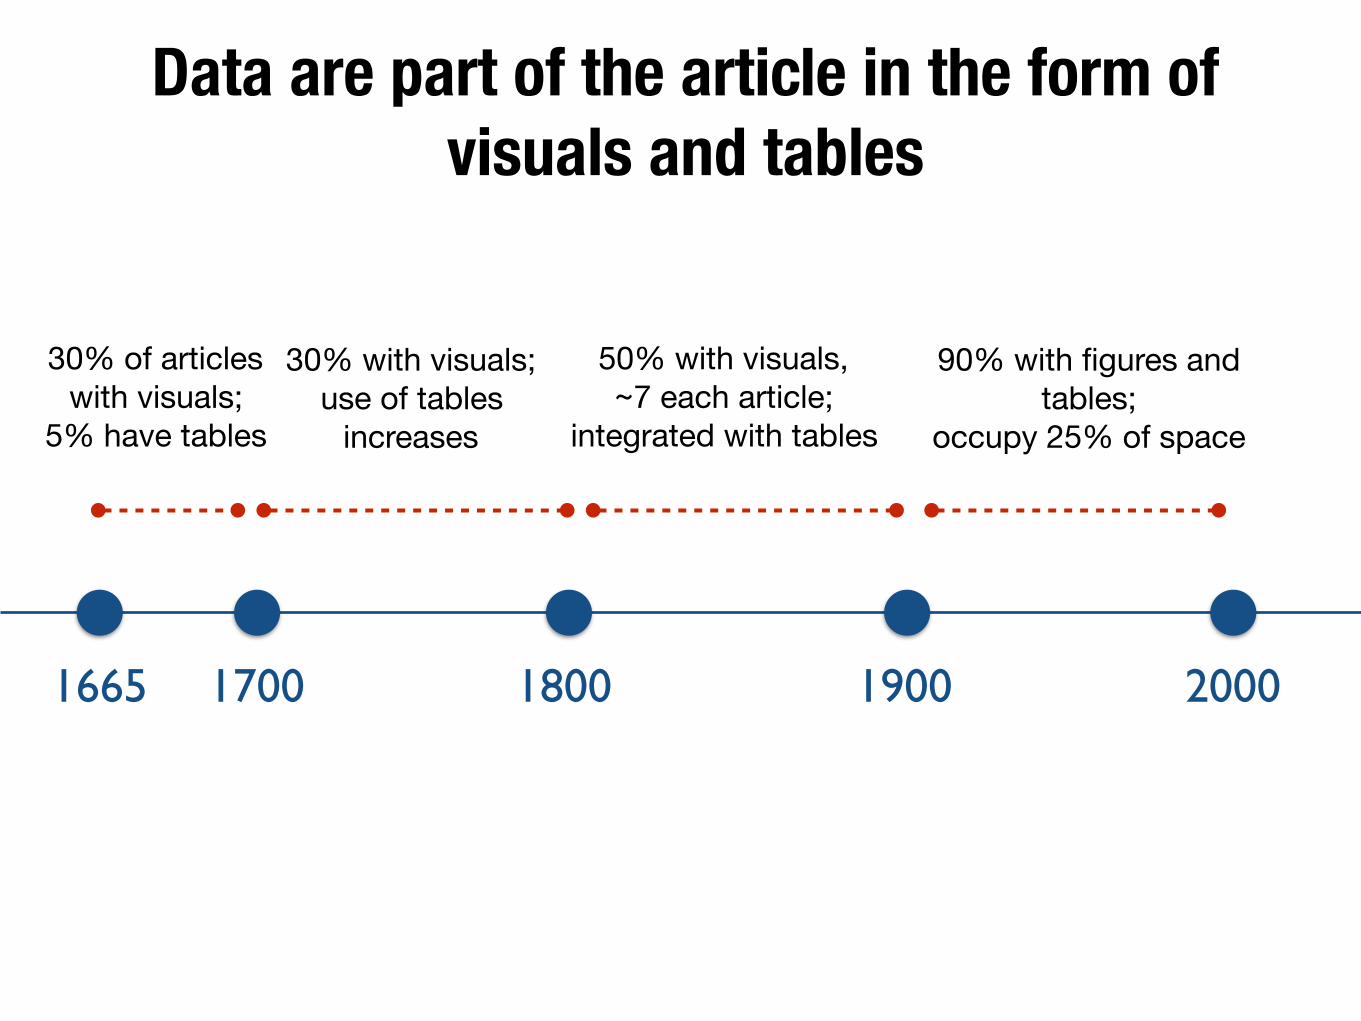
Data are part of the article in the form of visuals and tables
30% of articles with visuals;
5% have tables
30% with visuals; use of tables
increases
90% with figures and tables;
occupy 25% of space
50% with visuals, ~7 each article;
integrated with tables
1665 1700 1800 1900 2000
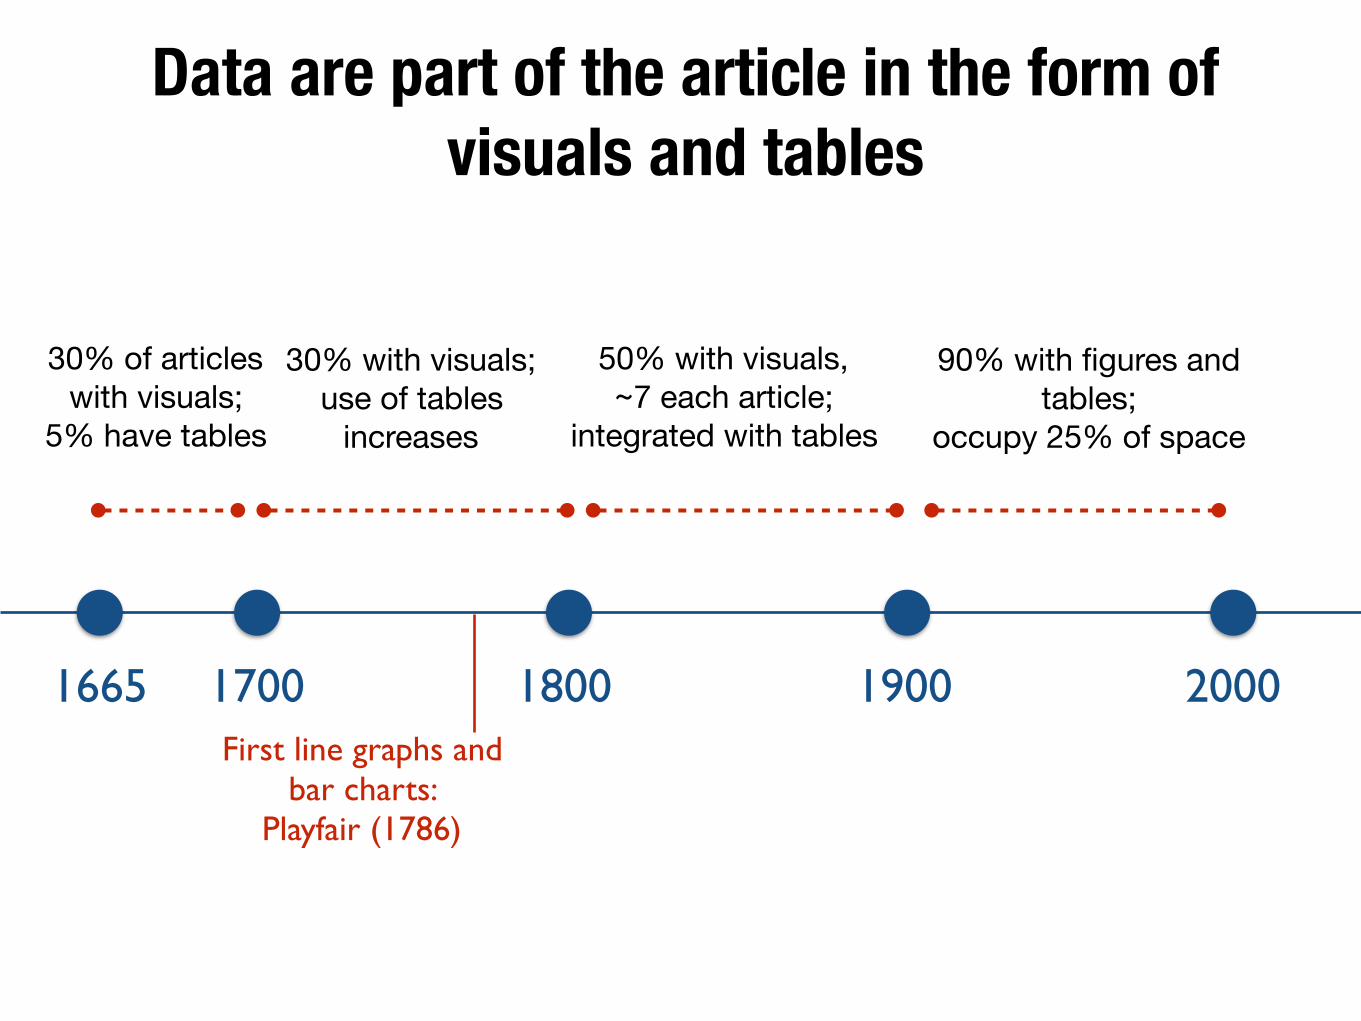
Data are part of the article in the form of visuals and tables
30% of articles with visuals;
5% have tables
30% with visuals; use of tables
increases
90% with figures and tables;
occupy 25% of space
First line graphs and bar charts:
Playfair (1786)
50% with visuals, ~7 each article;
integrated with tables
1665 1700 1800 1900 2000
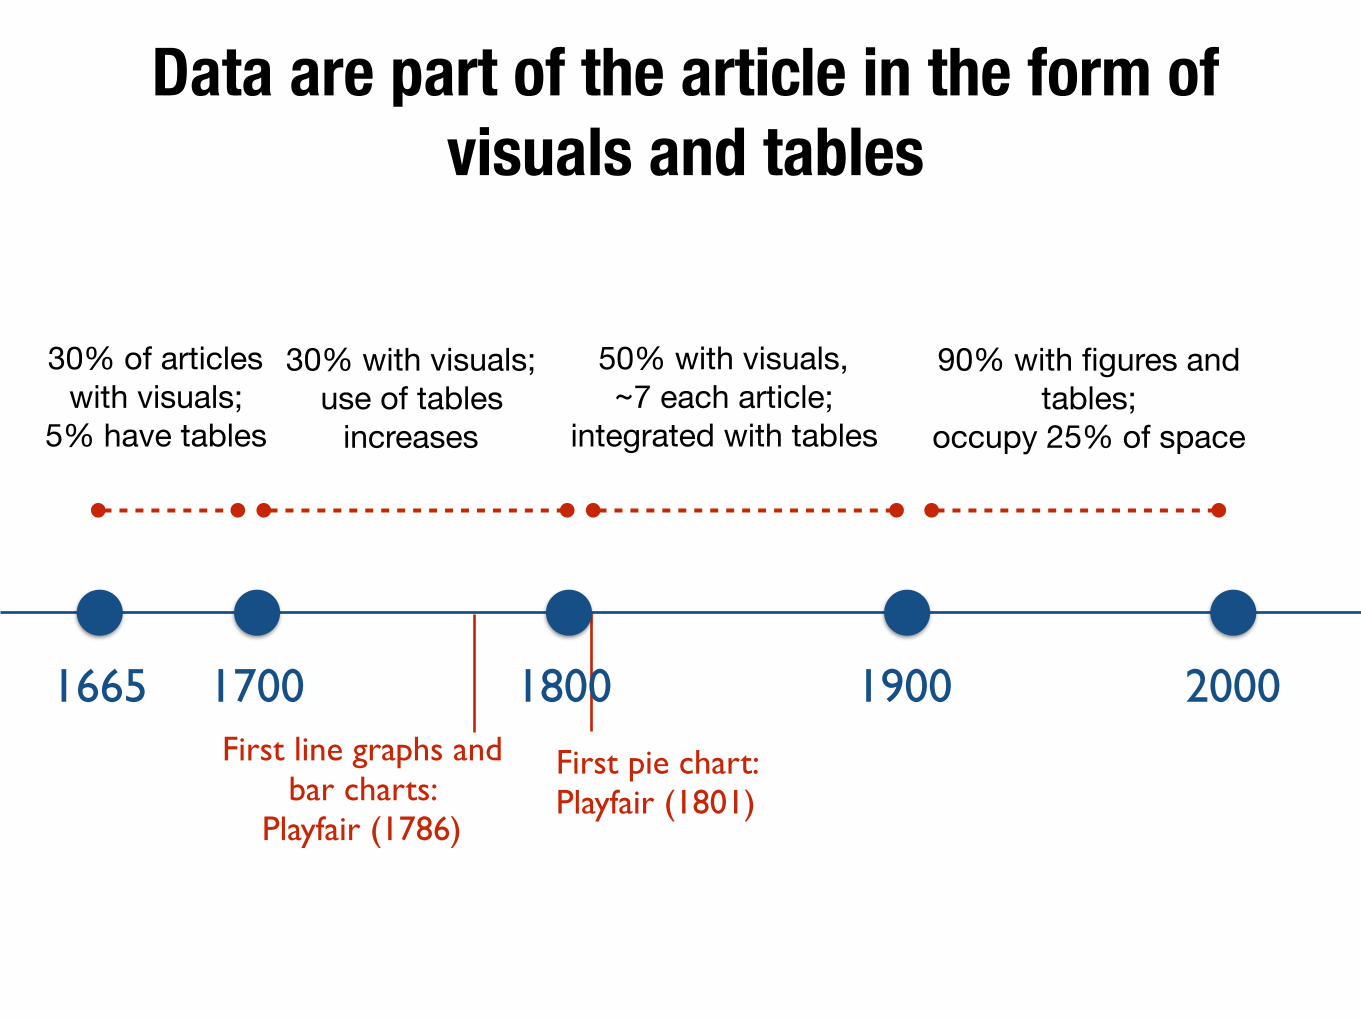
Data are part of the article in the form of visuals and tables
30% of articles with visuals;
5% have tables
30% with visuals; use of tables
increases
90% with figures and tables;
occupy 25% of space
First line graphs and bar charts:
Playfair (1786)
First pie chart: Playfair (1801)
50% with visuals, ~7 each article;
integrated with tables
1665 1700 1800 1900 2000
Data are part of the article in the form of visuals and tables
30% of articles with visuals;
5% have tables
30% with visuals; use of tables
increases
90% with figures and tables;
occupy 25% of space
First line graphs and bar charts:
Playfair (1786)
First pie chart: Playfair (1801)
First scatterplots: Hershel (1833), Galton (1896)
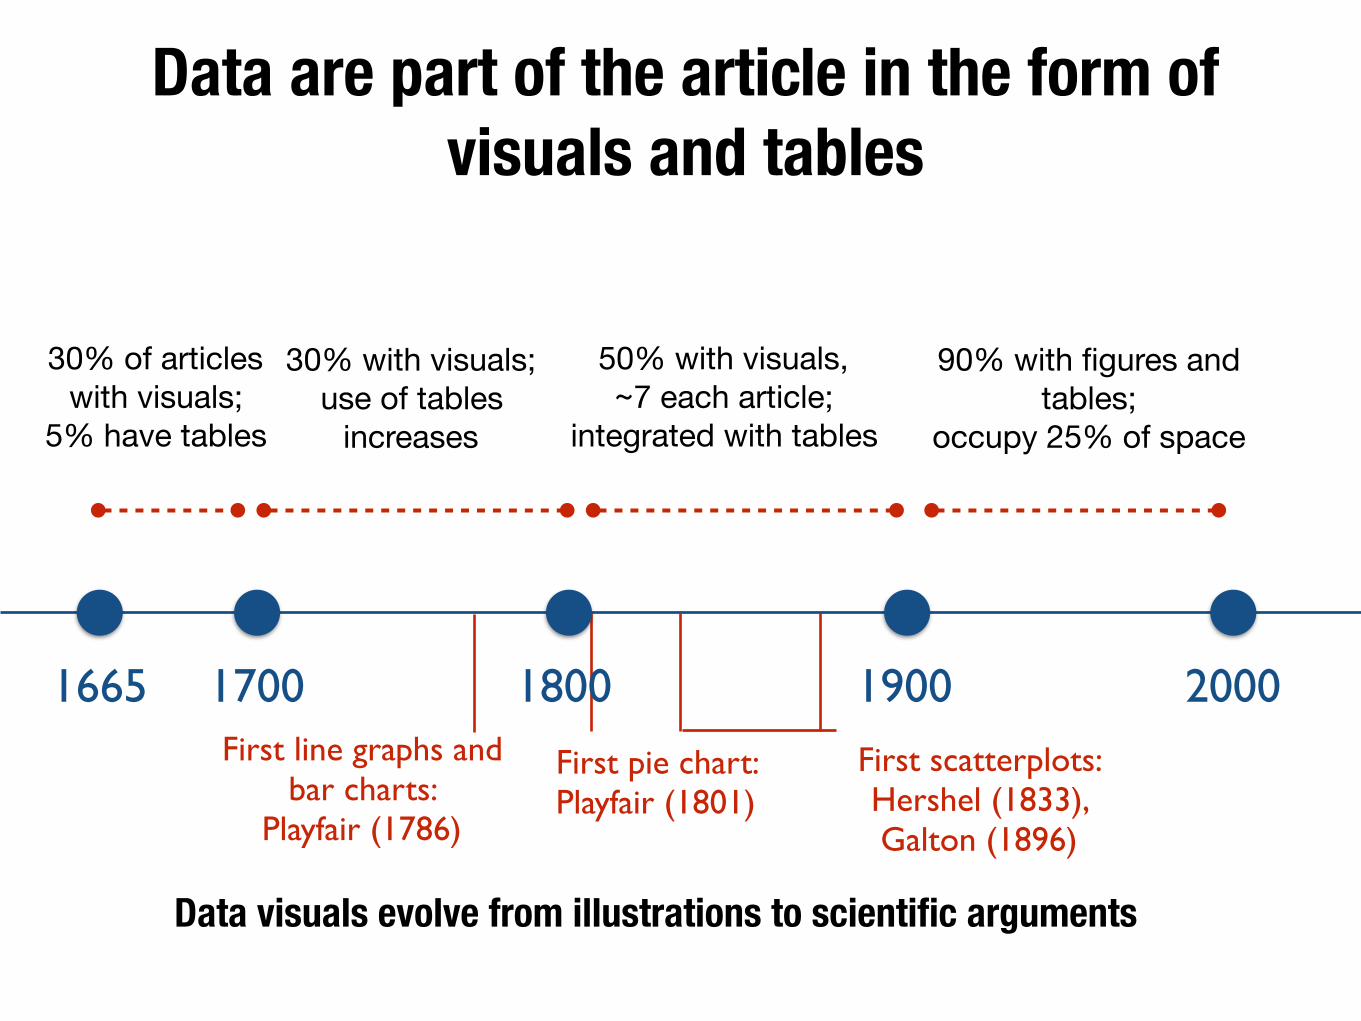
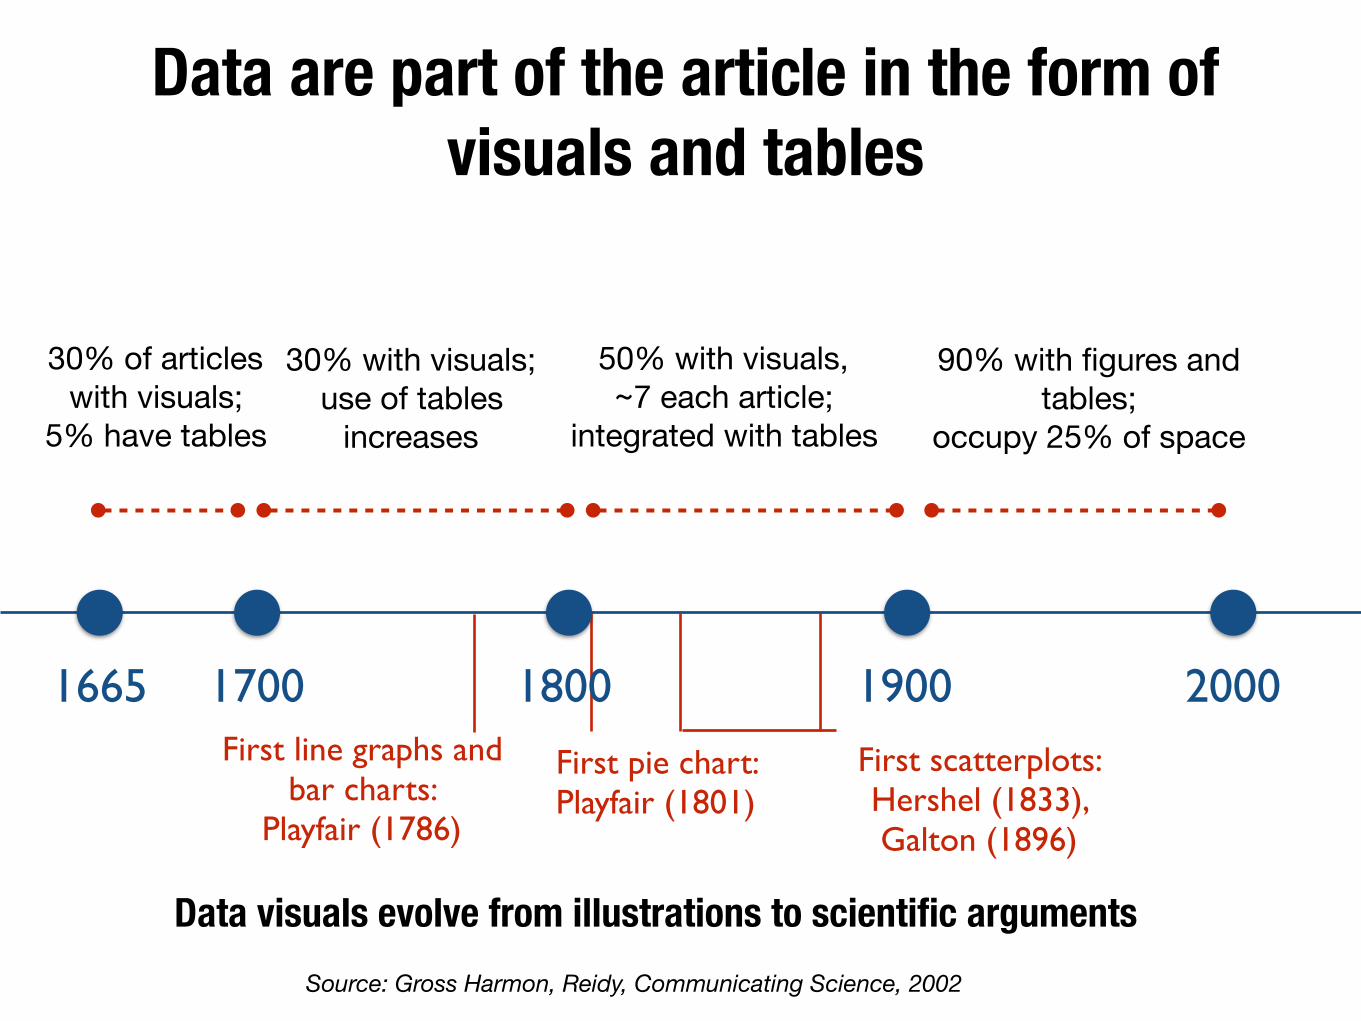
Data visuals evolve from illustrations to scientific arguments
50% with visuals, ~7 each article;
integrated with tables
1665 1700 1800 1900 2000
Data are part of the article in the form of visuals and tables
30% of articles with visuals;
5% have tables
30% with visuals; use of tables
increases
90% with figures and tables;
occupy 25% of space
First line graphs and bar charts:
Playfair (1786)
First pie chart: Playfair (1801)
First scatterplots: Hershel (1833), Galton (1896)
Data visuals evolve from illustrations to scientific arguments
50% with visuals, ~7 each article;
integrated with tables
Source: Gross Harmon, Reidy, Communicating Science, 2002
1665 1700 1800 1900 2000
Science communication adapts to the increase in cognitive complexity
Science communication adapts to the increase in cognitive complexity
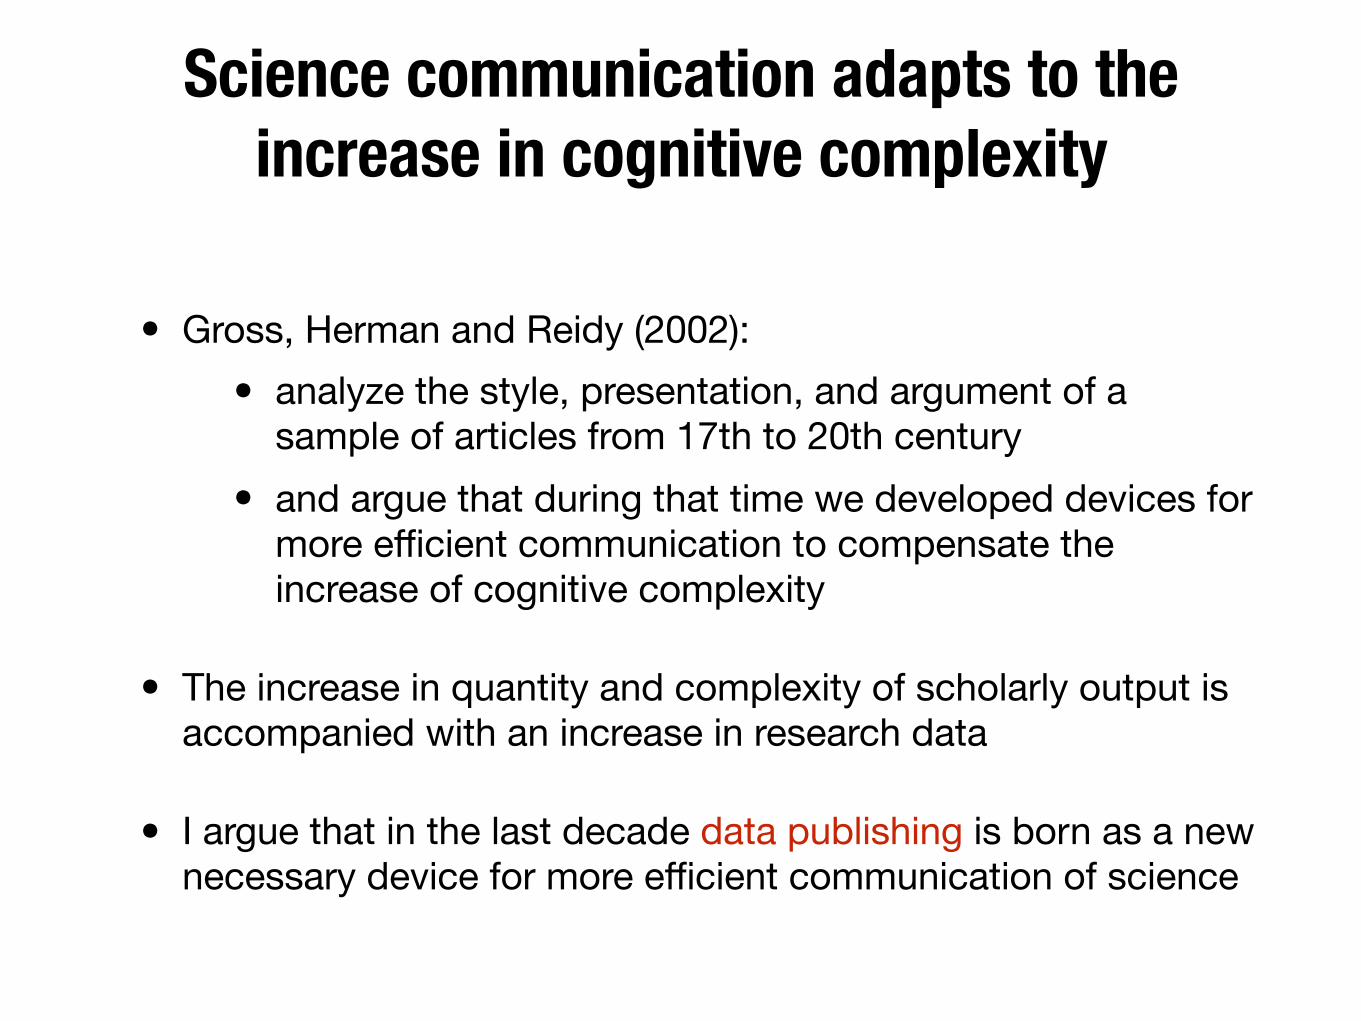
• Gross, Herman and Reidy (2002):
Science communication adapts to the increase in cognitive complexity
• Gross, Herman and Reidy (2002):
• analyze the style, presentation, and argument of a sample of articles from 17th to 20th century
Science communication adapts to the increase in cognitive complexity
• Gross, Herman and Reidy (2002):
• analyze the style, presentation, and argument of a sample of articles from 17th to 20th century
• and argue that during that time we developed devices for more efficient communication to compensate the increase of cognitive complexity
• The increase in quantity and complexity of scholarly output is accompanied with an increase in research data
• I argue that in the last decade data publishing is born as a new necessary device for more efficient communication of science
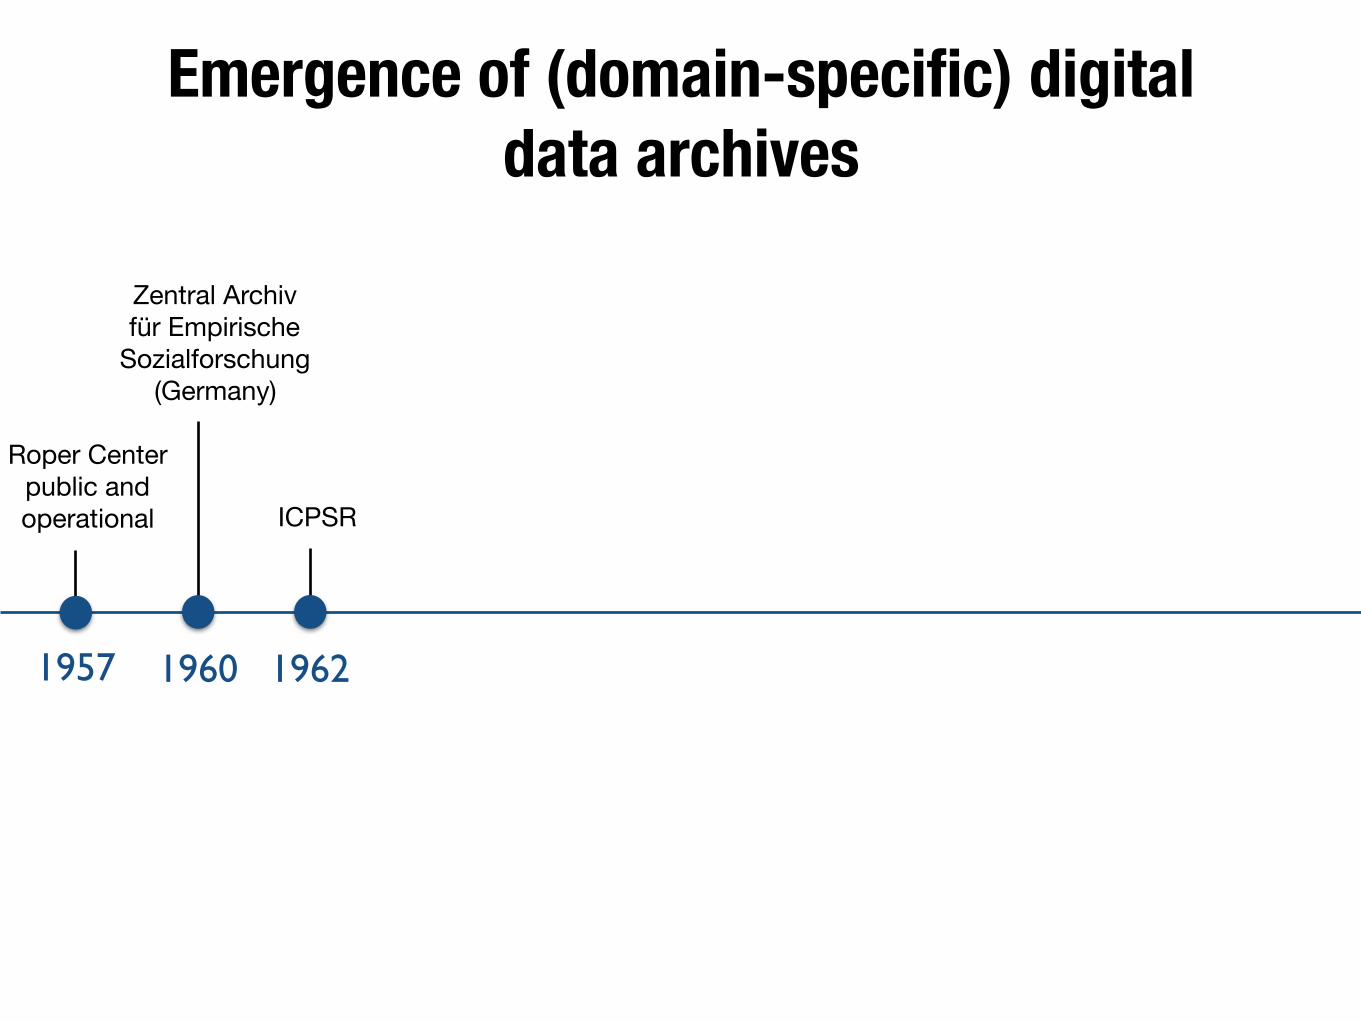
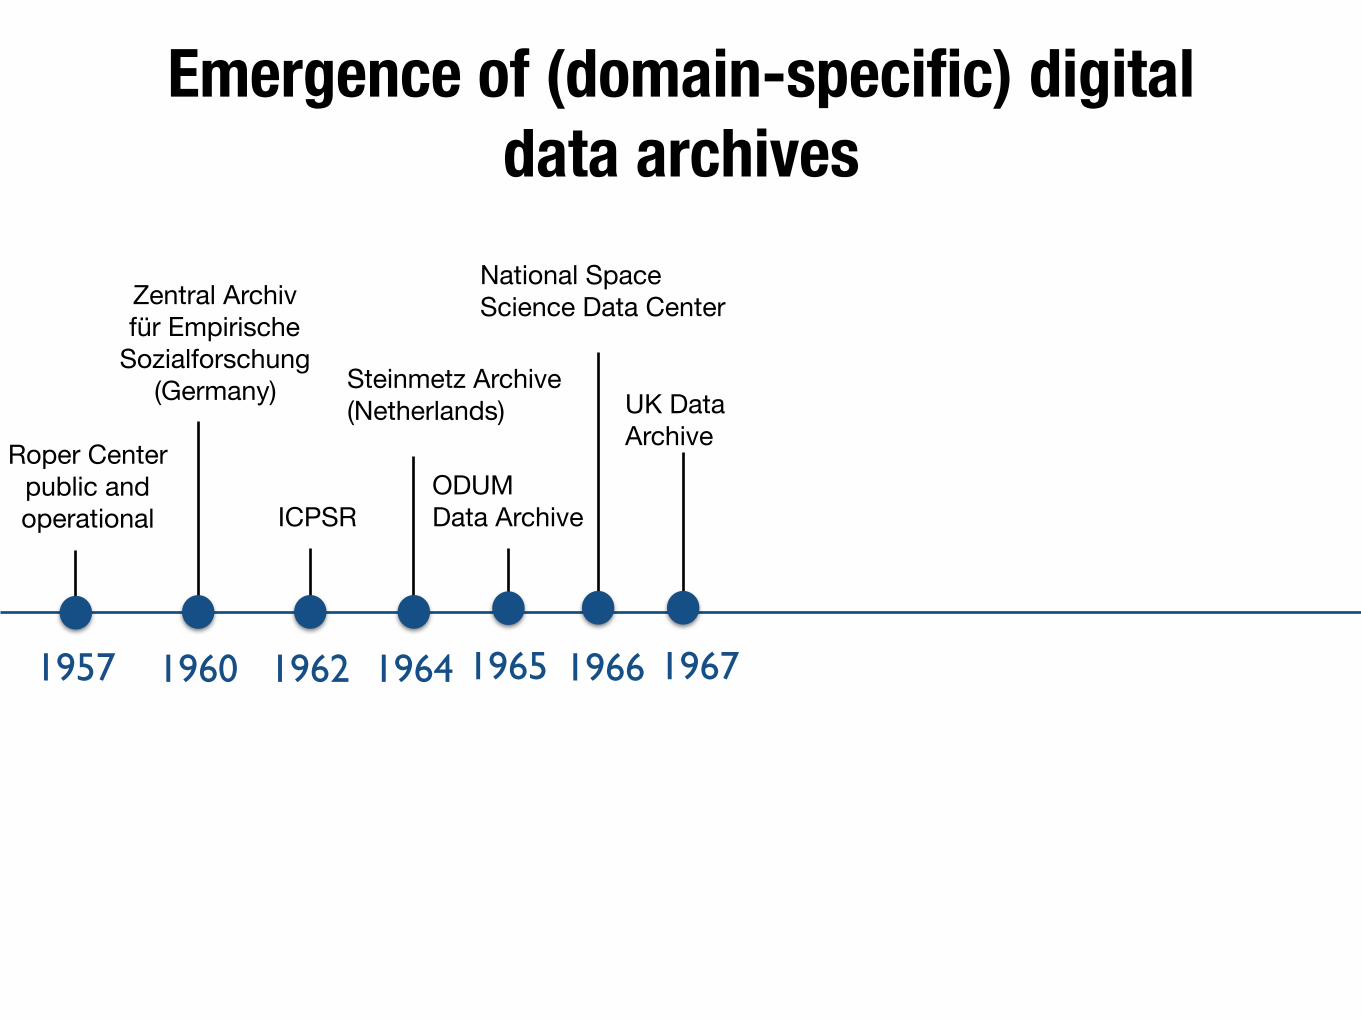
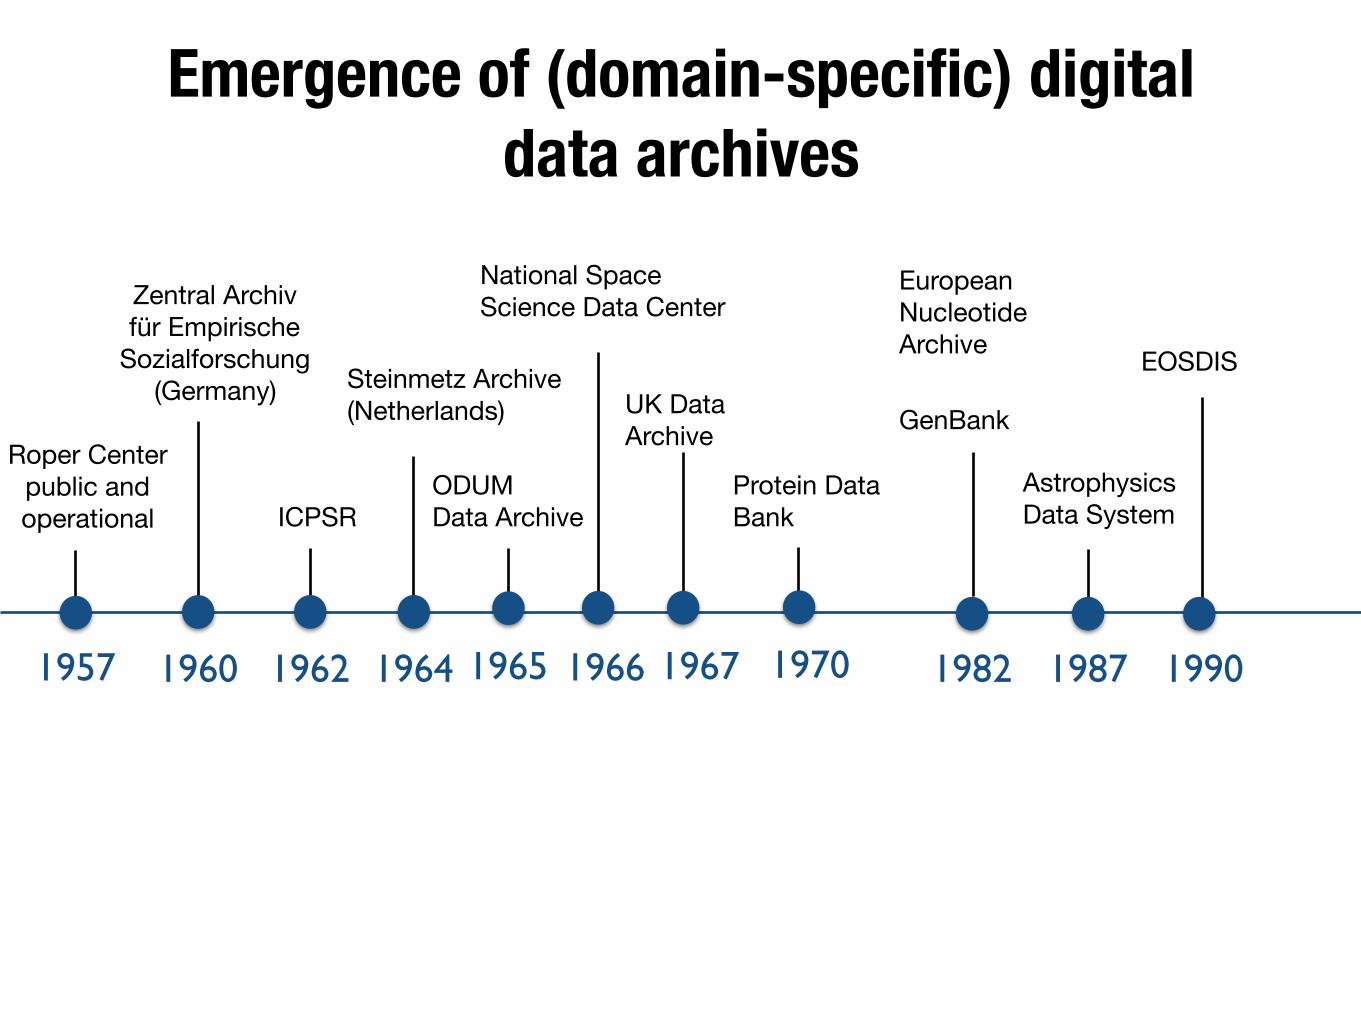
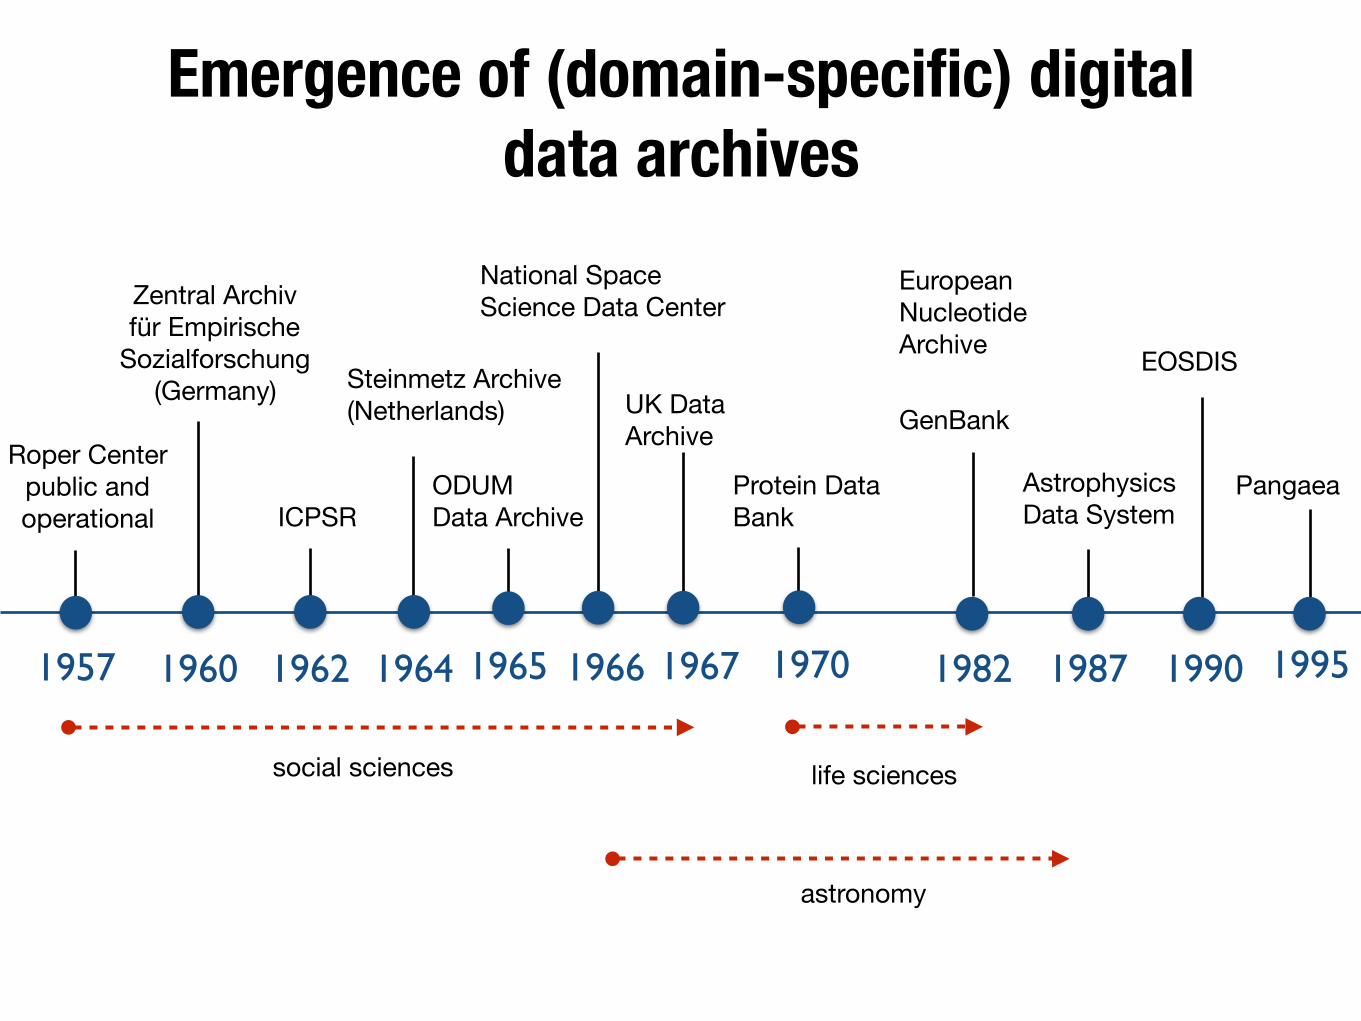
Emergence of (domain-specific) digital data archives
Emergence of (domain-specific) digital data archives
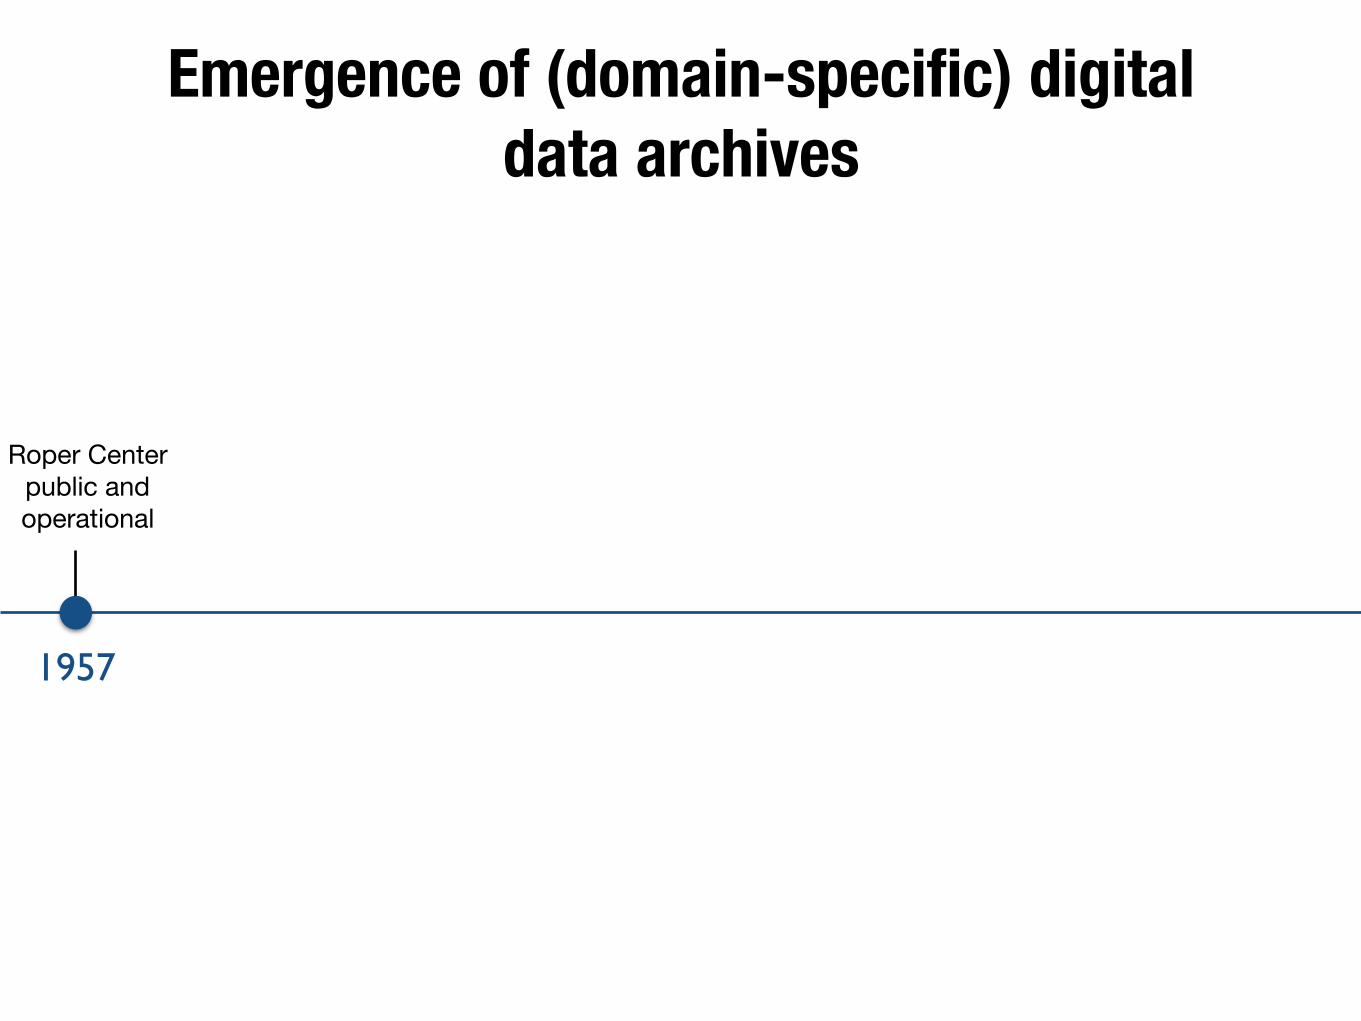
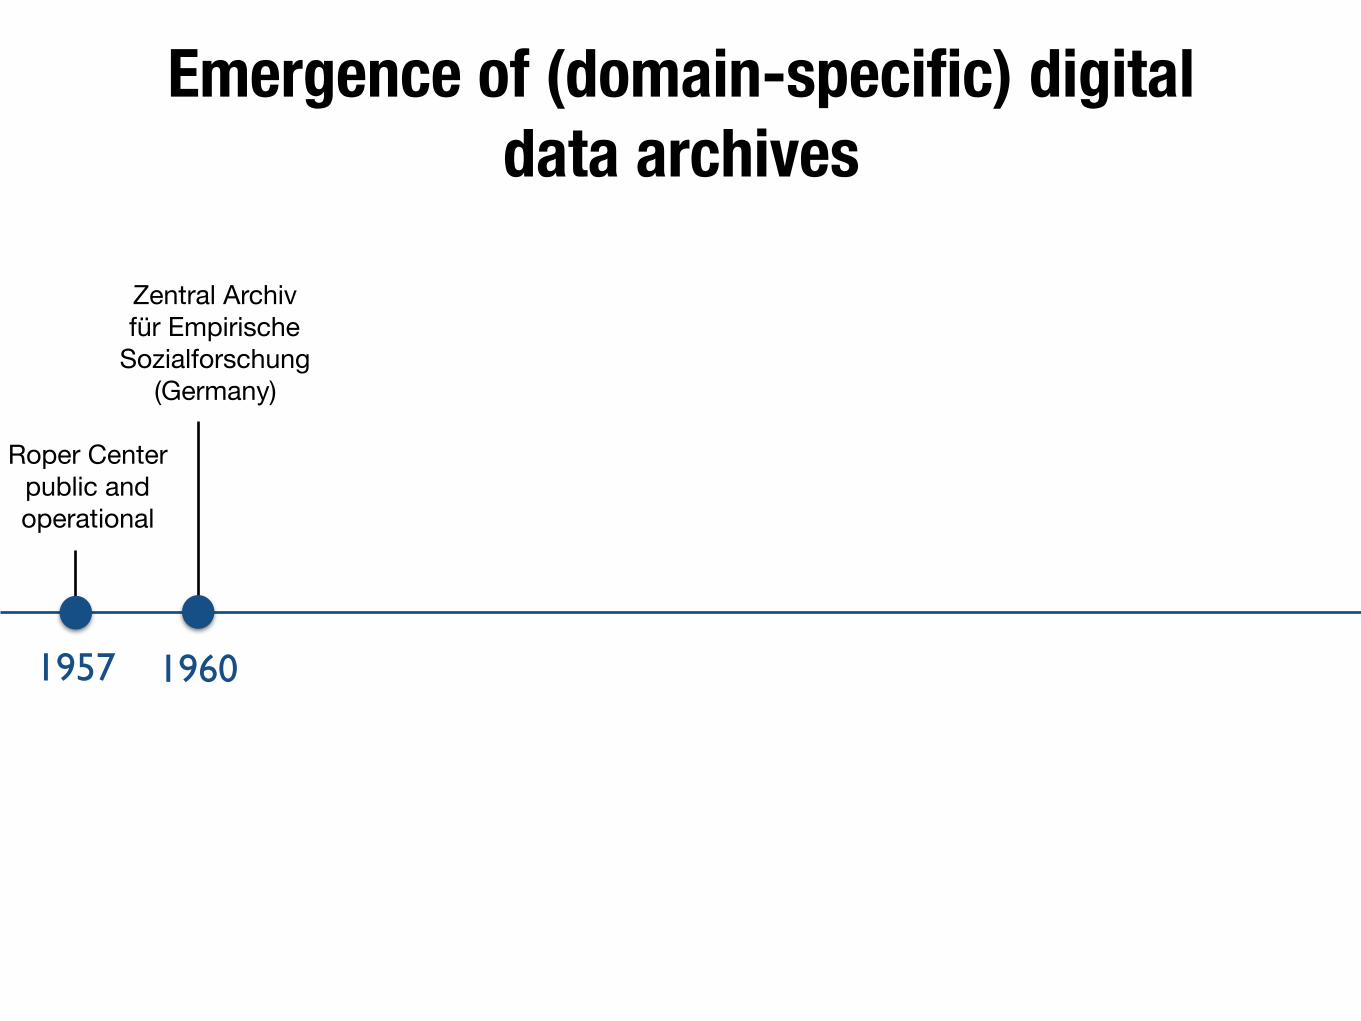
1957
Roper Center public and operational
Emergence of (domain-specific) digital data archives
1957 1960
Roper Center public and operational
Zentral Archiv für Empirische
Sozialforschung (Germany)
Emergence of (domain-specific) digital data archives
1957 1960 1962
Roper Center public and operational
Zentral Archiv für Empirische
Sozialforschung (Germany)
ICPSR
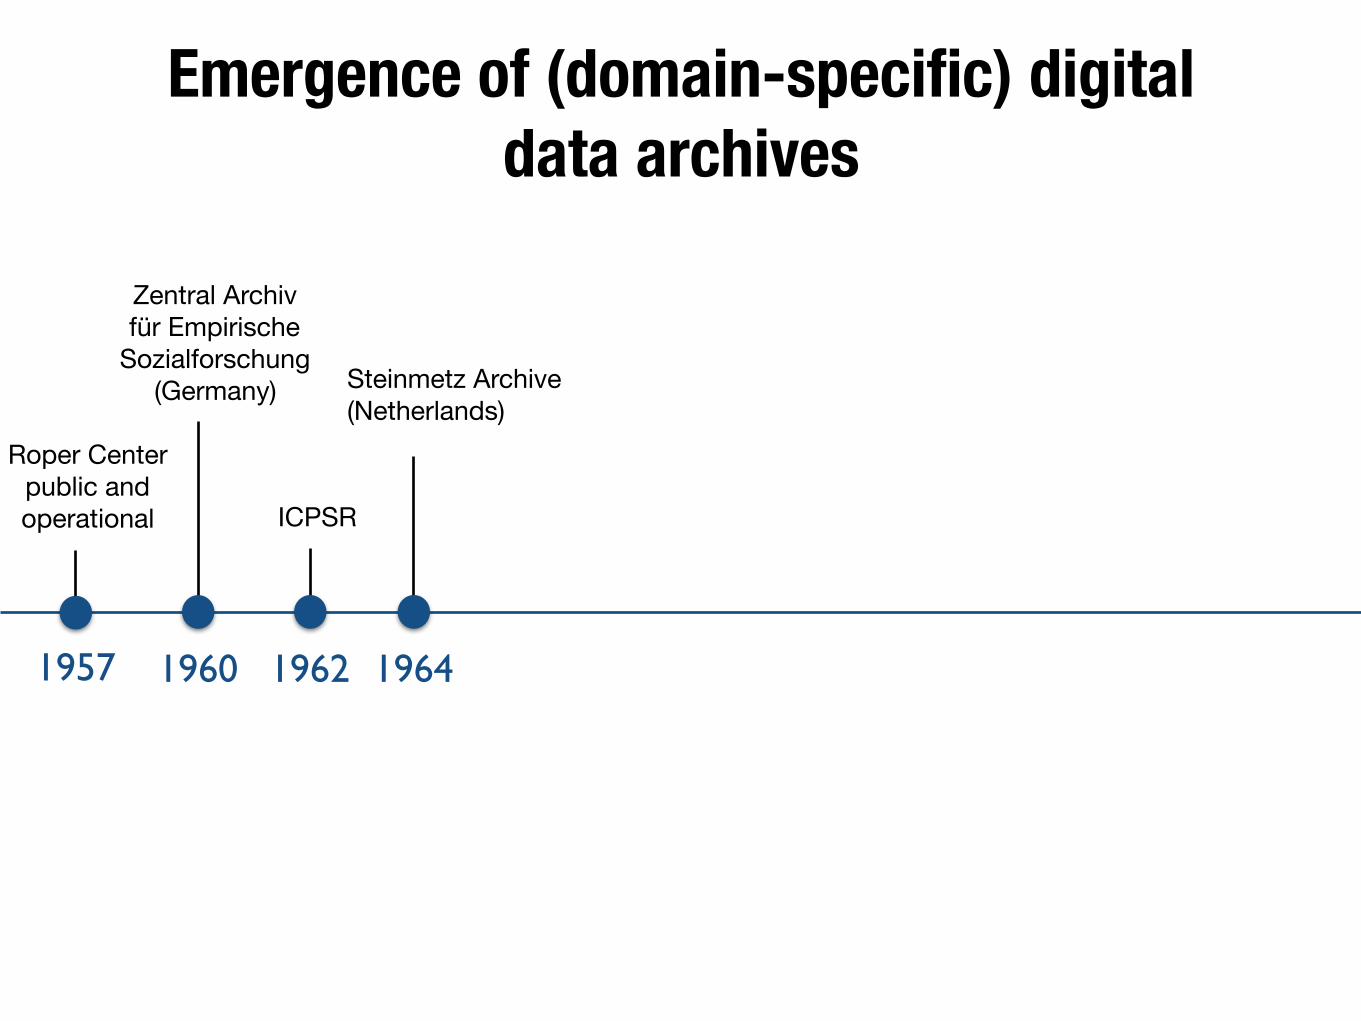
Emergence of (domain-specific) digital data archives
1957 1960 19641962
Roper Center public and operational
Zentral Archiv für Empirische
Sozialforschung (Germany)
ICPSR
Steinmetz Archive(Netherlands)
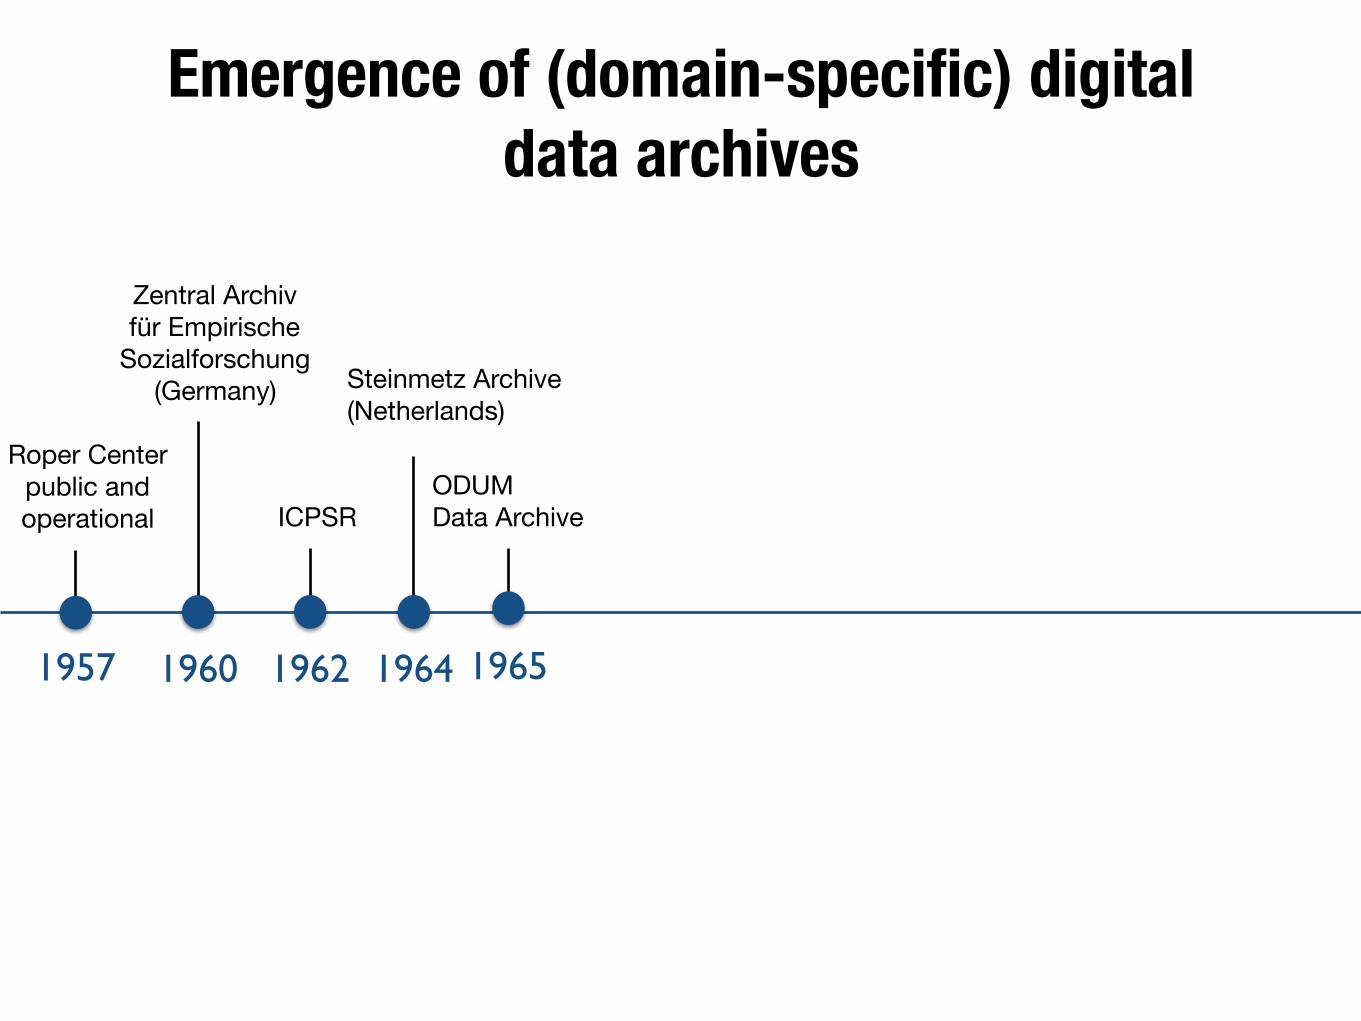
Emergence of (domain-specific) digital data archives
1957 1960 19641962
Roper Center public and operational
Zentral Archiv für Empirische
Sozialforschung (Germany)
ICPSR
Steinmetz Archive(Netherlands)
ODUMData Archive
1965
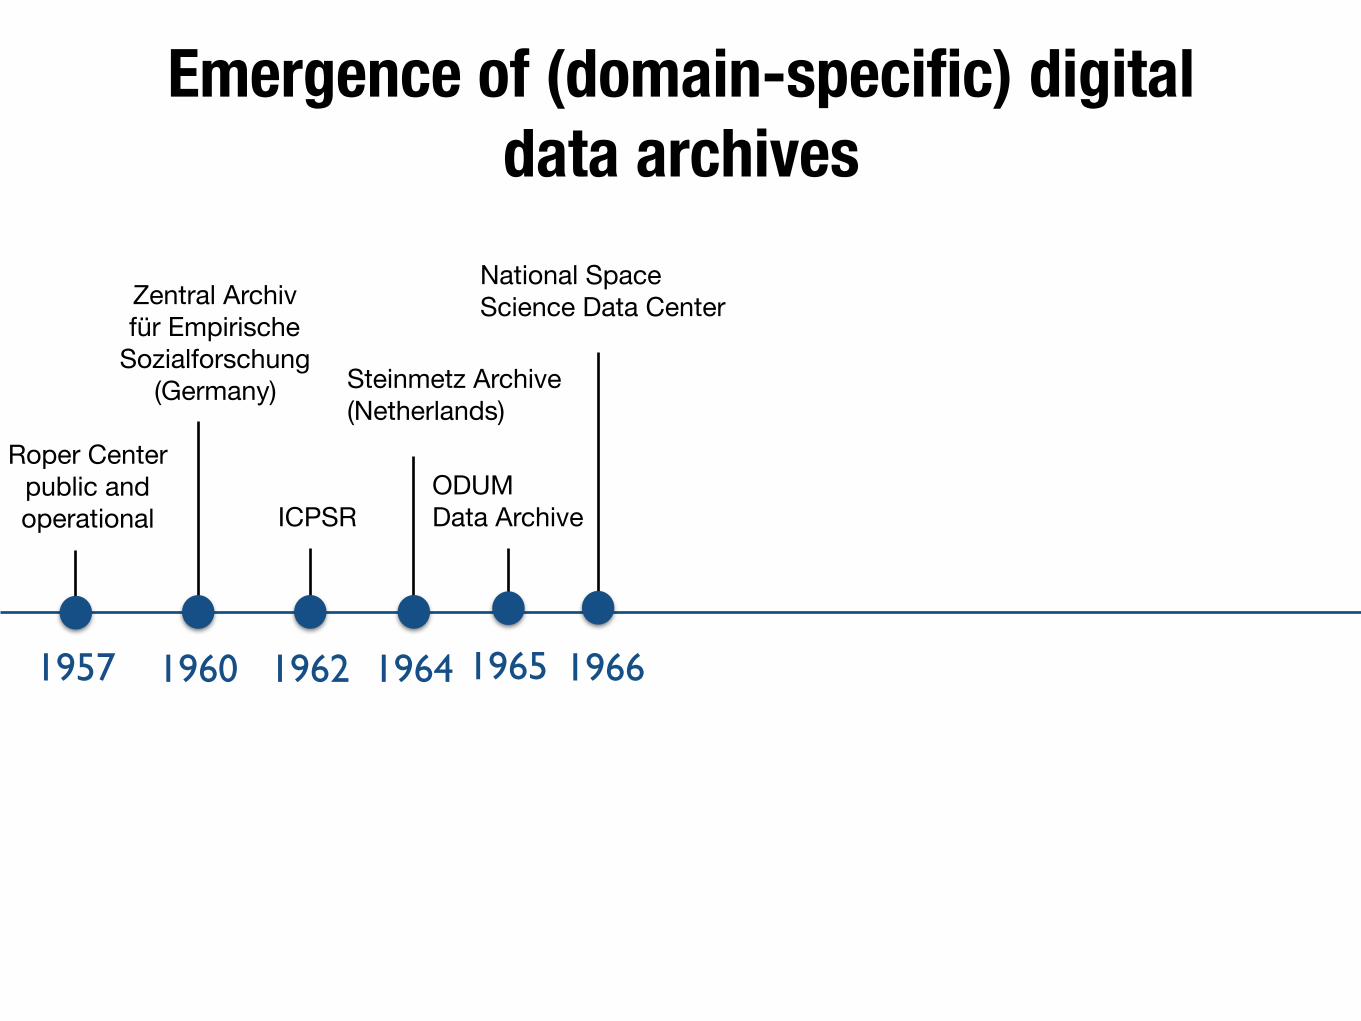
Emergence of (domain-specific) digital data archives
1957 1960 19641962
Roper Center public and operational
Zentral Archiv für Empirische
Sozialforschung (Germany)
ICPSR
Steinmetz Archive(Netherlands)
ODUMData Archive
1965 1966
National Space Science Data Center
Emergence of (domain-specific) digital data archives
1957 1960 19641962
Roper Center public and operational
Zentral Archiv für Empirische
Sozialforschung (Germany)
ICPSR
Steinmetz Archive(Netherlands)
ODUMData Archive
UK Data Archive
1965 19671966
National Space Science Data Center
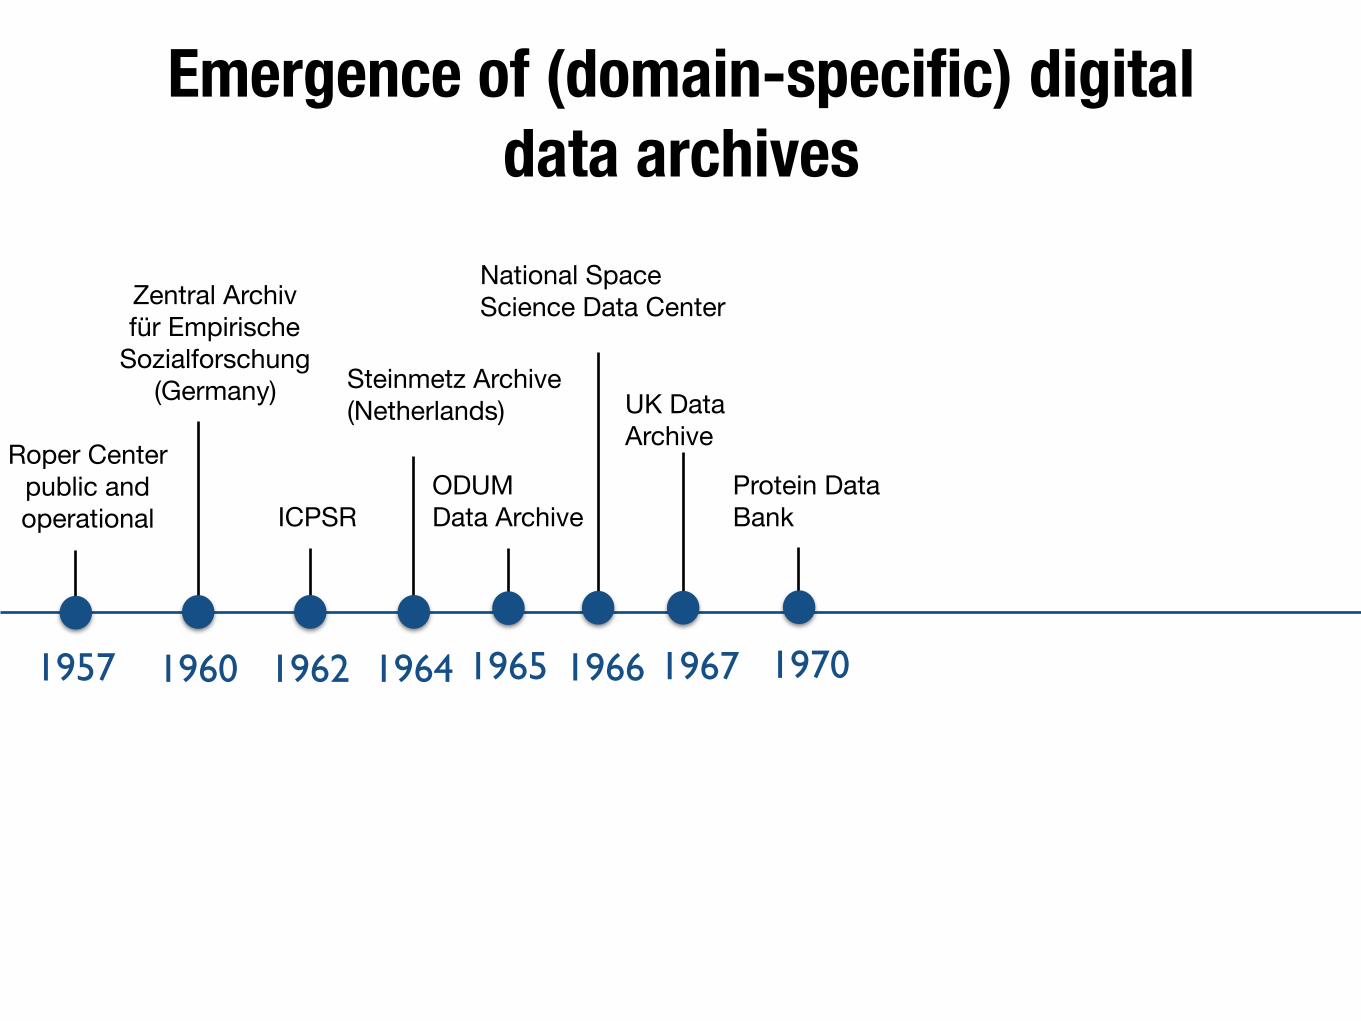
Emergence of (domain-specific) digital data archives
1957 1960 1964 19701962
Roper Center public and operational
Zentral Archiv für Empirische
Sozialforschung (Germany)
ICPSR
Steinmetz Archive(Netherlands)
ODUMData Archive
UK Data Archive
Protein Data Bank
1965 19671966
National Space Science Data Center
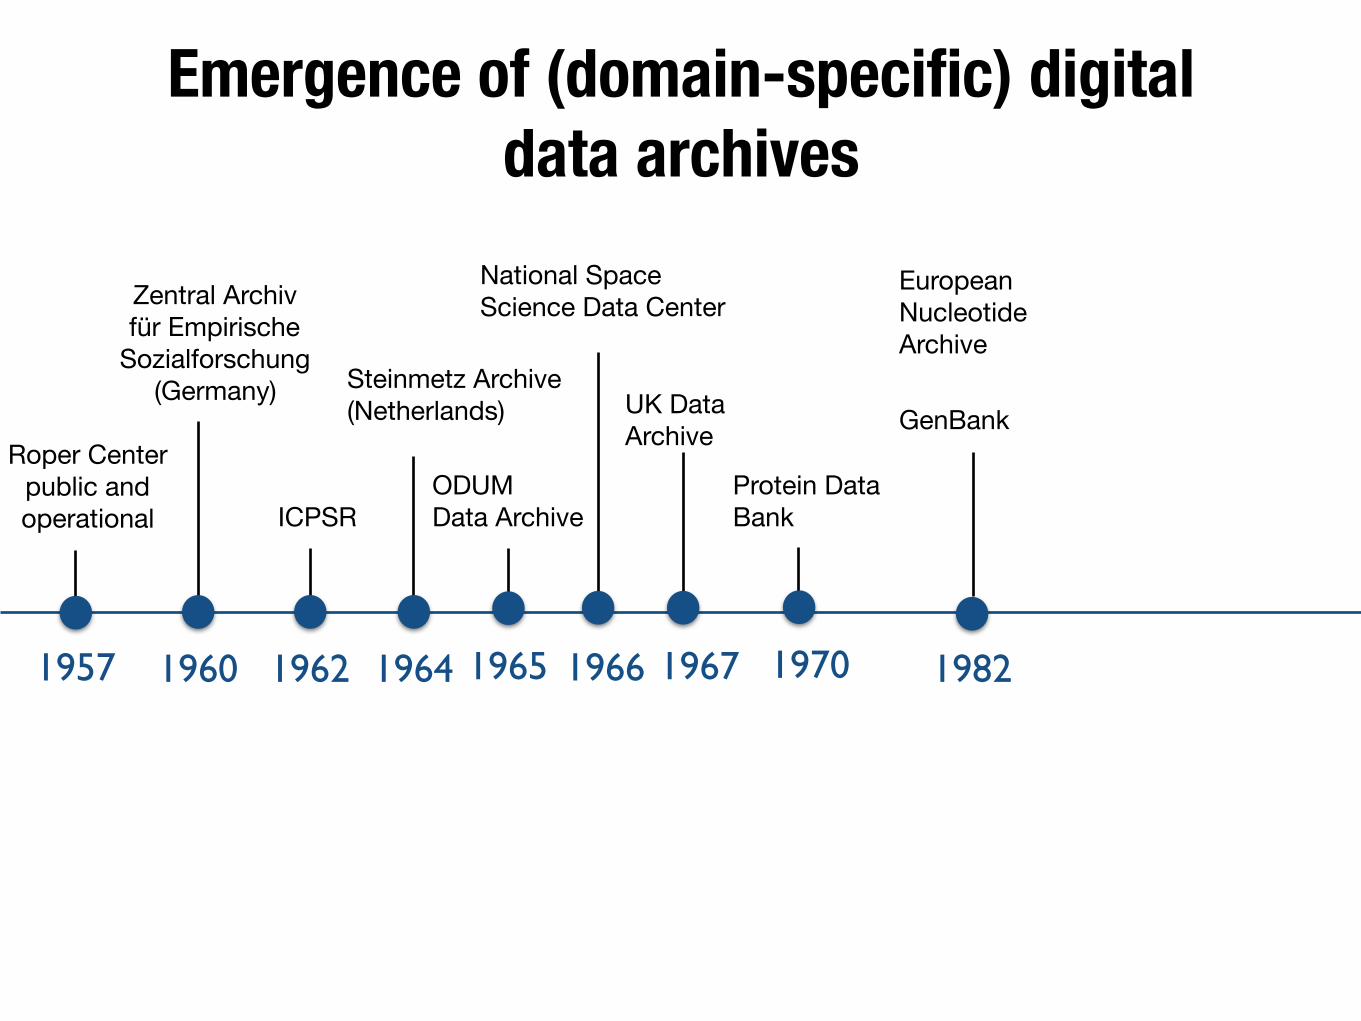
Emergence of (domain-specific) digital data archives
1957 1960 1964 1970 19821962
Roper Center public and operational
Zentral Archiv für Empirische
Sozialforschung (Germany)
ICPSR
Steinmetz Archive(Netherlands)
ODUMData Archive
UK Data Archive
Protein Data Bank
European Nucleotide Archive
GenBank
1965 19671966
National Space Science Data Center
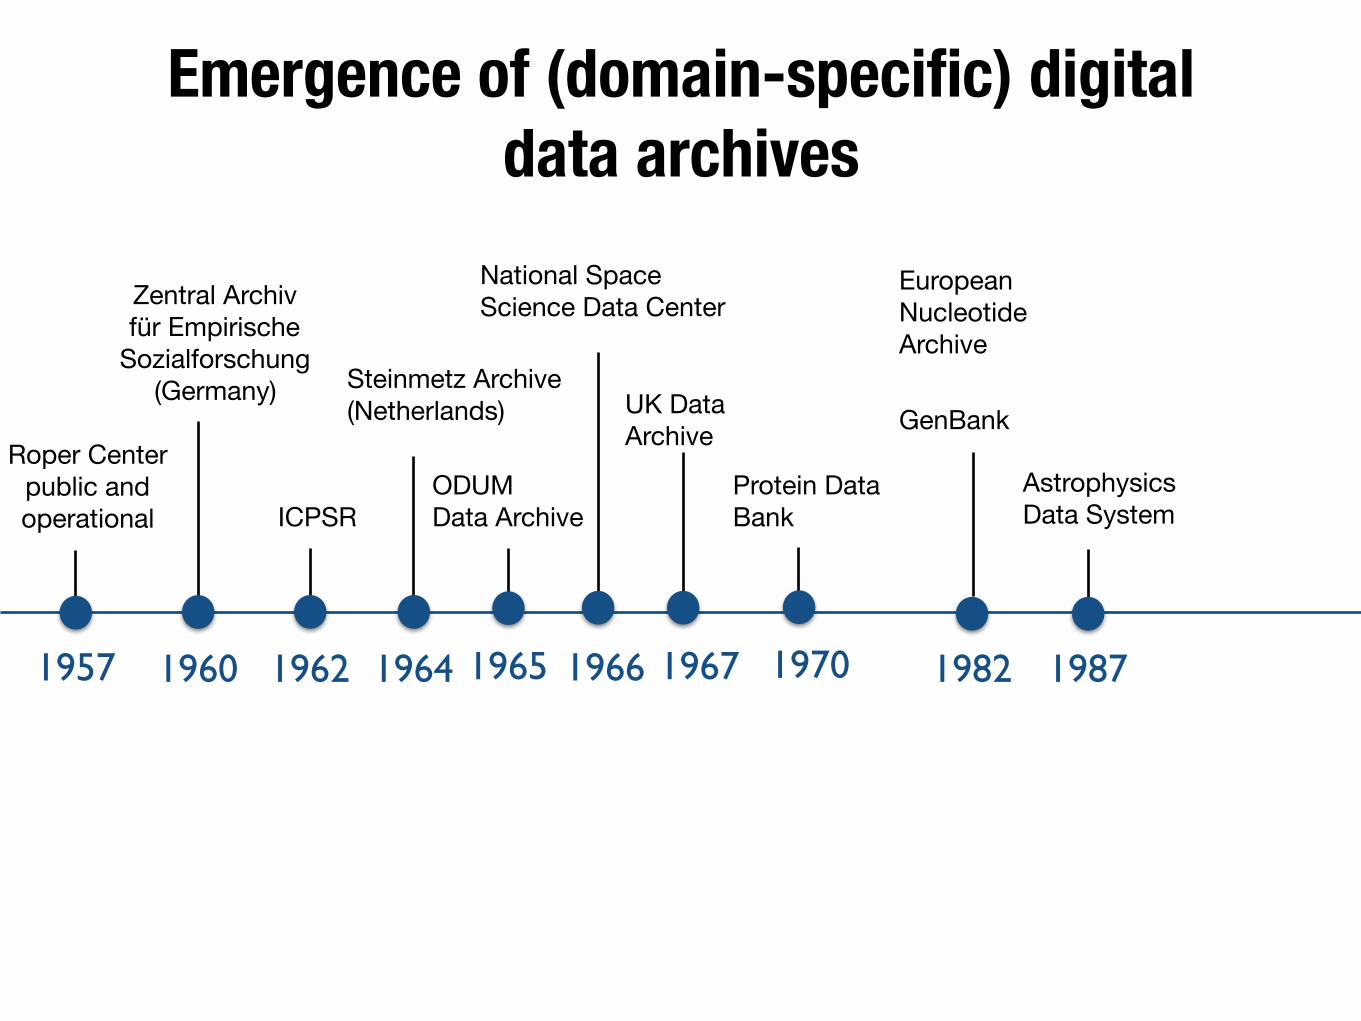
Emergence of (domain-specific) digital data archives
1957 1960 1964 1970 19821962
Roper Center public and operational
Zentral Archiv für Empirische
Sozialforschung (Germany)
ICPSR
Steinmetz Archive(Netherlands)
ODUMData Archive
UK Data Archive
Protein Data Bank
European Nucleotide Archive
GenBank
1965 19671966
National Space Science Data Center
1987
Astrophysics Data System
1990
EOSDIS
Emergence of (domain-specific) digital data archives
1957 1960 1964 1970 19821962
Roper Center public and operational
Zentral Archiv für Empirische
Sozialforschung (Germany)
ICPSR
Steinmetz Archive(Netherlands)
ODUMData Archive
UK Data Archive
Protein Data Bank
European Nucleotide Archive
GenBank
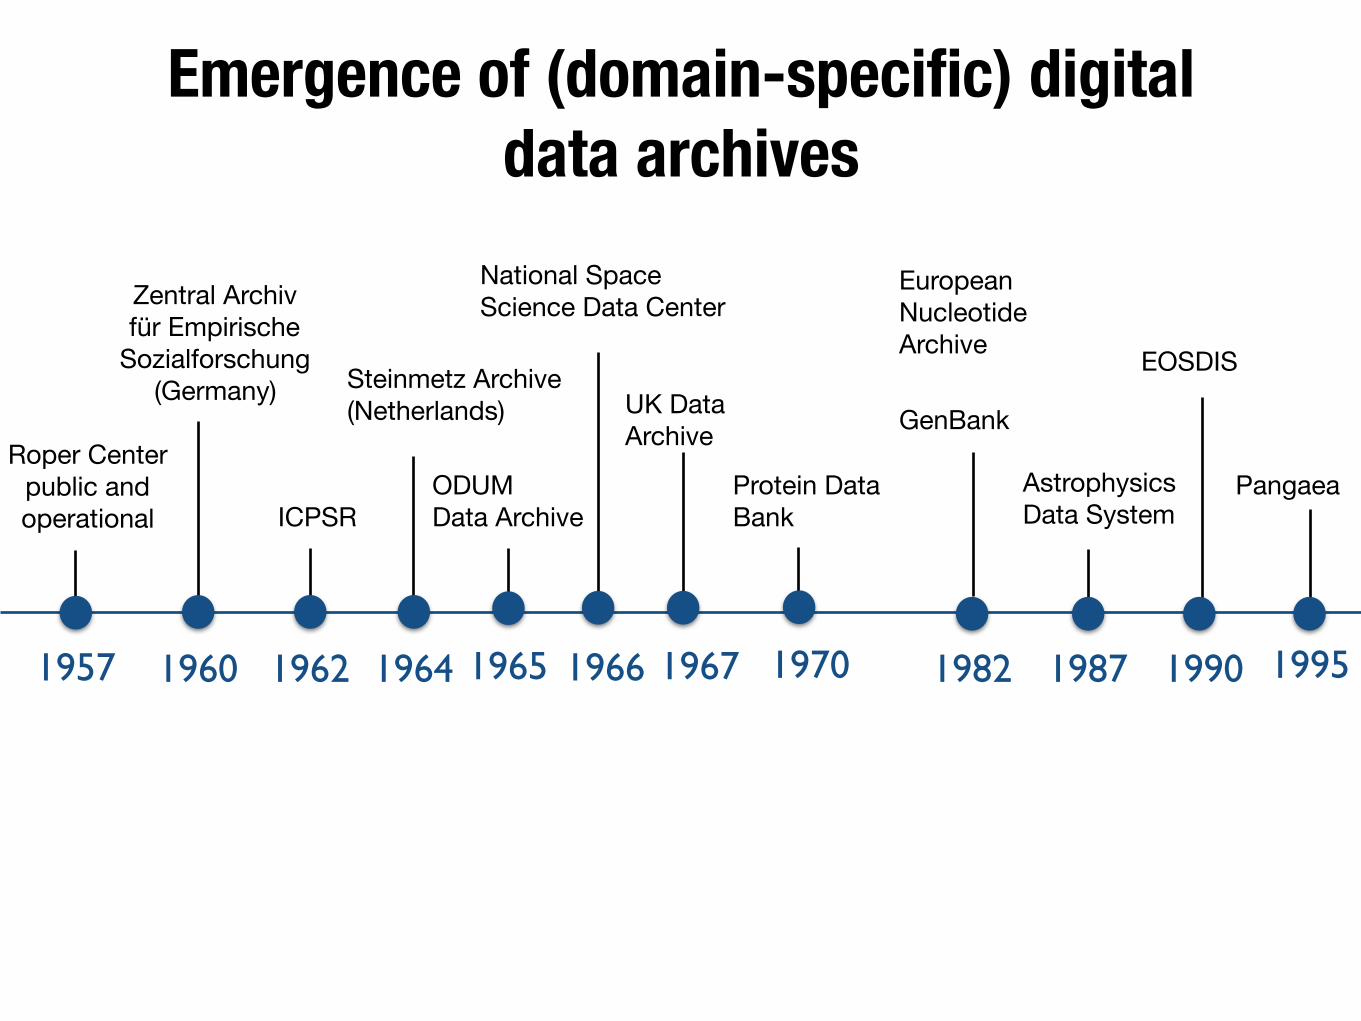
1965 1967 19951966
National Space Science Data Center
Pangaea
1987
Astrophysics Data System
1990
EOSDIS
Emergence of (domain-specific) digital data archives
1957 1960 1964 1970 19821962
Roper Center public and operational
Zentral Archiv für Empirische
Sozialforschung (Germany)
ICPSR
Steinmetz Archive(Netherlands)
ODUMData Archive
UK Data Archive
Protein Data Bank
European Nucleotide Archive
GenBank
1965 1967
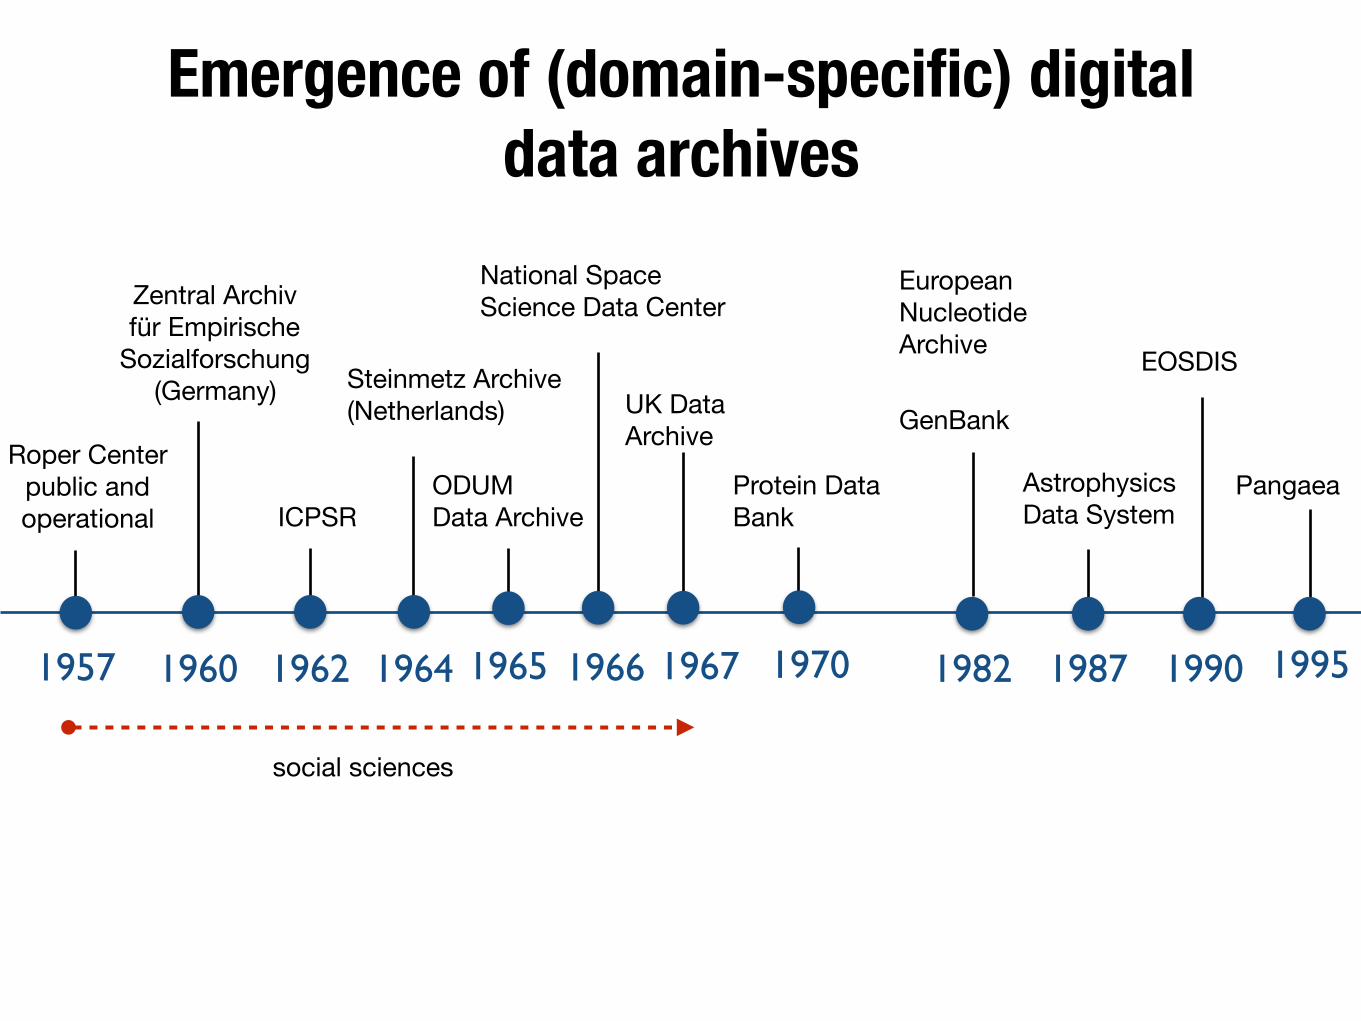
social sciences
19951966
National Space Science Data Center
Pangaea
1987
Astrophysics Data System
1990
EOSDIS
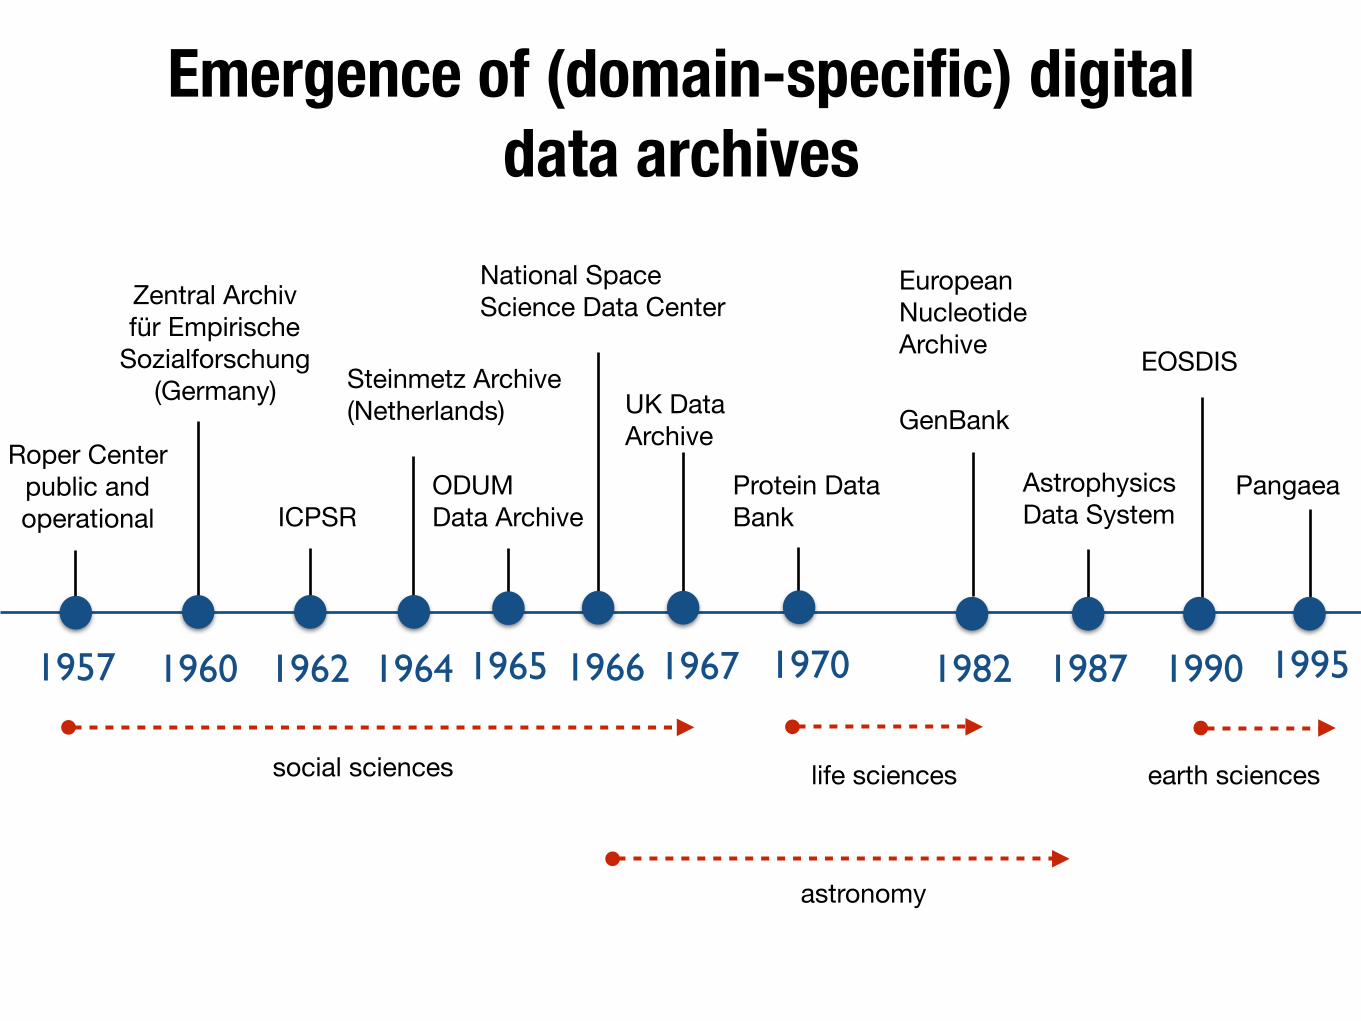
Emergence of (domain-specific) digital data archives
1957 1960 1964 1970 19821962
Roper Center public and operational
Zentral Archiv für Empirische
Sozialforschung (Germany)
ICPSR
Steinmetz Archive(Netherlands)
ODUMData Archive
UK Data Archive
Protein Data Bank
European Nucleotide Archive
GenBank
1965 1967
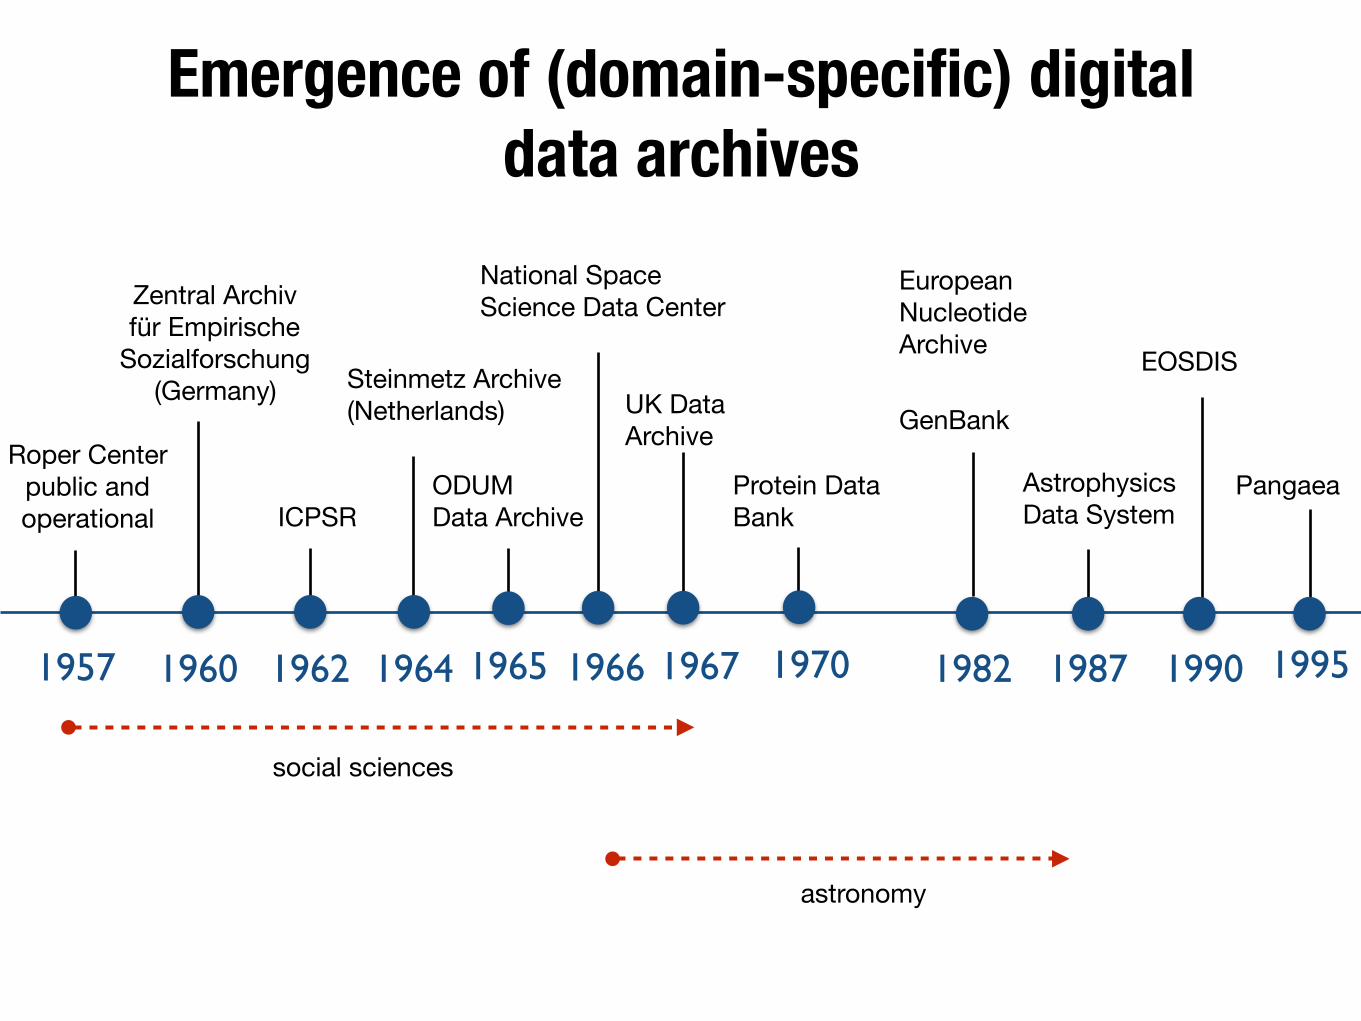
social sciences
19951966
National Space Science Data Center
Pangaea
1987
Astrophysics Data System
1990
EOSDIS
astronomy
Emergence of (domain-specific) digital data archives
1957 1960 1964 1970 19821962
Roper Center public and operational
Zentral Archiv für Empirische
Sozialforschung (Germany)
ICPSR
Steinmetz Archive(Netherlands)
ODUMData Archive
UK Data Archive
Protein Data Bank
European Nucleotide Archive
GenBank
1965 1967
social sciences life sciences
19951966
National Space Science Data Center
Pangaea
1987
Astrophysics Data System
1990
EOSDIS
astronomy
earth sciences
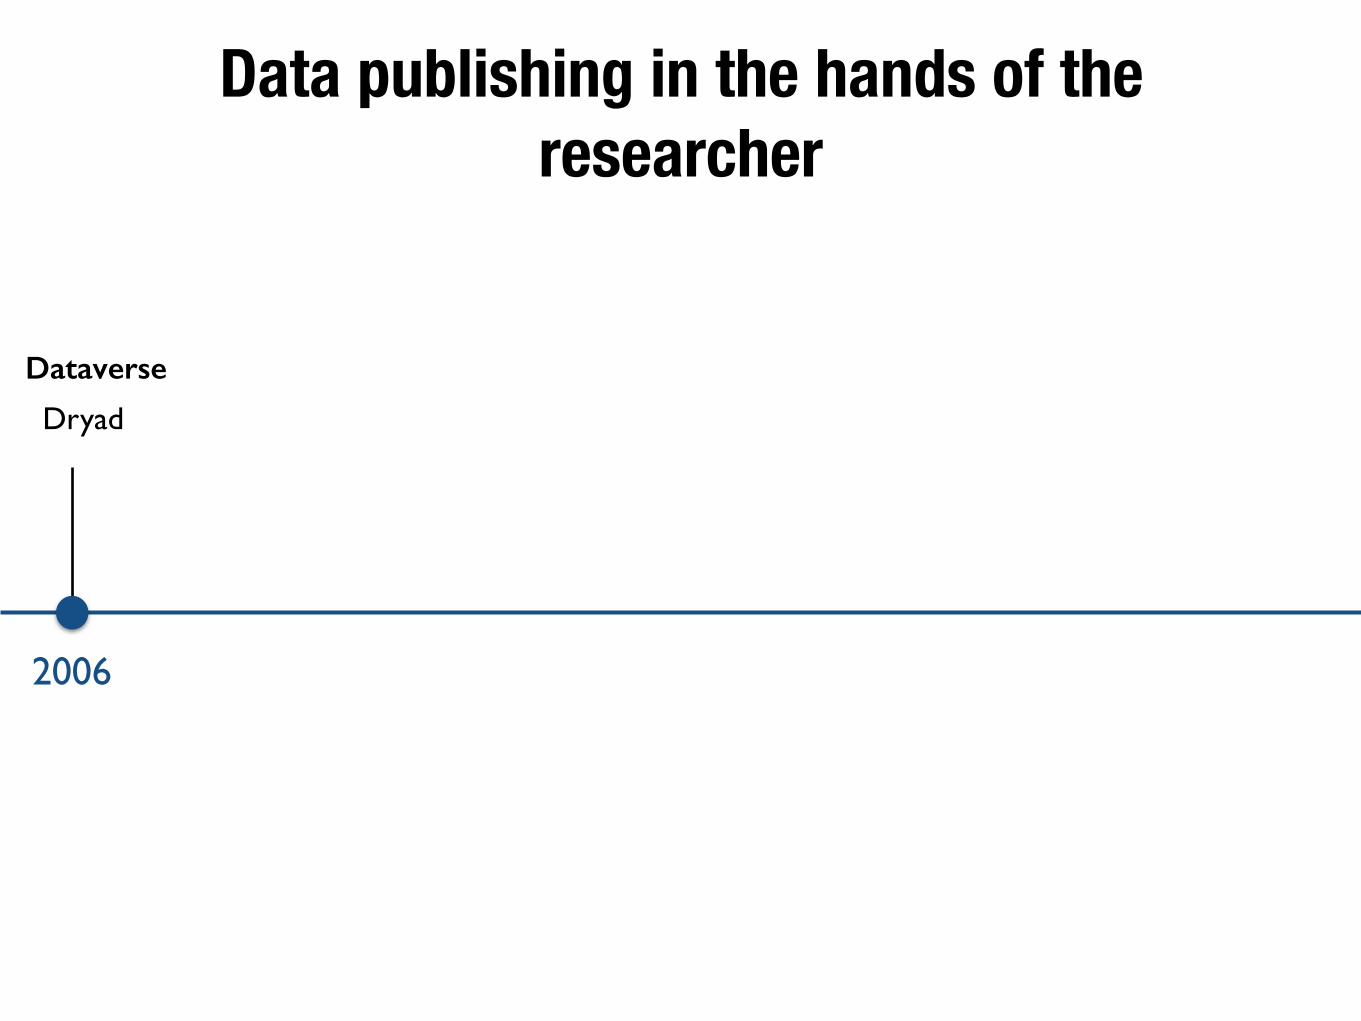
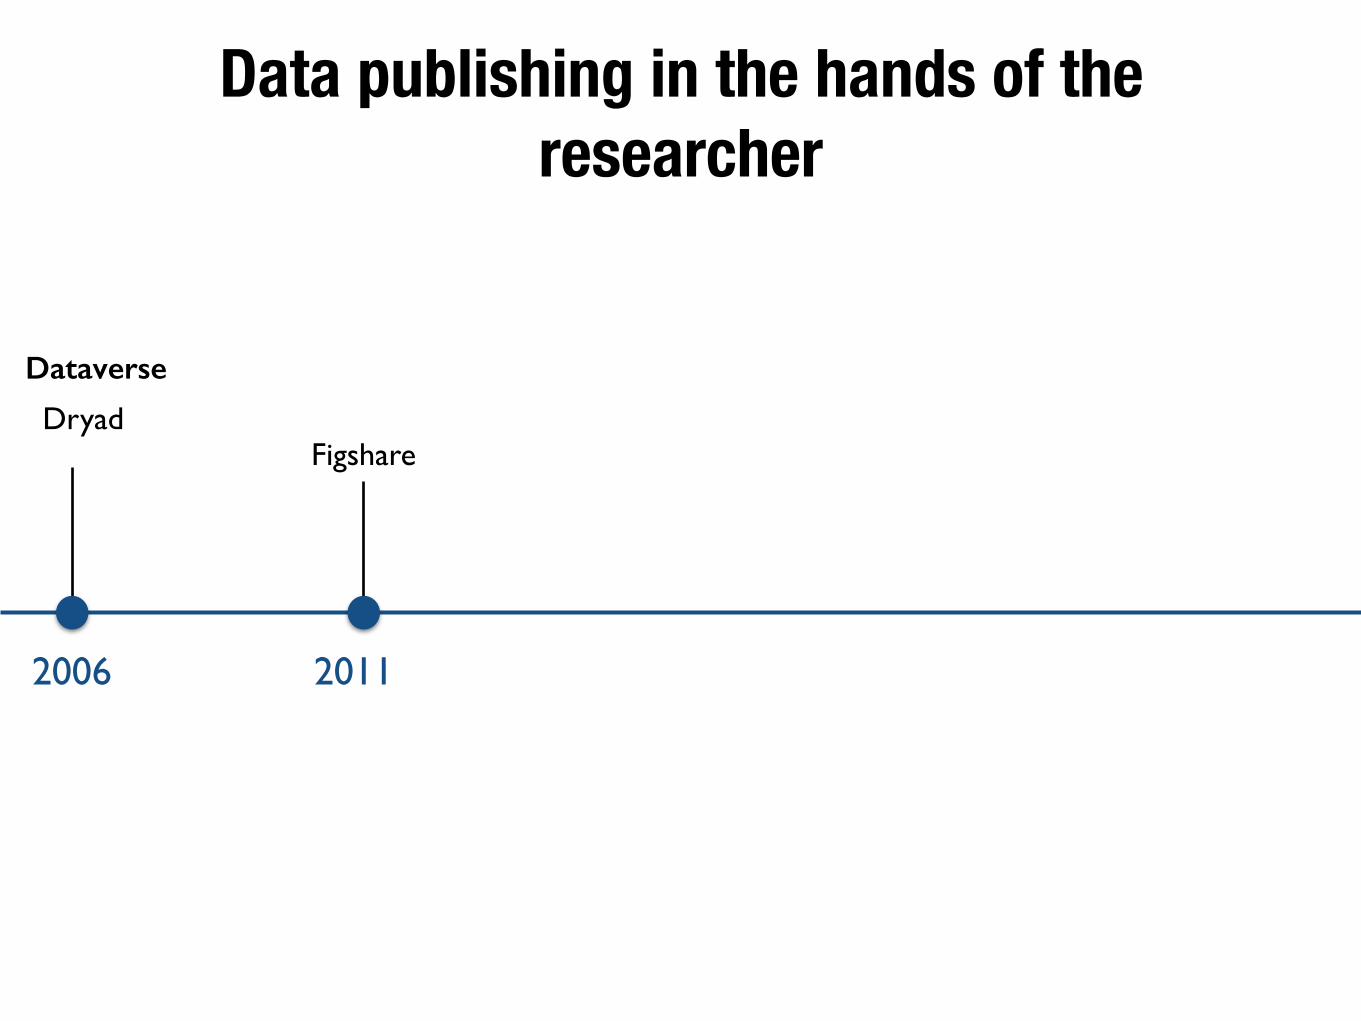
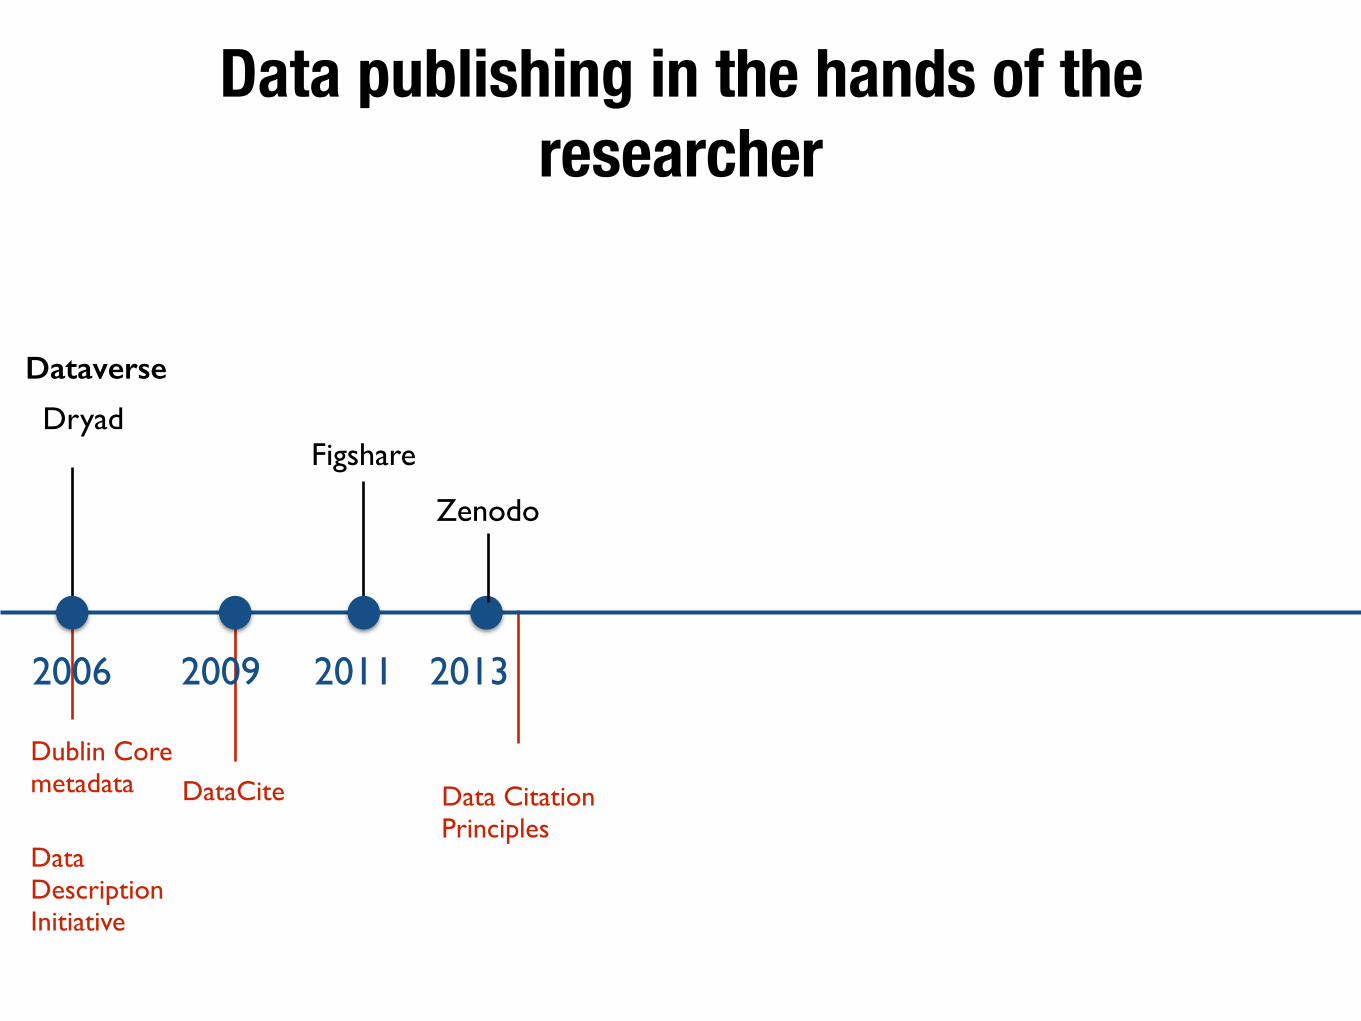
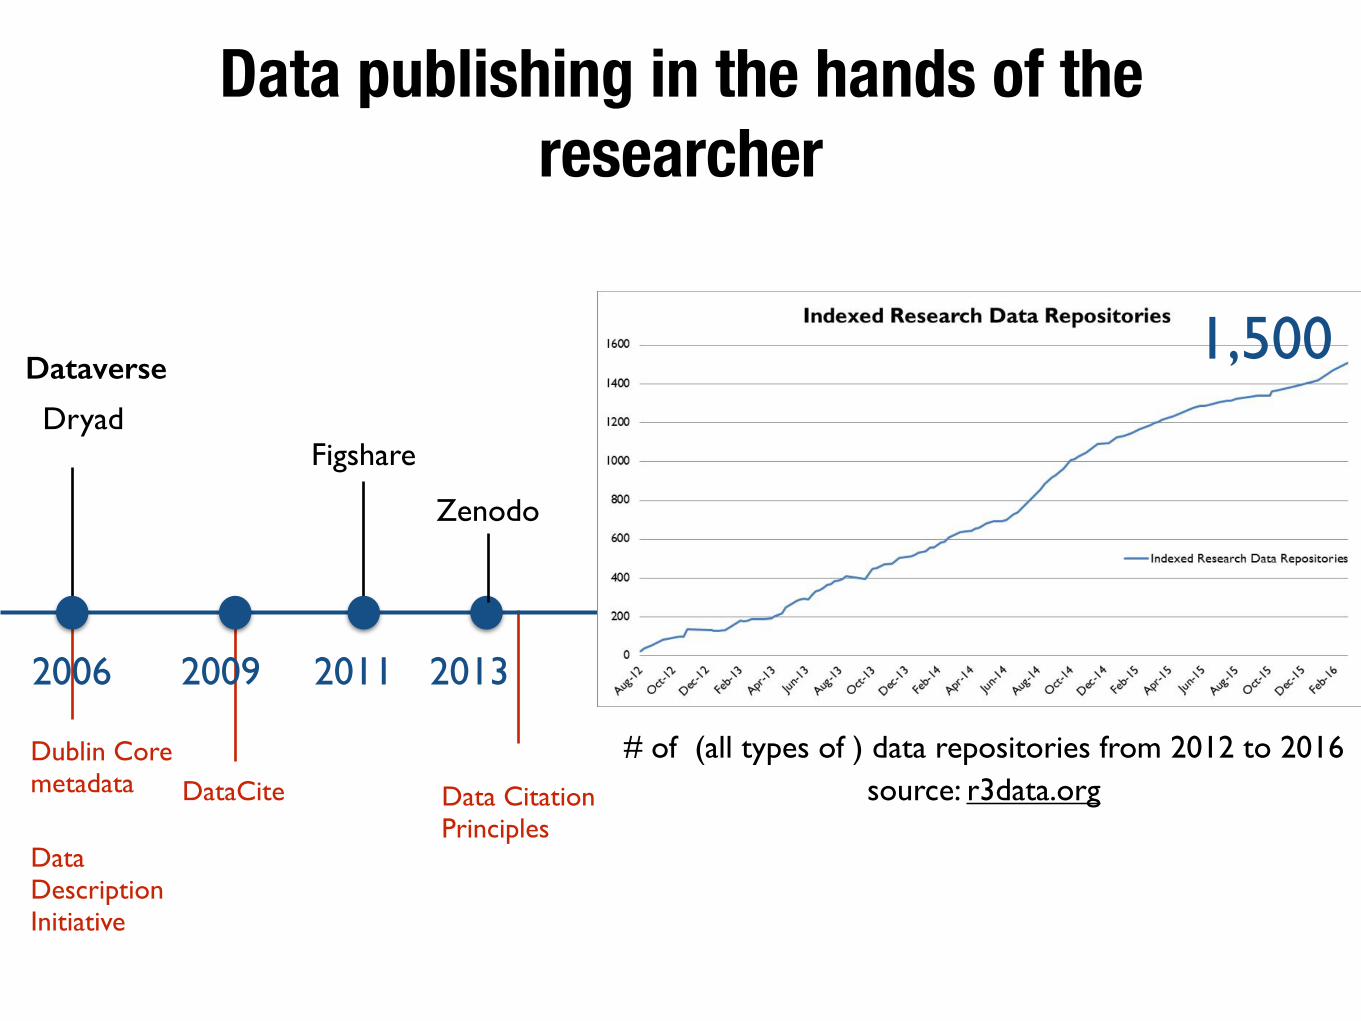
Data publishing in the hands of the researcher
Data publishing in the hands of the researcher
Dataverse
Dryad
2006
Data publishing in the hands of the researcher
Dataverse
DryadFigshare
2006 2011
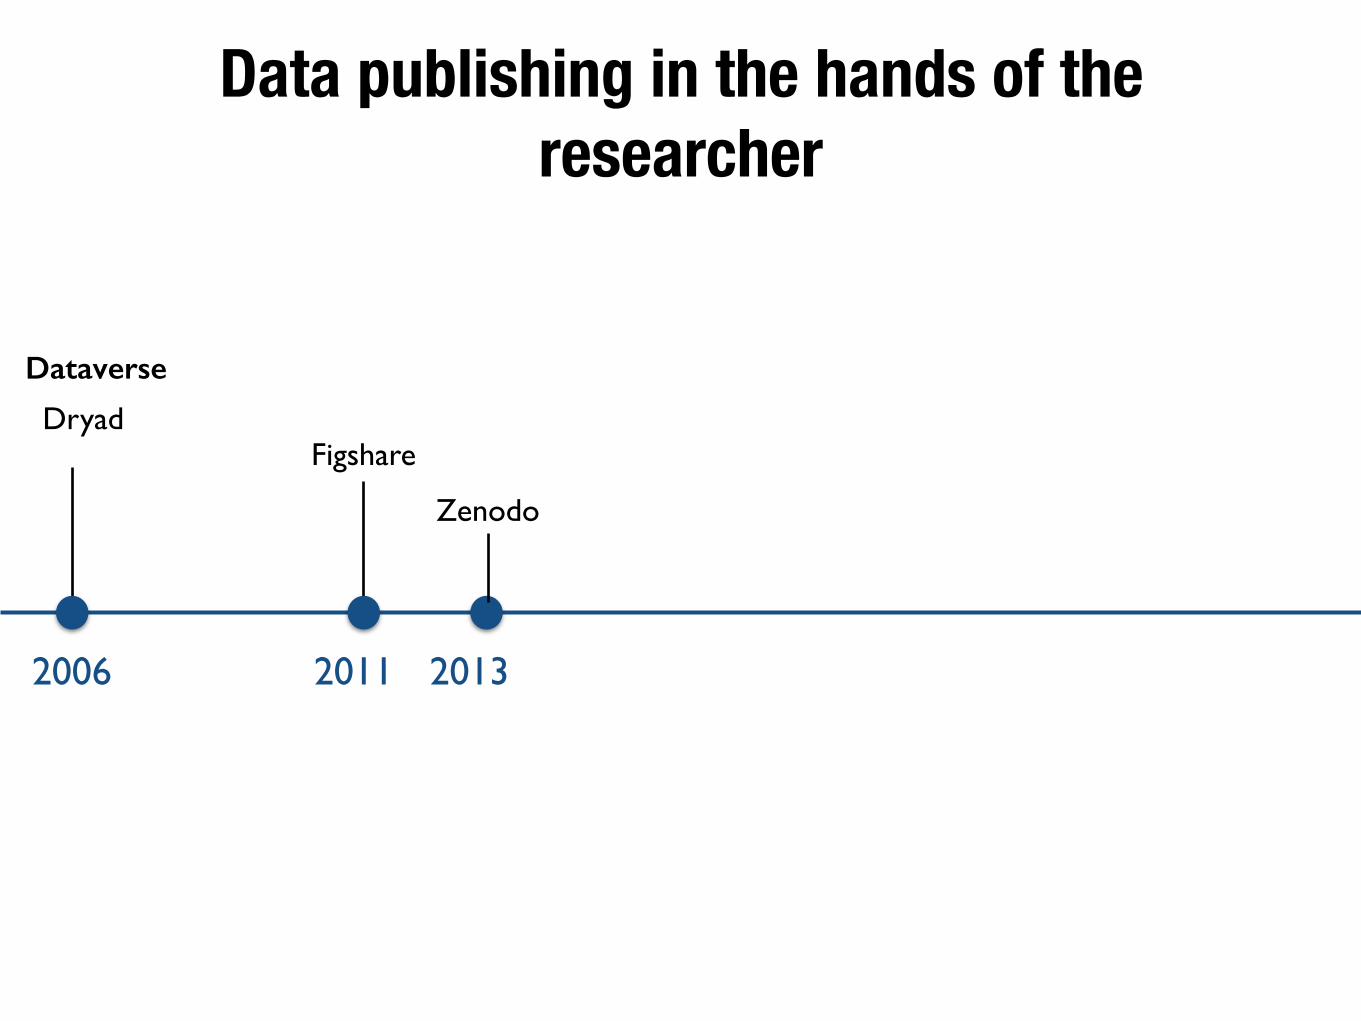
Data publishing in the hands of the researcher
Dataverse
DryadFigshare
Zenodo
2006 2011 2013
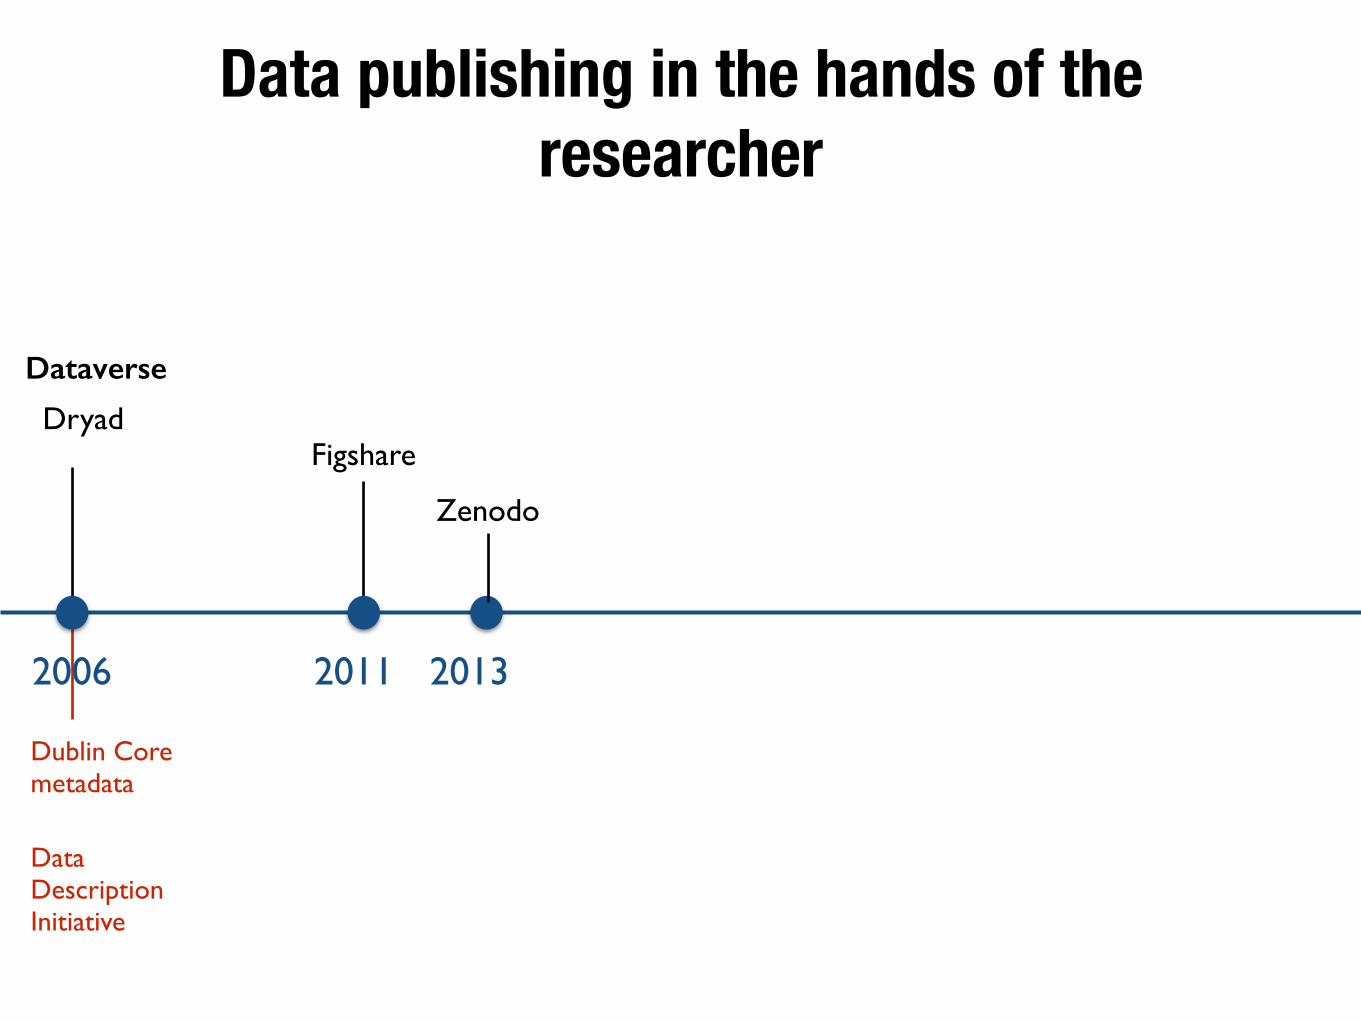
Data publishing in the hands of the researcher
Dataverse
DryadFigshare
Zenodo
2006 2011 2013
Dublin Core metadata
Data Description Initiative
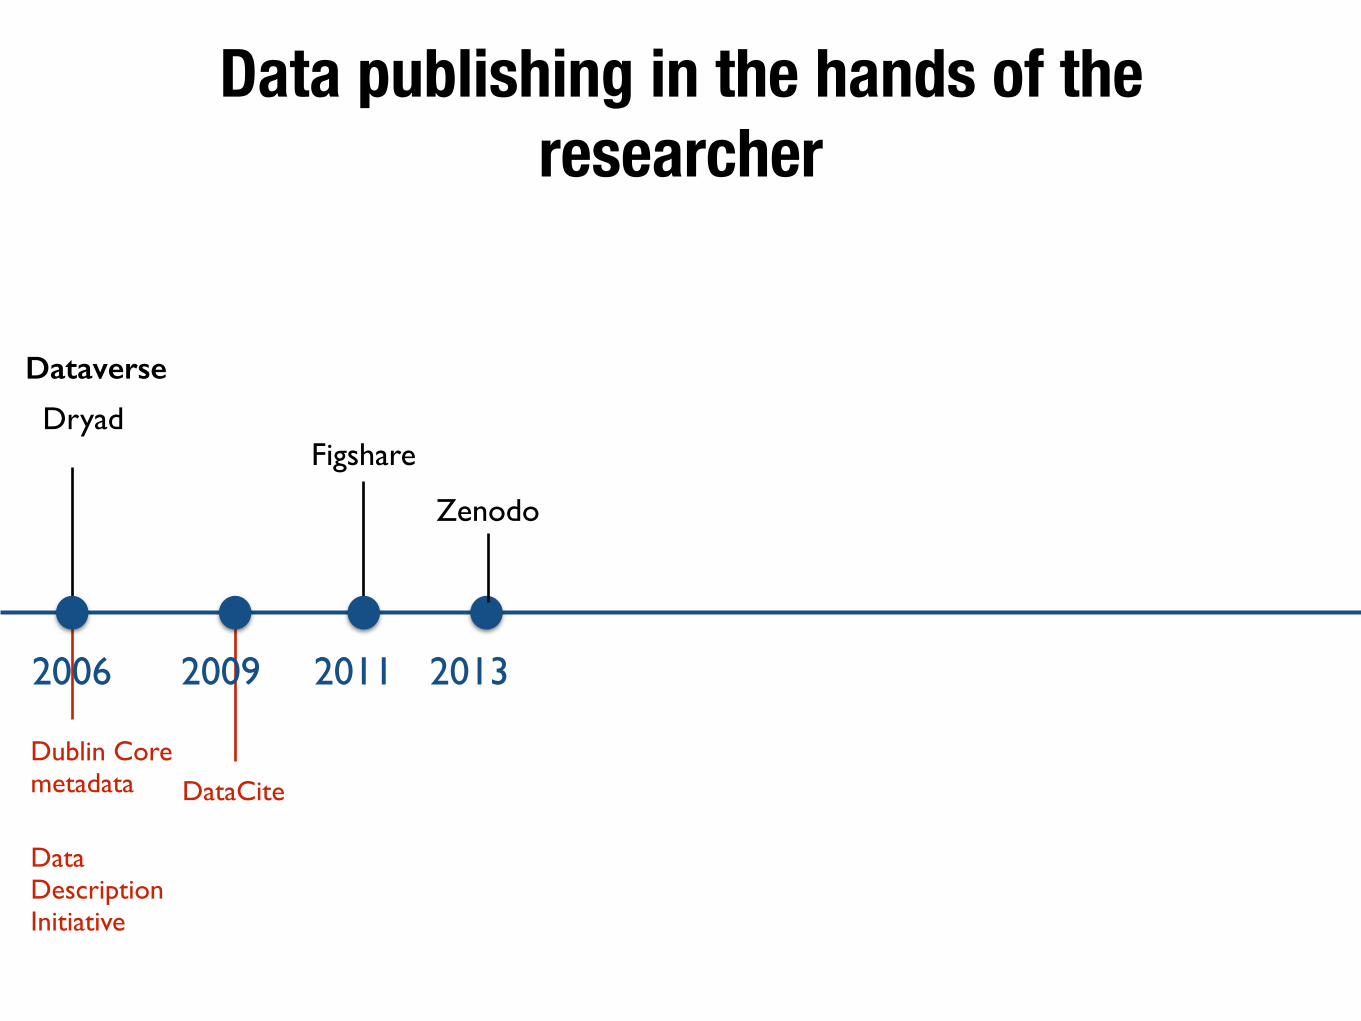
Data publishing in the hands of the researcher
Dataverse
DryadFigshare
Zenodo
2006 2009 2011 2013
Dublin Core metadata
Data Description Initiative
DataCite
Data publishing in the hands of the researcher
Dataverse
DryadFigshare
Zenodo
2006 2009 2011 2013
Dublin Core metadata
Data Description Initiative
DataCite Data Citation Principles
Data publishing in the hands of the researcher
Dataverse
DryadFigshare
Zenodo
2006 2009 2011 2013
Dublin Core metadata
Data Description Initiative
DataCite Data Citation Principles
# of (all types of ) data repositories from 2012 to 2016 source: r3data.org
1,500
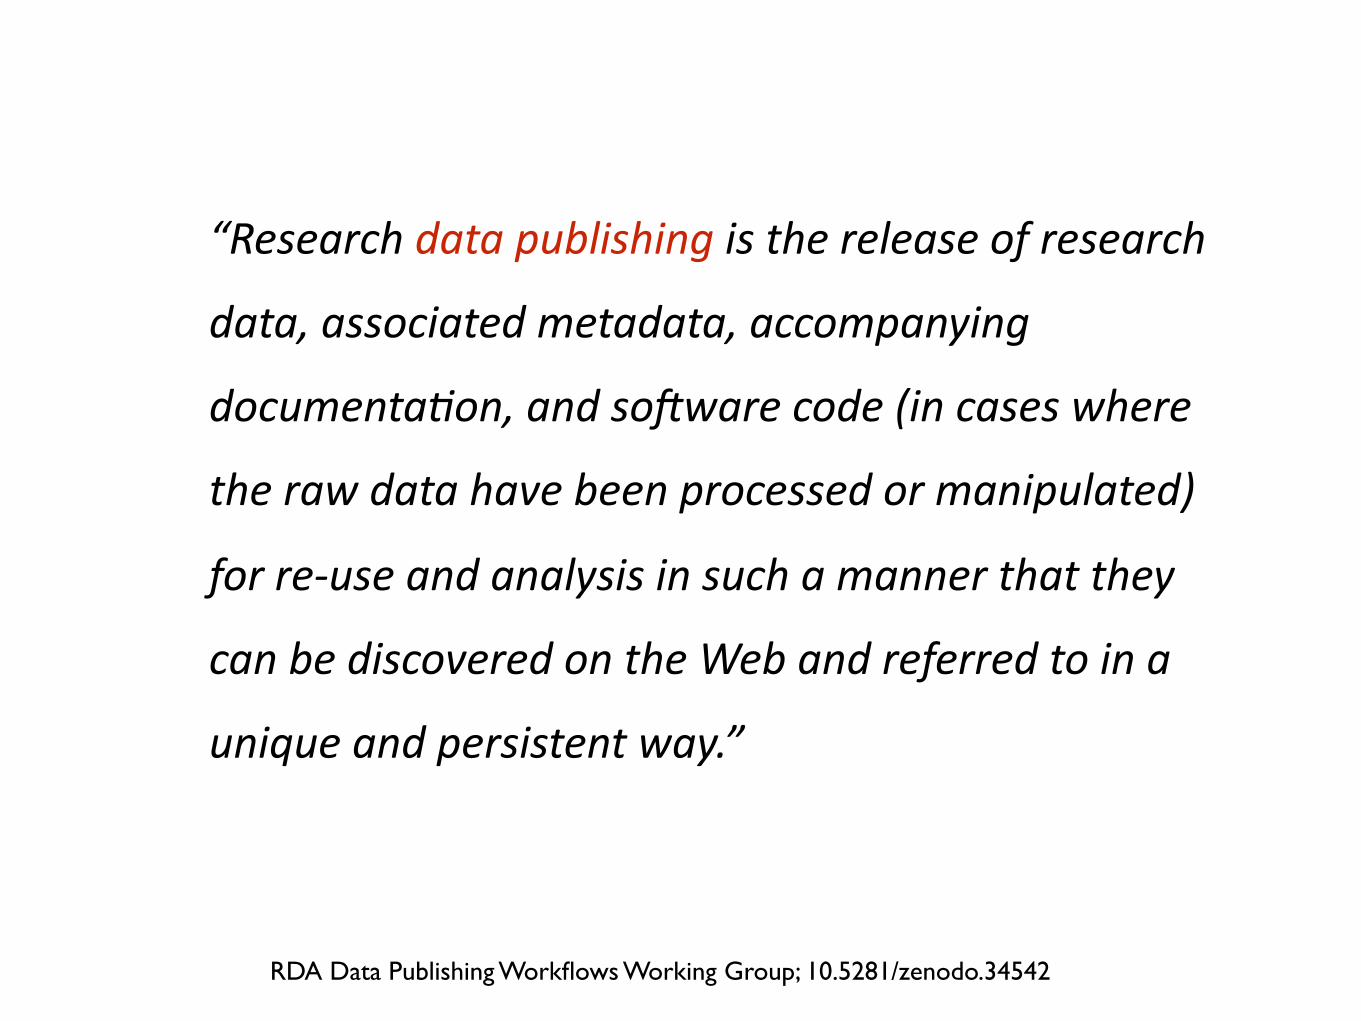
“Research data publishing is the release of research
data, associated metadata, accompanying
documenta8on, and so9ware code (in cases where
the raw data have been processed or manipulated)
for re-‐use and analysis in such a manner that they
can be discovered on the Web and referred to in a
unique and persistent way.”
RDA Data Publishing Workflows Working Group; 10.5281/zenodo.34542
Best Practices for data publishing
Best Practices for data publishing
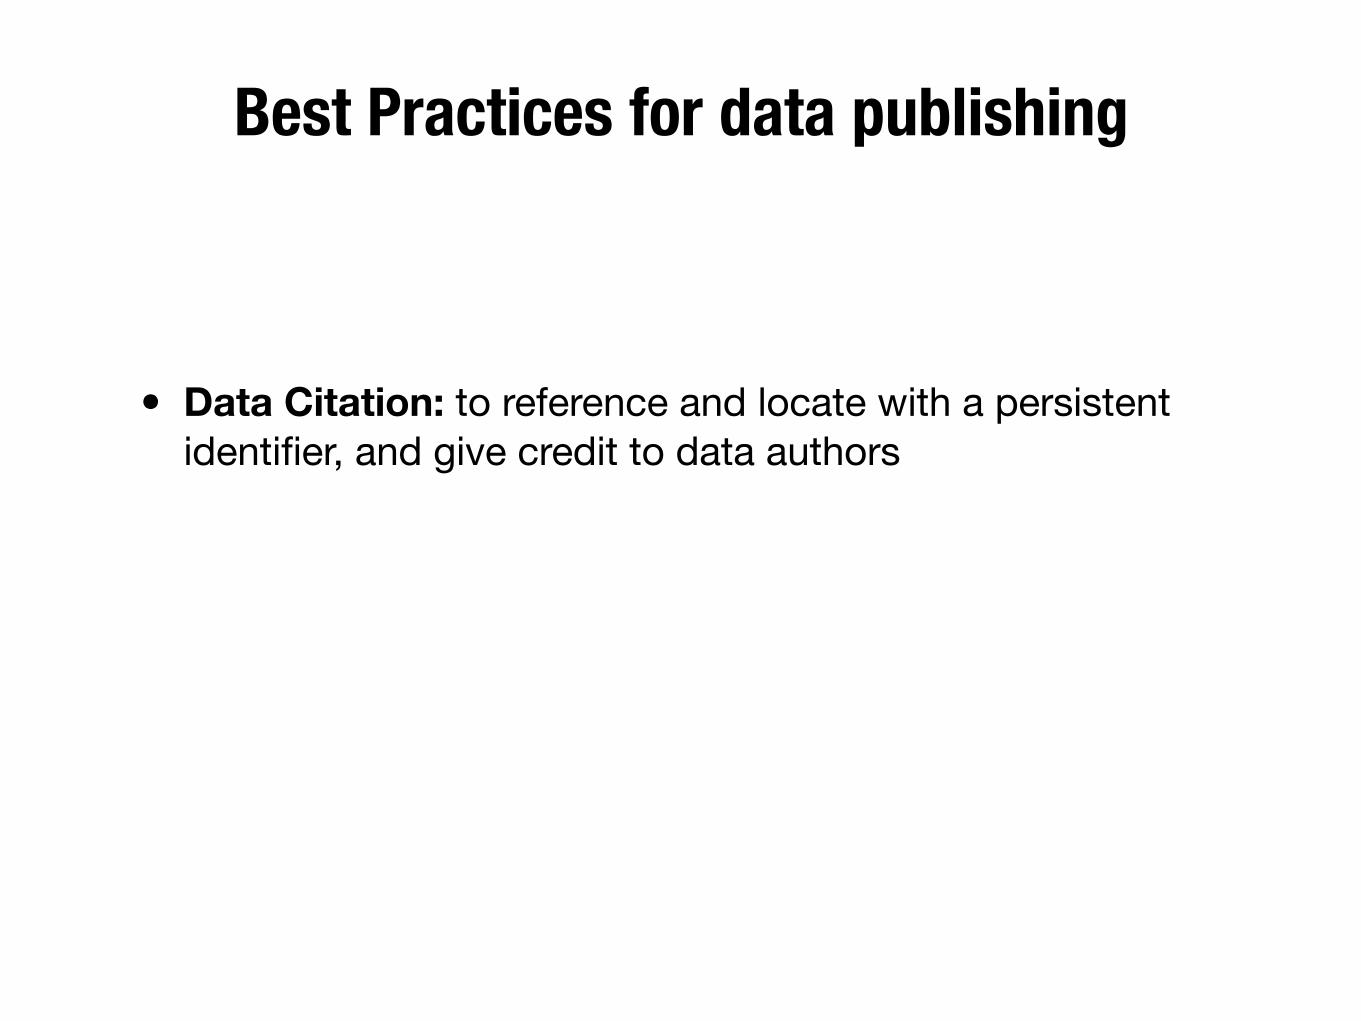
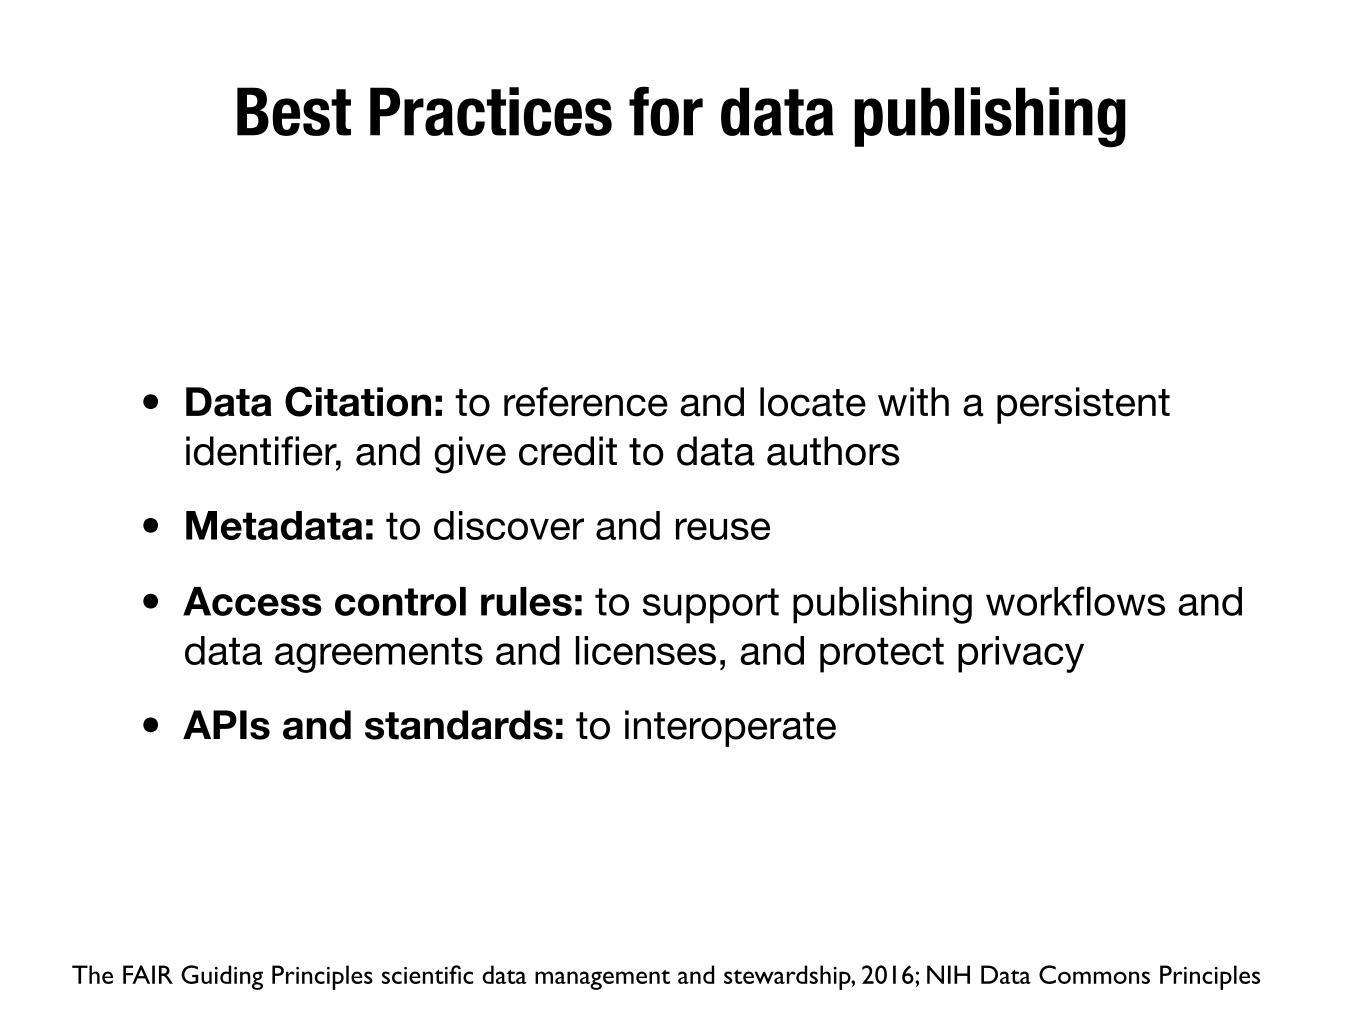
• Data Citation: to reference and locate with a persistent identifier, and give credit to data authors
Best Practices for data publishing
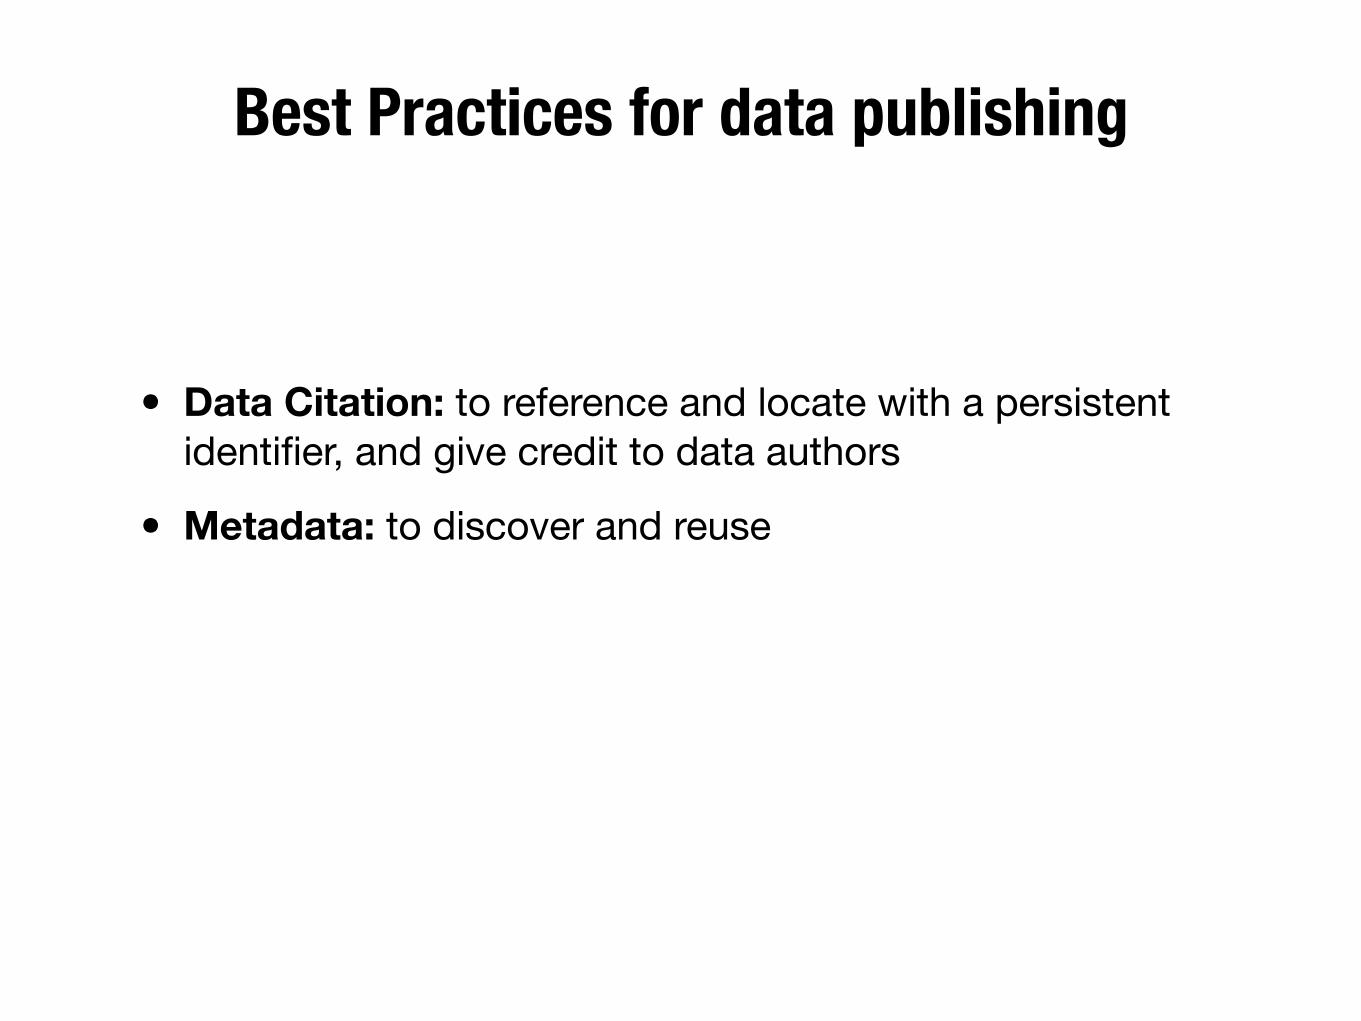
• Data Citation: to reference and locate with a persistent identifier, and give credit to data authors
• Metadata: to discover and reuse
Best Practices for data publishing
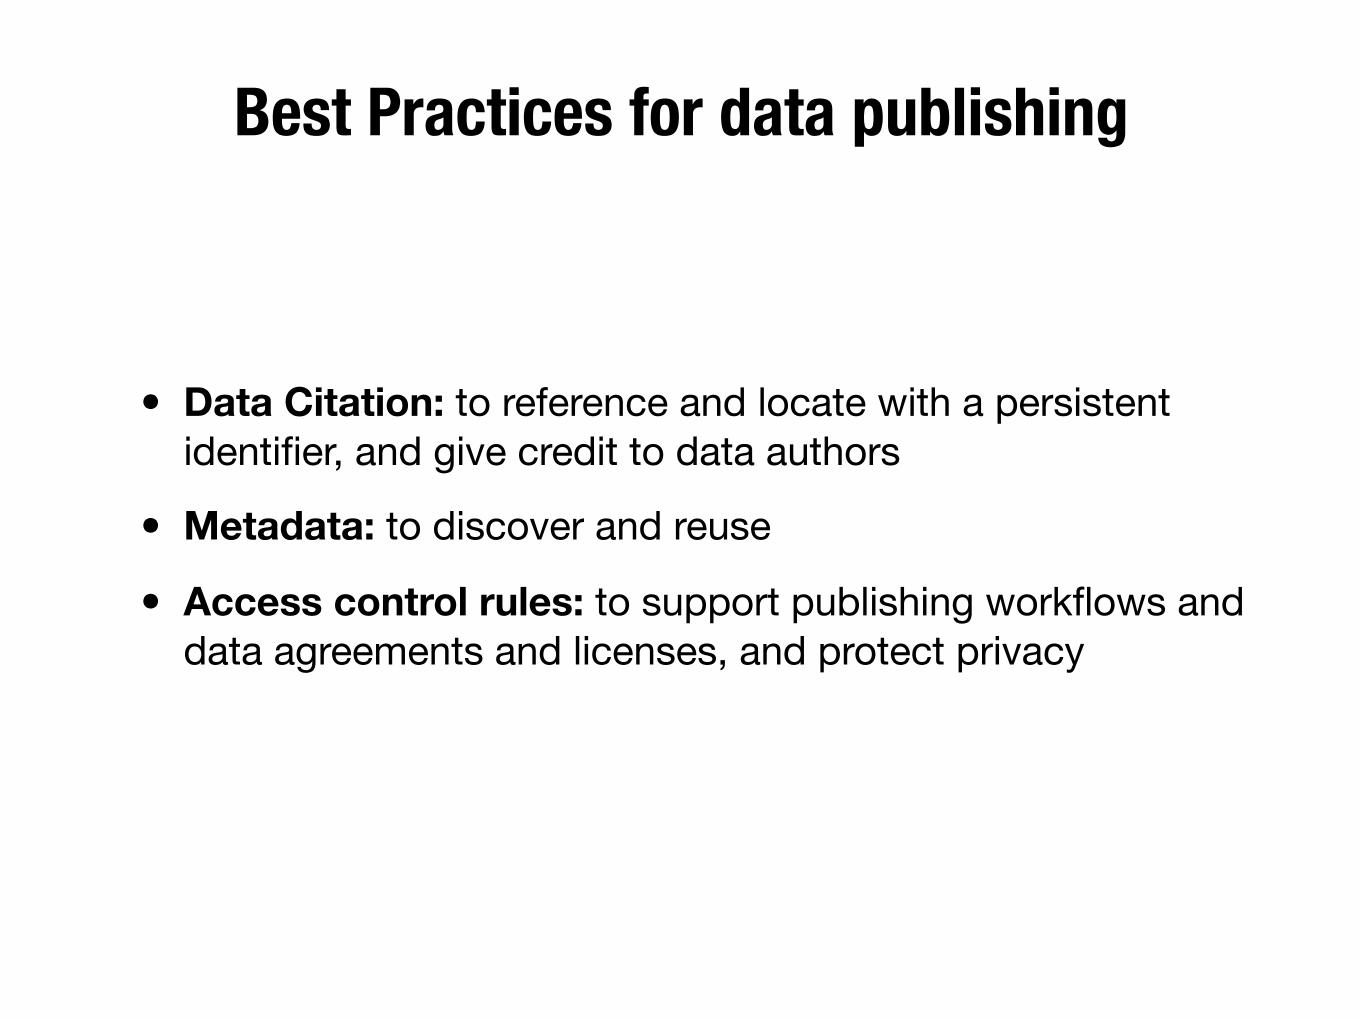
• Data Citation: to reference and locate with a persistent identifier, and give credit to data authors
• Metadata: to discover and reuse
• Access control rules: to support publishing workflows and data agreements and licenses, and protect privacy
Best Practices for data publishing
• Data Citation: to reference and locate with a persistent identifier, and give credit to data authors
• Metadata: to discover and reuse
• Access control rules: to support publishing workflows and data agreements and licenses, and protect privacy
• APIs and standards: to interoperate
Best Practices for data publishing
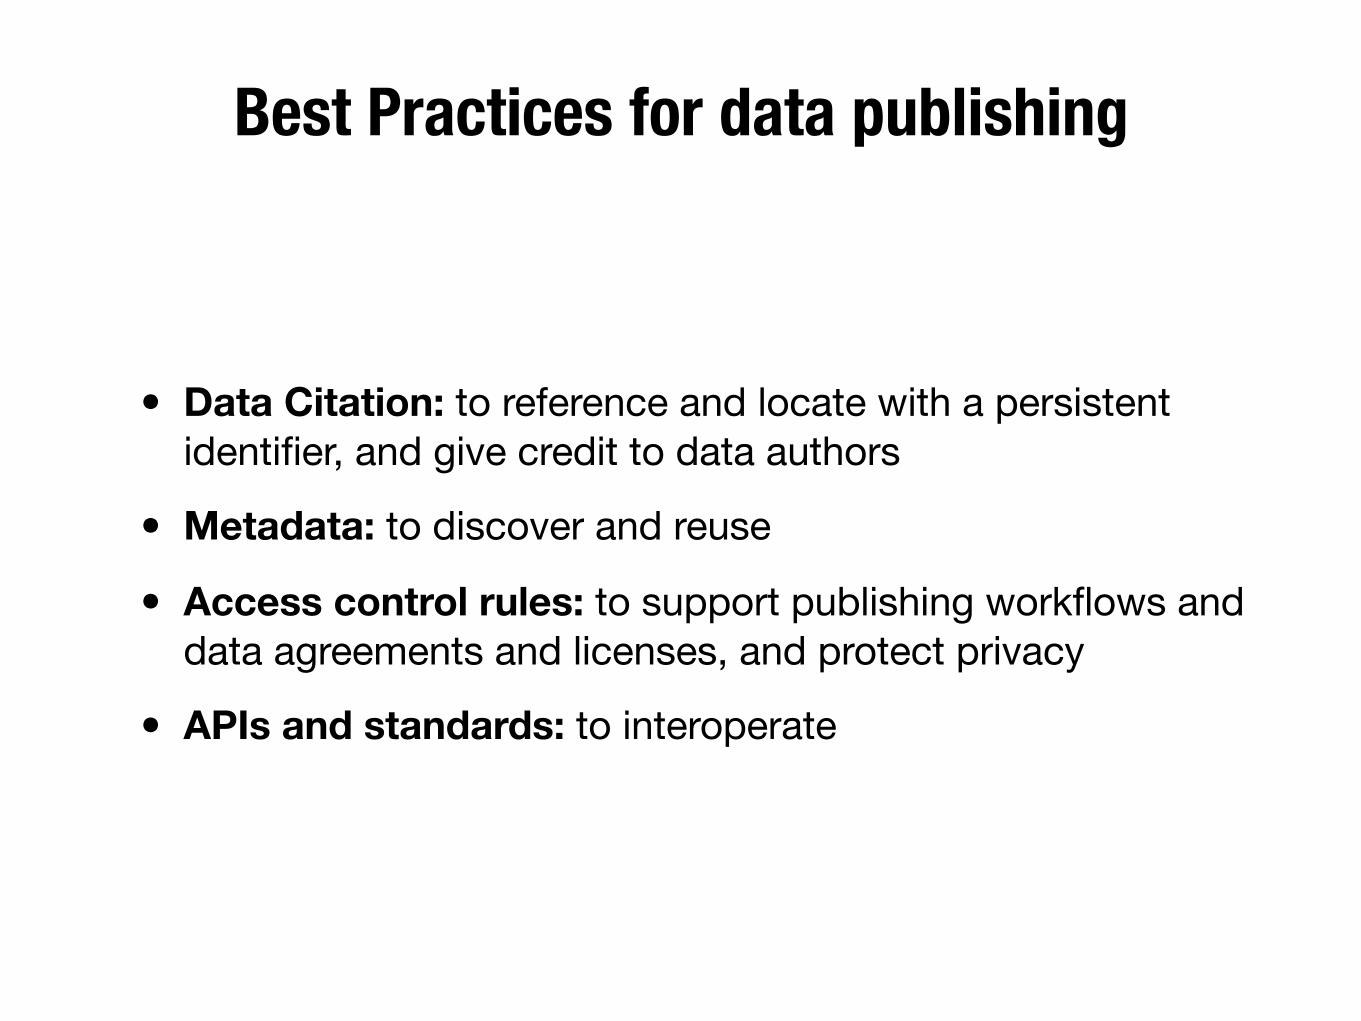
• Data Citation: to reference and locate with a persistent identifier, and give credit to data authors
• Metadata: to discover and reuse
• Access control rules: to support publishing workflows and data agreements and licenses, and protect privacy
• APIs and standards: to interoperate
The FAIR Guiding Principles scientific data management and stewardship, 2016; NIH Data Commons Principles
The Role of Dataverse
The Role of Dataverse
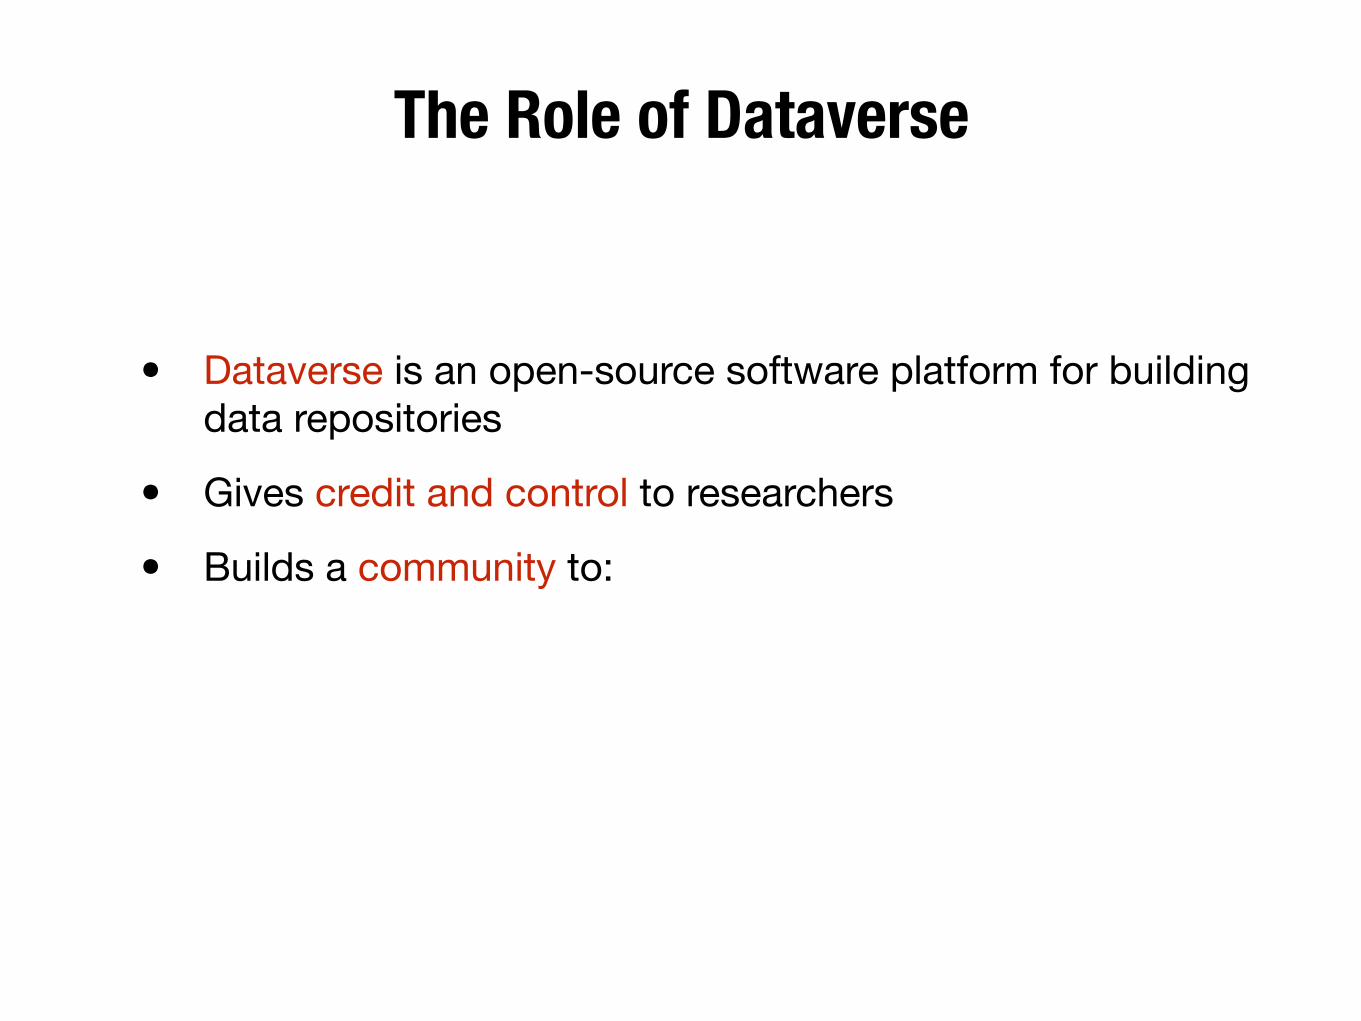
• Dataverse is an open-source software platform for building data repositories
The Role of Dataverse
• Dataverse is an open-source software platform for building data repositories
• Gives credit and control to researchers
The Role of Dataverse
• Dataverse is an open-source software platform for building data repositories
• Gives credit and control to researchers
• Builds a community to:
The Role of Dataverse
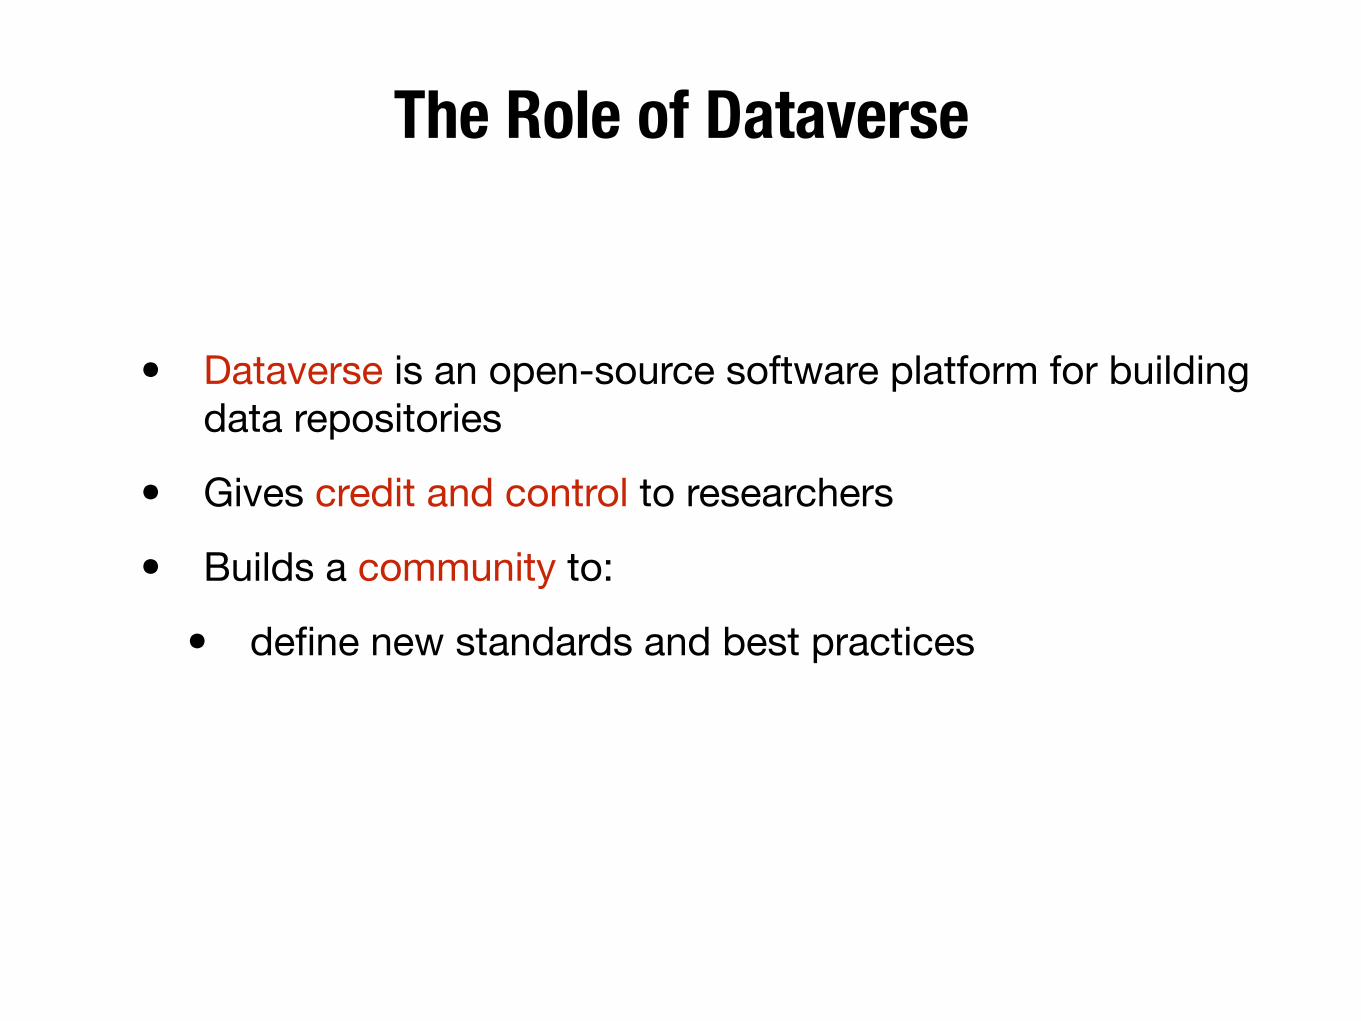
• Dataverse is an open-source software platform for building data repositories
• Gives credit and control to researchers
• Builds a community to:
• define new standards and best practices
The Role of Dataverse
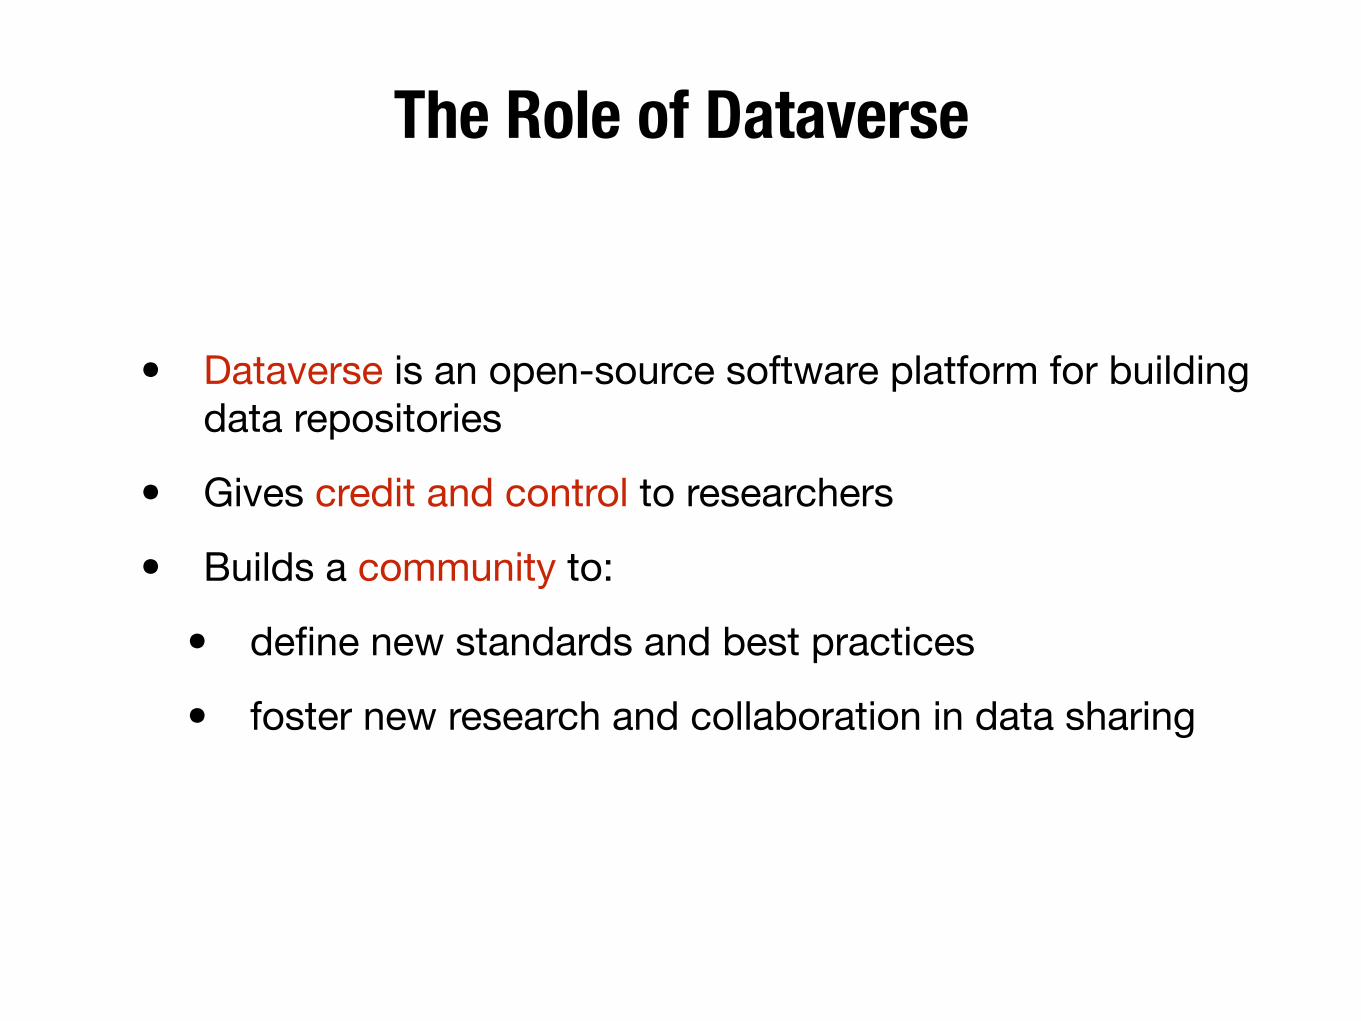
• Dataverse is an open-source software platform for building data repositories
• Gives credit and control to researchers
• Builds a community to:
• define new standards and best practices
• foster new research and collaboration in data sharing
The Role of Dataverse
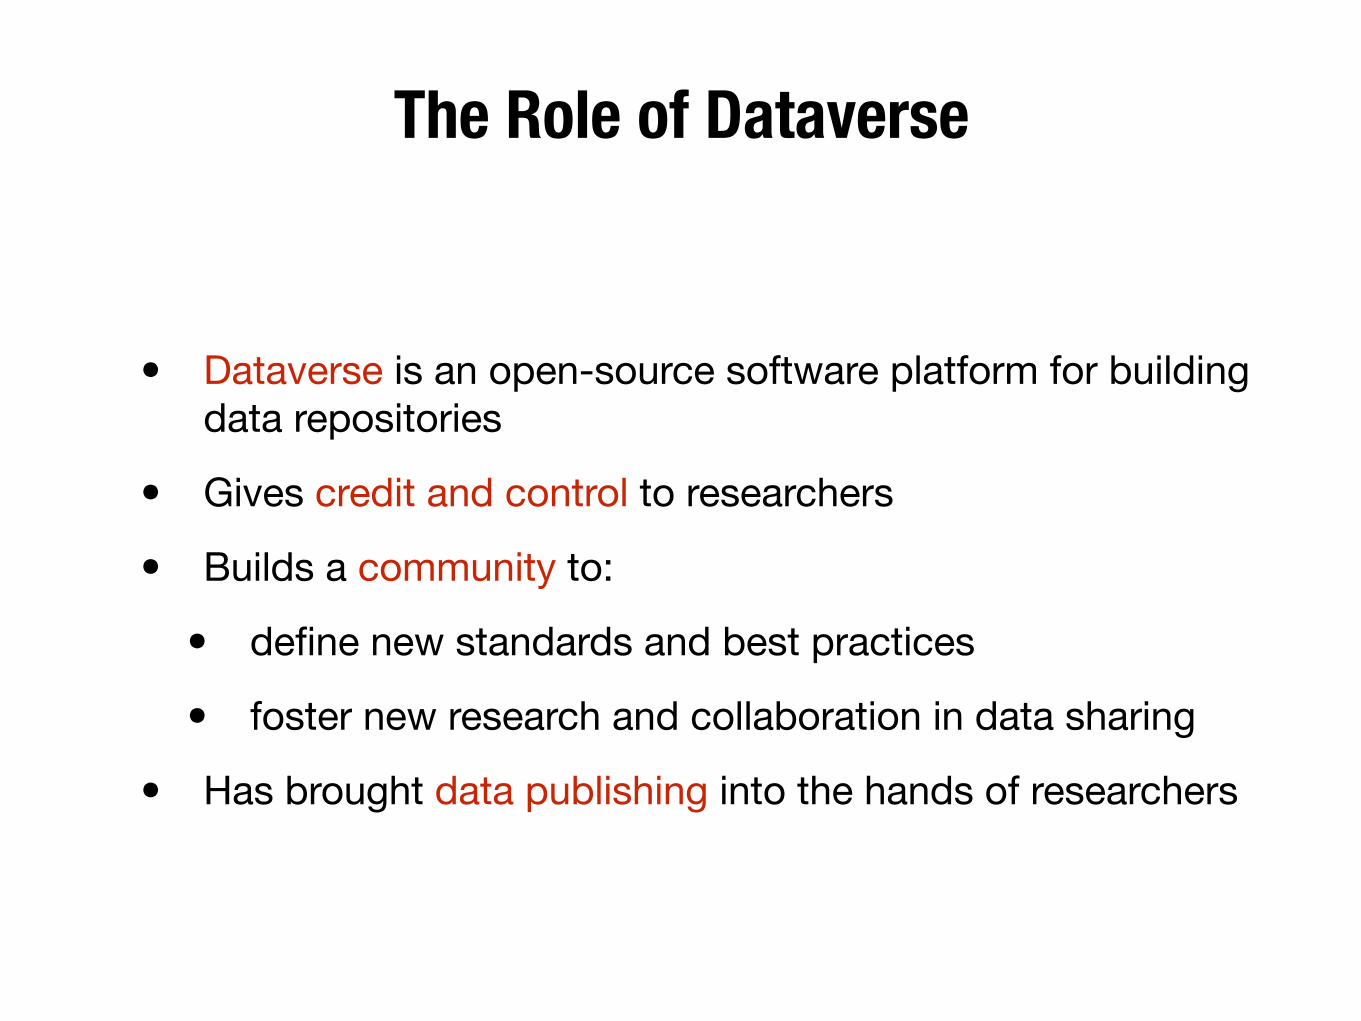
• Dataverse is an open-source software platform for building data repositories
• Gives credit and control to researchers
• Builds a community to:
• define new standards and best practices
• foster new research and collaboration in data sharing
• Has brought data publishing into the hands of researchers
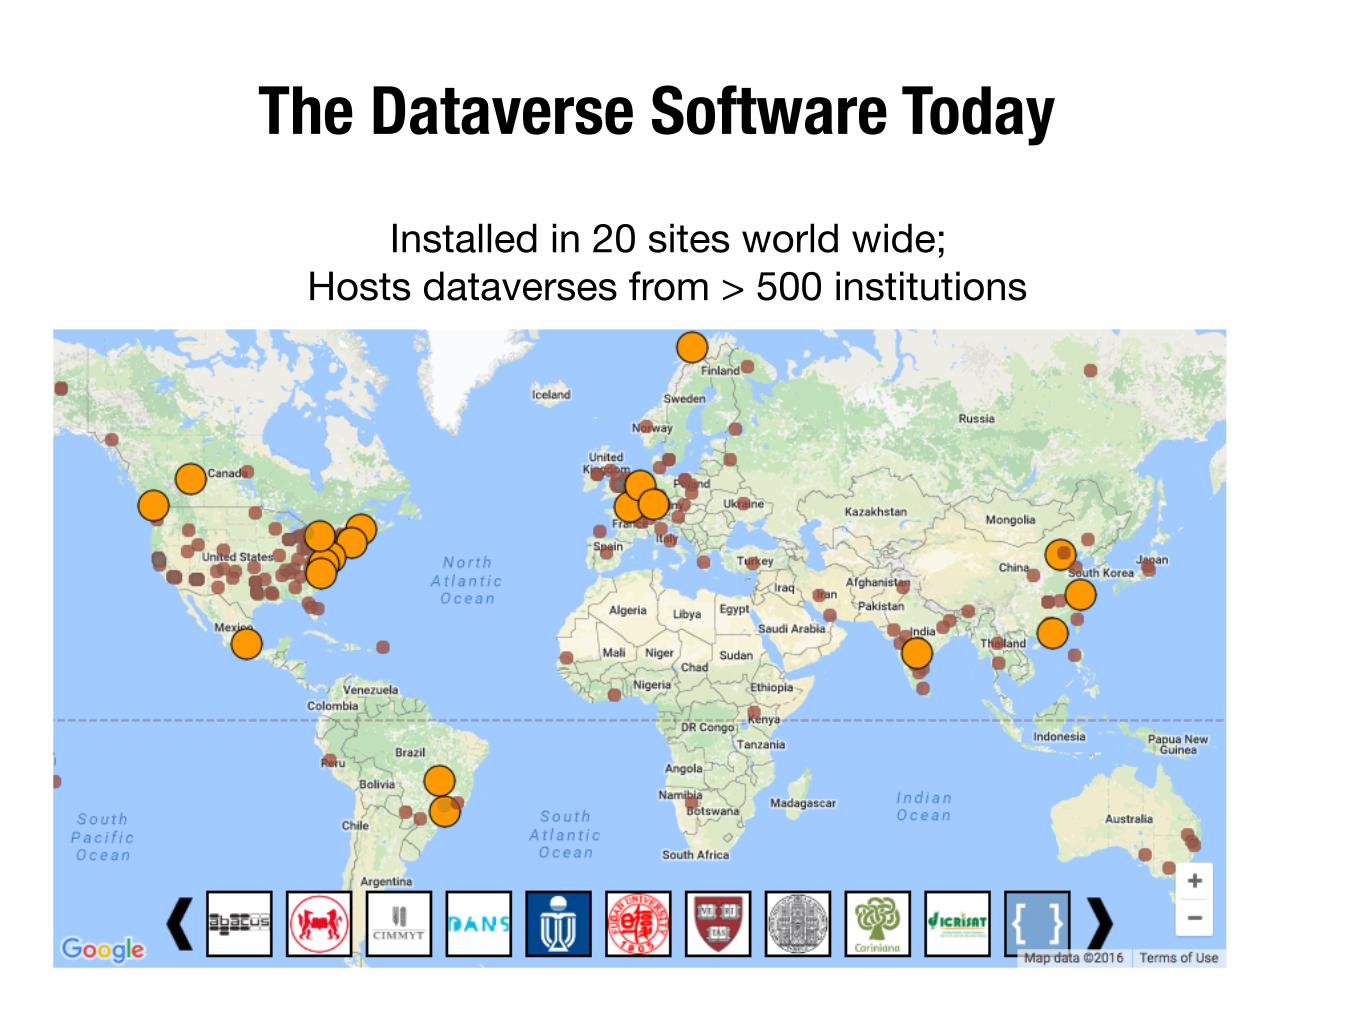
The Dataverse Software TodayInstalled in 20 sites world wide;
Hosts dataverses from > 500 institutions
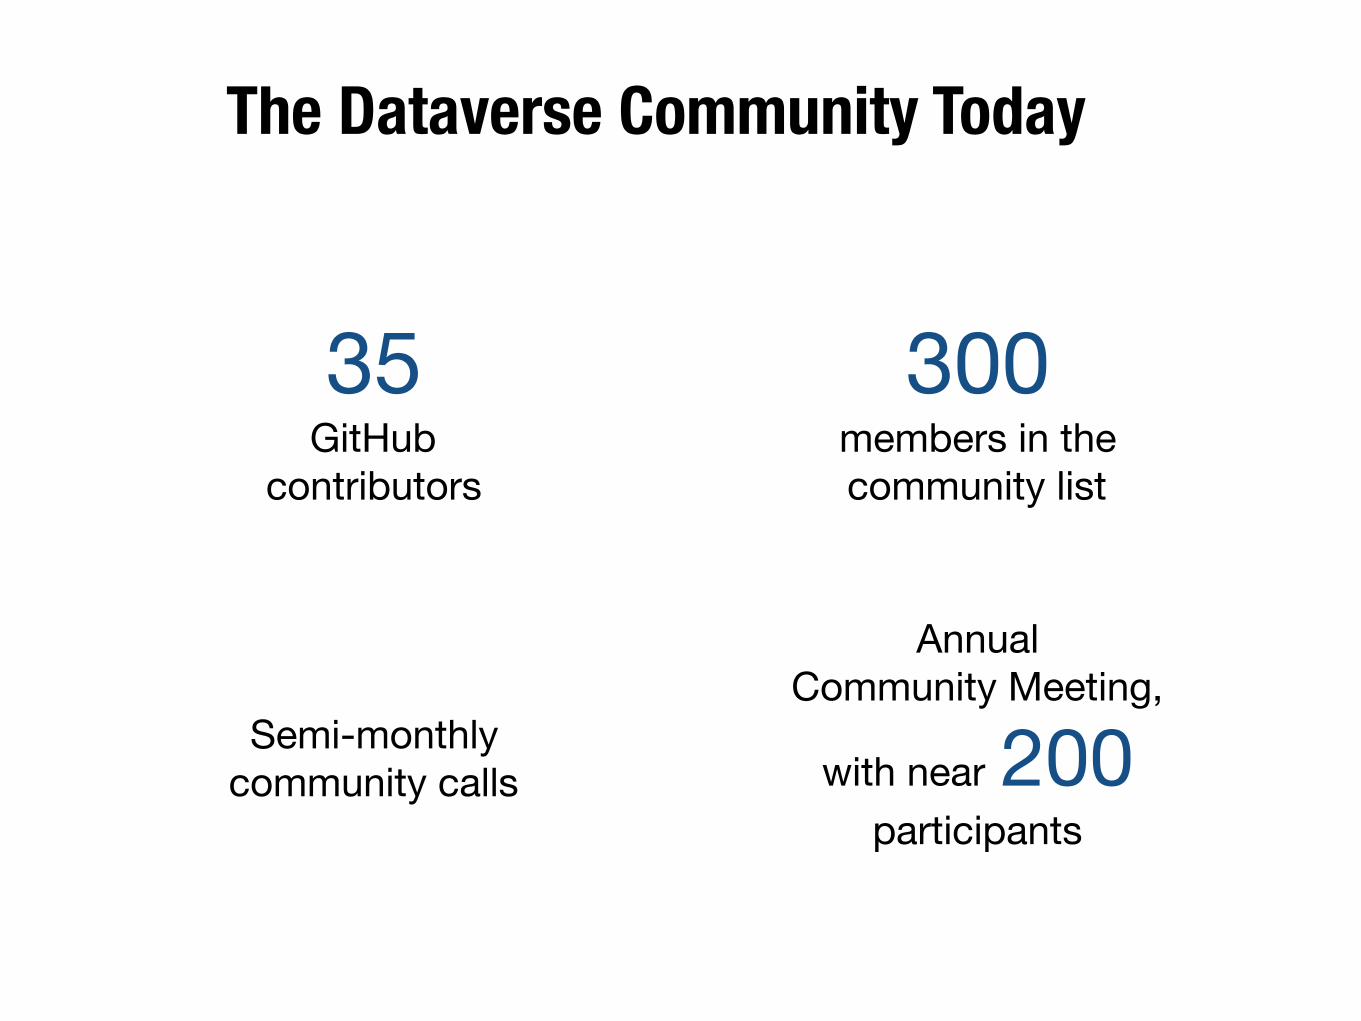
The Dataverse Community Today
35GitHub
contributors
300members in the community list
Semi-monthlycommunity calls
Annual Community Meeting,
with near 200 participants
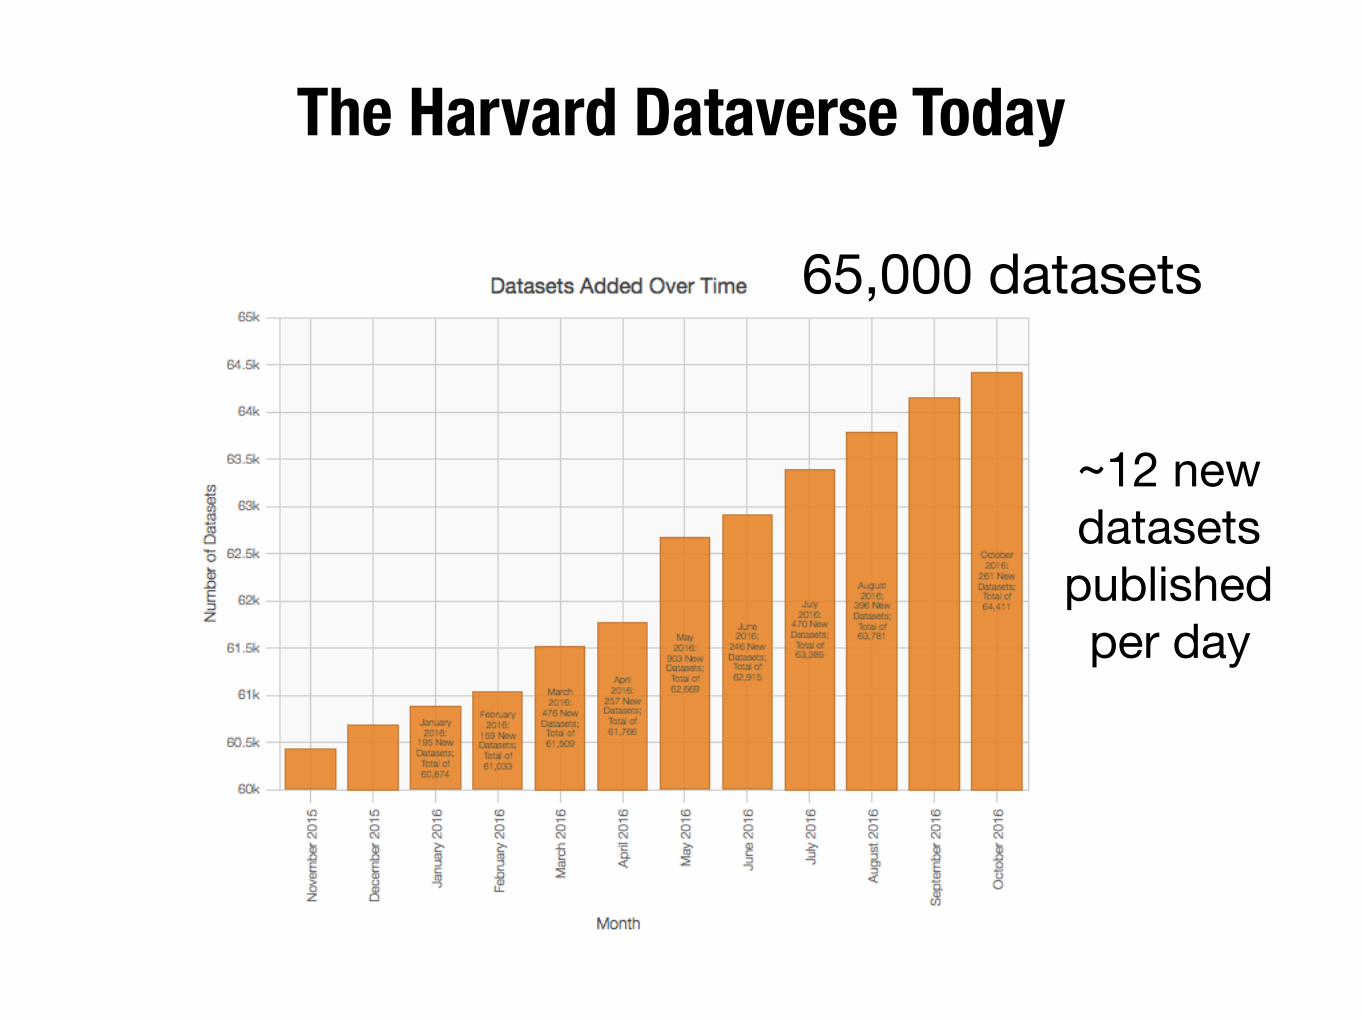
The Harvard Dataverse Today
~12 new datasets published per day
65,000 datasets
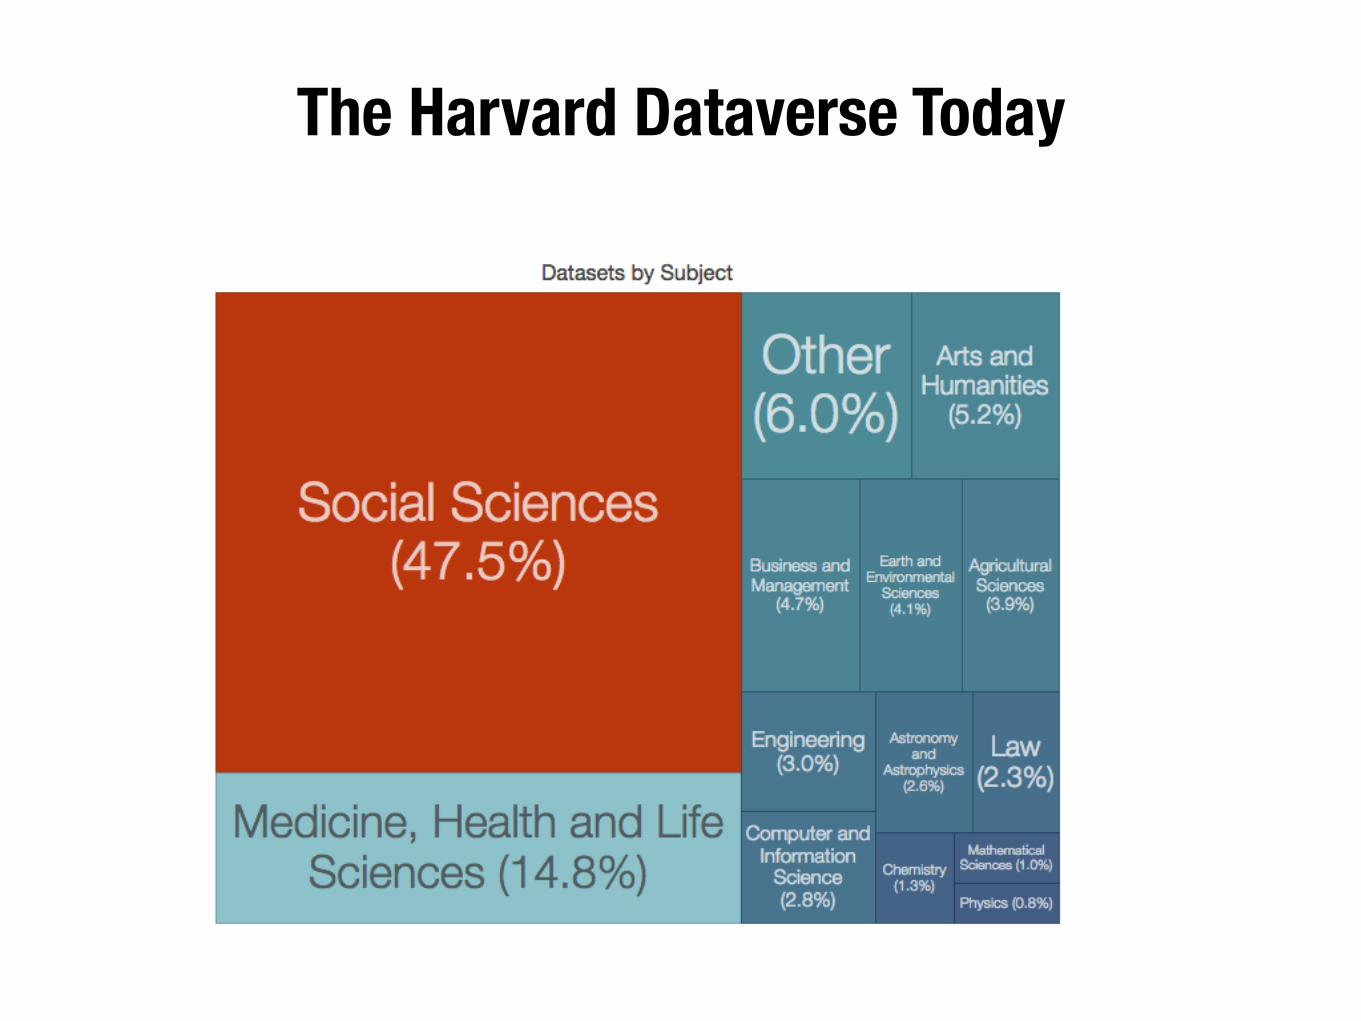
The Harvard Dataverse Today
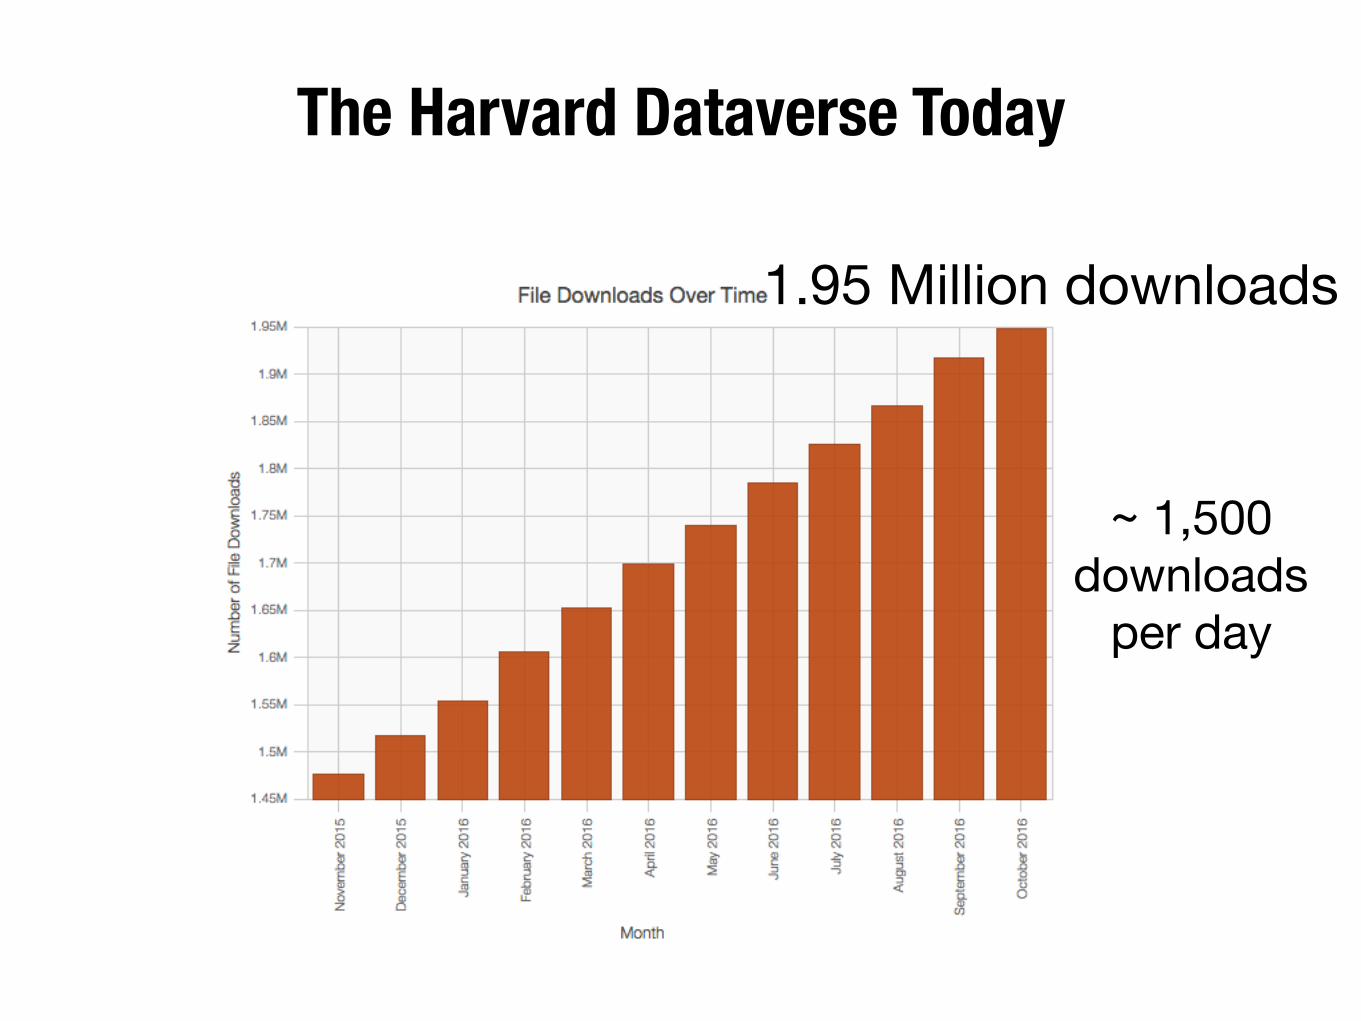
The Harvard Dataverse Today
1.95 Million downloads
~ 1,500 downloads
per day
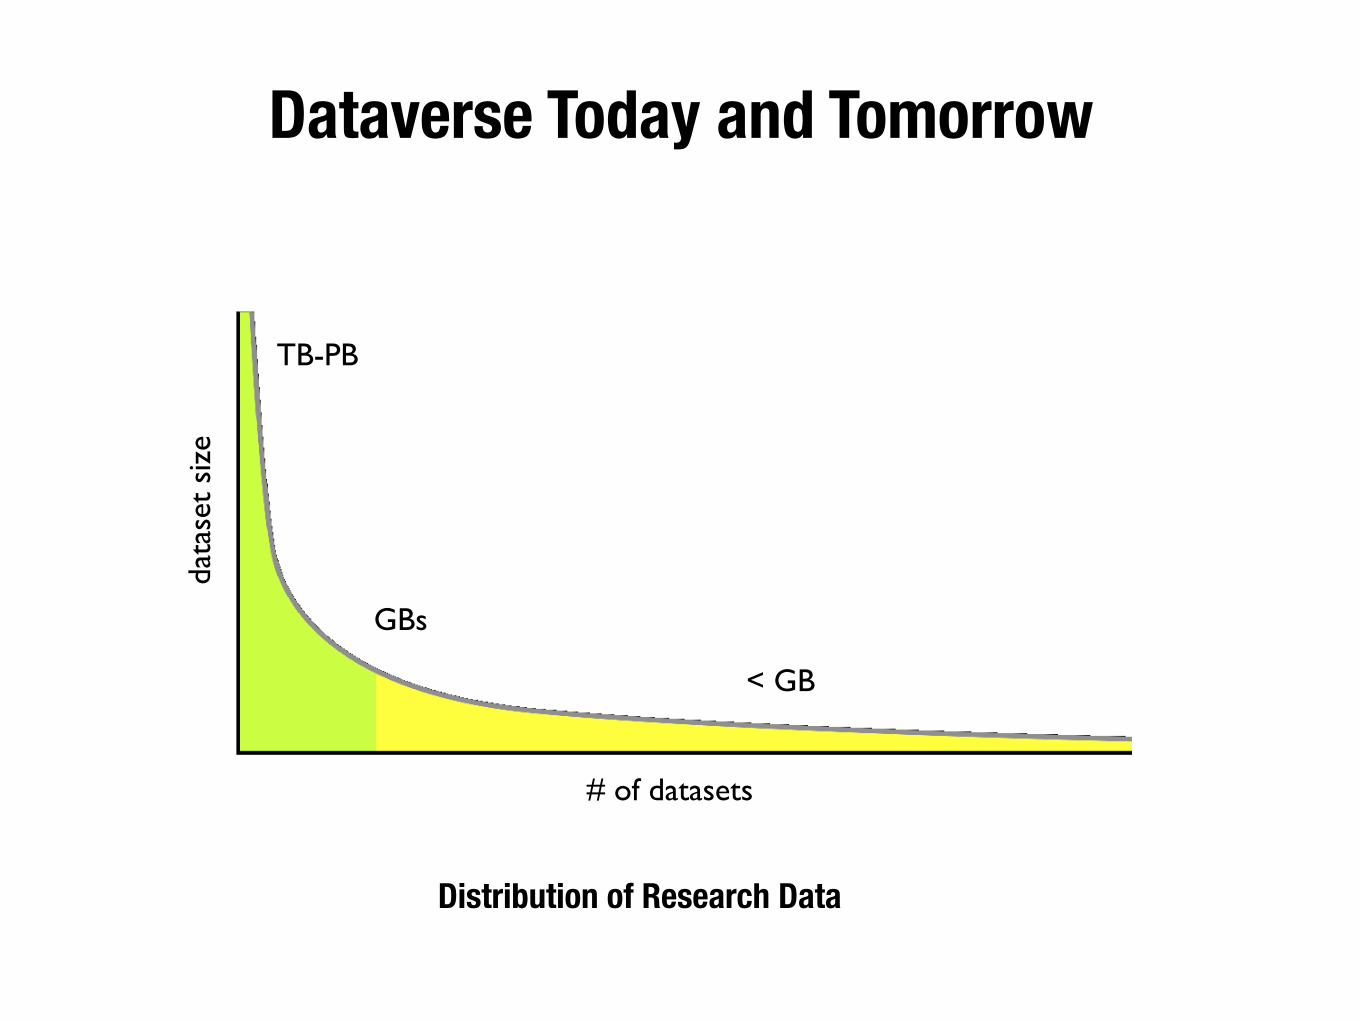
Dataverse Today and Tomorrow
TB-PB
# of datasets
data
set
size
GBs
< GB
Distribution of Research Data
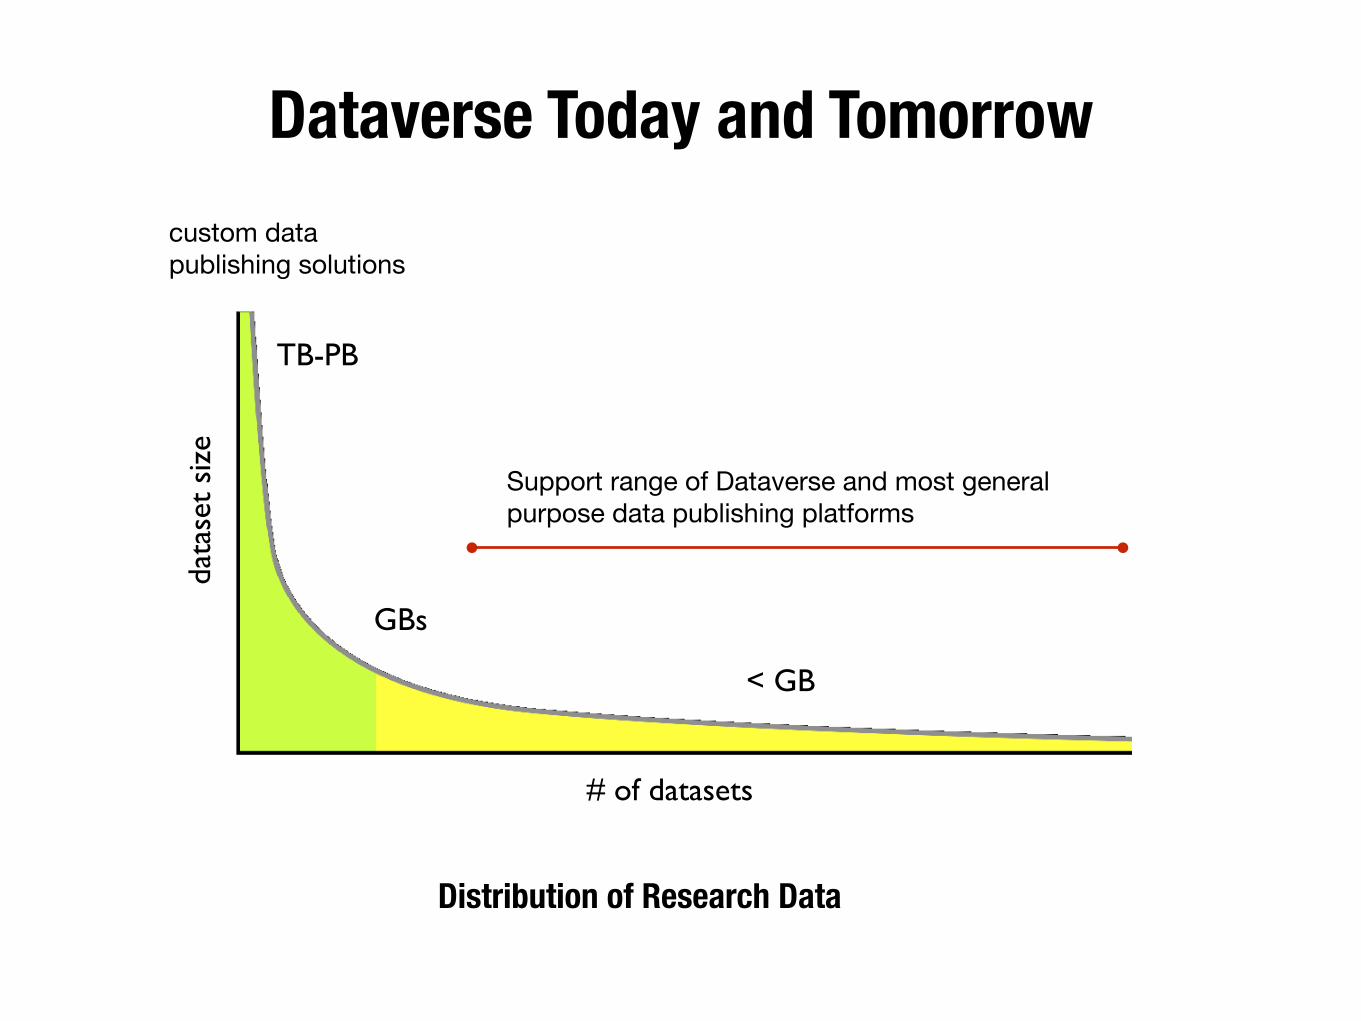
Dataverse Today and Tomorrow
TB-PB
# of datasets
data
set
size
GBs
< GB
Support range of Dataverse and most general purpose data publishing platforms
custom datapublishing solutions
Distribution of Research Data
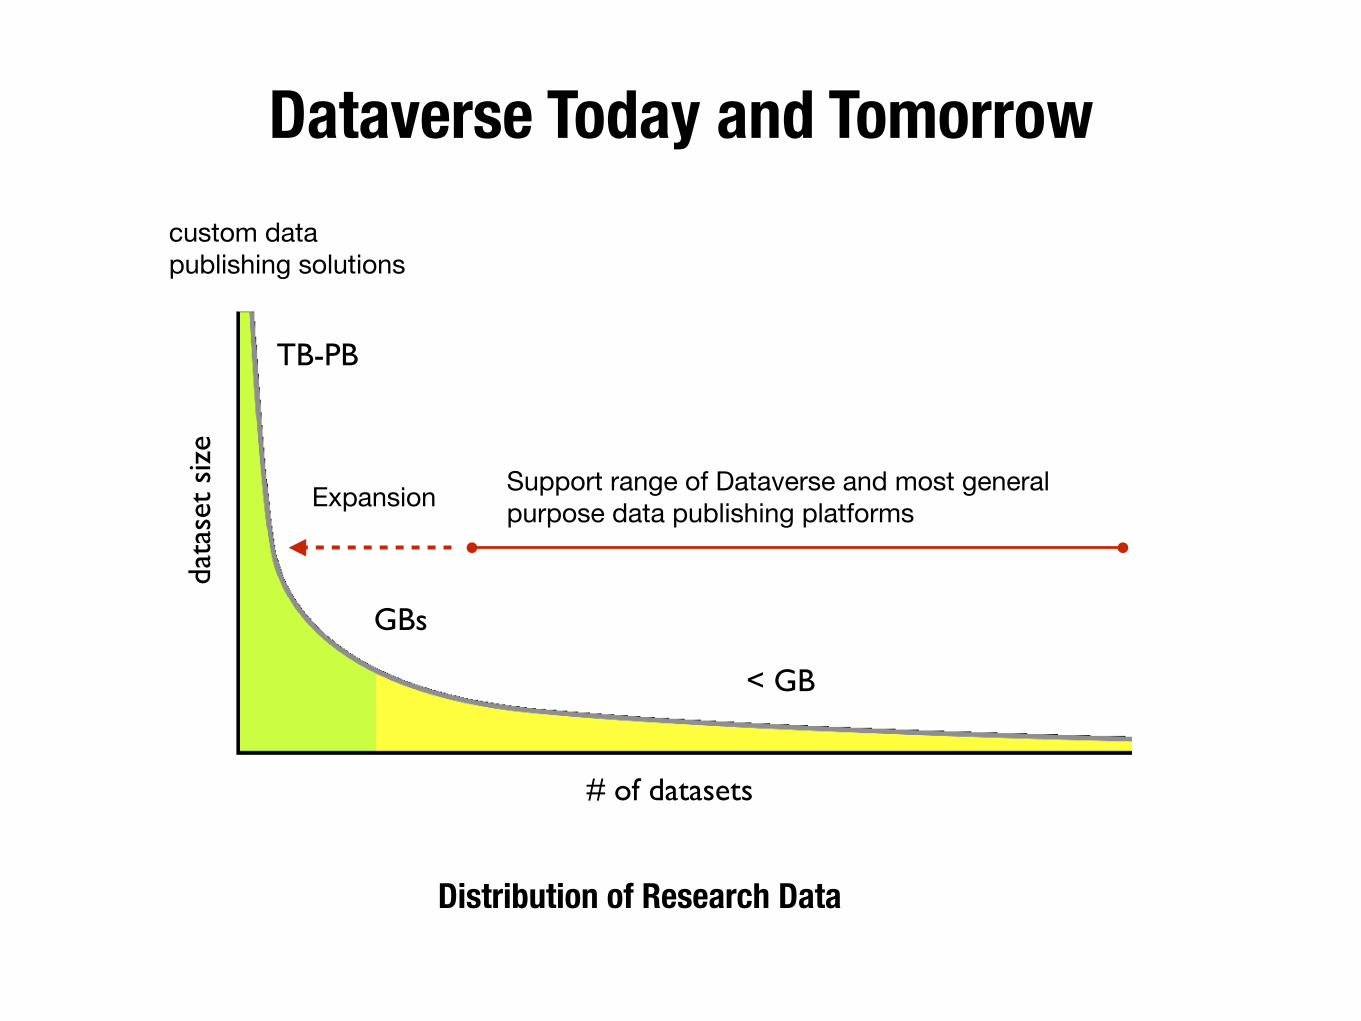
Dataverse Today and Tomorrow
TB-PB
# of datasets
data
set
size
GBs
< GB
Support range of Dataverse and most general purpose data publishing platforms
custom datapublishing solutions
Expansion
Distribution of Research Data
Addressing next challenges
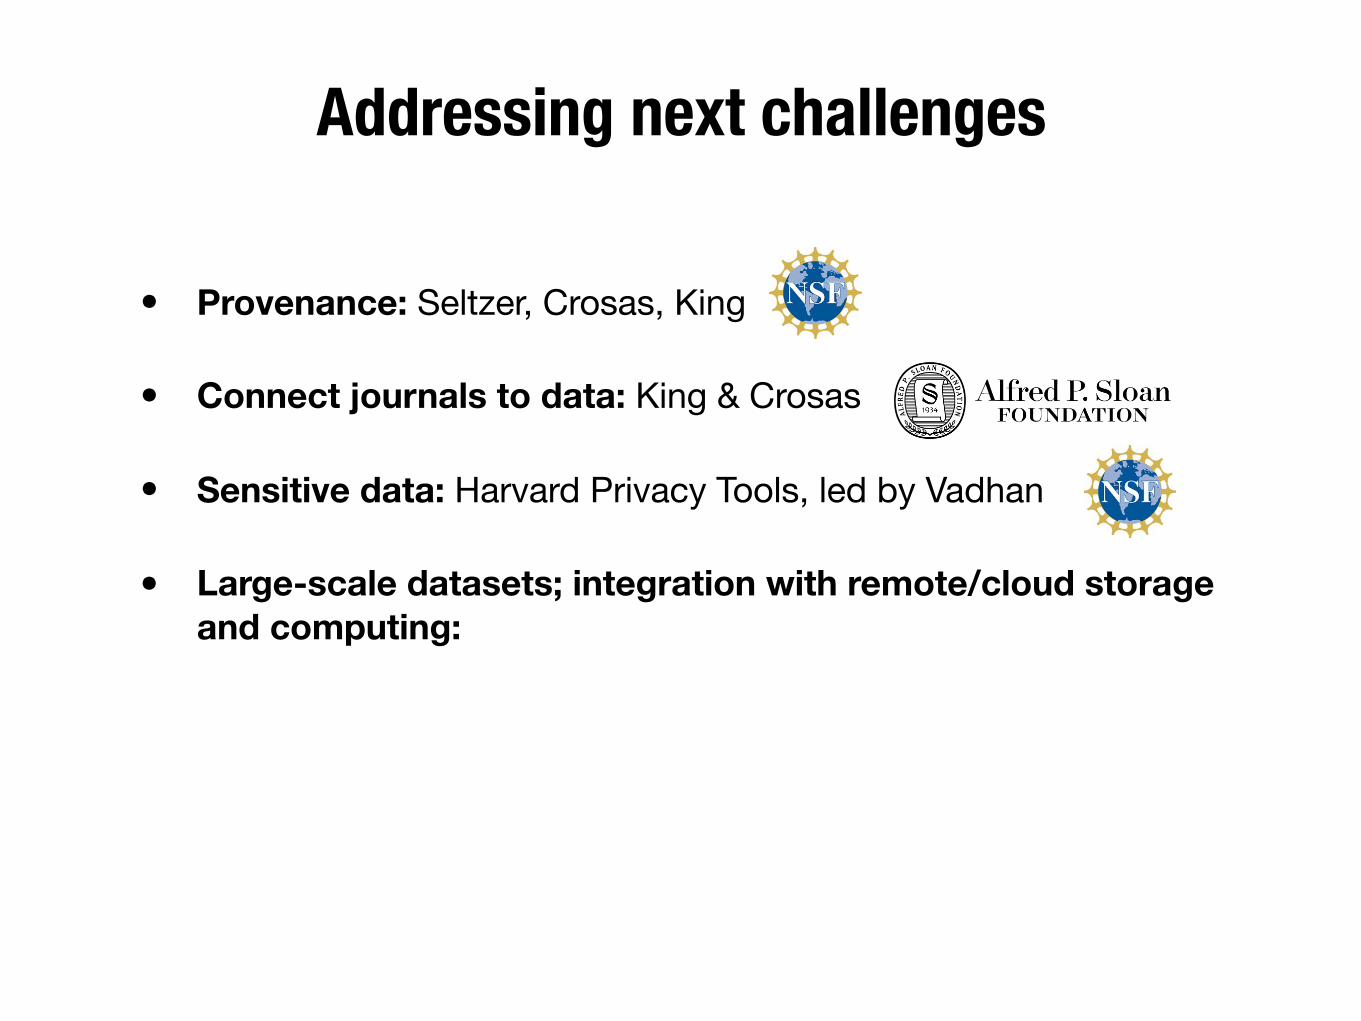
Addressing next challenges
• Provenance: Seltzer, Crosas, King
Addressing next challenges
• Provenance: Seltzer, Crosas, King
• Connect journals to data: King & Crosas
Addressing next challenges
• Provenance: Seltzer, Crosas, King
• Connect journals to data: King & Crosas
• Sensitive data: Harvard Privacy Tools, led by Vadhan
Addressing next challenges
• Provenance: Seltzer, Crosas, King
• Connect journals to data: King & Crosas
• Sensitive data: Harvard Privacy Tools, led by Vadhan
• Large-scale datasets; integration with remote/cloud storage and computing:
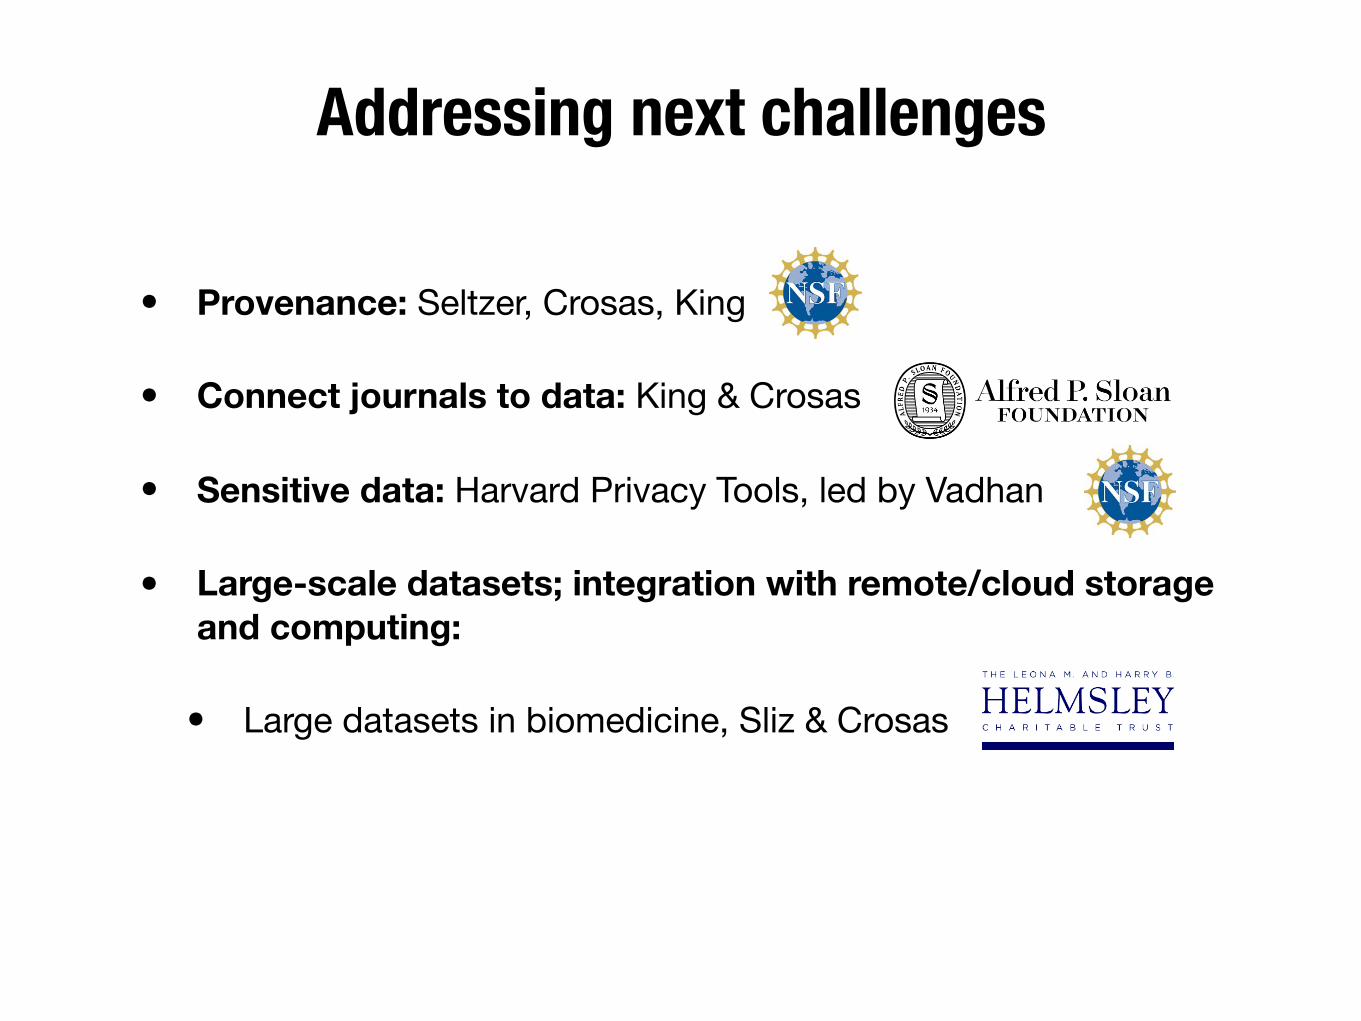
Addressing next challenges
• Provenance: Seltzer, Crosas, King
• Connect journals to data: King & Crosas
• Sensitive data: Harvard Privacy Tools, led by Vadhan
• Large-scale datasets; integration with remote/cloud storage and computing:
• Large datasets in biomedicine, Sliz & Crosas
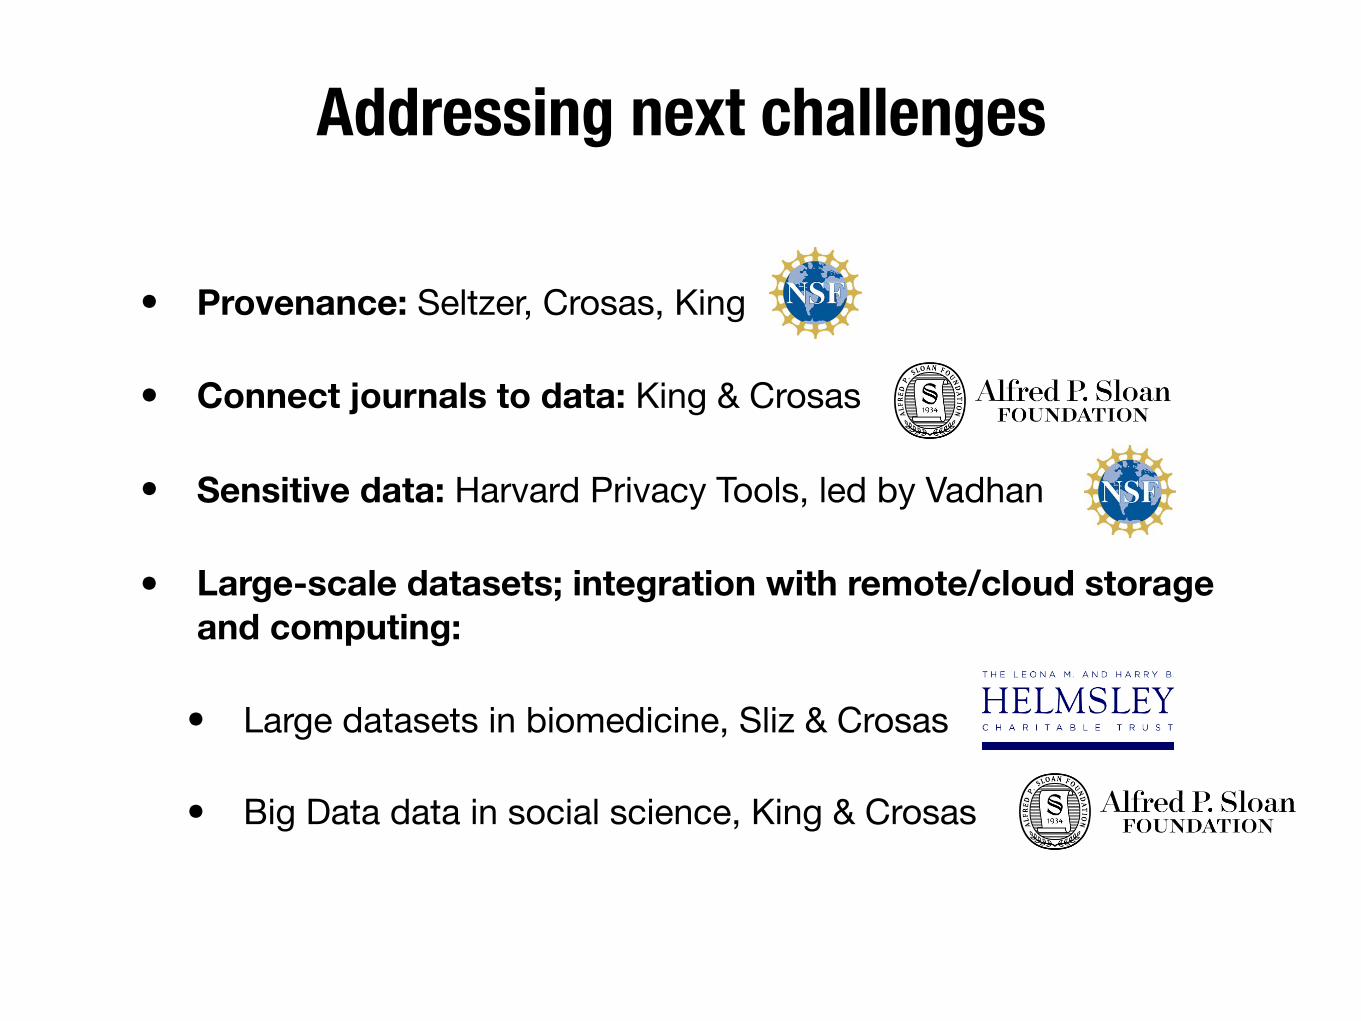
Addressing next challenges
• Provenance: Seltzer, Crosas, King
• Connect journals to data: King & Crosas
• Sensitive data: Harvard Privacy Tools, led by Vadhan
• Large-scale datasets; integration with remote/cloud storage and computing:
• Large datasets in biomedicine, Sliz & Crosas
• Big Data data in social science, King & Crosas
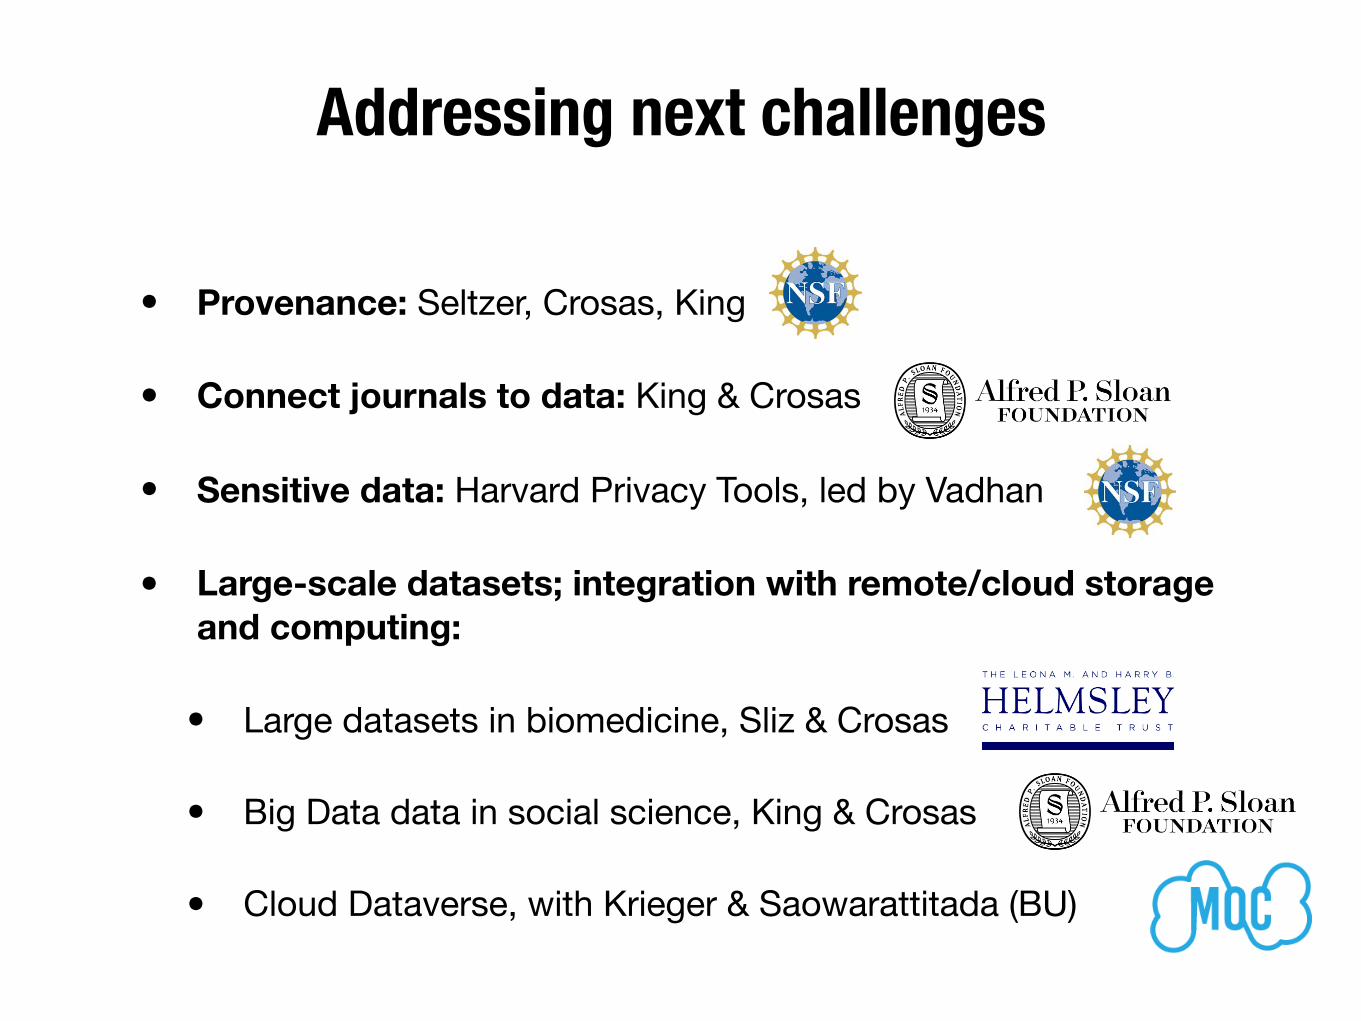
• Cloud Dataverse, with Krieger & Saowarattitada (BU)
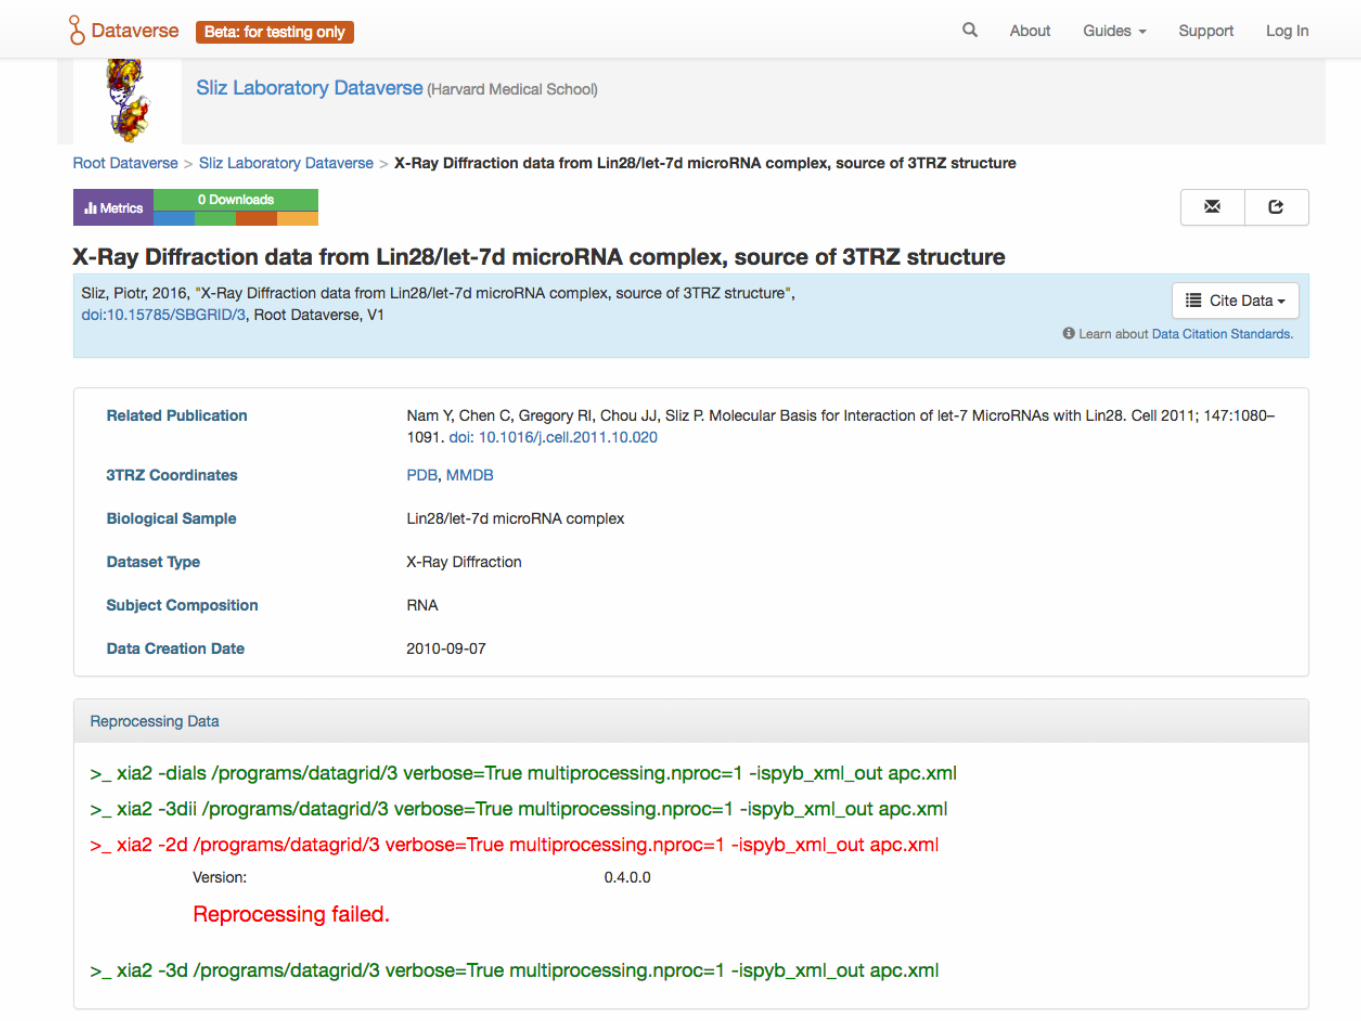
Making Data Accessible use case: Structural Biology Data Grid
with Piotr Sliz (Harvard Medical School), Pete Meyer, Bill McKinney, Stephanie Socias, Jason Key, Kyle Chard , and IQSS Dataverse team
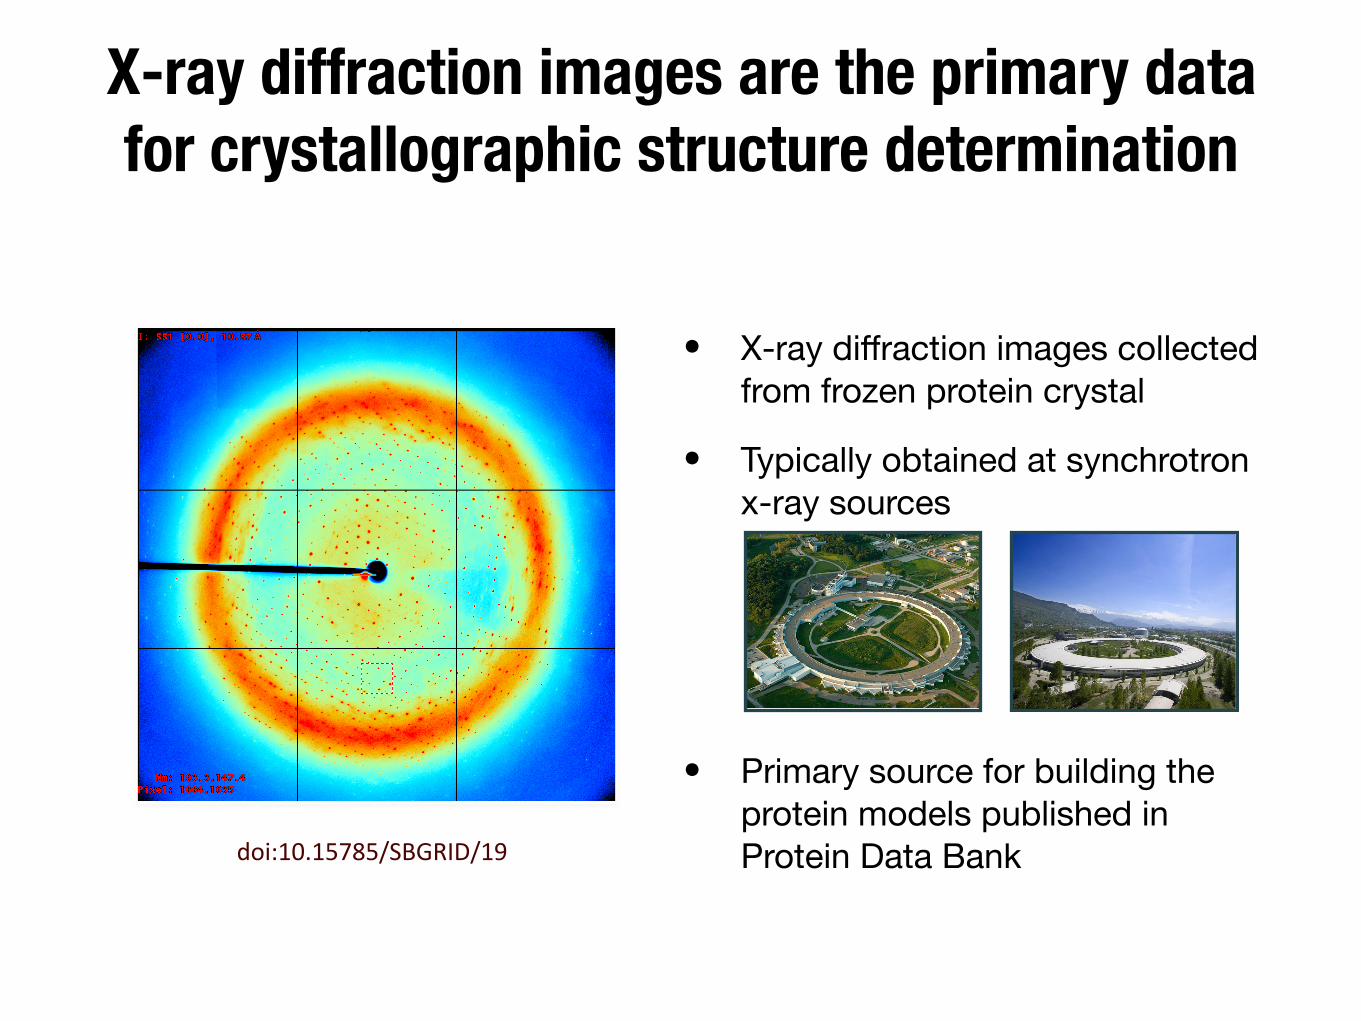
X-ray diffraction images are the primary data for crystallographic structure determination
• X-ray diffraction images collected from frozen protein crystal
• Typically obtained at synchrotron x-ray sources
doi:10.15785/SBGRID/19
• Primary source for building the protein models published in Protein Data Bank
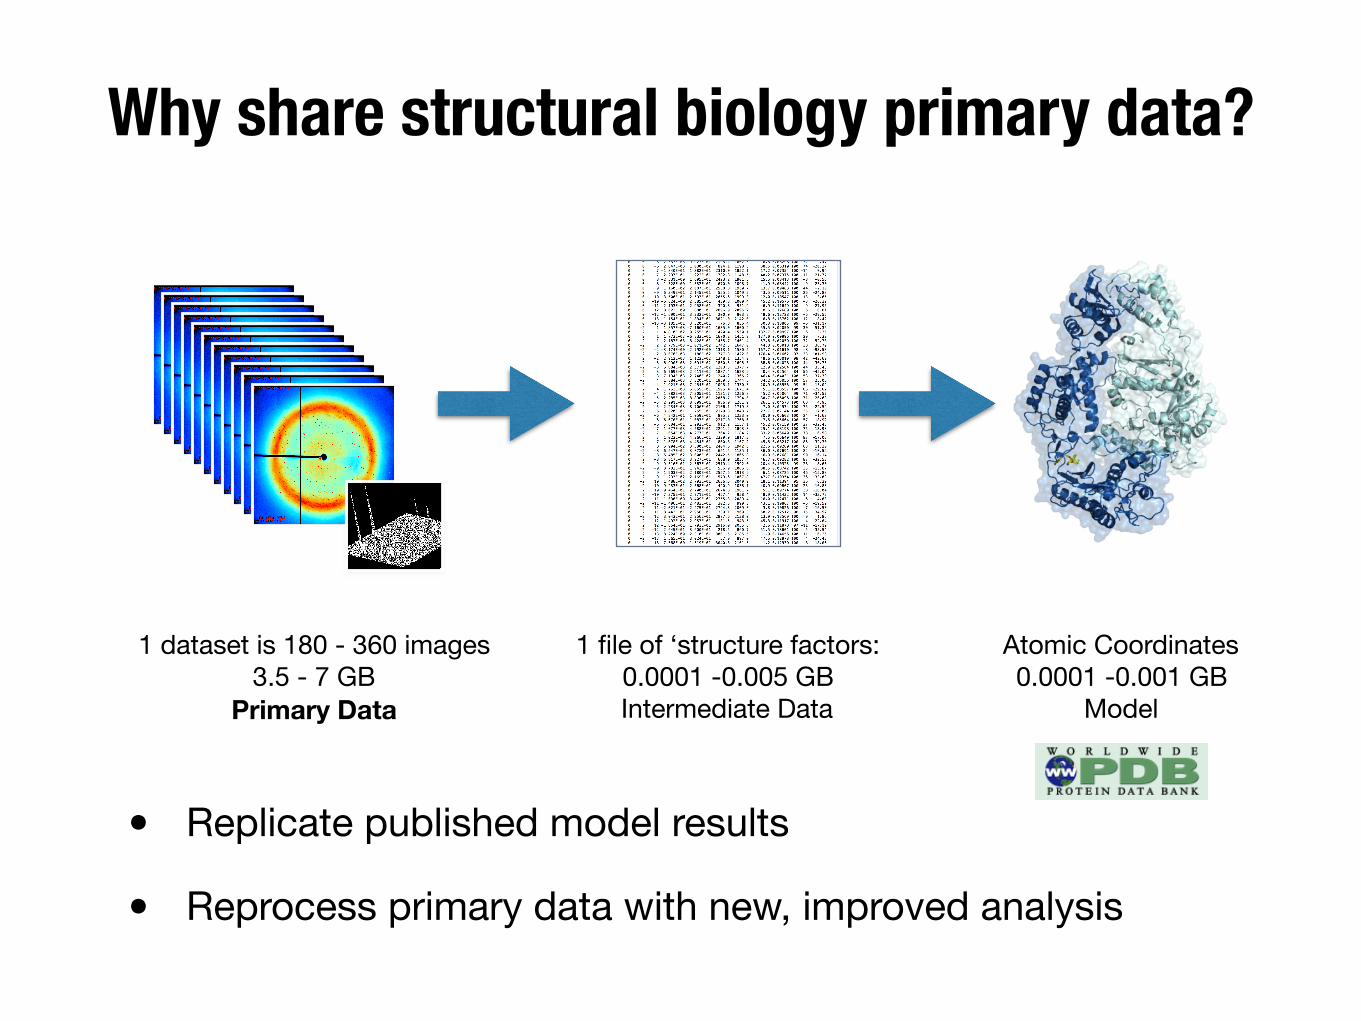
Why share structural biology primary data?
1 dataset is 180 - 360 images3.5 - 7 GB
Primary Data
1 file of ‘structure factors:0.0001 -0.005 GBIntermediate Data
Atomic Coordinates0.0001 -0.001 GB
Model
• Replicate published model results
• Reprocess primary data with new, improved analysis
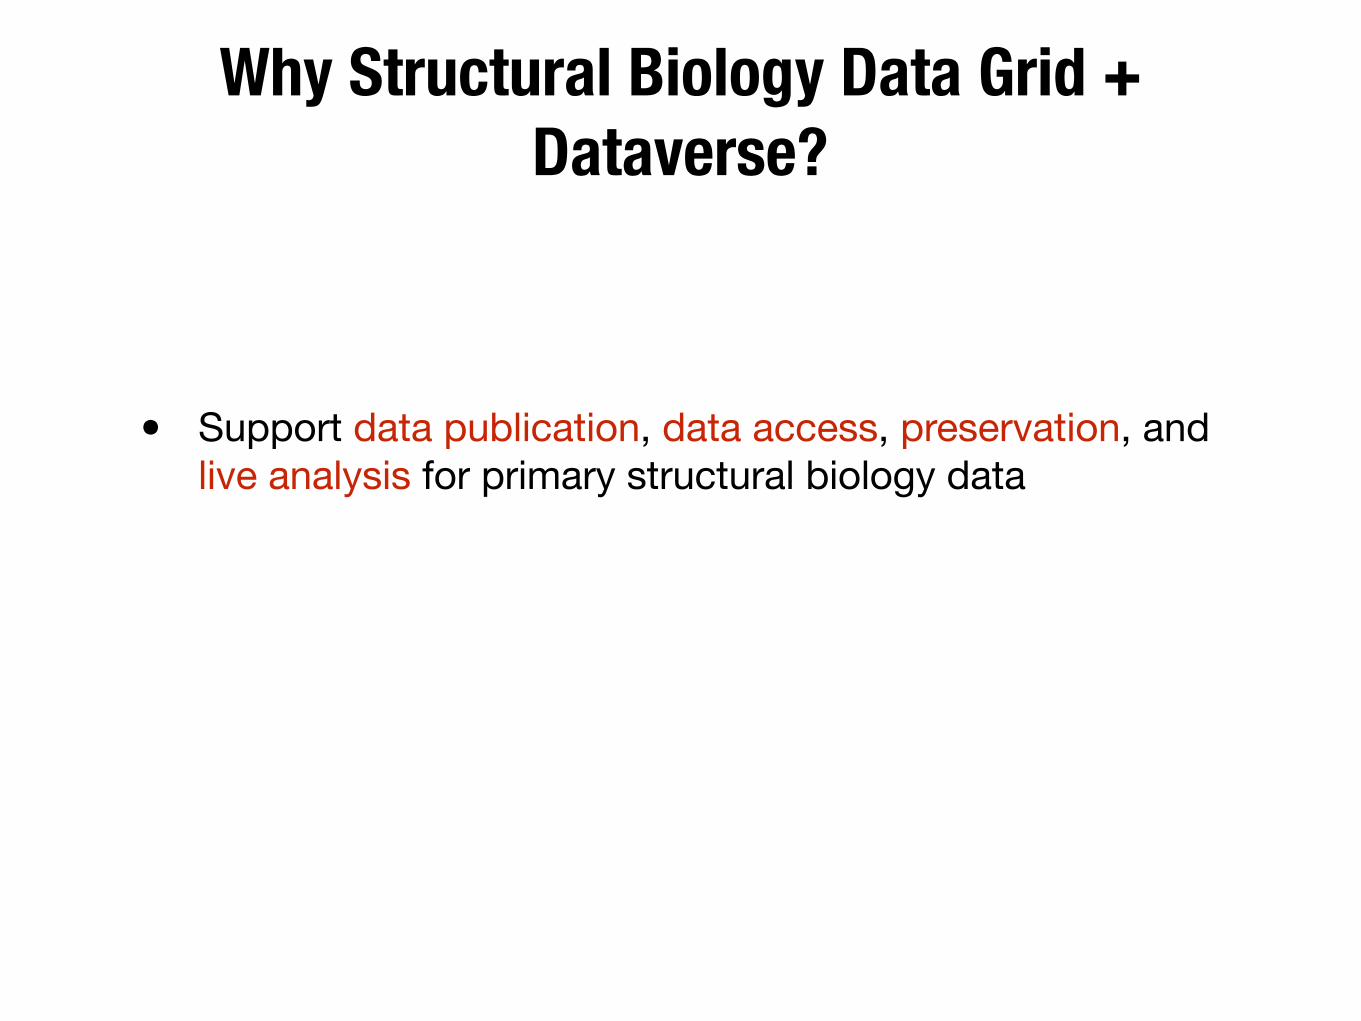
Why Structural Biology Data Grid + Dataverse?
Why Structural Biology Data Grid + Dataverse?
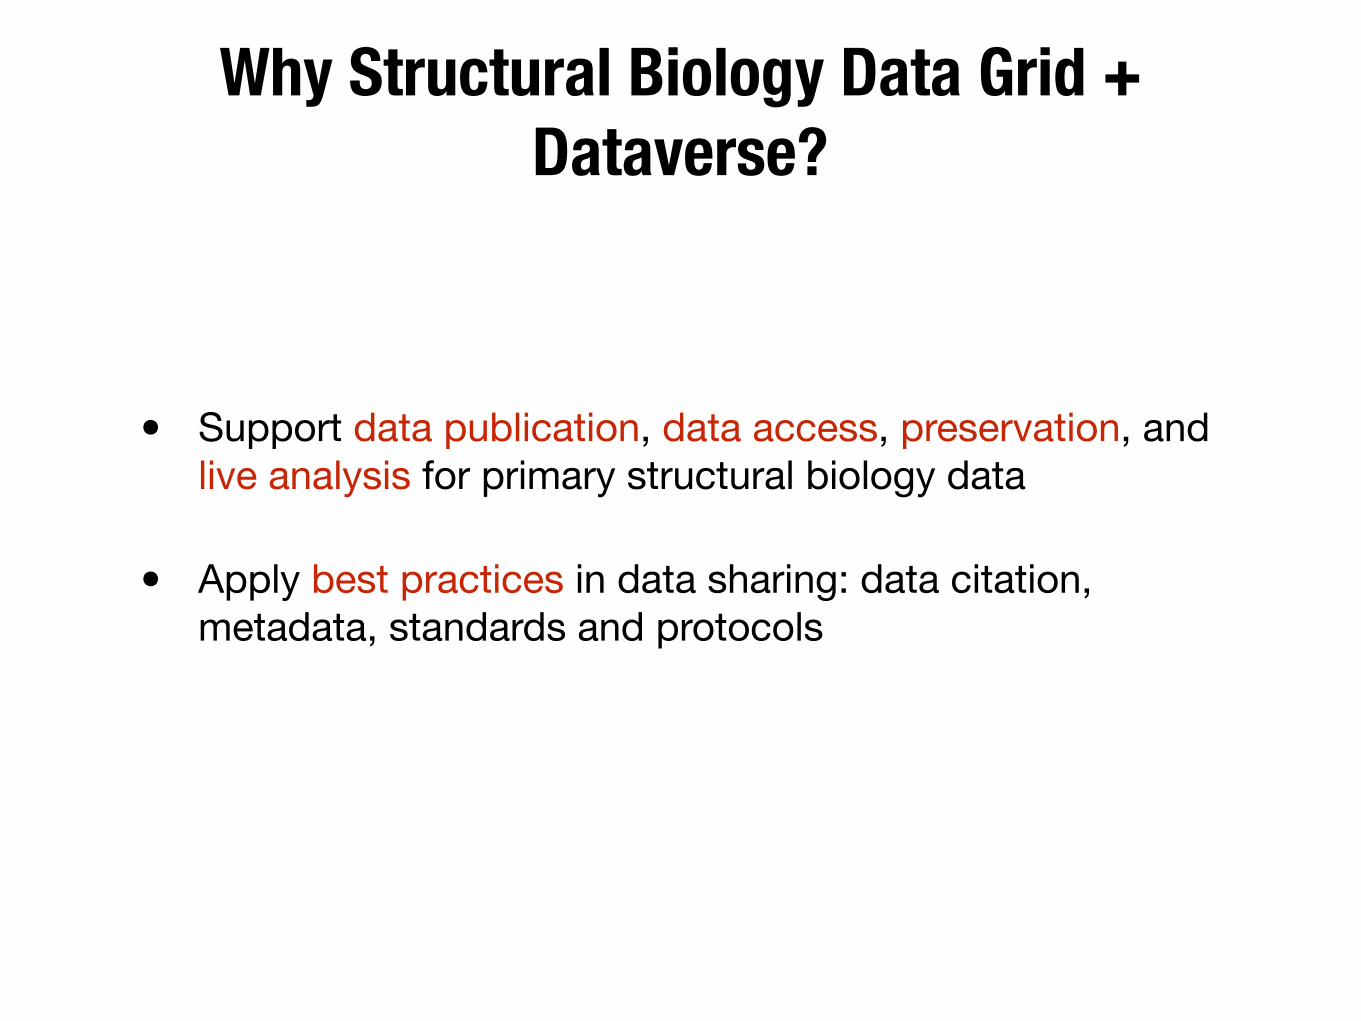
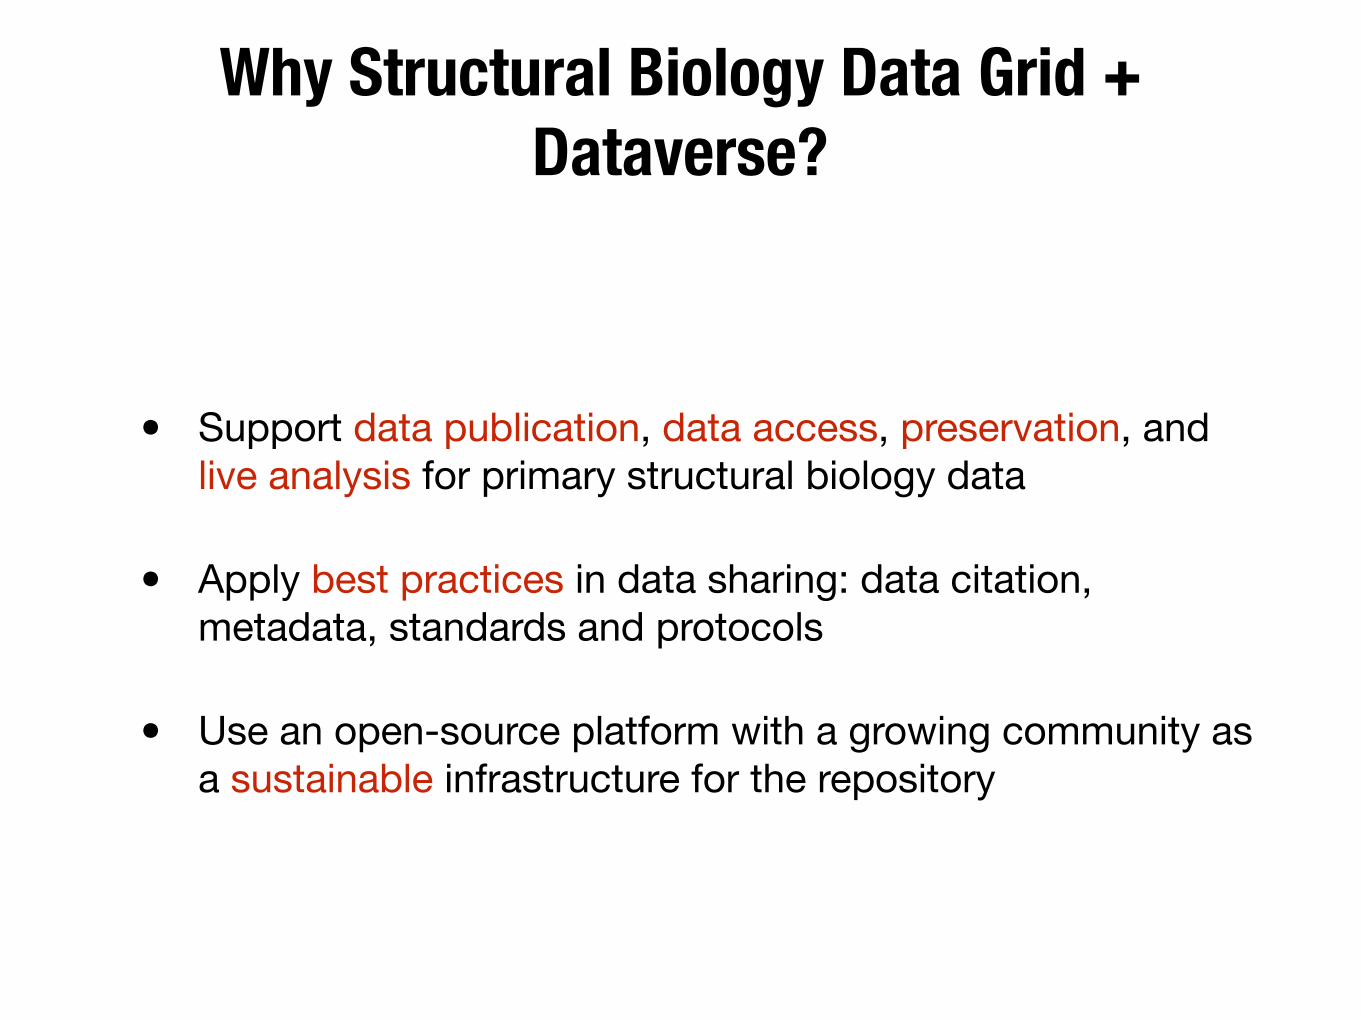
• Support data publication, data access, preservation, and live analysis for primary structural biology data
Why Structural Biology Data Grid + Dataverse?
• Support data publication, data access, preservation, and live analysis for primary structural biology data
• Apply best practices in data sharing: data citation, metadata, standards and protocols
Why Structural Biology Data Grid + Dataverse?
• Support data publication, data access, preservation, and live analysis for primary structural biology data
• Apply best practices in data sharing: data citation, metadata, standards and protocols
• Use an open-source platform with a growing community as a sustainable infrastructure for the repository
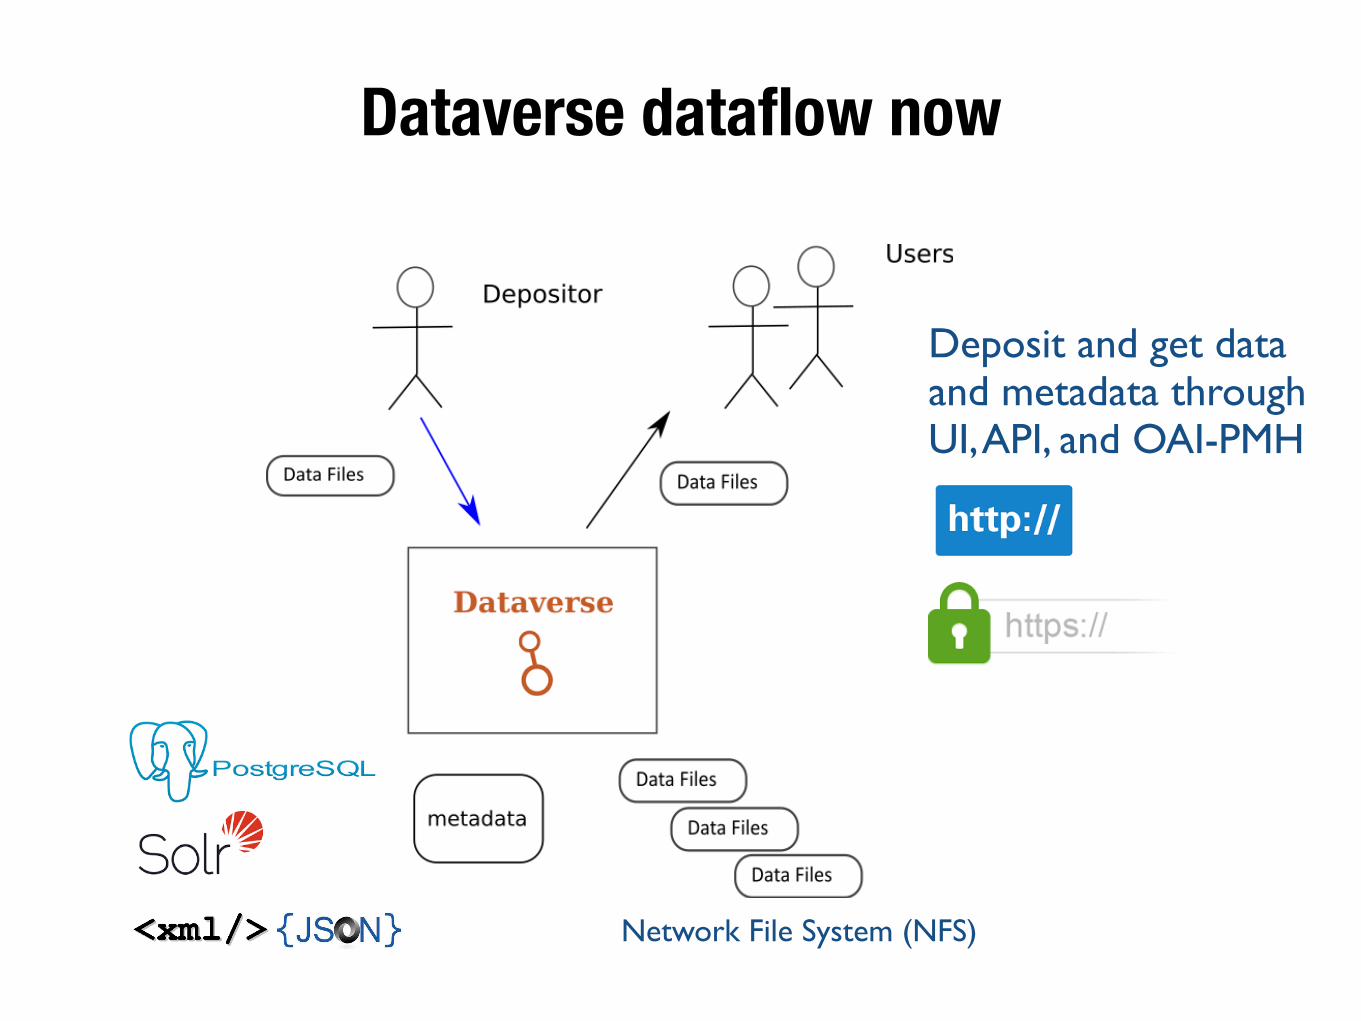
Dataverse dataflow now
Deposit and get data and metadata through UI, API, and OAI-PMH
Network File System (NFS)
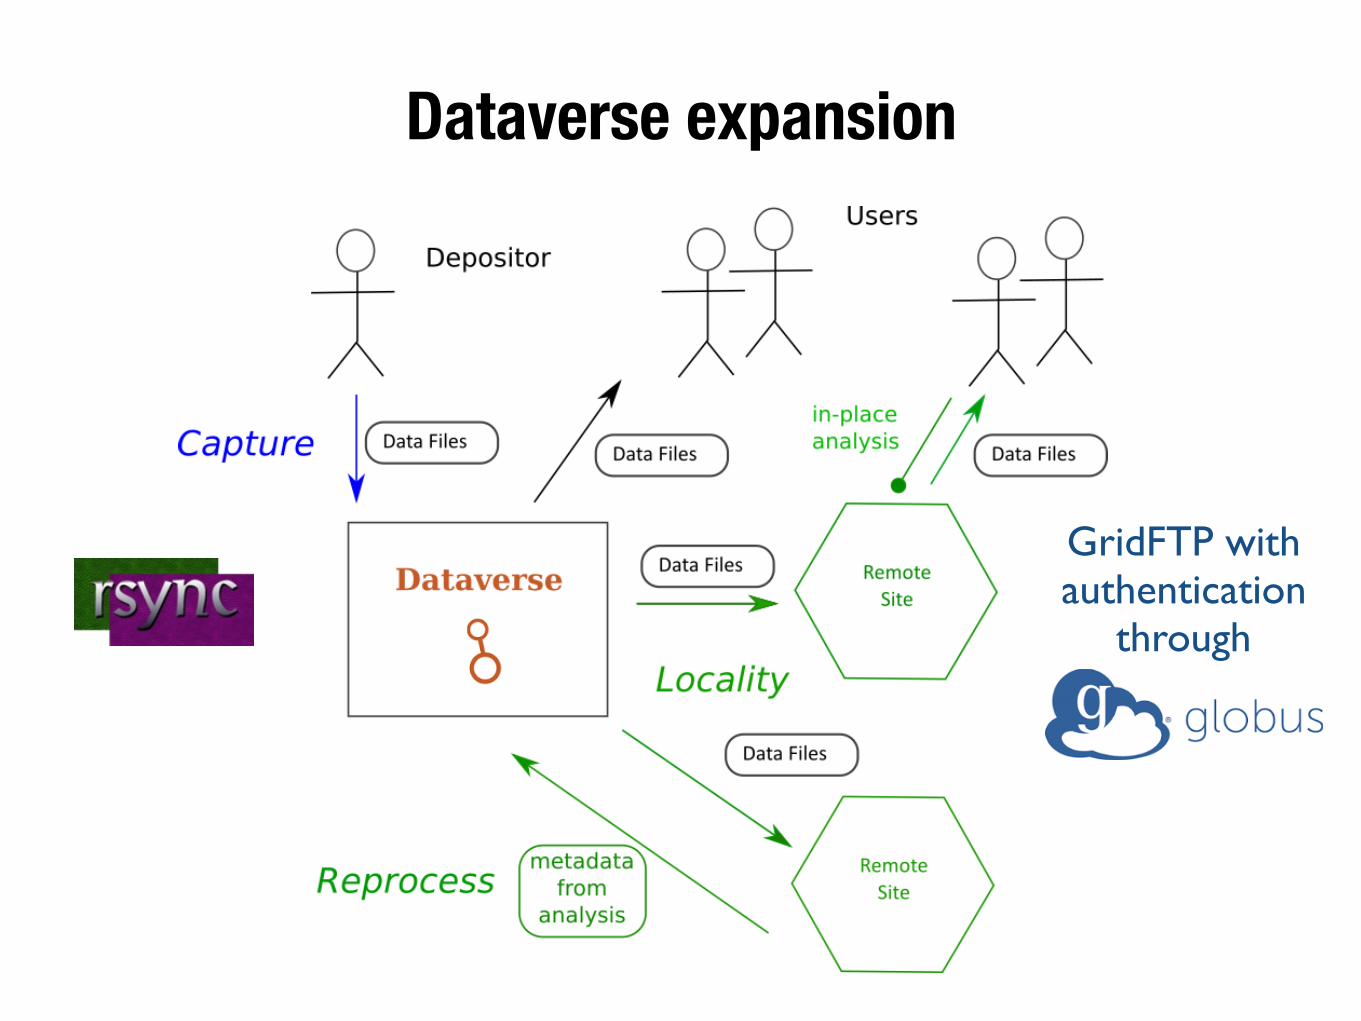
Dataverse expansion
GridFTP with authentication
through
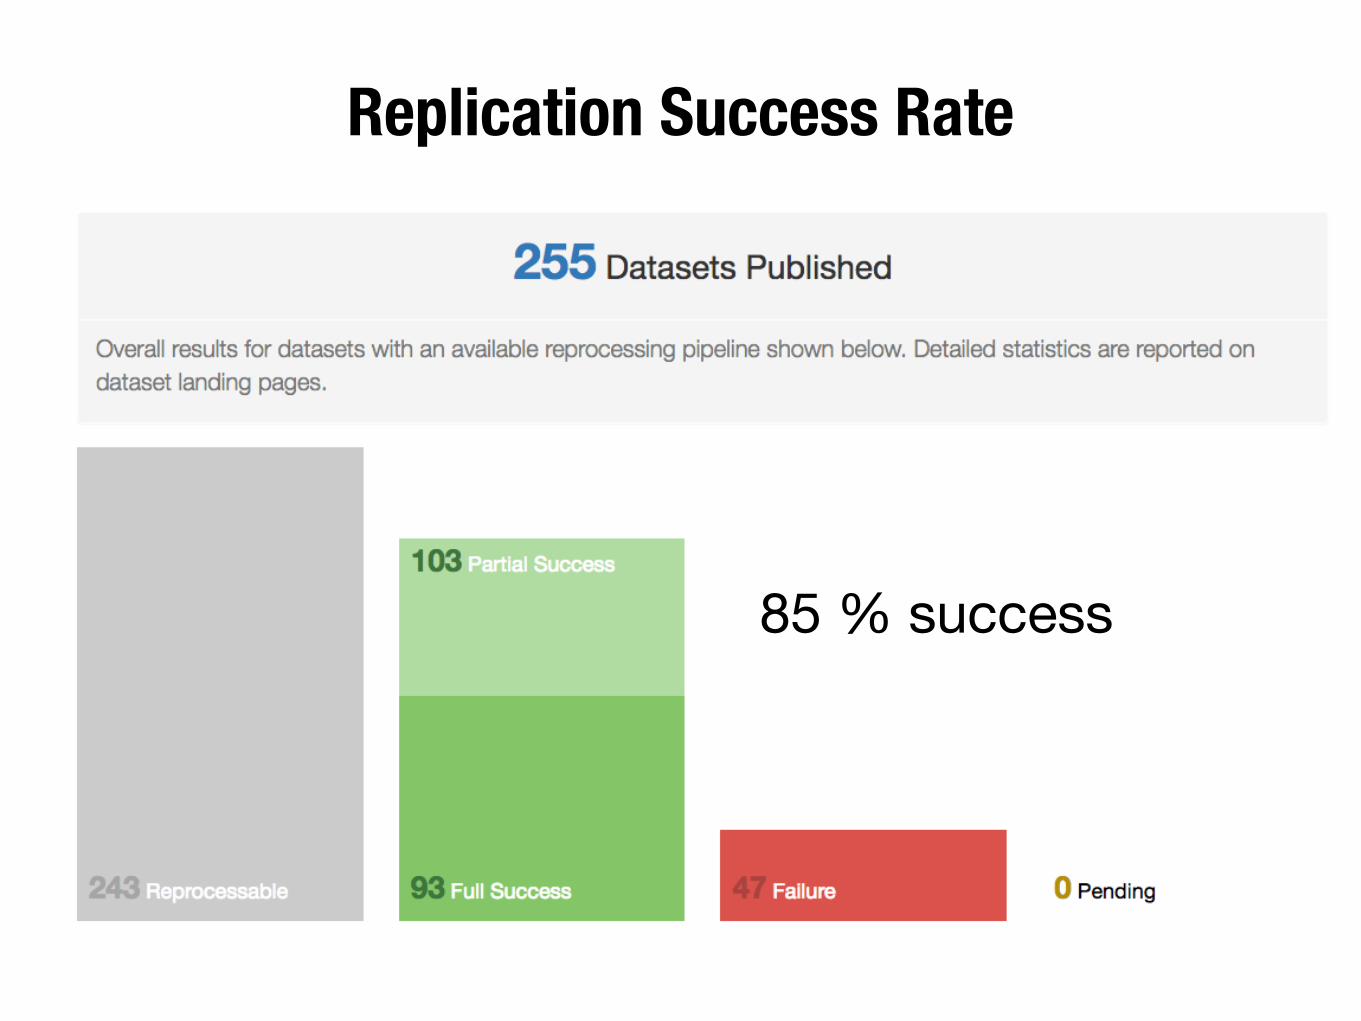
Replication Success Rate
85 % success
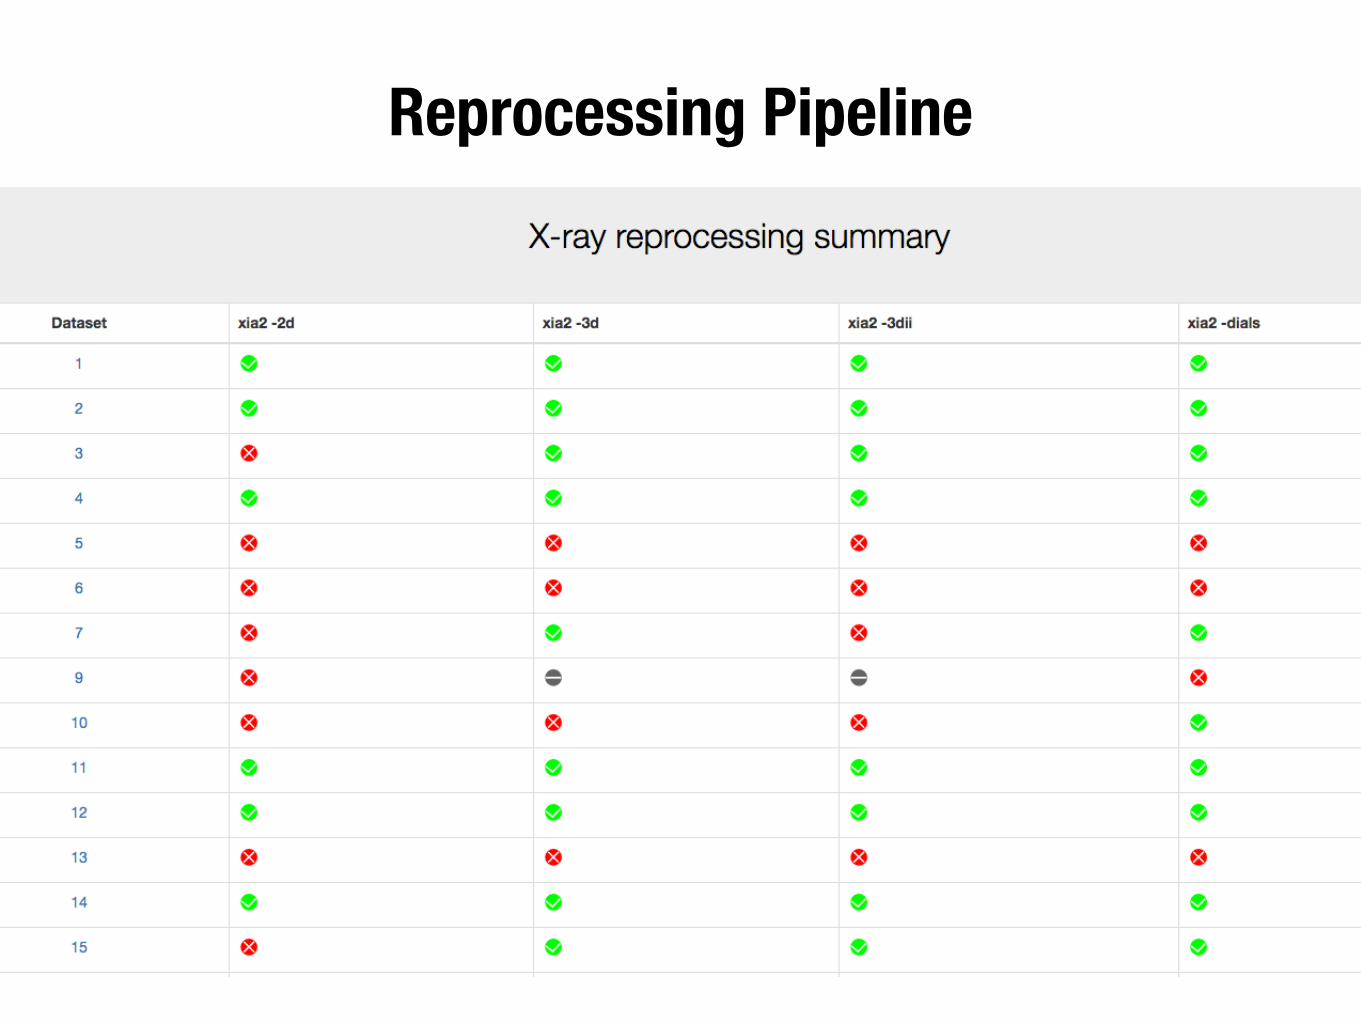
Reprocessing Pipeline
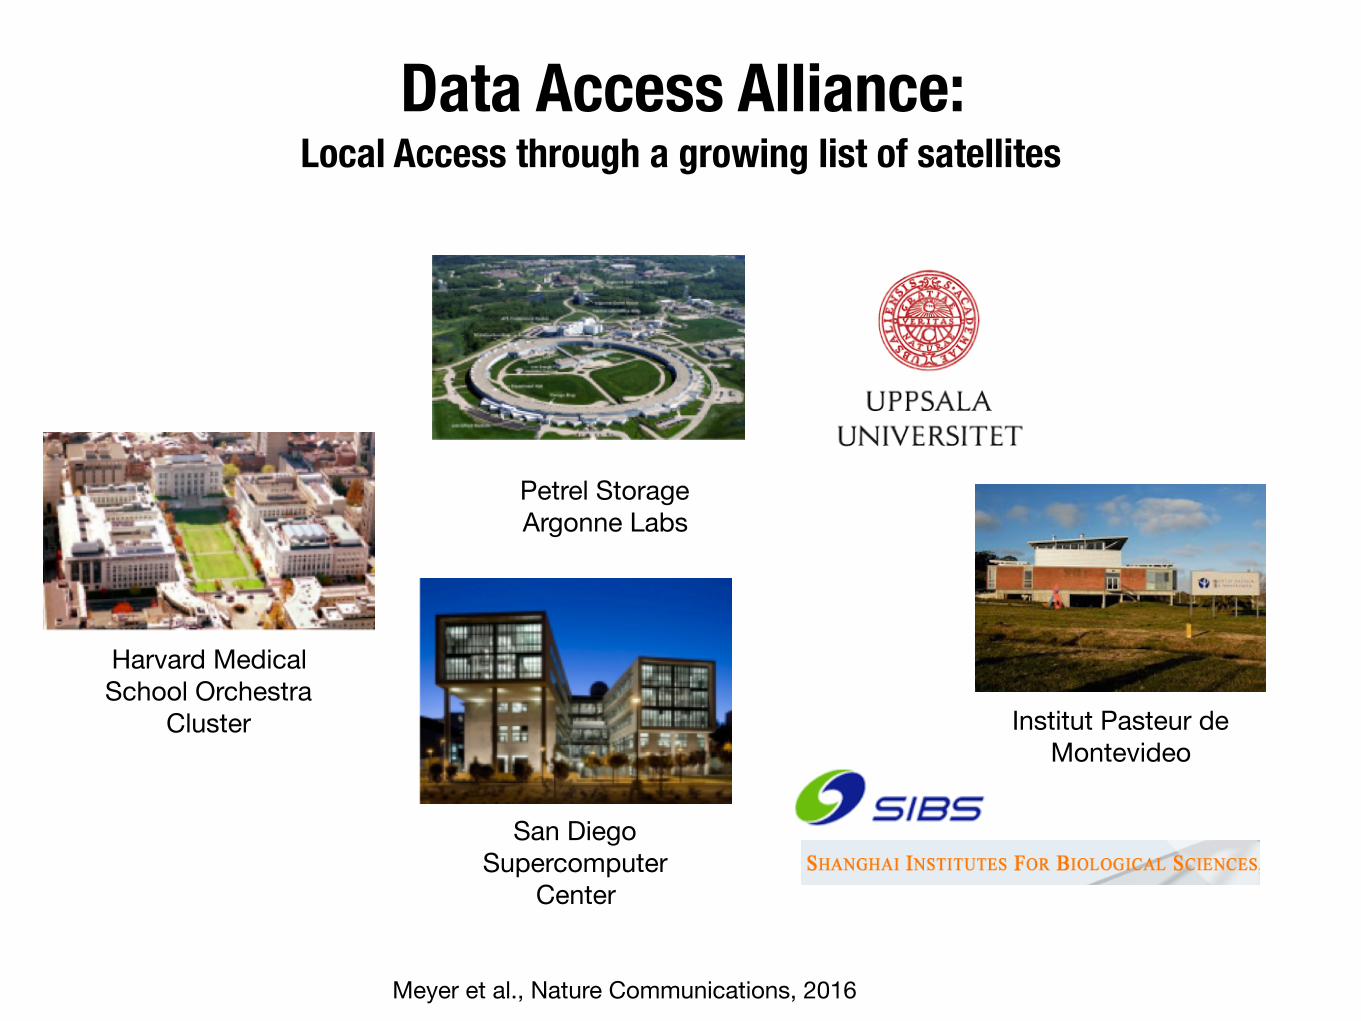
Data Access Alliance: Local Access through a growing list of satellites
Meyer et al., Nature Communications, 2016
San Diego Supercomputer
Center
Petrel Storage Argonne Labs
Harvard Medical School Orchestra
Cluster Institut Pasteur de Montevideo
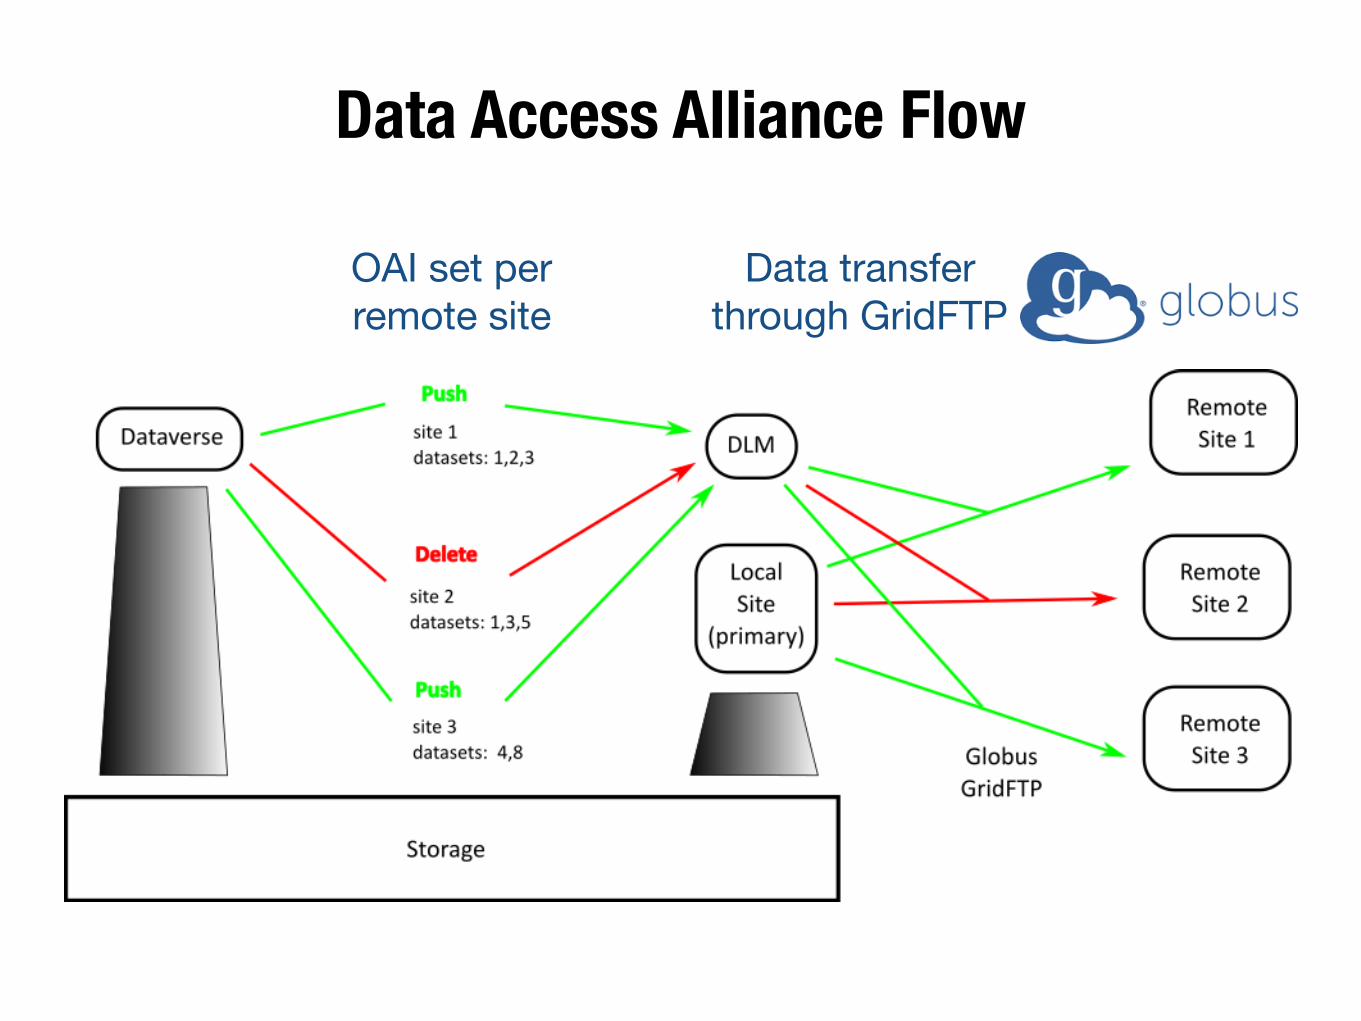
Data Access Alliance Flow
Data transfer through GridFTP
OAI set per remote site
Summary
Summary
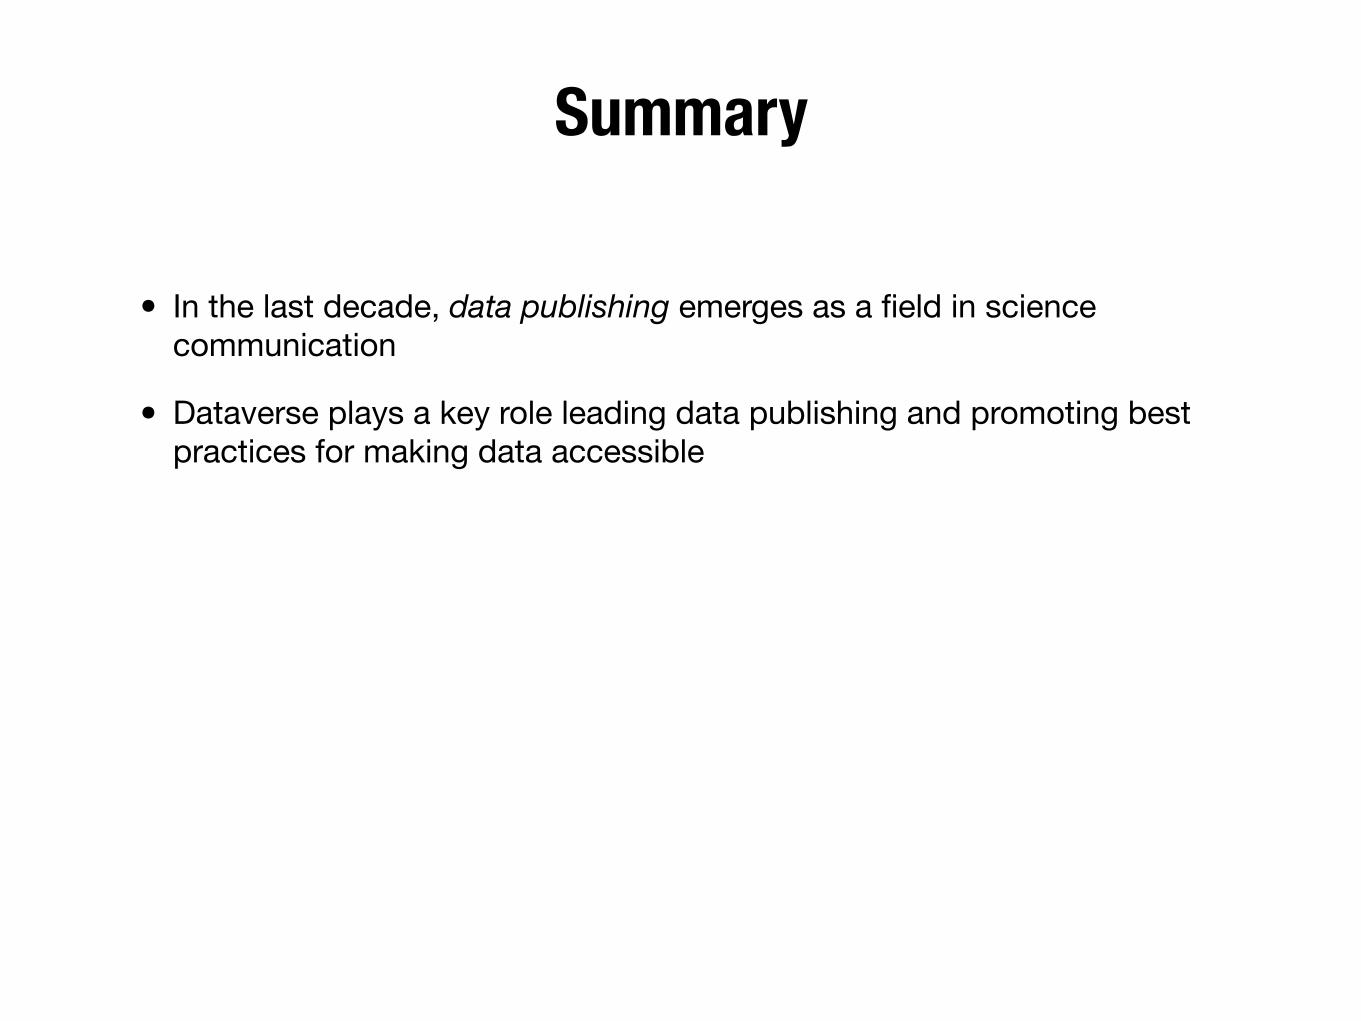
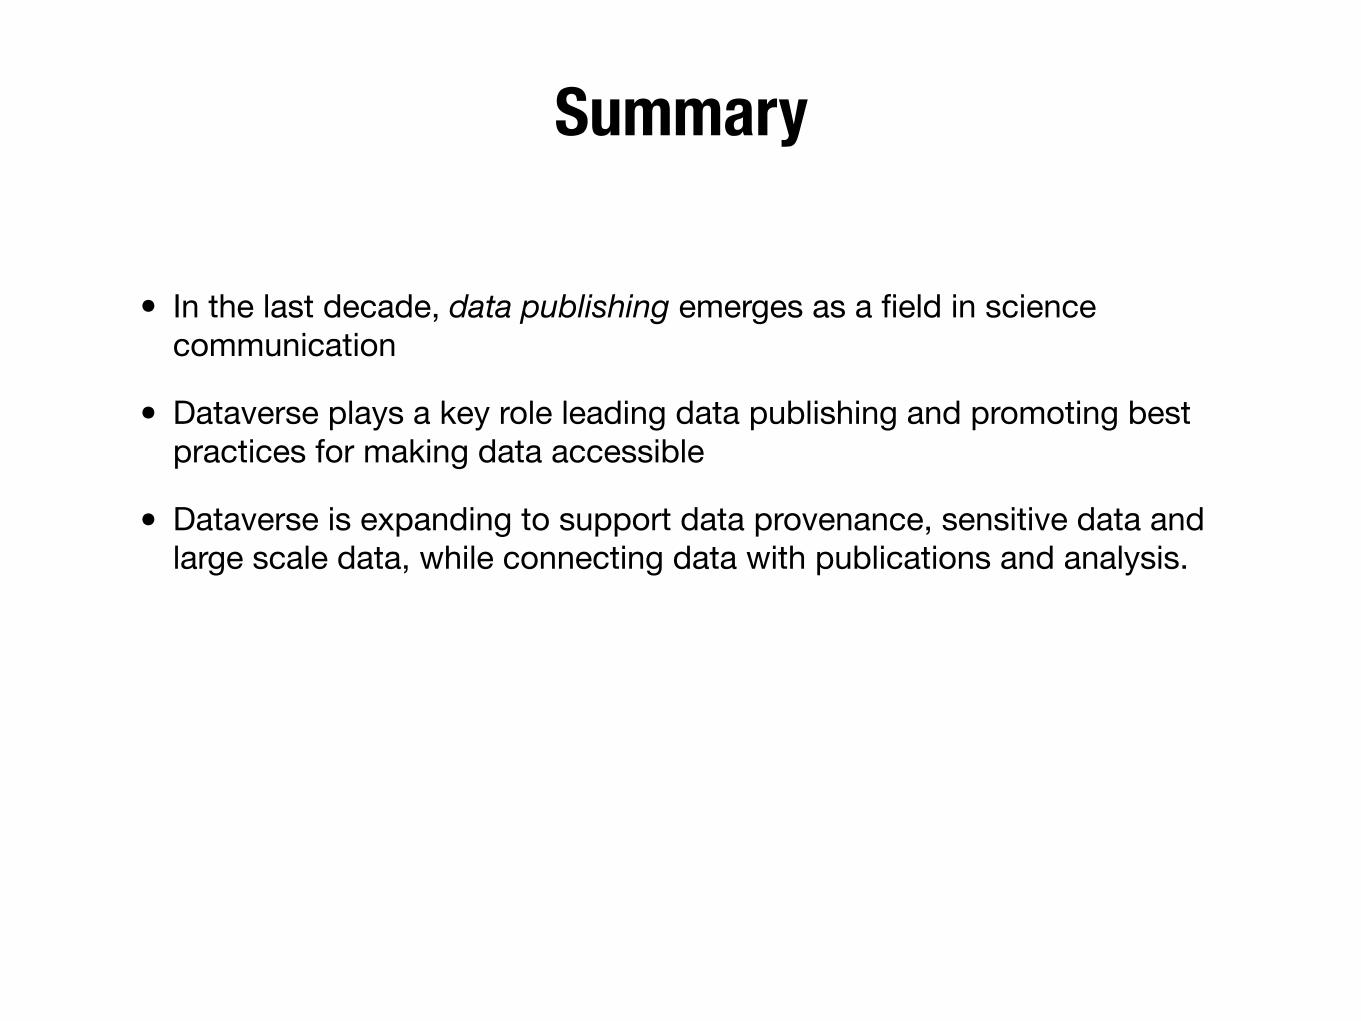
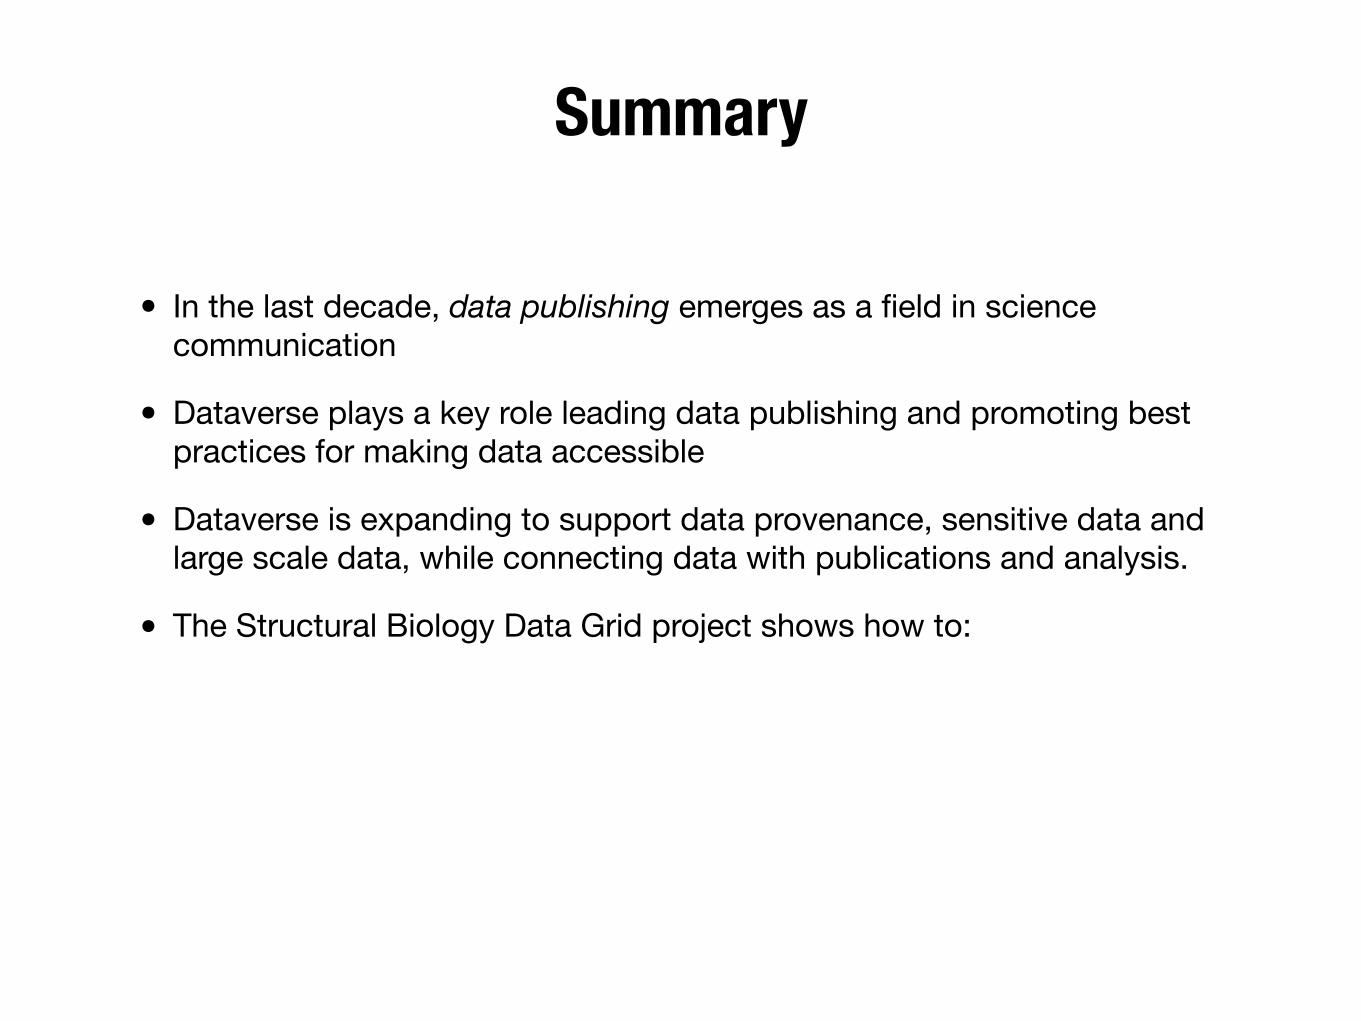
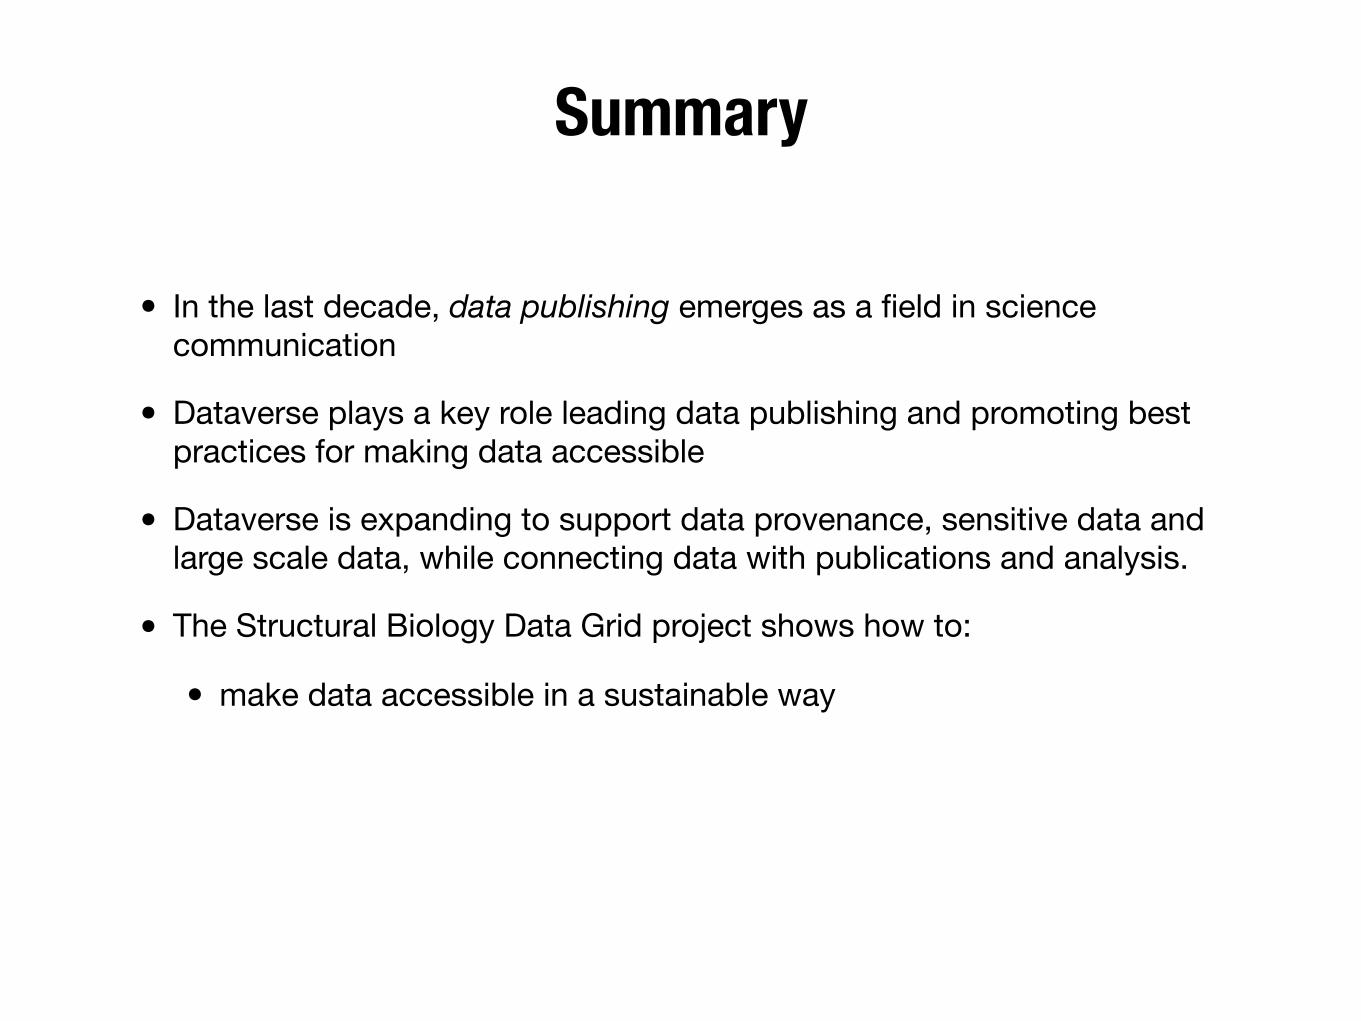
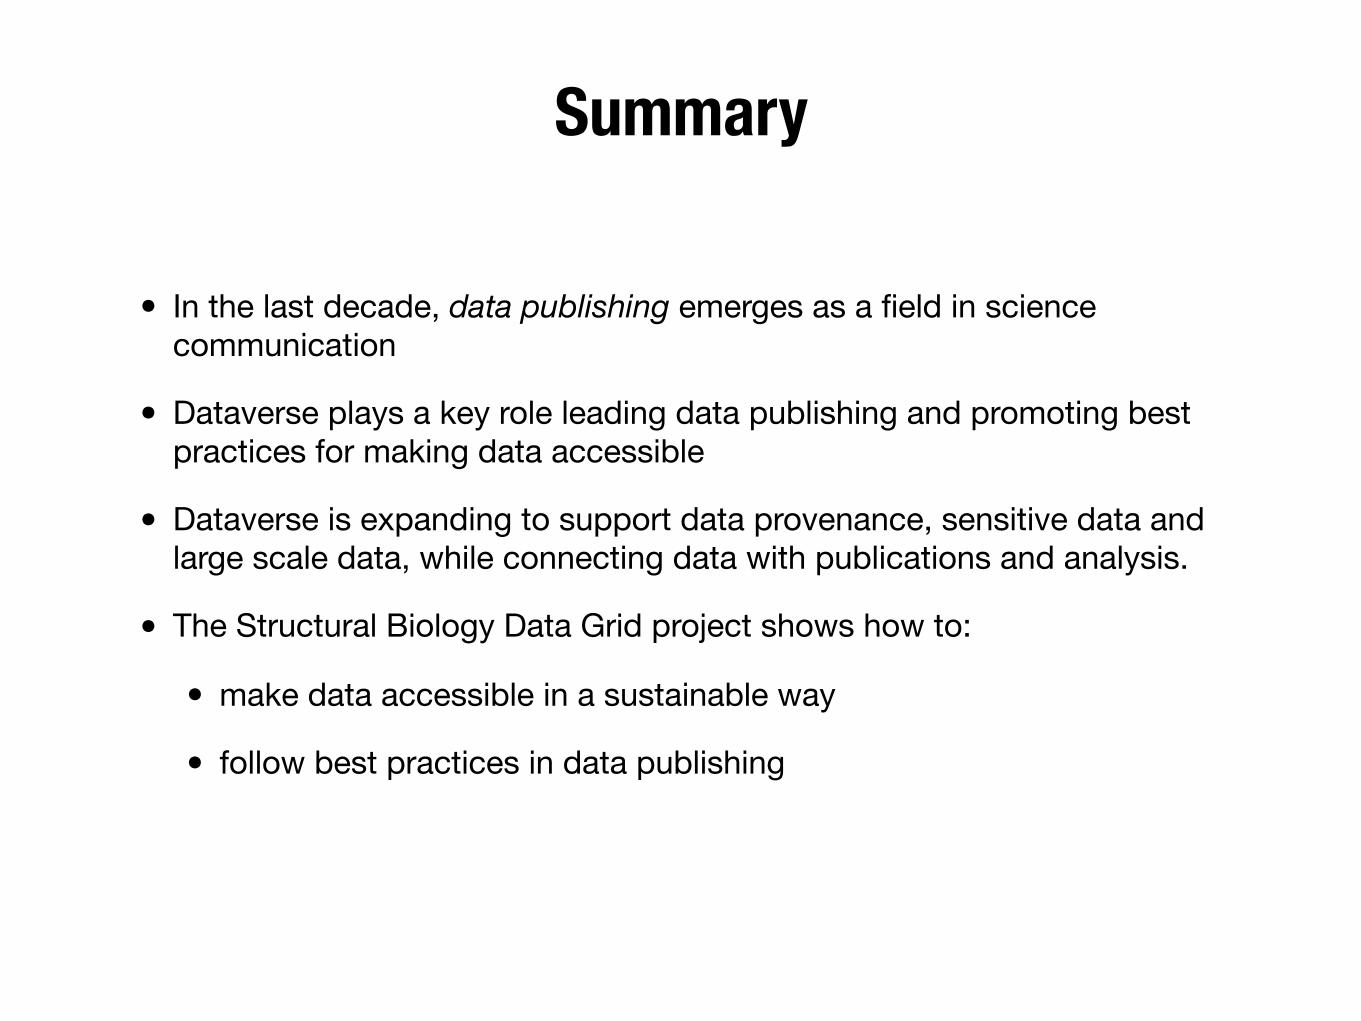
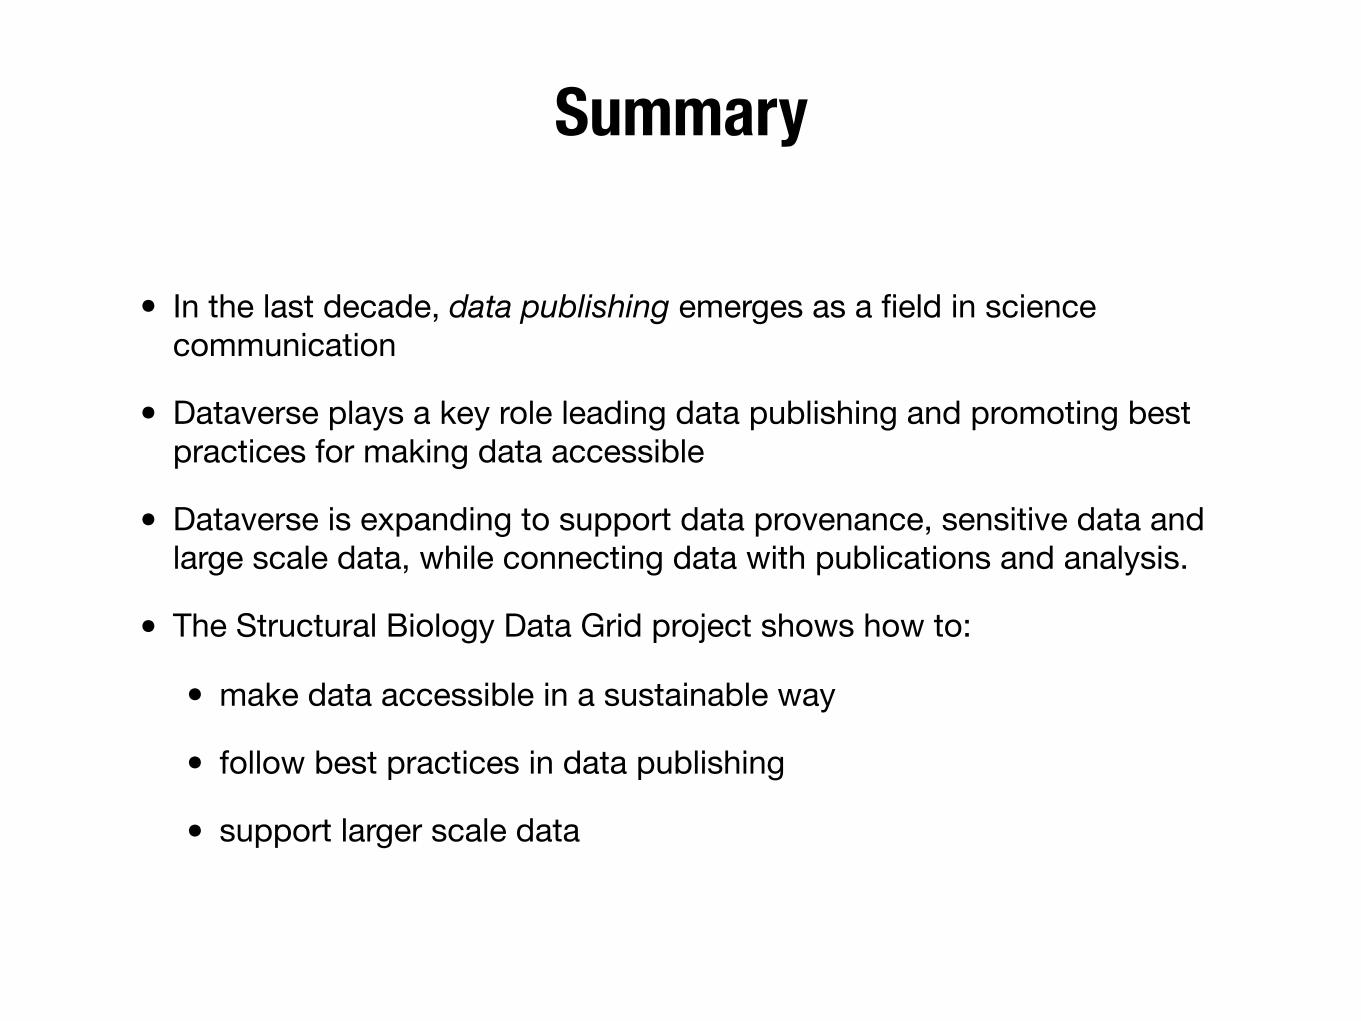
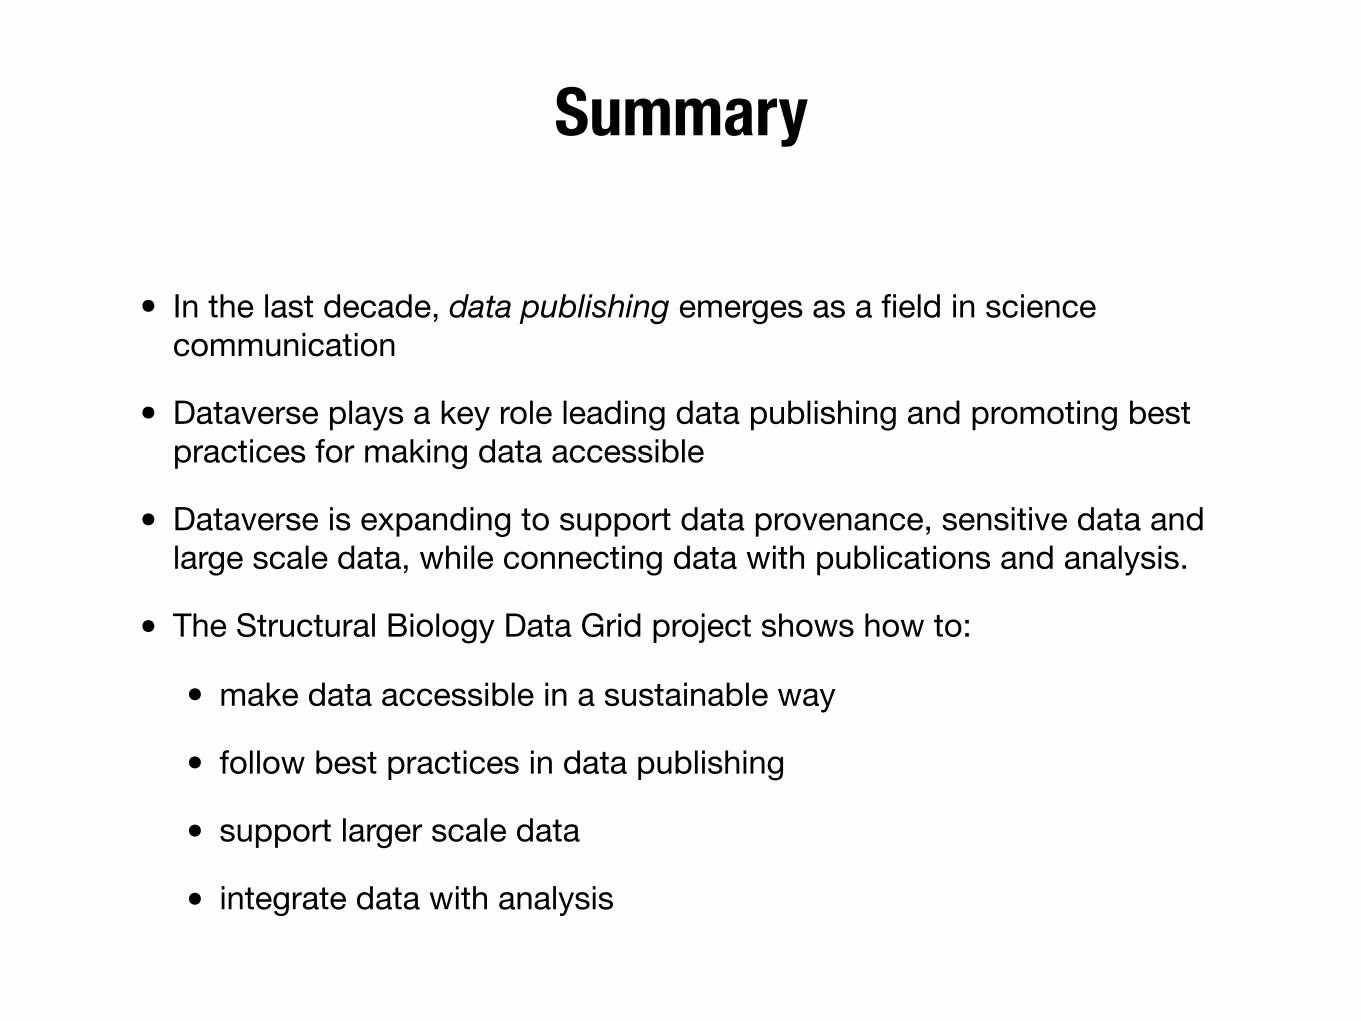
• In the last decade, data publishing emerges as a field in science communication
Summary
• In the last decade, data publishing emerges as a field in science communication
• Dataverse plays a key role leading data publishing and promoting best practices for making data accessible
Summary
• In the last decade, data publishing emerges as a field in science communication
• Dataverse plays a key role leading data publishing and promoting best practices for making data accessible
• Dataverse is expanding to support data provenance, sensitive data and large scale data, while connecting data with publications and analysis.
• The Structural Biology Data Grid project shows how to:
• make data accessible in a sustainable way
• follow best practices in data publishing
• support larger scale data
• integrate data with analysis
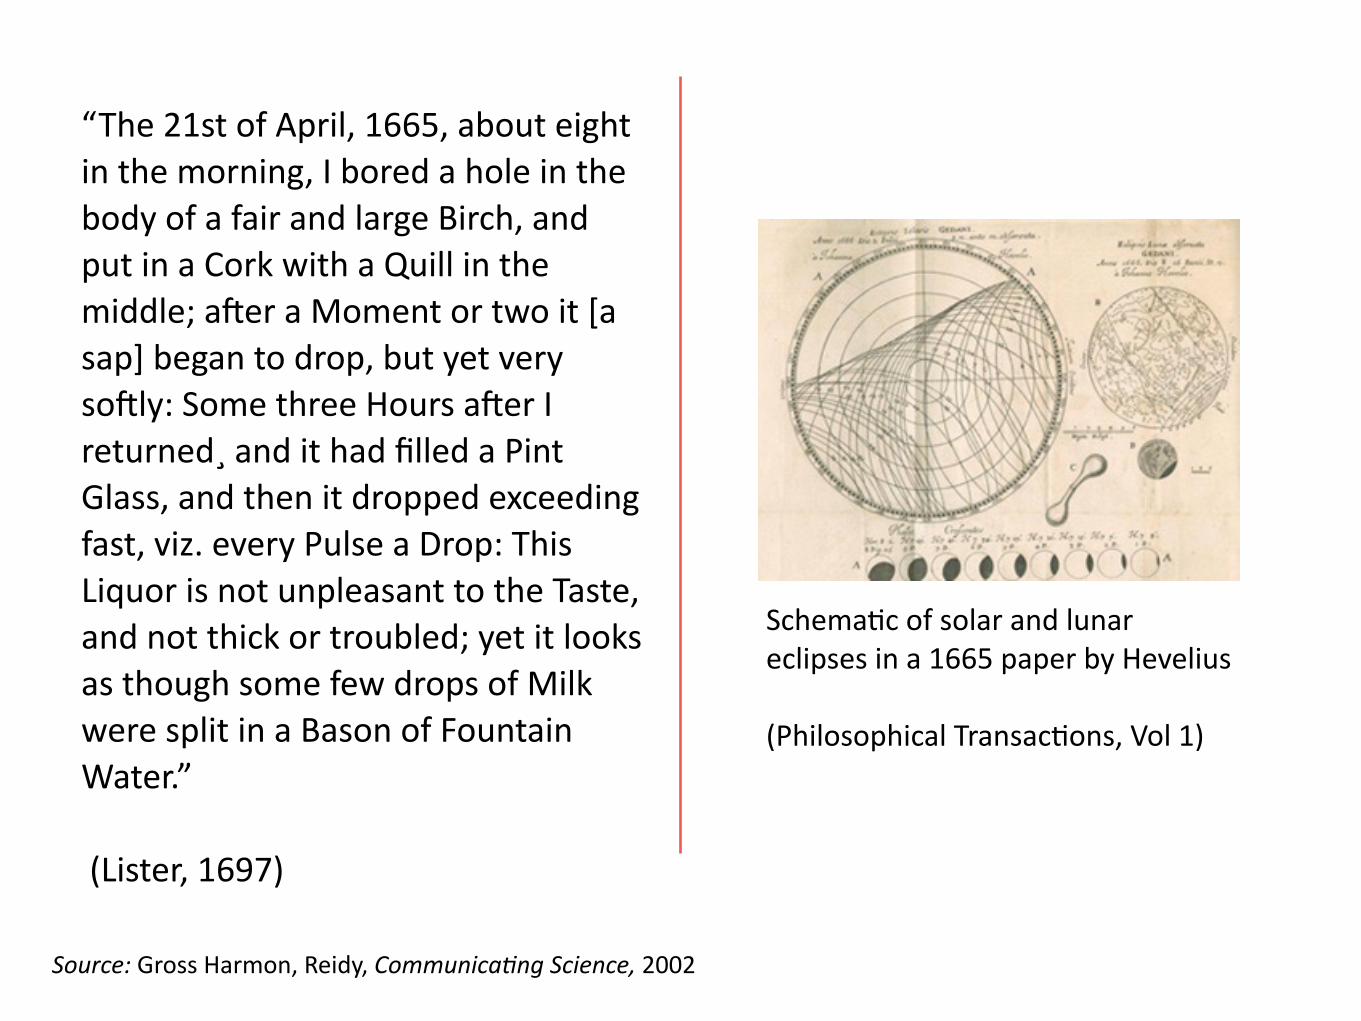
“The 21st of April, 1665, about eight in the morning, I bored a hole in the body of a fair and large Birch, and put in a Cork with a Quill in the middle; aOer a Moment or two it [a sap] began to drop, but yet very soOly: Some three Hours aOer I returned¸ and it had filled a Pint Glass, and then it dropped exceeding fast, viz. every Pulse a Drop: This Liquor is not unpleasant to the Taste, and not thick or troubled; yet it looks as though some few drops of Milk were split in a Bason of Fountain Water.” (Lister, 1697)
Schemaac of solar and lunar eclipses in a 1665 paper by Hevelius
(Philosophical Transacaons, Vol 1)
Source: Gross Harmon, Reidy, Communica8ng Science, 2002