Embed Size (px)
Citation preview
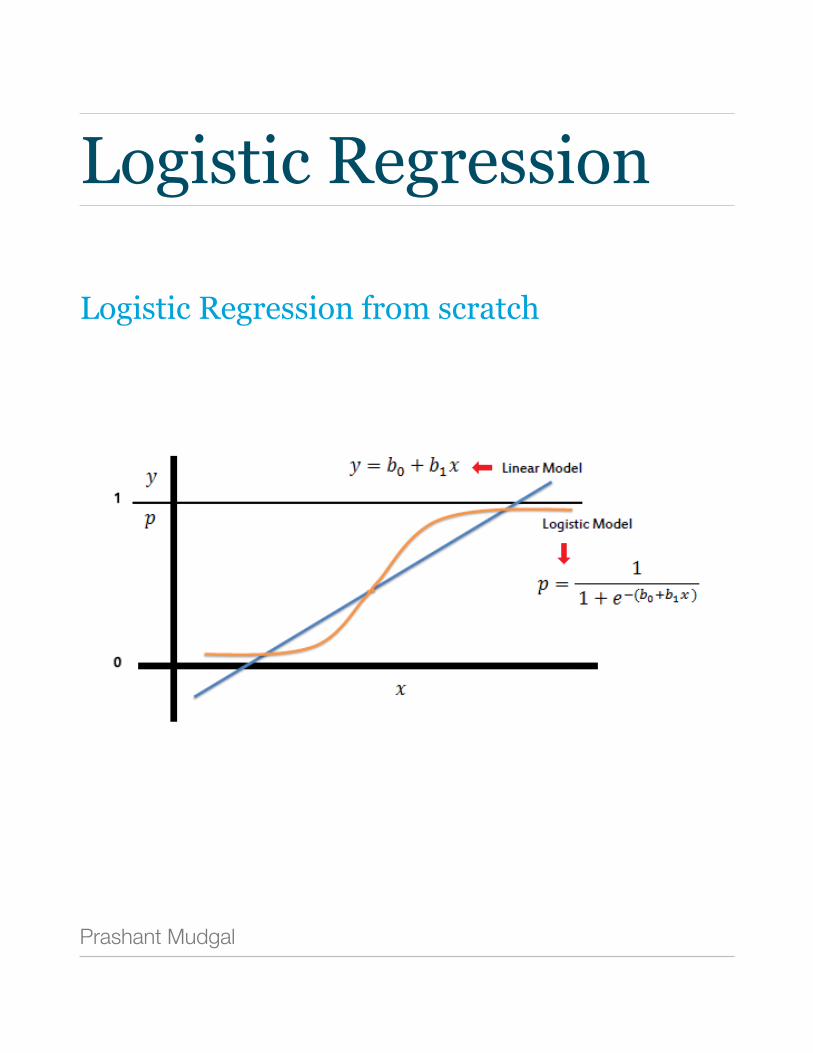
Logistic Regression
Logistic Regression from scratch
Prashant Mudgal

Introduction
80% of the problems that we deal in predictive analytics are of classification in nature i.e. the target variable is categorical in nature. Logistic regression is one of the most used algorithm in field of analytics. Random forests, gradient boosting, extreme gradient boosting have their own quirks and their strengths but the starting point most of the times is logistic regression that gives us a scale of the performance. It doesn’t contain the regularization parameters that are included in tree based methods that can reduce the bias variance errors but then too it gives good estimate of the error and can act as a base for further research. As a general rule, it is advisable to use logistic regression with cross validation that can reduce the error in the predictions. Logistic regression is still relevant in age of machine learning because the solutions that are provided by machine learning might not fit the business case scenarios. ML’s predictive efficiency comes with complexity in the model and we keep on combining variables to make models stronger which might make no sense in business.

Problem Statement and Data
The name of the bank is Santander Website http://www.santander.com
Problem statement : Santander Bank is asking to help them identify dissatisfied customers early in their relationship. Doing so would allow Santander to take proactive steps to improve a customer's happiness before it's too late.
The data has hundreds of anonymized features to predict if a customer is satisfied or dissatisfied with their banking experience.
Data has been taken from https://www.kaggle.com/c/santander-customer-satisfaction/data
You are provided with an anonymized dataset containing a large number of numeric variables. The "TARGET" column is the variable to predict. It equals one for unsatisfied customers and 0 for satisfied customers.
The task is to predict the probability that each customer in the test set is an unsatisfied customer.
Rules : https://www.kaggle.com/c/santander-customer-satisfaction/rules
File descriptions :
train.csv - the training set including the target
test.csv - the test set without the target
Language and Packages Given the rise of python and ease of usage, the models have been built in python. One can replicate the same on R or SAS.
Packages and libraries : Pandas, numpy, scikit-learn, matplotlib
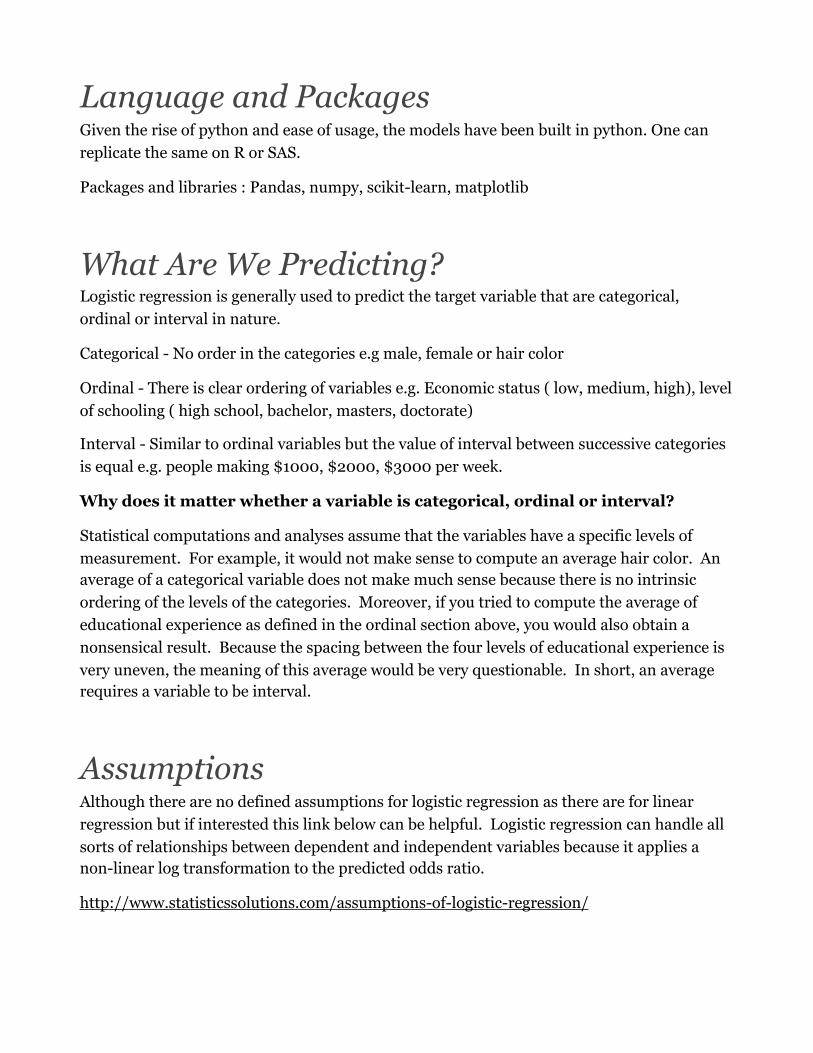
What Are We Predicting? Logistic regression is generally used to predict the target variable that are categorical, ordinal or interval in nature.
Categorical - No order in the categories e.g male, female or hair color
Ordinal - There is clear ordering of variables e.g. Economic status ( low, medium, high), level of schooling ( high school, bachelor, masters, doctorate)
Interval - Similar to ordinal variables but the value of interval between successive categories is equal e.g. people making $1000, $2000, $3000 per week.
Why does it matter whether a variable is categorical, ordinal or interval?
Statistical computations and analyses assume that the variables have a specific levels of measurement. For example, it would not make sense to compute an average hair color. An average of a categorical variable does not make much sense because there is no intrinsic ordering of the levels of the categories. Moreover, if you tried to compute the average of educational experience as defined in the ordinal section above, you would also obtain a nonsensical result. Because the spacing between the four levels of educational experience is very uneven, the meaning of this average would be very questionable. In short, an average requires a variable to be interval.
Assumptions Although there are no defined assumptions for logistic regression as there are for linear regression but if interested this link below can be helpful. Logistic regression can handle all sorts of relationships between dependent and independent variables because it applies a non-linear log transformation to the predicted odds ratio.
http://www.statisticssolutions.com/assumptions-of-logistic-regression/
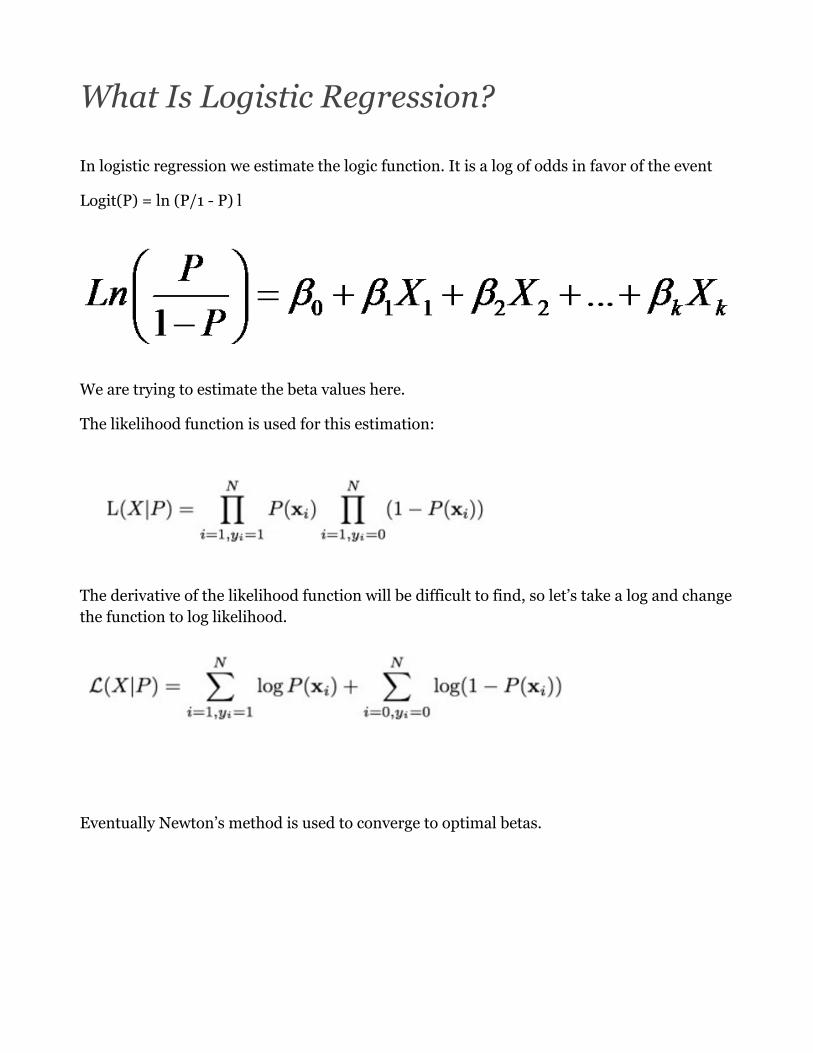
What Is Logistic Regression?
In logistic regression we estimate the logic function. It is a log of odds in favor of the event
Logit(P) = ln (P/1 - P) l
We are trying to estimate the beta values here.
The likelihood function is used for this estimation:
The derivative of the likelihood function will be difficult to find, so let’s take a log and change the function to log likelihood.
Eventually Newton’s method is used to converge to optimal betas.

iPython Notebook https://github.com/Prashantmdgl9/Logistic-Regression
Import the libraries and read the data. One should take care of the delimiters; though the data is in CSV format, it is semicolon delimited. Check the number of rows and decide how much you want to keep in training and test. For now, don’t divide the data as any cleansing activity that needs to be done would be done on complete data frame.
Look at the data in detail, use the head, describe and column functions in the pandas library to take a closer look.
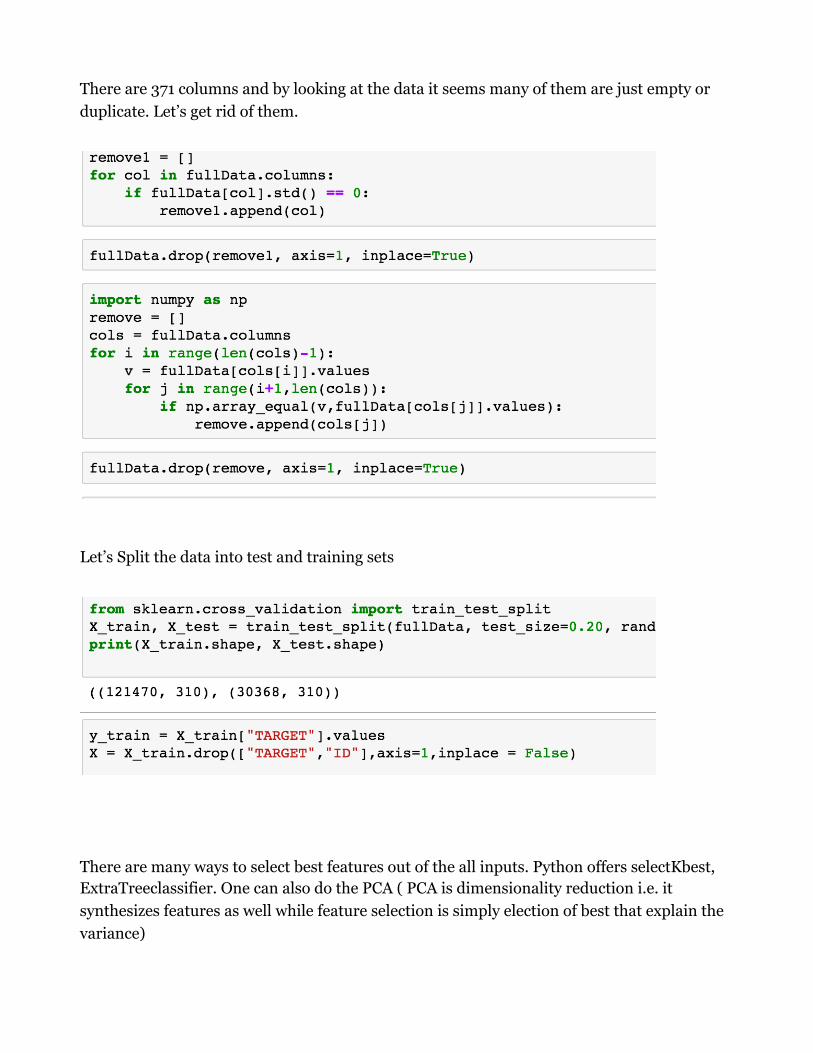
There are 371 columns and by looking at the data it seems many of them are just empty or duplicate. Let’s get rid of them.
Let’s Split the data into test and training sets
There are many ways to select best features out of the all inputs. Python offers selectKbest, ExtraTreeclassifier. One can also do the PCA ( PCA is dimensionality reduction i.e. it synthesizes features as well while feature selection is simply election of best that explain the variance)
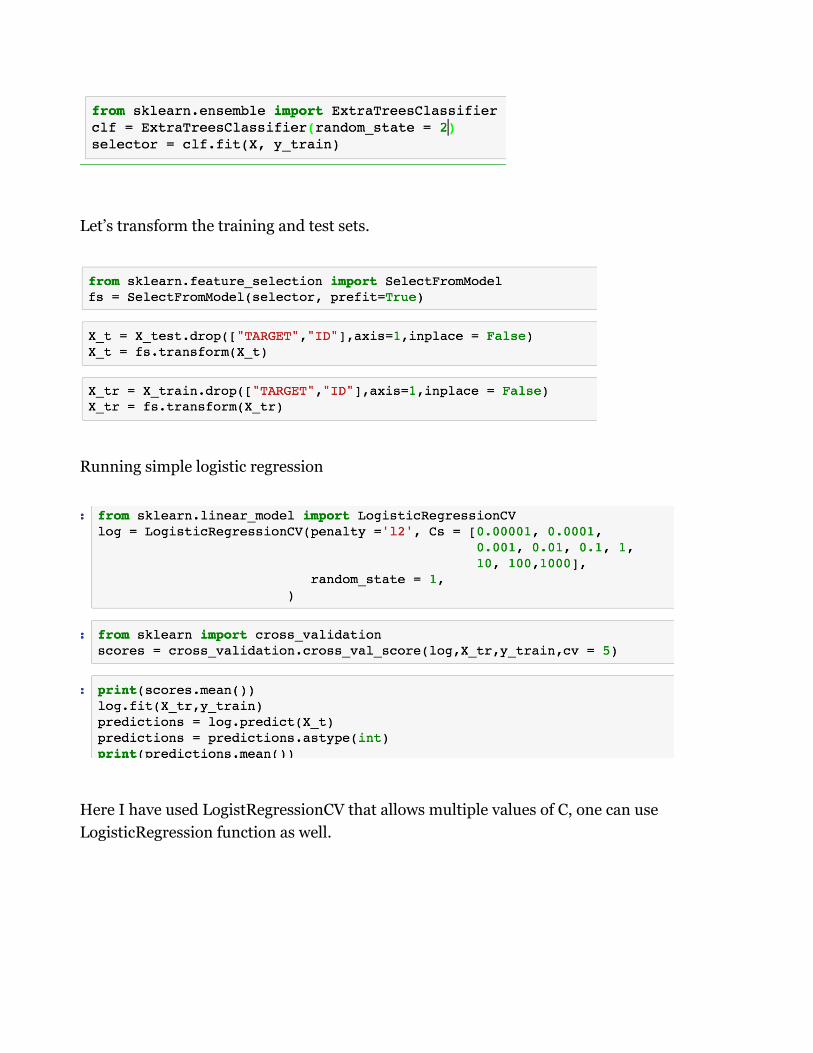
Let’s transform the training and test sets.
Running simple logistic regression
Here I have used LogistRegressionCV that allows multiple values of C, one can use LogisticRegression function as well.

Goodness of Fit
In the steps above we have looked at the mean of predictions to assert the goodness of fit. There are few other ways to do so and Hosmer-Lemeshow is a commonly used measure of goodness of fit based on the Chi-square test. In R, we can run pchisq, ‘with’ function, over the results of glm to get the goodness of fit. In SAS, we have proc logistic that gives the wald chi sq values.
I haven’t done this myself but a rough code to perform pearson chi-sq test should look like this.
The output is the chi sq value and the p-value, high chi-sq value and p-value lower than significance value is desired.
Conclusion
The step above conclude logistic regression in python. The aim of the notebook wasn’t to predict with great accuracy as logistic regression depends on the kind of data and can be very basic algorithm to deal with in case of difficult problems. The purpose is to take you through the steps involved, one has to tune the parameters such as C and penalty to see whether the results vary.
* If you want to download the python notebook of the project then you can visit
https://github.com/Prashantmdgl9/Logistic-Regression