Embed Size (px)
Citation preview
© 2017 MapR Technologies 1
Spark Machine Learning
Carol McDonald @caroljmcdonald
© 2017 MapR Technologies
Agenda • Introduction to Machine Learning Techniques
– Classification – Clustering
• Use Decision Tree to Predict Customer Churn
2
© 2017 MapR Technologies
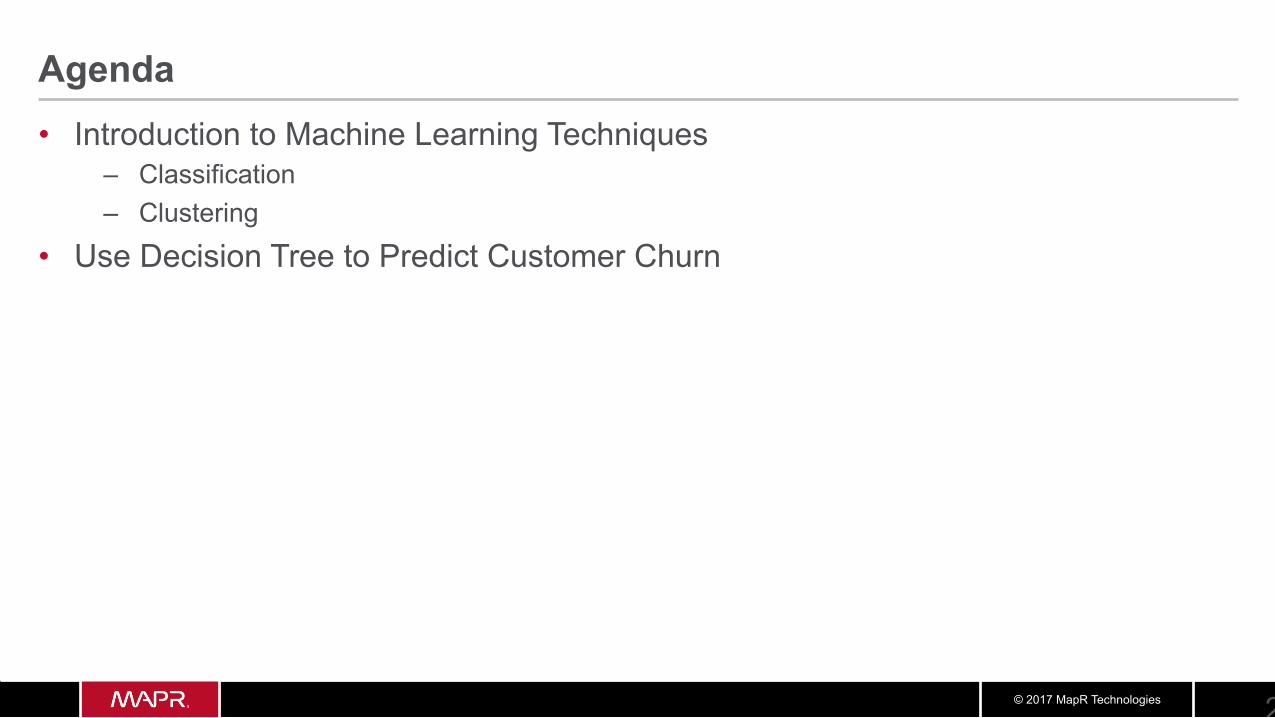
What is Machine Learning?
Data Build Model Train Algorithm
Finds patterns
New Data Use Model (prediction function)
Predictions
Contains patterns Recognizes patterns
© 2017 MapR Technologies
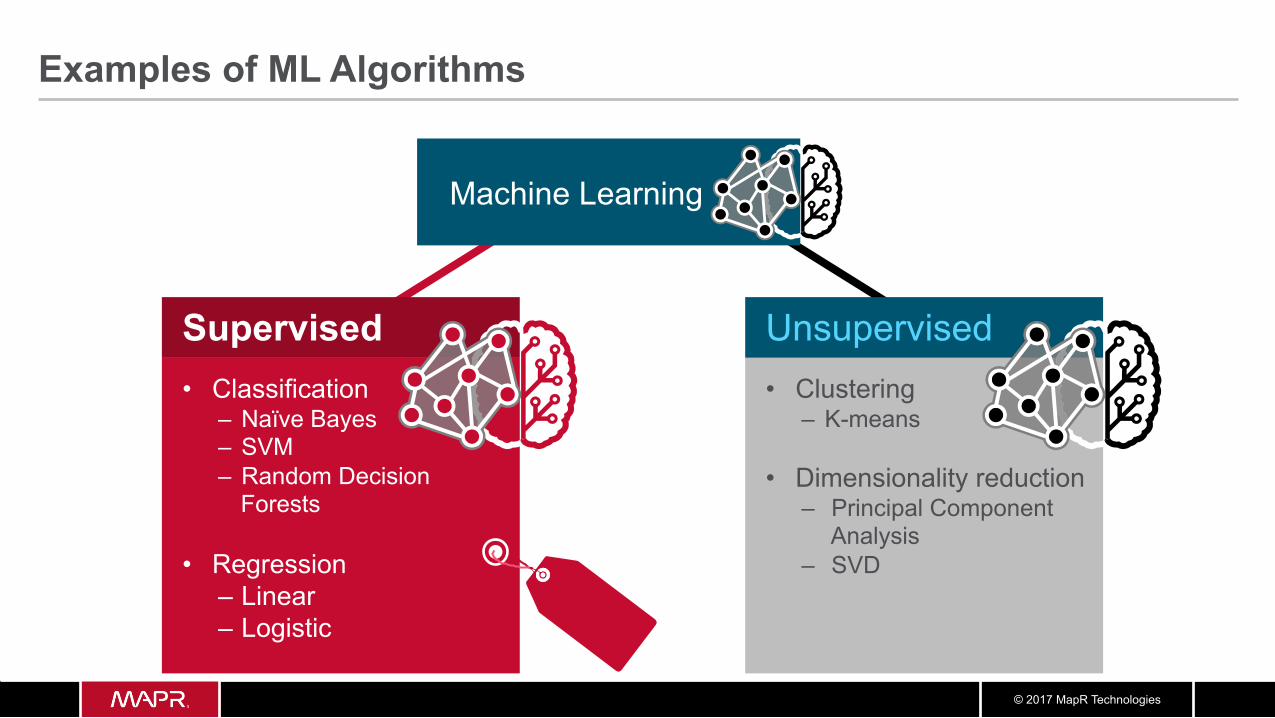
Examples of ML Algorithms
Supervised • Classification
– Naïve Bayes – SVM – Random Decision
Forests
• Regression – Linear – Logistic
Machine Learning
Unsupervised • Clustering
– K-means
• Dimensionality reduction – Principal Component
Analysis – SVD
© 2017 MapR Technologies
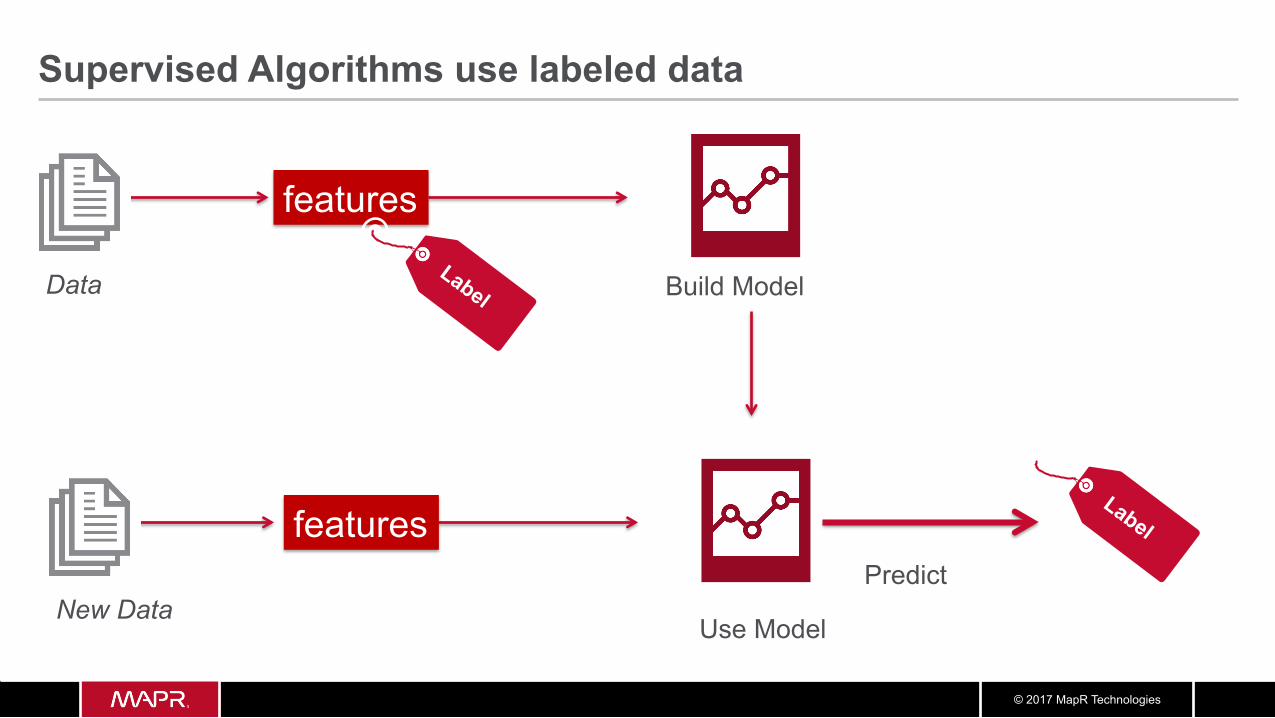
Supervised Algorithms use labeled data
Data
features
Build Model
New Data
features Predict
Use Model
© 2017 MapR Technologies
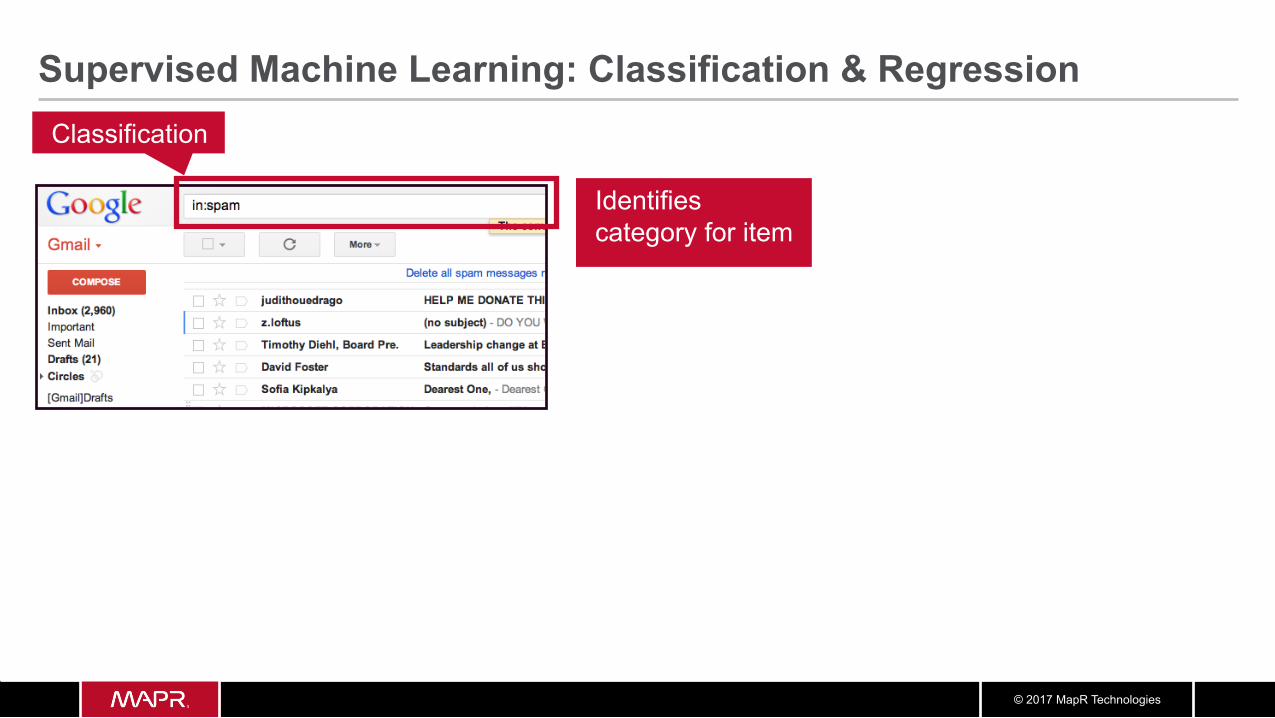
Supervised Machine Learning: Classification & Regression Classification
Identifies category for item
© 2017 MapR Technologies
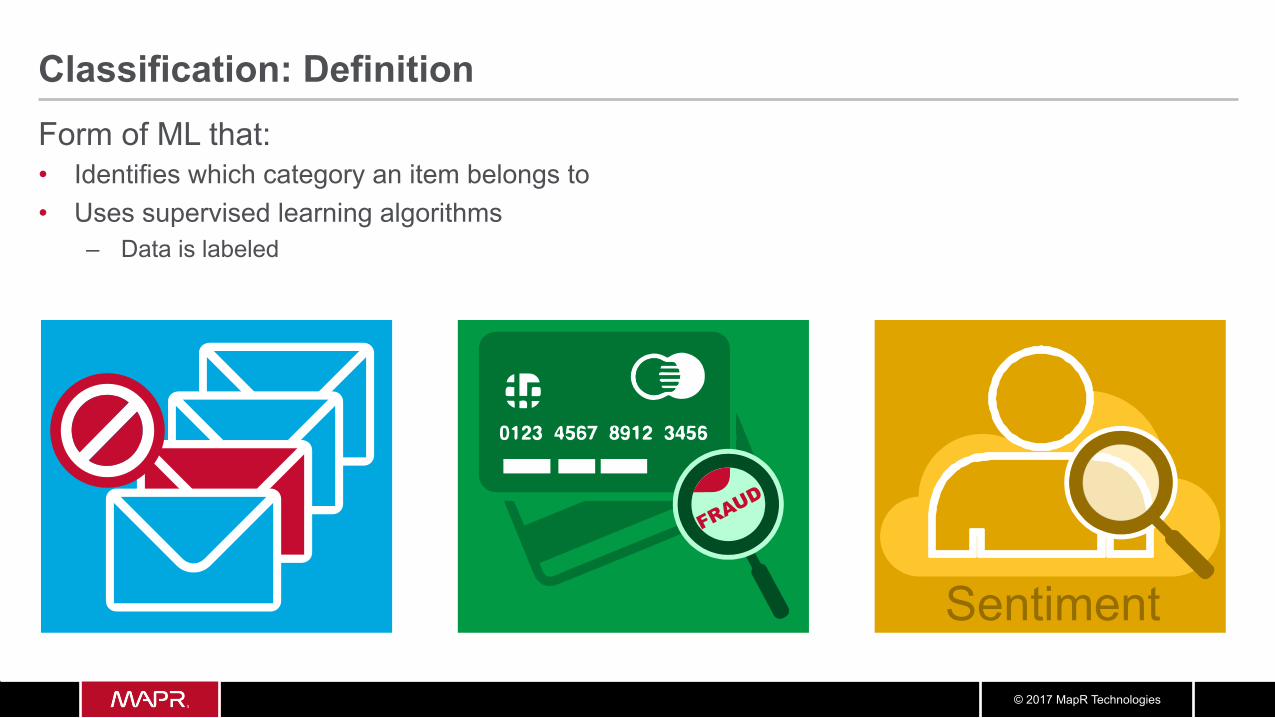
Classification: Definition Form of ML that: • Identifies which category an item belongs to • Uses supervised learning algorithms
– Data is labeled
Sentiment
© 2017 MapR Technologies
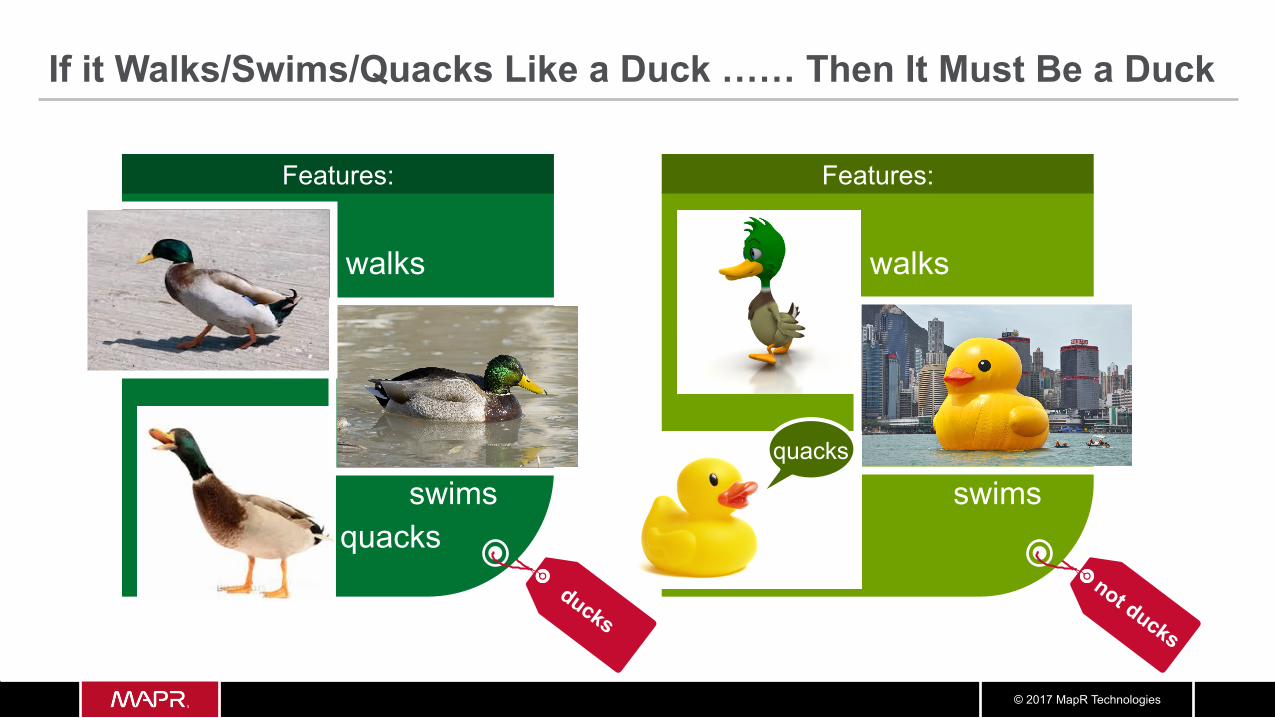
If it Walks/Swims/Quacks Like a Duck …… Then It Must Be a Duck
swims
walks
quacks
Features:
walks
quacks swims
Features:
© 2017 MapR Technologies
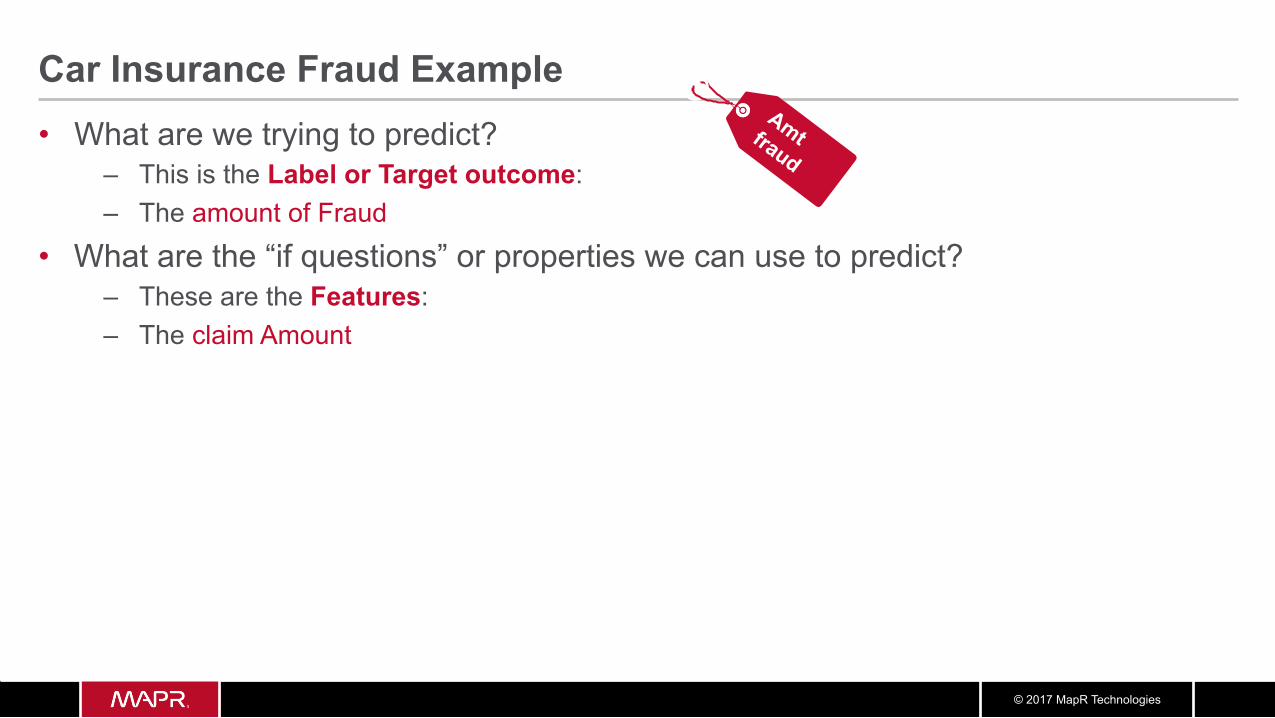
Car Insurance Fraud Example • What are we trying to predict?
– This is the Label or Target outcome: – The amount of Fraud
• What are the “if questions” or properties we can use to predict? – These are the Features: – The claim Amount
© 2017 MapR Technologies
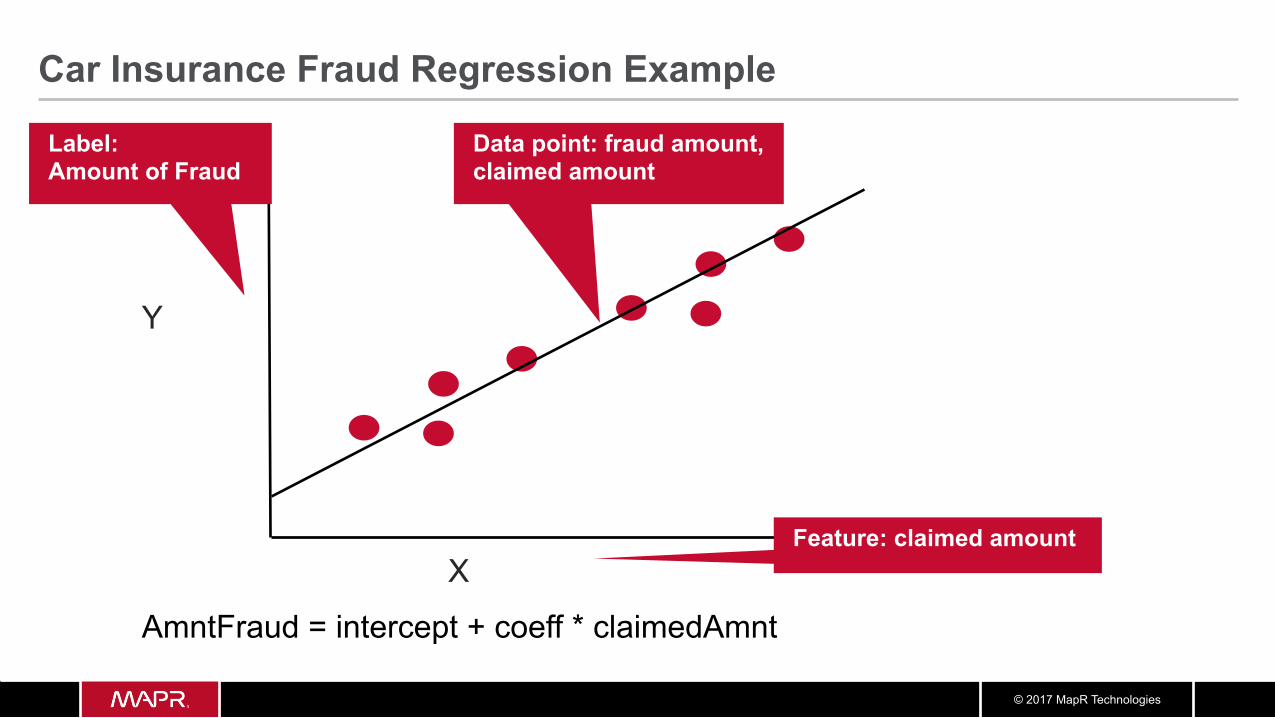
Label: Amount of Fraud
Y
X Feature: claimed amount
Data point: fraud amount, claimed amount
AmntFraud = intercept + coeff * claimedAmnt
Car Insurance Fraud Regression Example
© 2017 MapR Technologies
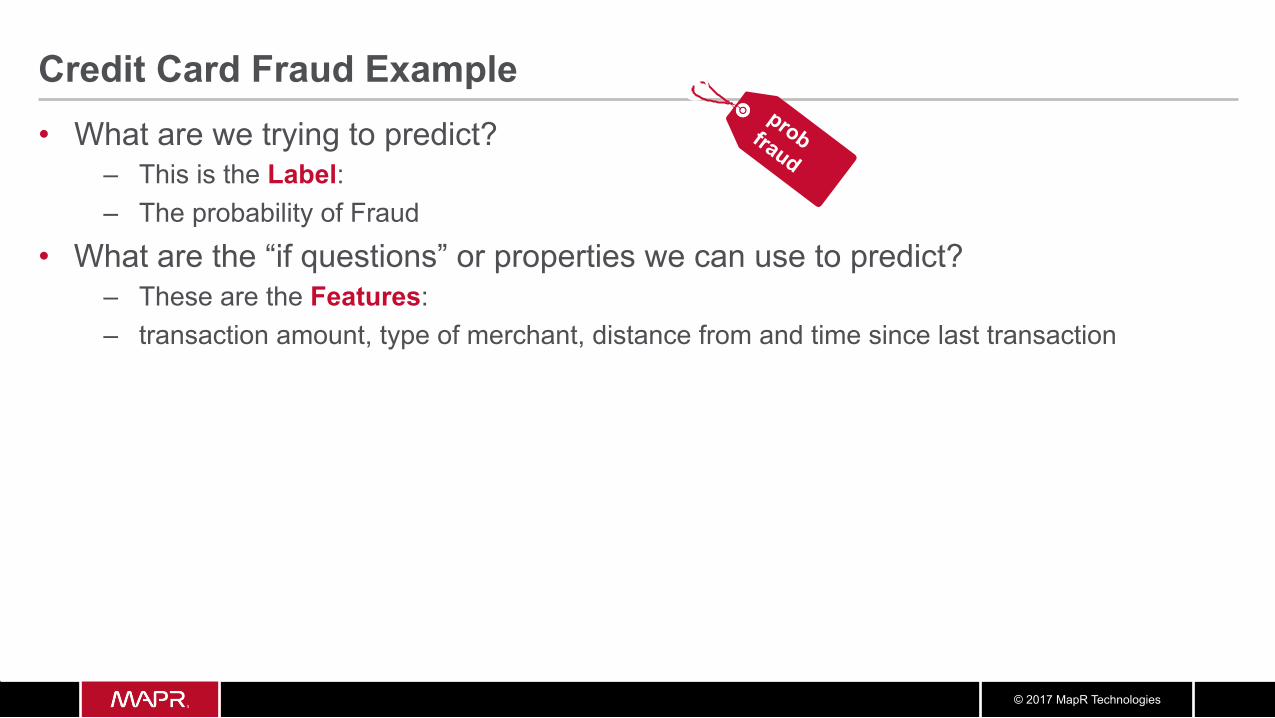
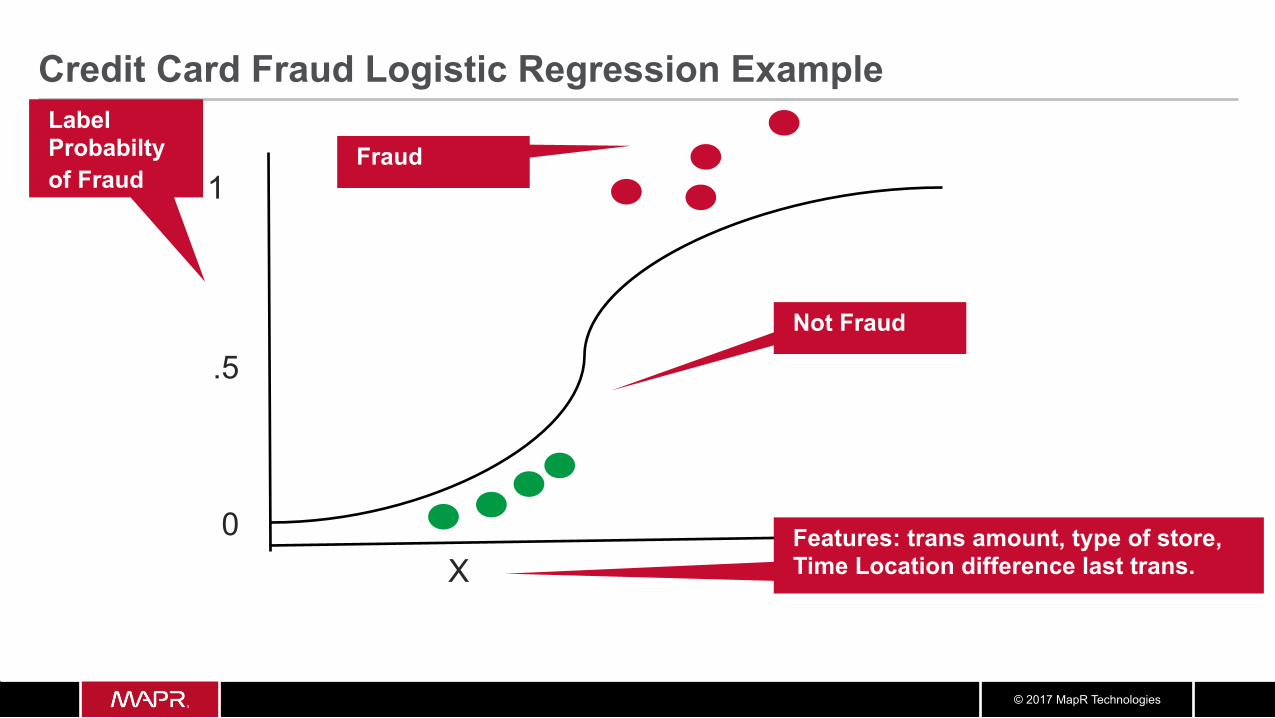
Credit Card Fraud Example • What are we trying to predict?
– This is the Label: – The probability of Fraud
• What are the “if questions” or properties we can use to predict? – These are the Features: – transaction amount, type of merchant, distance from and time since last transaction
© 2017 MapR Technologies
Label Probabilty of Fraud
1
X Features: trans amount, type of store, Time Location difference last trans.
Fraud
0
Not Fraud .5
Credit Card Fraud Logistic Regression Example
© 2017 MapR Technologies
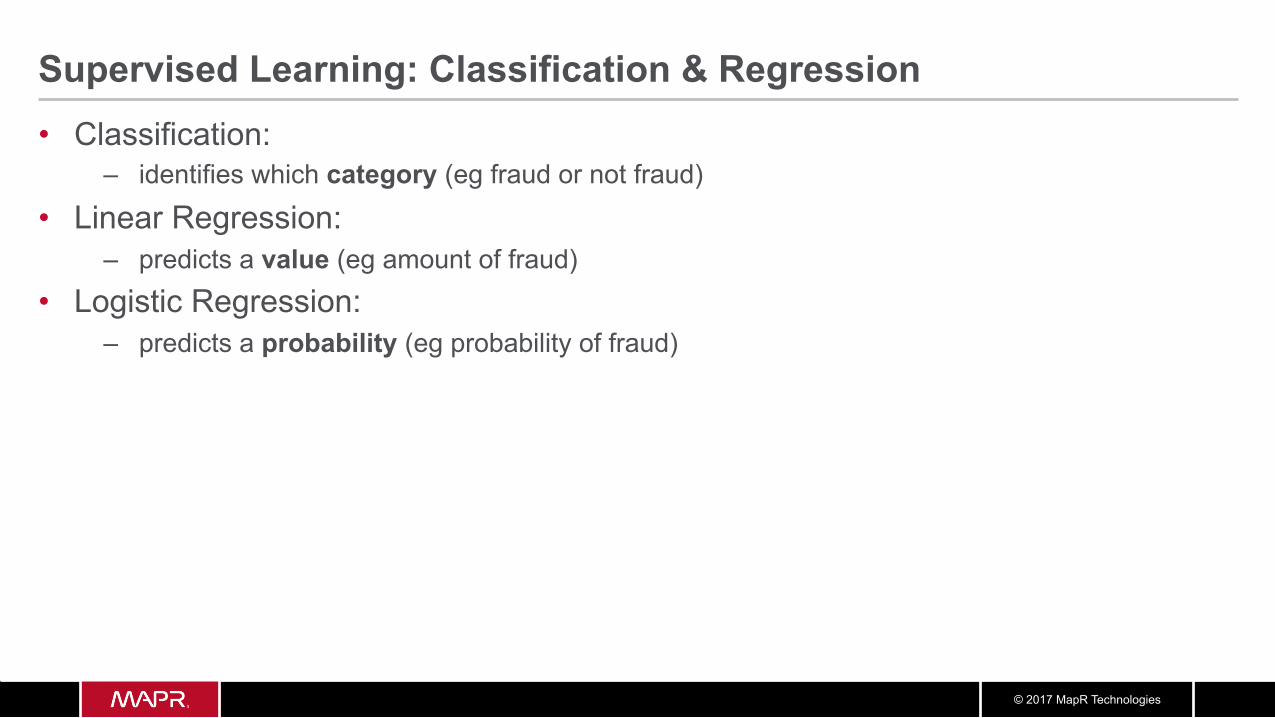
Supervised Learning: Classification & Regression • Classification:
– identifies which category (eg fraud or not fraud)
• Linear Regression: – predicts a value (eg amount of fraud)
• Logistic Regression: – predicts a probability (eg probability of fraud)
© 2017 MapR Technologies
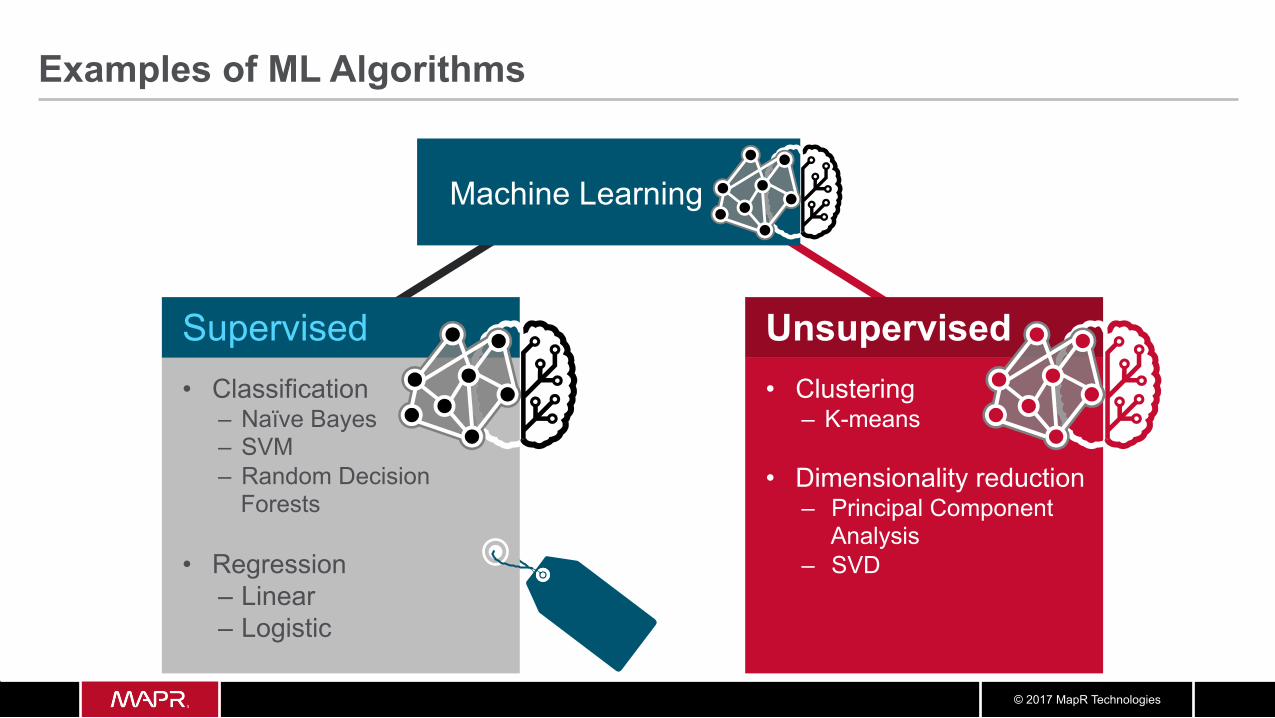
Examples of ML Algorithms
Machine Learning
Unsupervised • Clustering
– K-means
• Dimensionality reduction – Principal Component
Analysis – SVD
Supervised • Classification
– Naïve Bayes – SVM – Random Decision
Forests
• Regression – Linear – Logistic
© 2017 MapR Technologies
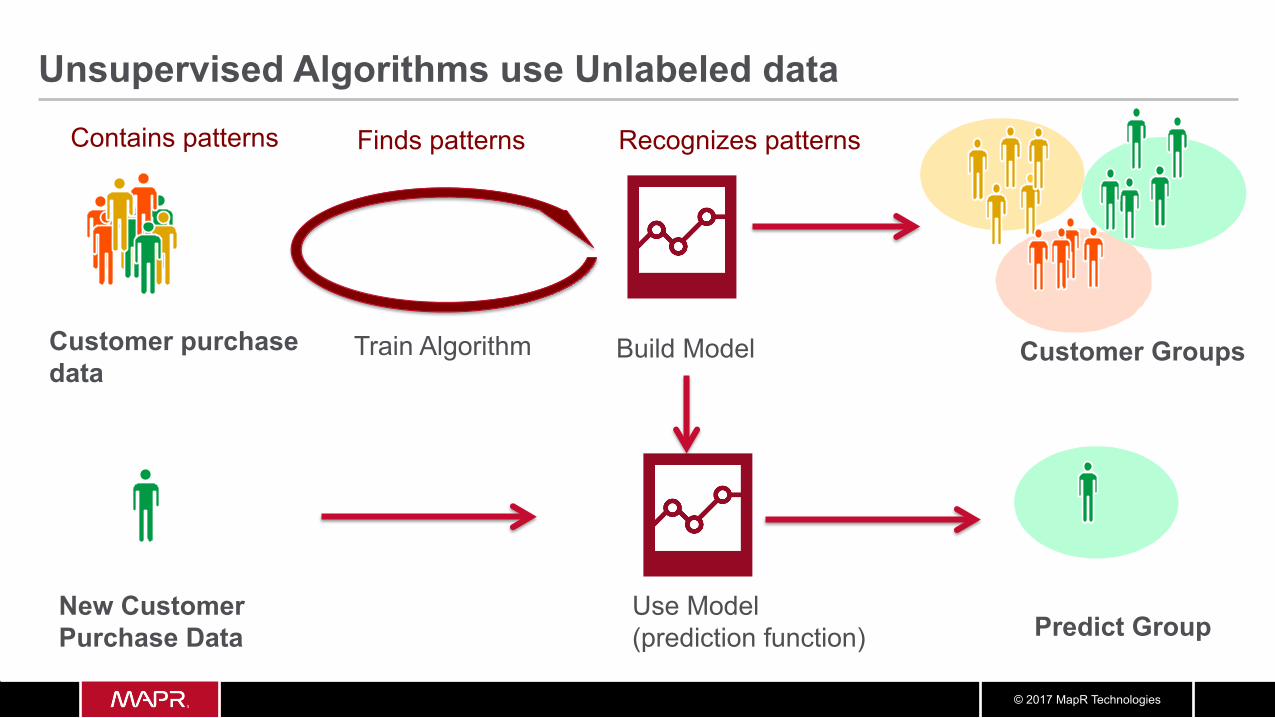
Unsupervised Algorithms use Unlabeled data
Customer Groups Build Model Train Algorithm
Finds patterns
New Customer Purchase Data
Use Model (prediction function) Predict Group
Contains patterns Recognizes patterns
Customer purchase data
© 2017 MapR Technologies
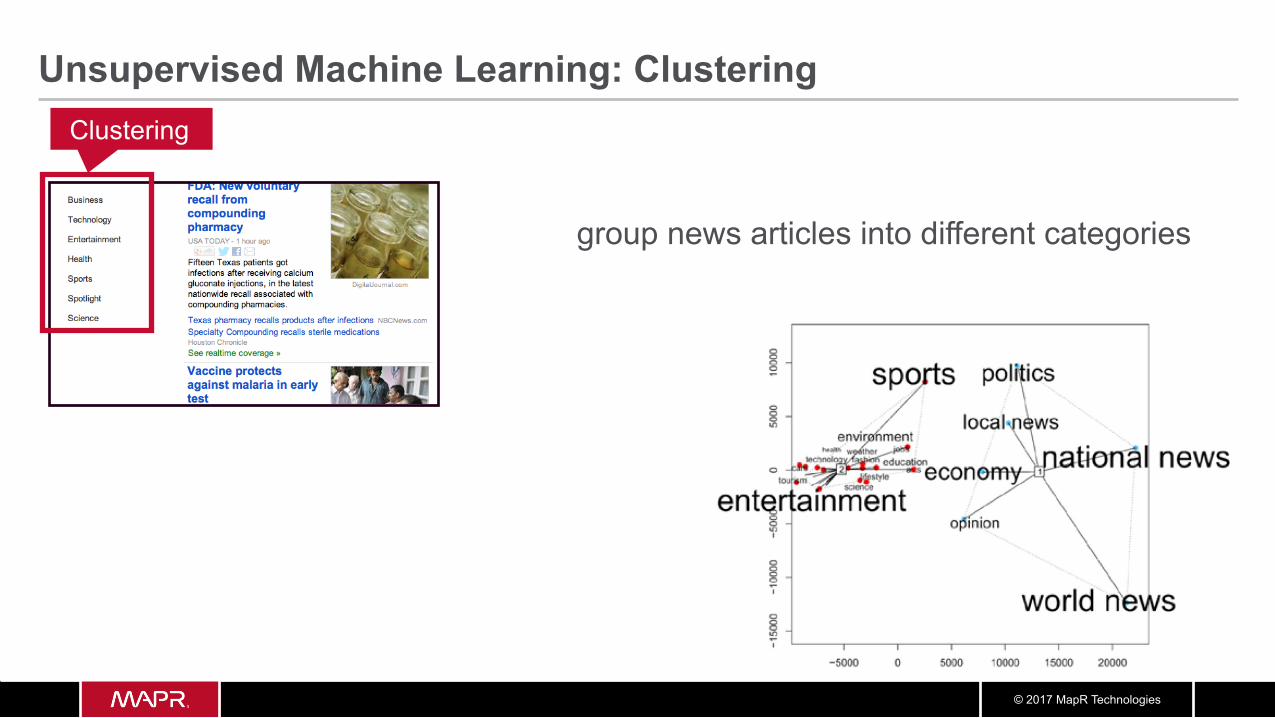
Unsupervised Machine Learning: Clustering Clustering
group news articles into different categories
© 2017 MapR Technologies
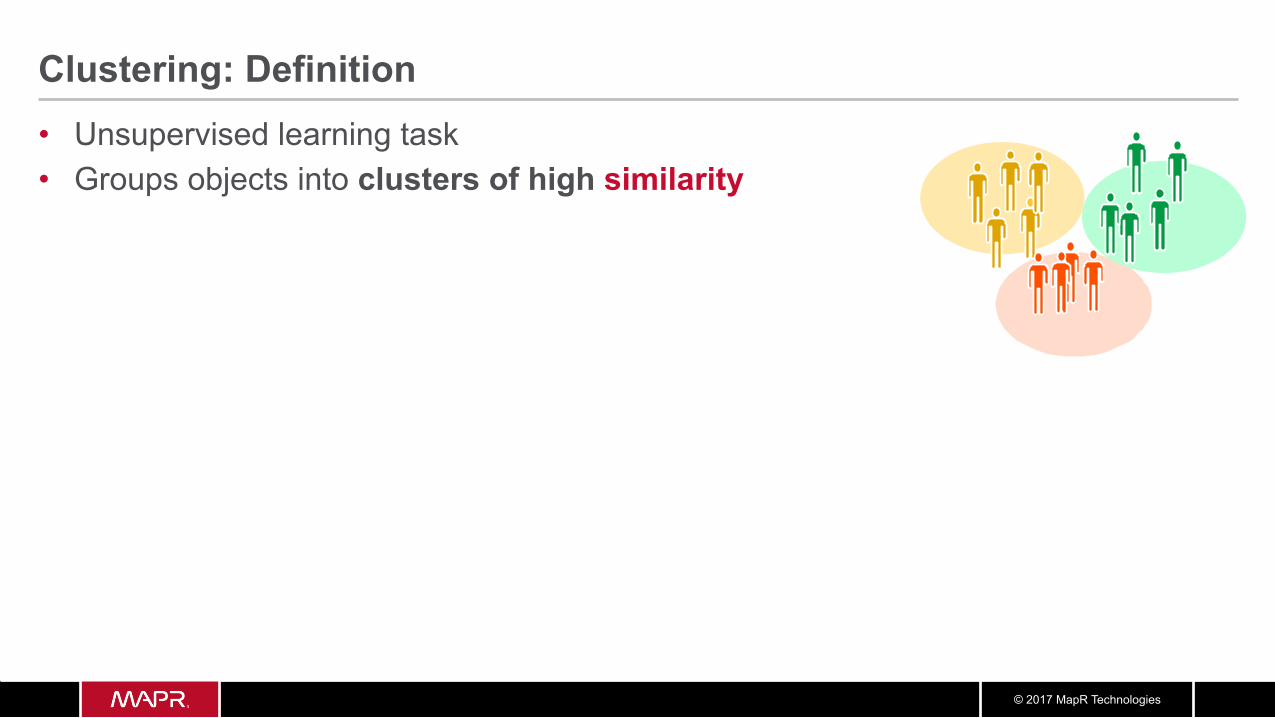
Clustering: Definition • Unsupervised learning task • Groups objects into clusters of high similarity
© 2017 MapR Technologies
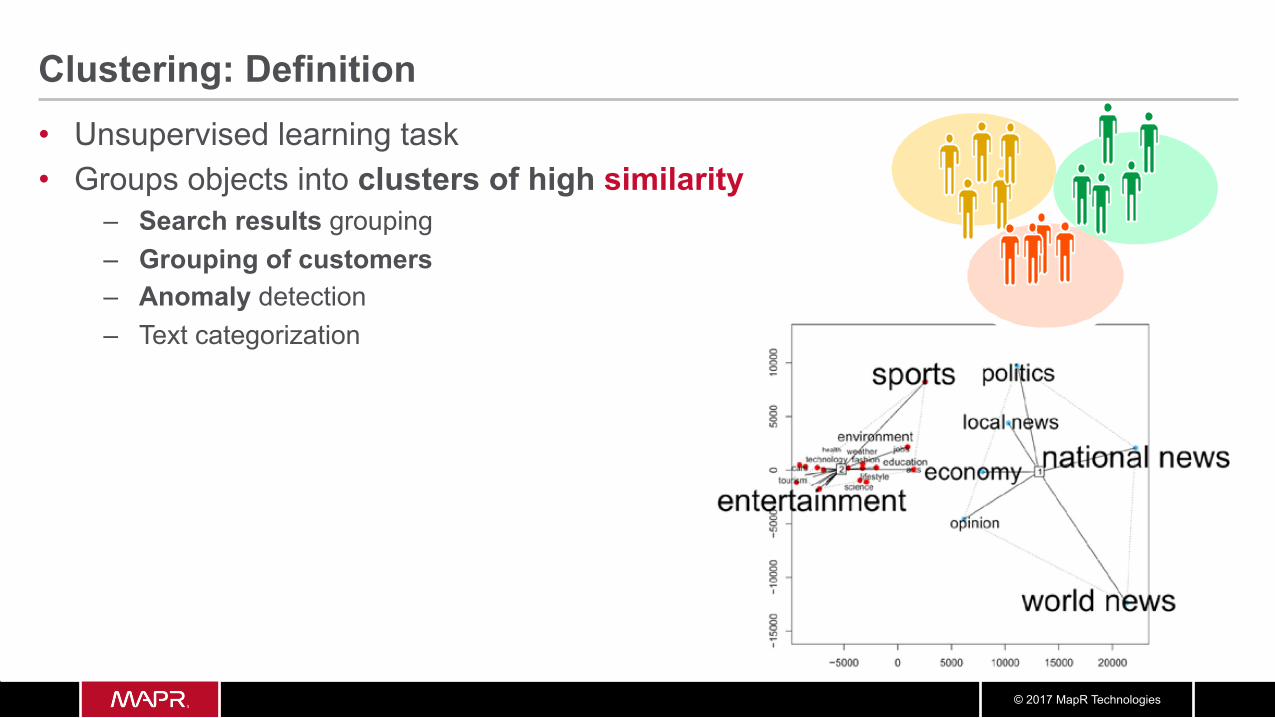
Clustering: Definition • Unsupervised learning task • Groups objects into clusters of high similarity
– Search results grouping – Grouping of customers – Anomaly detection – Text categorization
© 2017 MapR Technologies
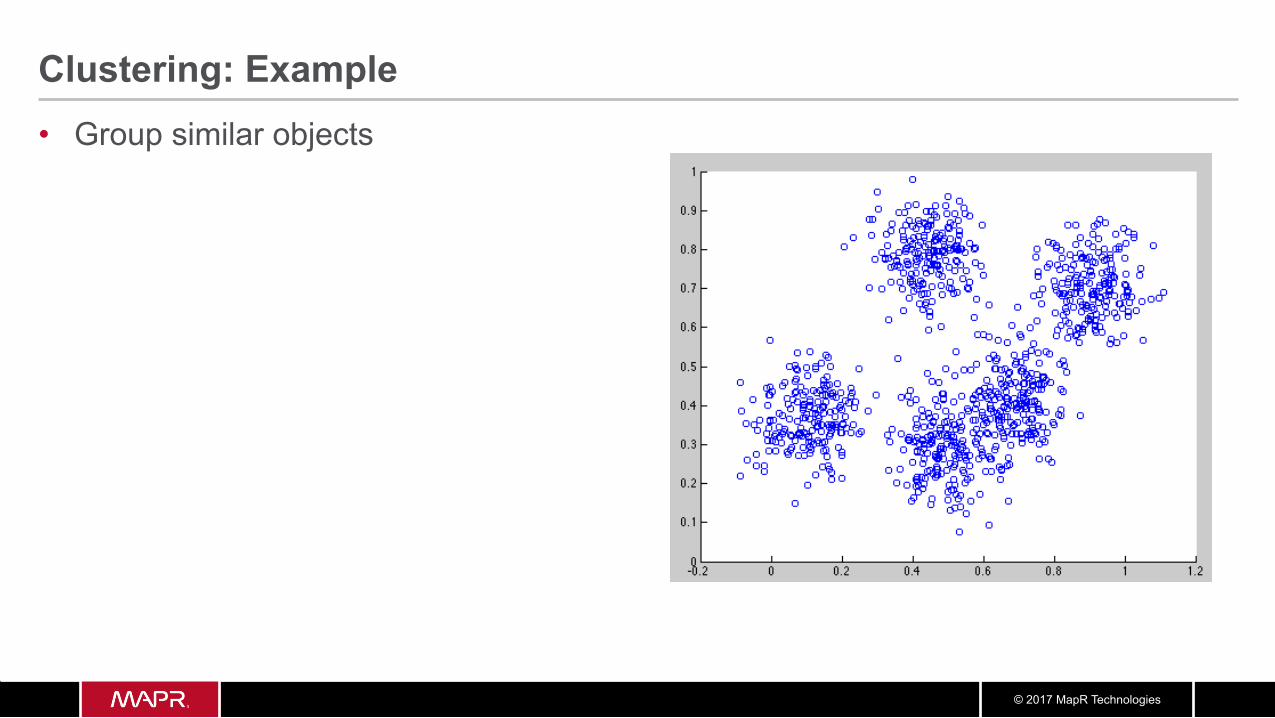
Clustering: Example • Group similar objects
© 2017 MapR Technologies
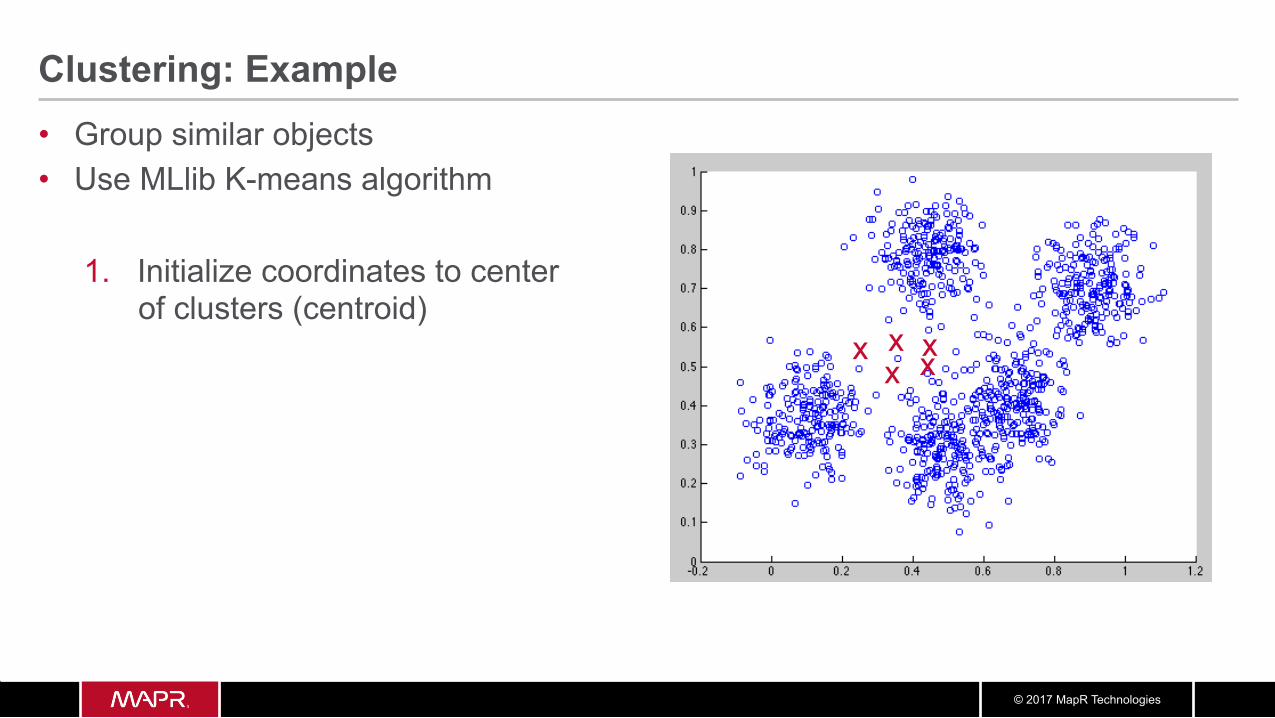
Clustering: Example • Group similar objects • Use MLlib K-means algorithm
1. Initialize coordinates to center of clusters (centroid)
x x x
x x
© 2017 MapR Technologies
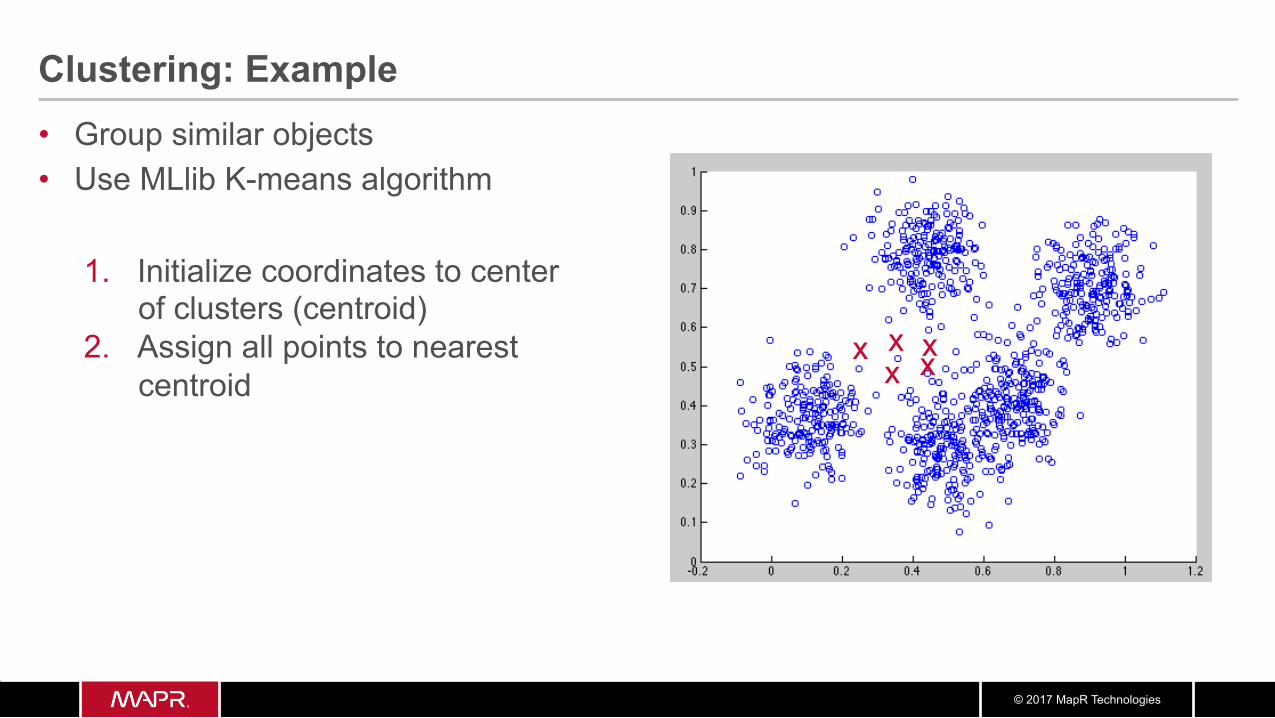
Clustering: Example • Group similar objects • Use MLlib K-means algorithm
1. Initialize coordinates to center of clusters (centroid)
2. Assign all points to nearest centroid
x x x
x x
© 2017 MapR Technologies
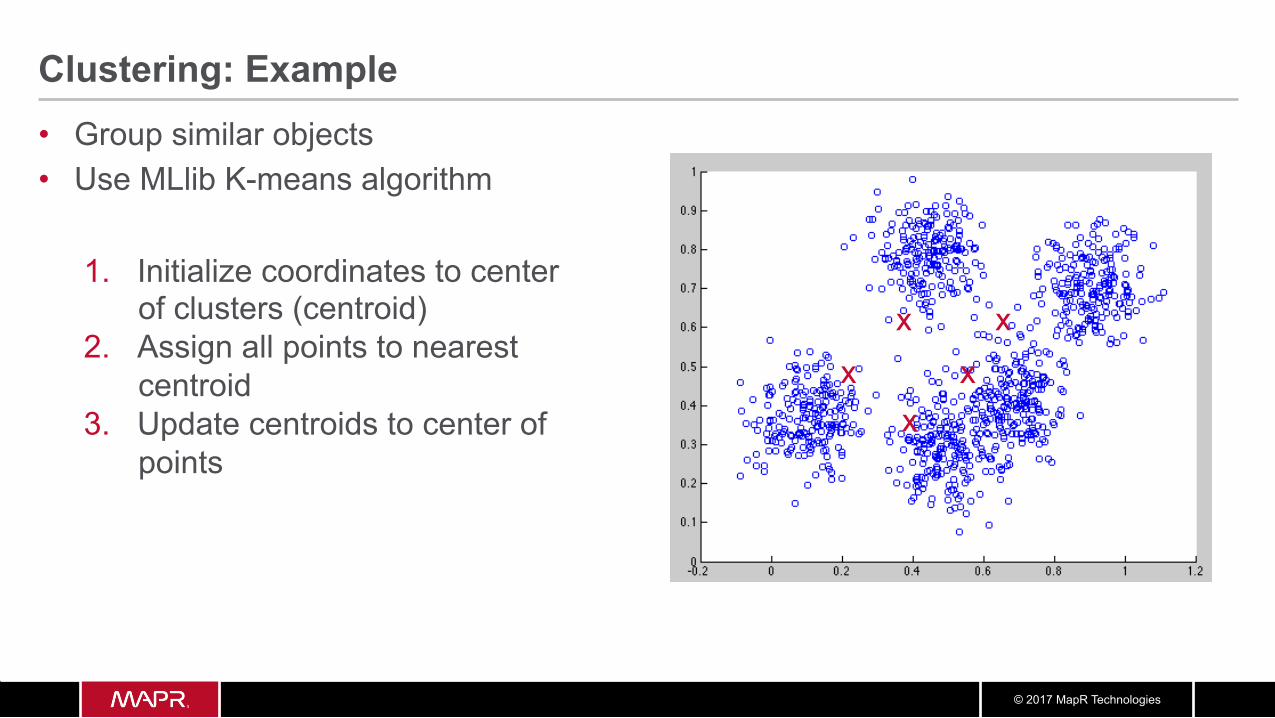
Clustering: Example • Group similar objects • Use MLlib K-means algorithm
1. Initialize coordinates to center of clusters (centroid)
2. Assign all points to nearest centroid
3. Update centroids to center of points
x x
x x
x
© 2017 MapR Technologies
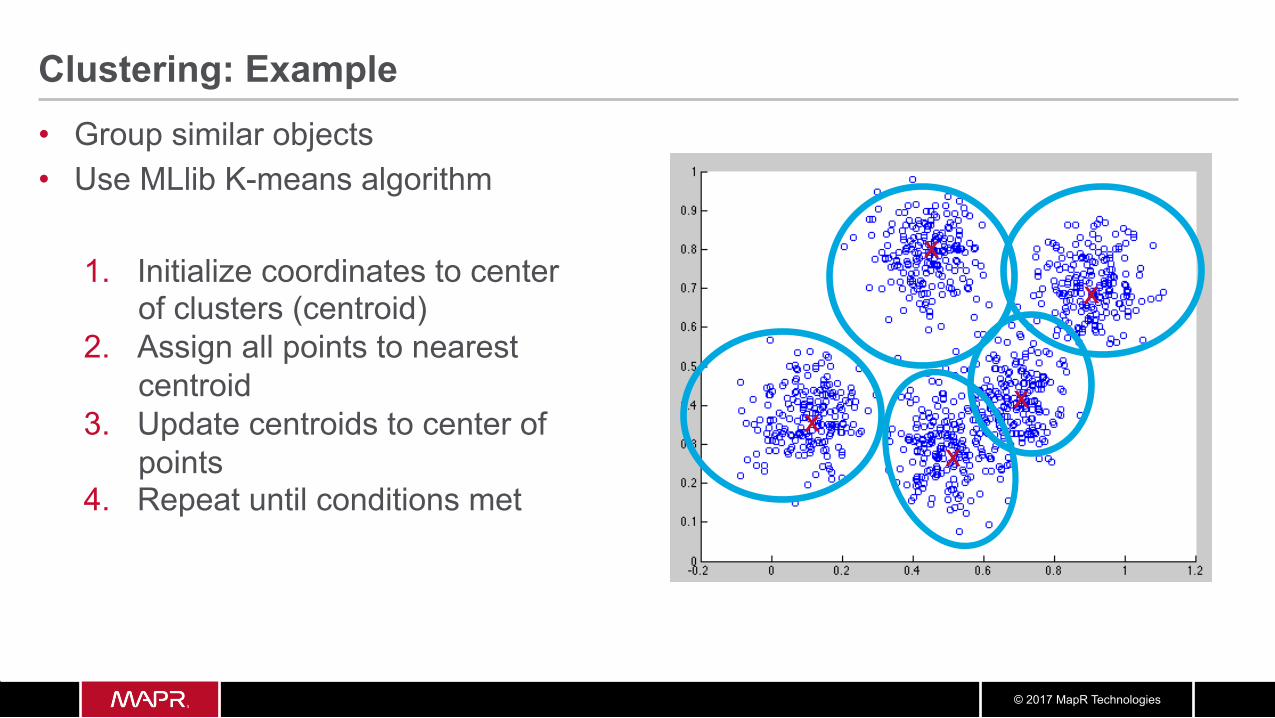
Clustering: Example • Group similar objects • Use MLlib K-means algorithm
1. Initialize coordinates to center of clusters (centroid)
2. Assign all points to nearest centroid
3. Update centroids to center of points
4. Repeat until conditions met
x x
x
x
x

© 2017 MapR Technologies
Predict Churn
© 2017 MapR Technologies
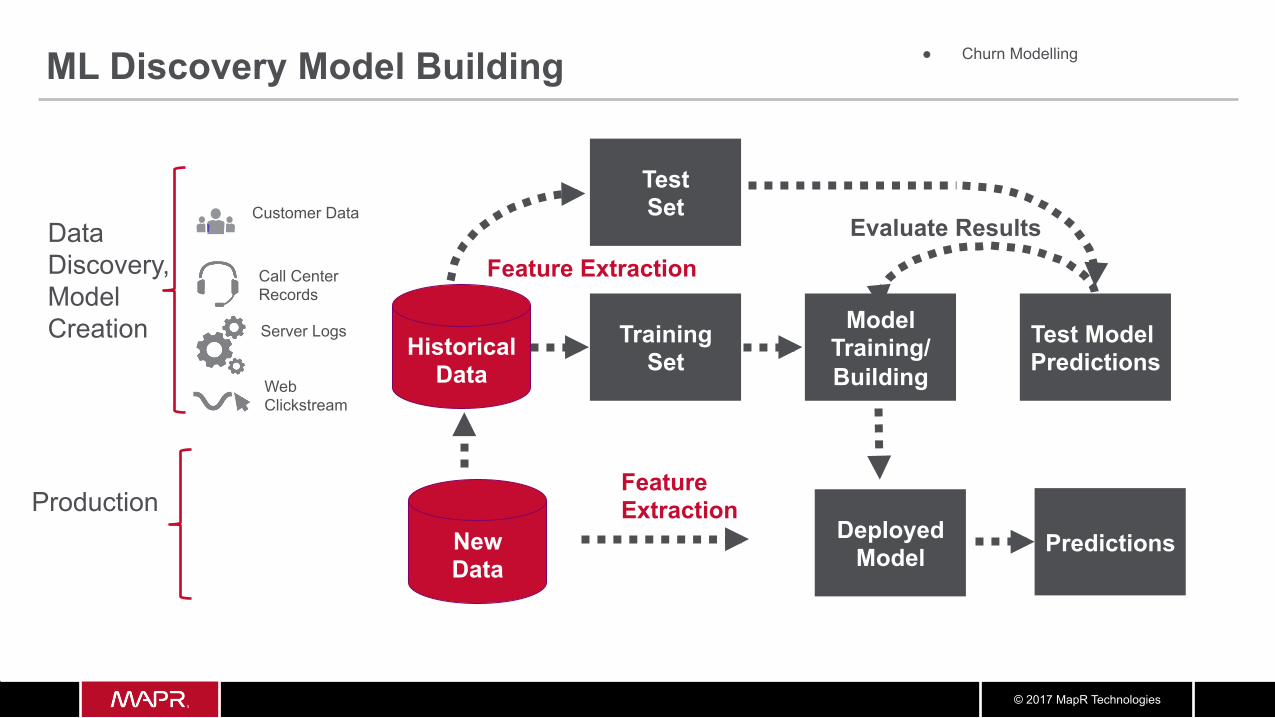
ML Discovery Model Building
Model Training/ Building
Training Set
Test Model Predictions
Test Set
Evaluate Results
Historical Data
Deployed Model Predictions
Data Discovery, Model Creation
Production
Feature Extraction
Feature Extraction
New Data
Customer Data
Call Center Records
Web Clickstream
Server Logs
● Churn Modelling
© 2017 MapR Technologies
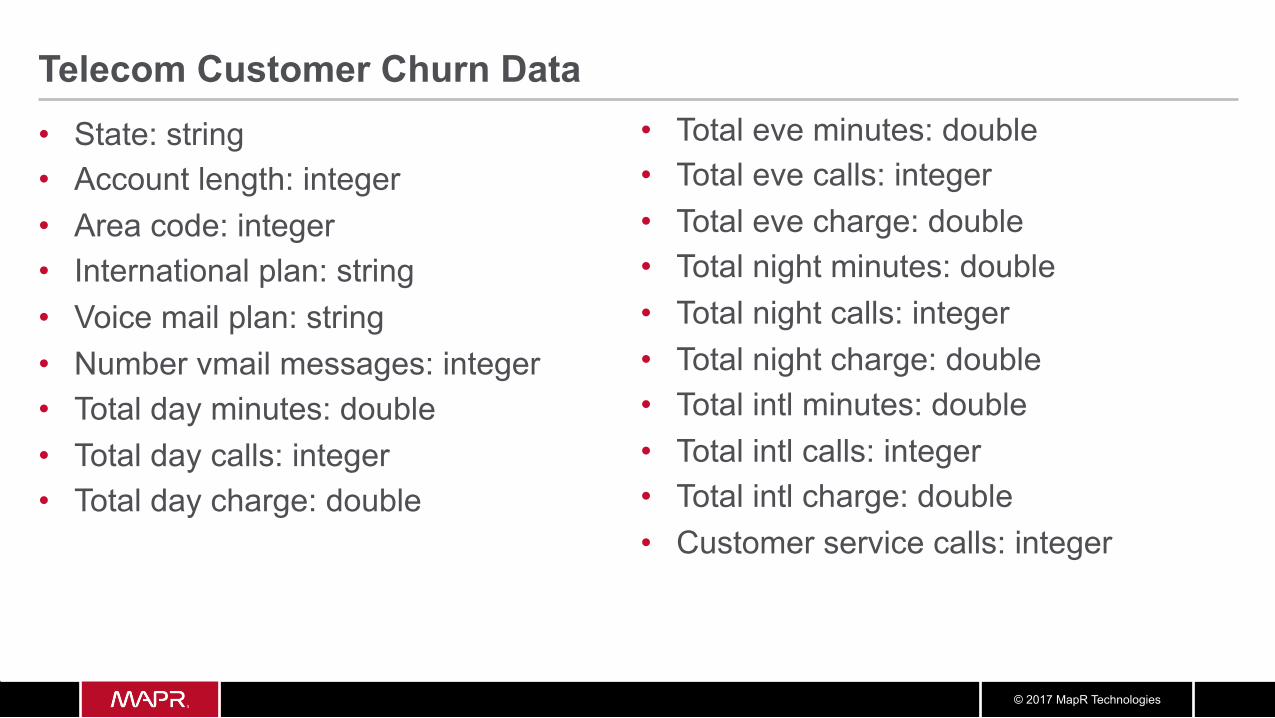
Telecom Customer Churn Data • State: string • Account length: integer • Area code: integer • International plan: string • Voice mail plan: string • Number vmail messages: integer • Total day minutes: double • Total day calls: integer • Total day charge: double
• Total eve minutes: double • Total eve calls: integer • Total eve charge: double • Total night minutes: double • Total night calls: integer • Total night charge: double • Total intl minutes: double • Total intl calls: integer • Total intl charge: double • Customer service calls: integer
© 2017 MapR Technologies
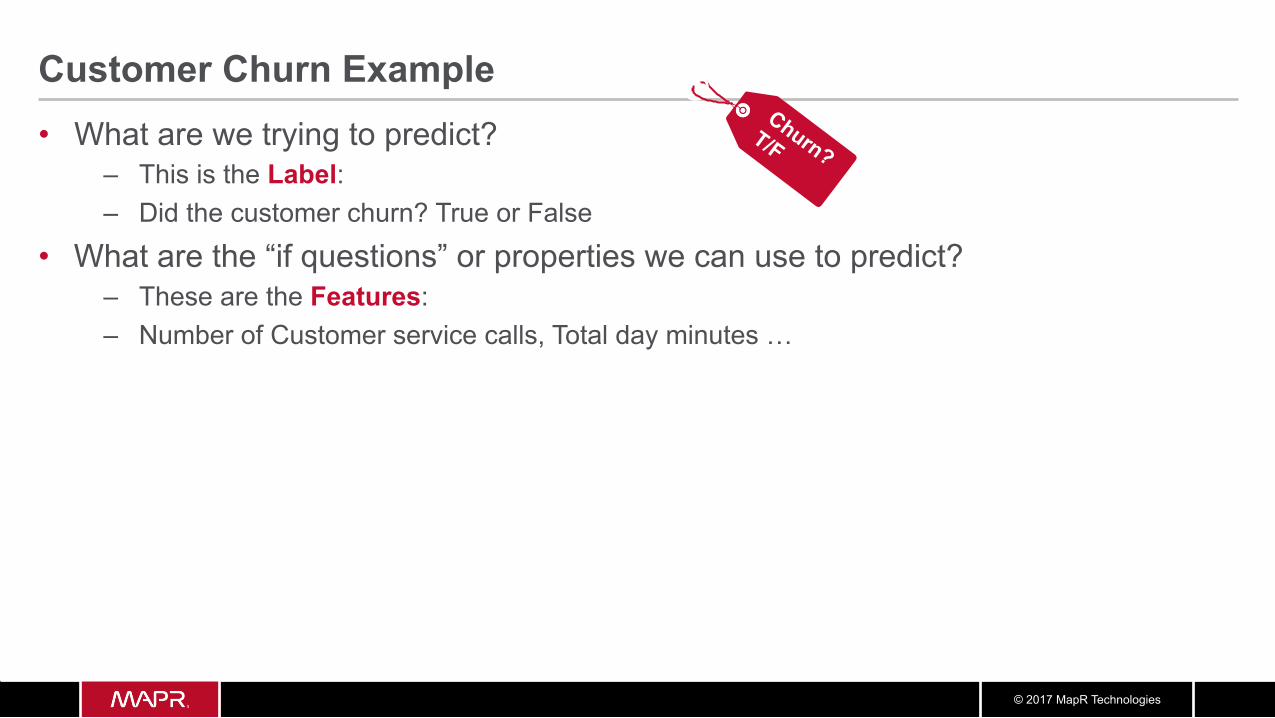
Customer Churn Example • What are we trying to predict?
– This is the Label: – Did the customer churn? True or False
• What are the “if questions” or properties we can use to predict? – These are the Features: – Number of Customer service calls, Total day minutes …
© 2017 MapR Technologies
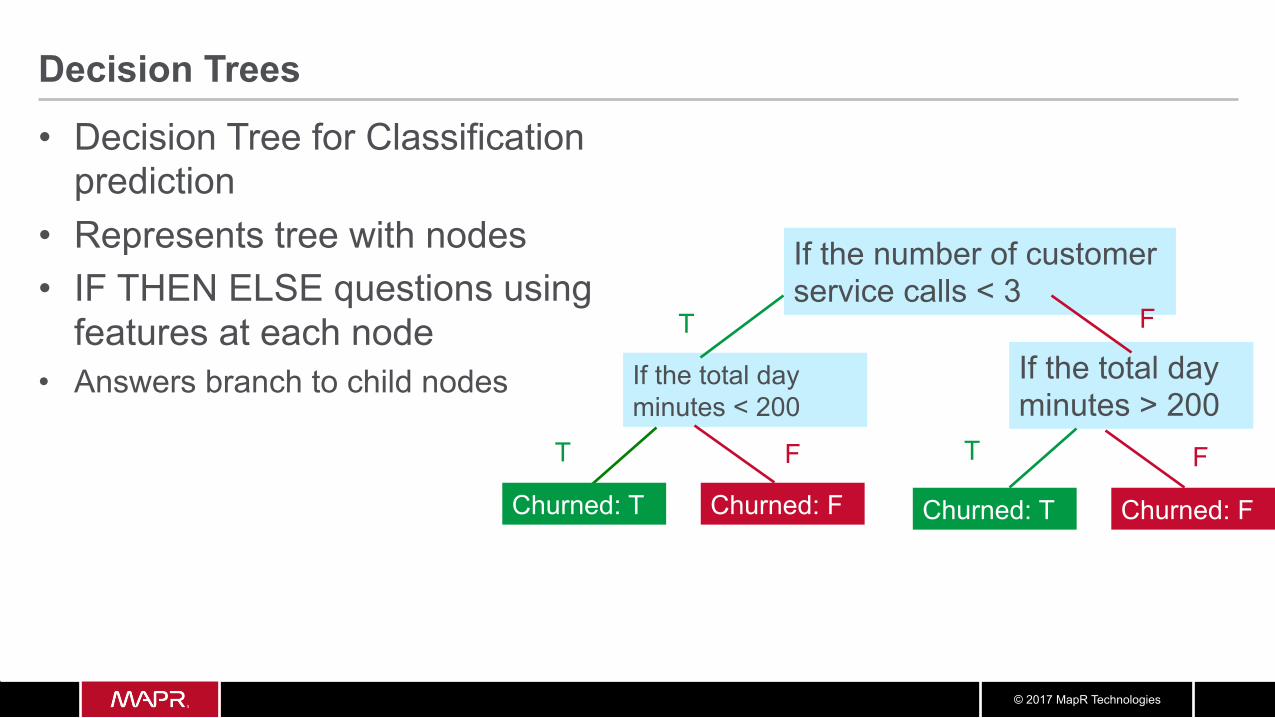
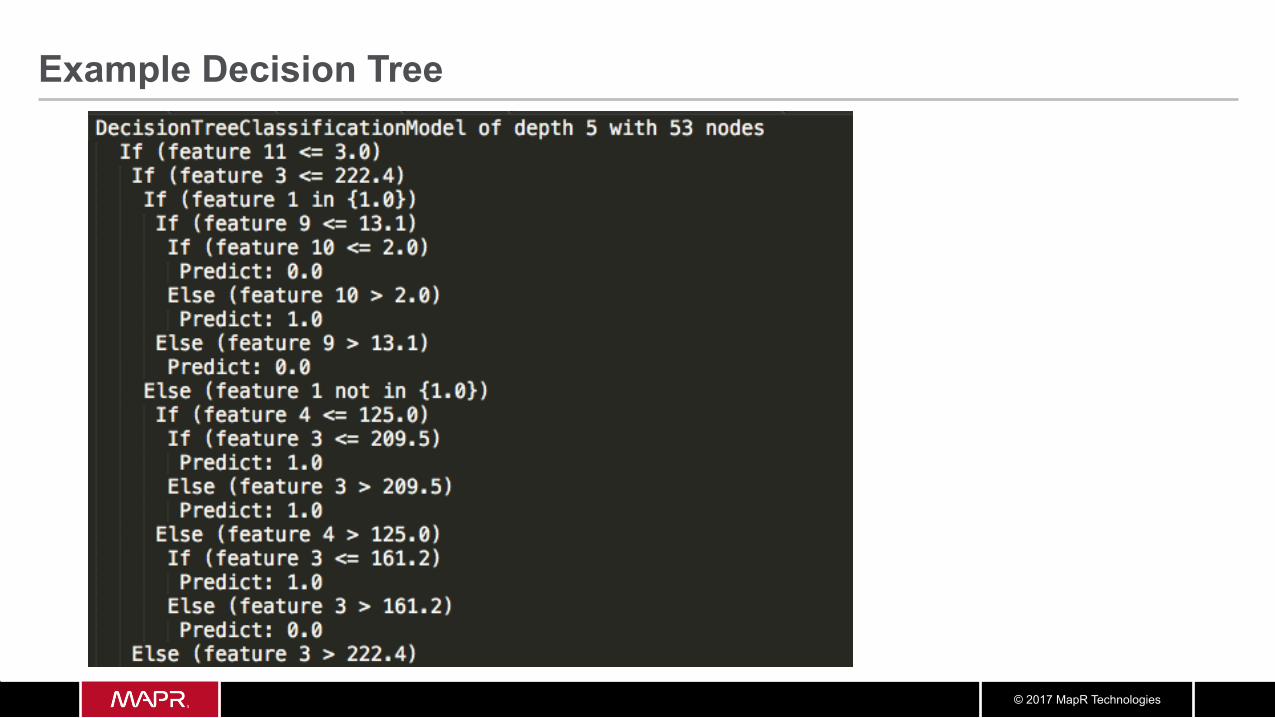
Decision Trees
• Decision Tree for Classification prediction
• Represents tree with nodes • IF THEN ELSE questions using
features at each node • Answers branch to child nodes
If the number of customer service calls < 3
If the total day minutes > 200
Churned: T
If the total day minutes < 200
Churned: F
T
Churned: T Churned: F
F
F F T T
© 2017 MapR Technologies
Example Decision Tree
© 2017 MapR Technologies
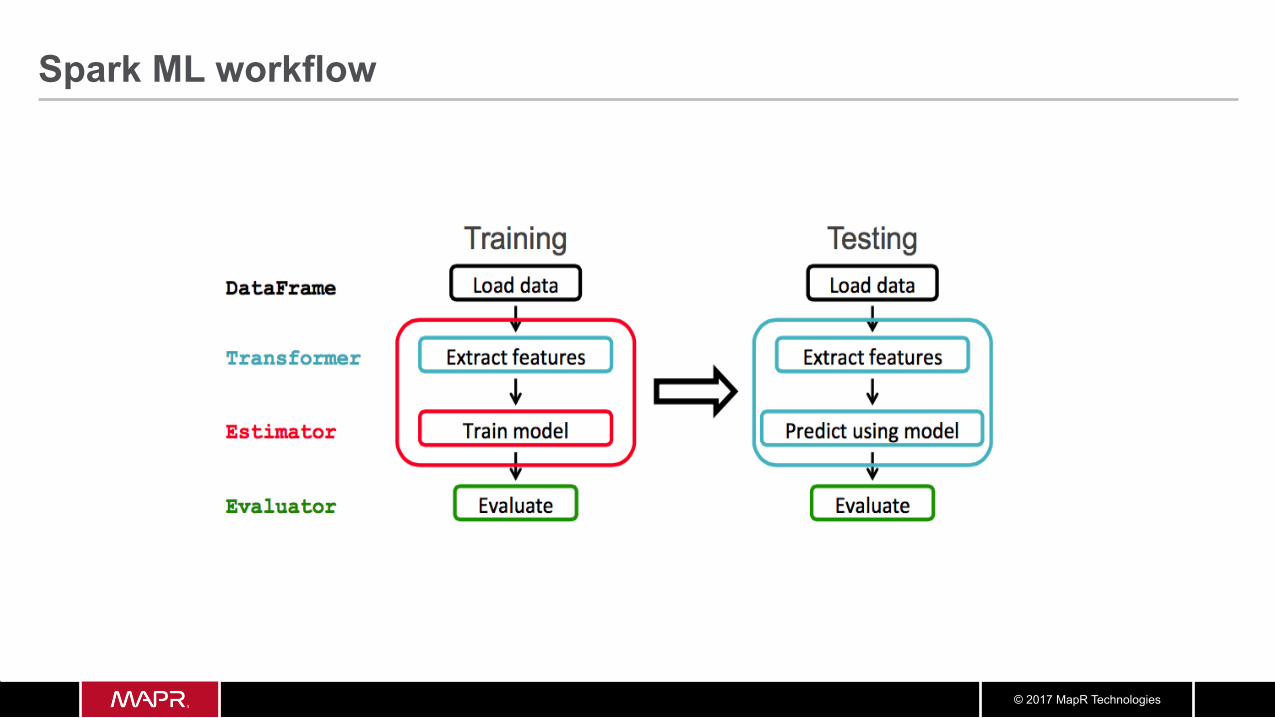
Spark ML workflow
© 2017 MapR Technologies
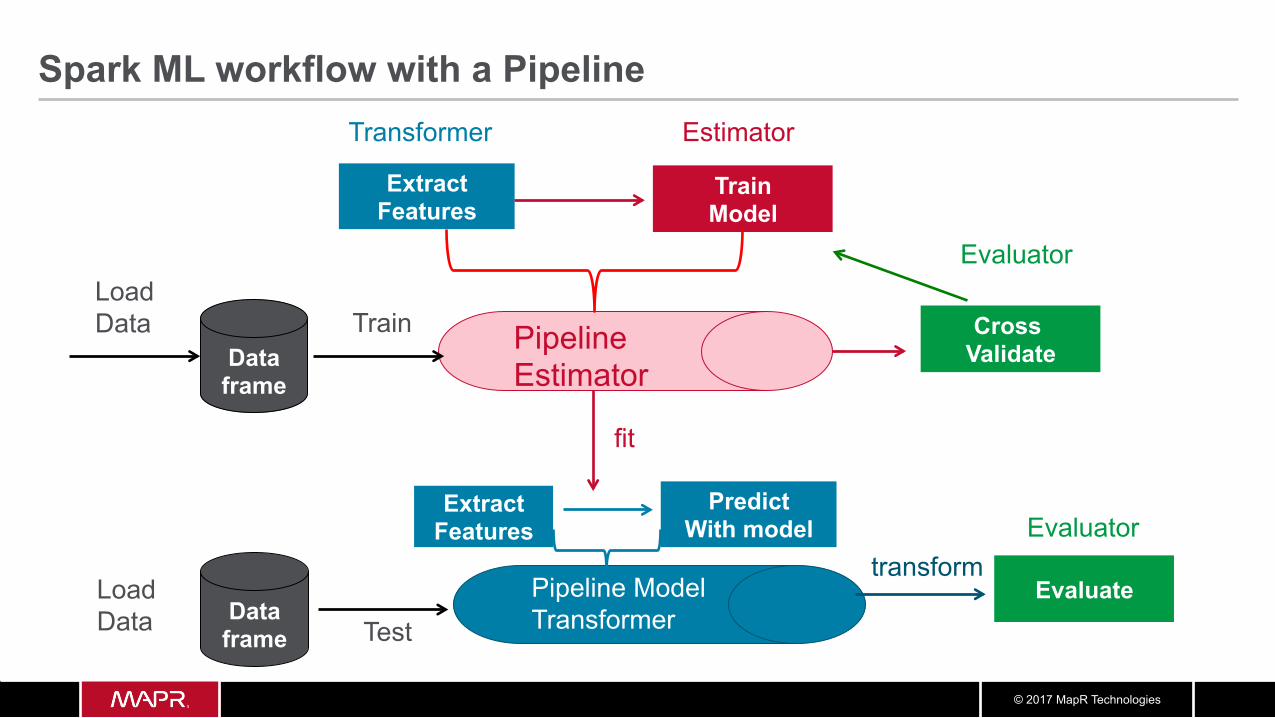
Spark ML workflow with a Pipeline
Pipeline Estimator
Extract Features
Load Data
Train Model
Estimator
Data frame
Transformer
Cross Validate
Pipeline Model Transformer Test
Data frame
Evaluate
fit
Train
Load Data
Evaluator
Predict With model
Extract Features Evaluator
transform
© 2017 MapR Technologies
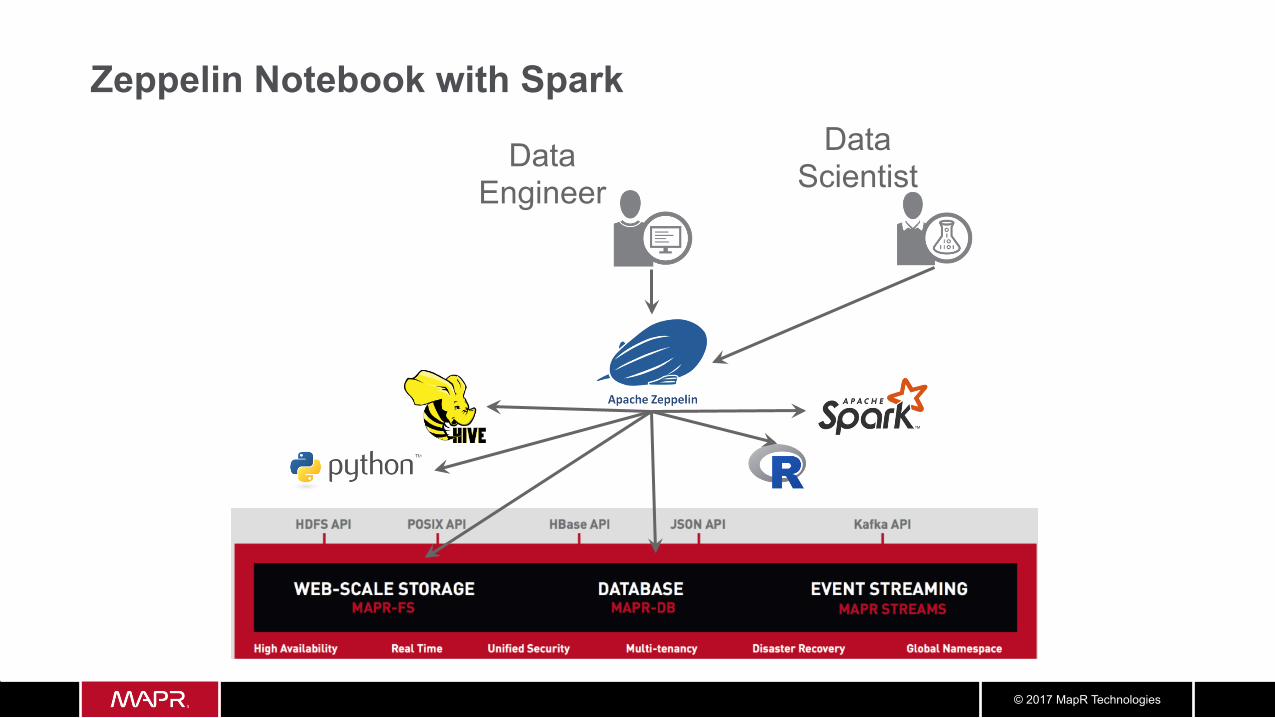
Zeppelin Notebook with Spark
Data Engineer
Data Scientist
© 2017 MapR Technologies
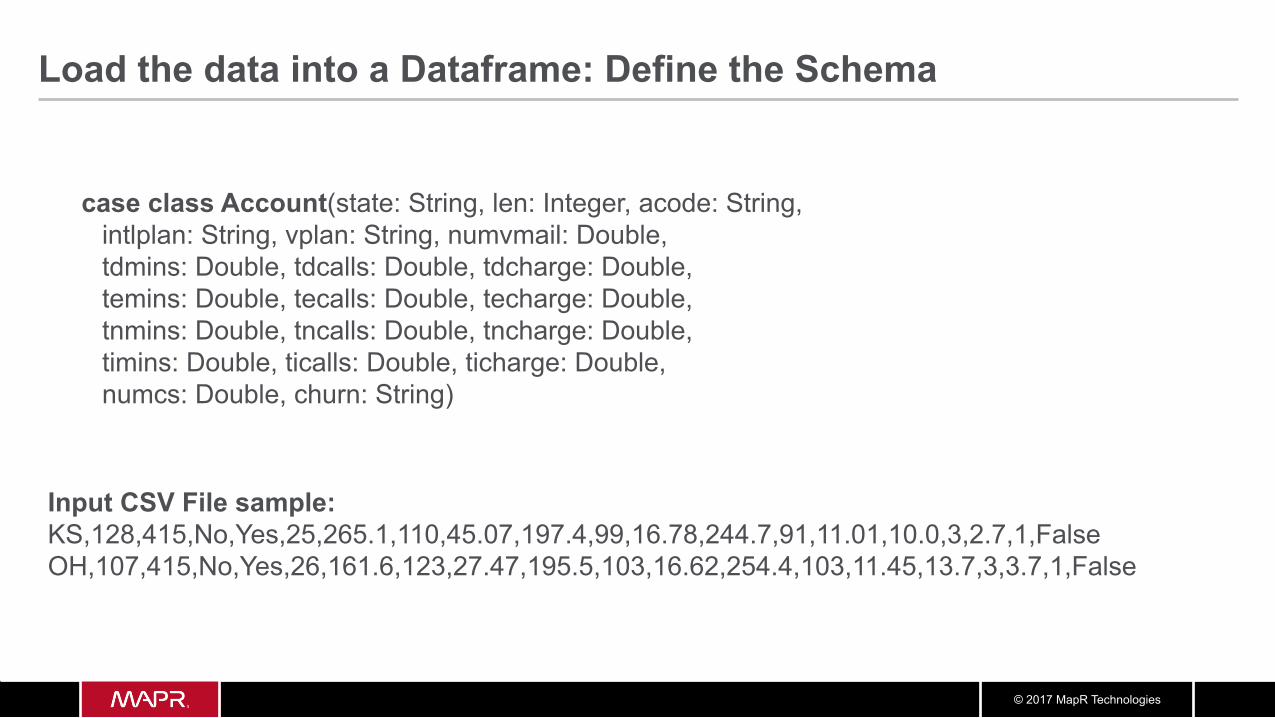
Load the data into a Dataframe: Define the Schema
case class Account(state: String, len: Integer, acode: String, intlplan: String, vplan: String, numvmail: Double, tdmins: Double, tdcalls: Double, tdcharge: Double, temins: Double, tecalls: Double, techarge: Double, tnmins: Double, tncalls: Double, tncharge: Double, timins: Double, ticalls: Double, ticharge: Double, numcs: Double, churn: String)
Input CSV File sample: KS,128,415,No,Yes,25,265.1,110,45.07,197.4,99,16.78,244.7,91,11.01,10.0,3,2.7,1,False OH,107,415,No,Yes,26,161.6,123,27.47,195.5,103,16.62,254.4,103,11.45,13.7,3,3.7,1,False
© 2017 MapR Technologies
Data Frame
Load data
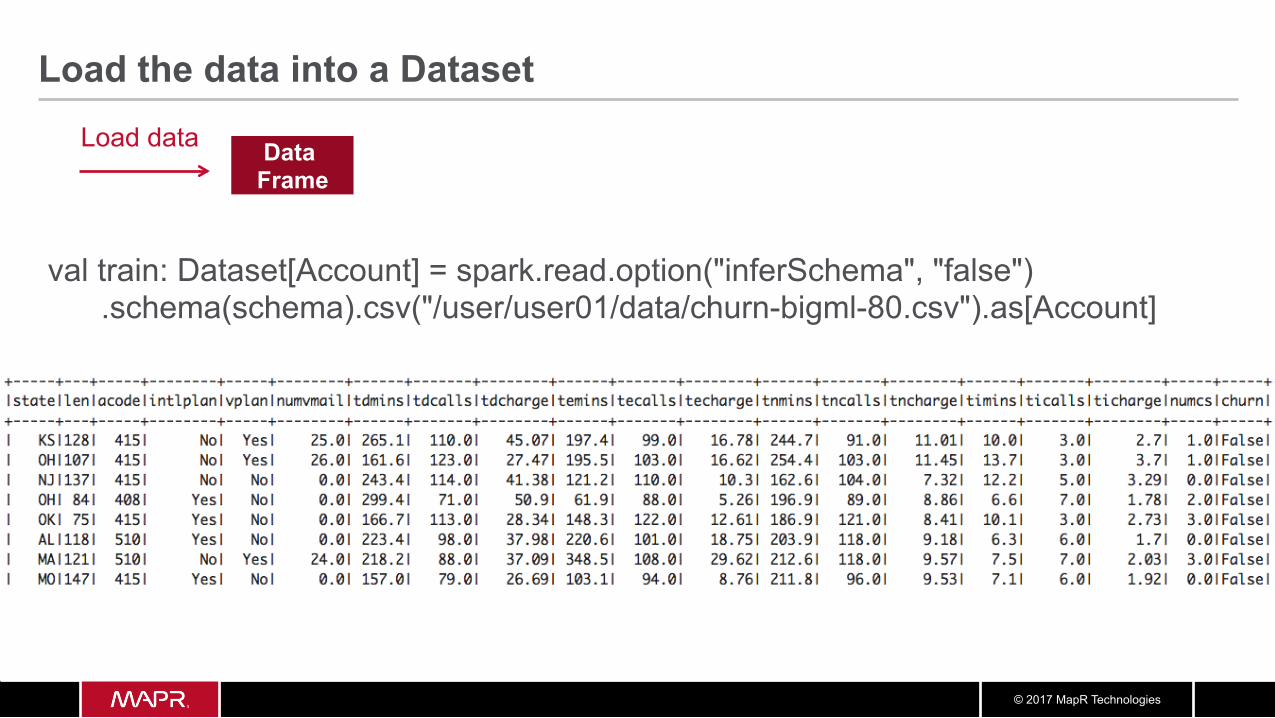
Load the data into a Dataset
val train: Dataset[Account] = spark.read.option("inferSchema", "false") .schema(schema).csv("/user/user01/data/churn-bigml-80.csv").as[Account]
© 2017 MapR Technologies
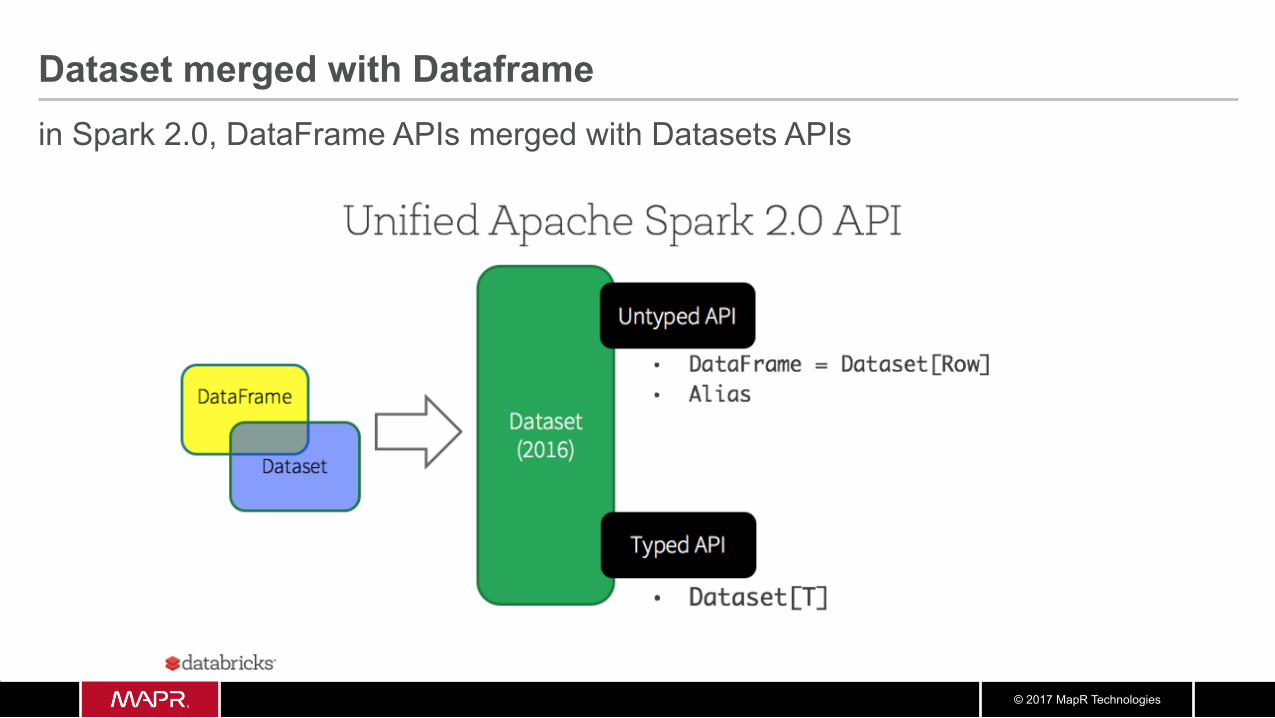
Dataset merged with Dataframe in Spark 2.0, DataFrame APIs merged with Datasets APIs
© 2017 MapR Technologies
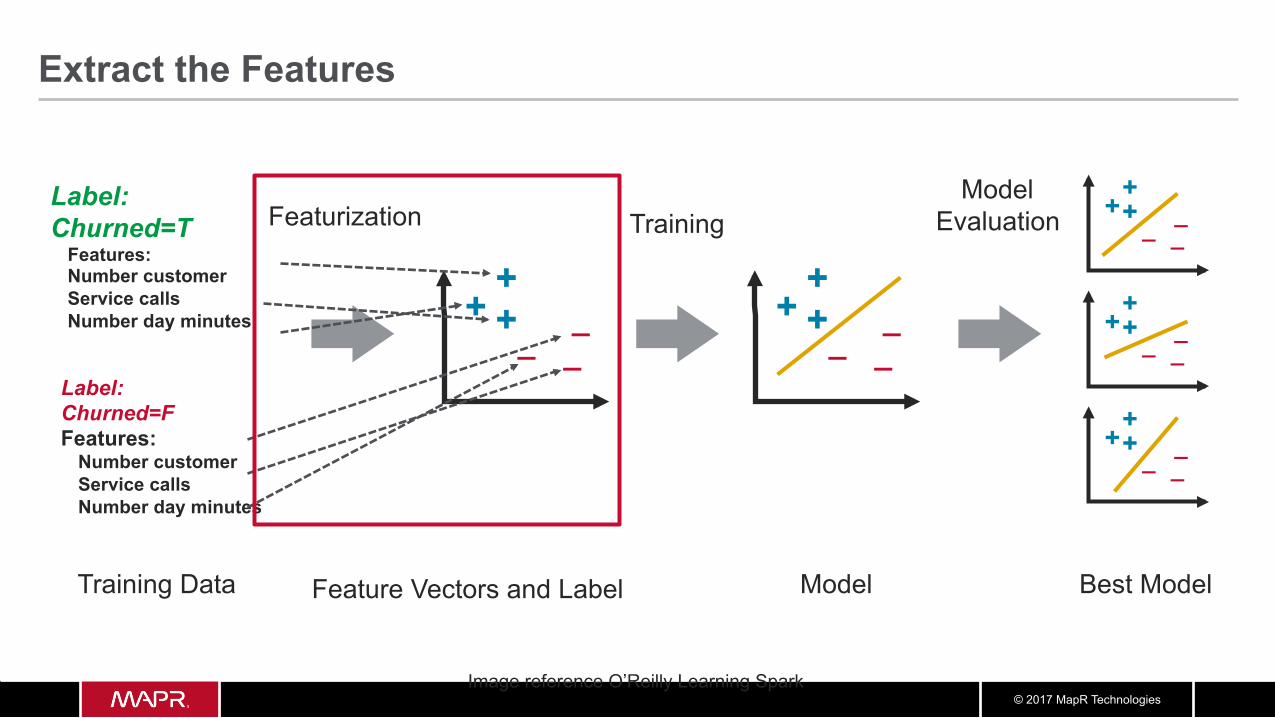
Extract the Features
Image reference O’Reilly Learning Spark
+ + +
Feature Vectors and Label Model
Featurization Training Model
Evaluation
Best Model
Label: Churned=T
Features: Number customer Service calls Number day minutes
Training Data
Label: Churned=F Features:
Number customer Service calls Number day minutes
+ + +
+ + +
+ + +
+ + +
© 2017 MapR Technologies
Data Frame
Add column
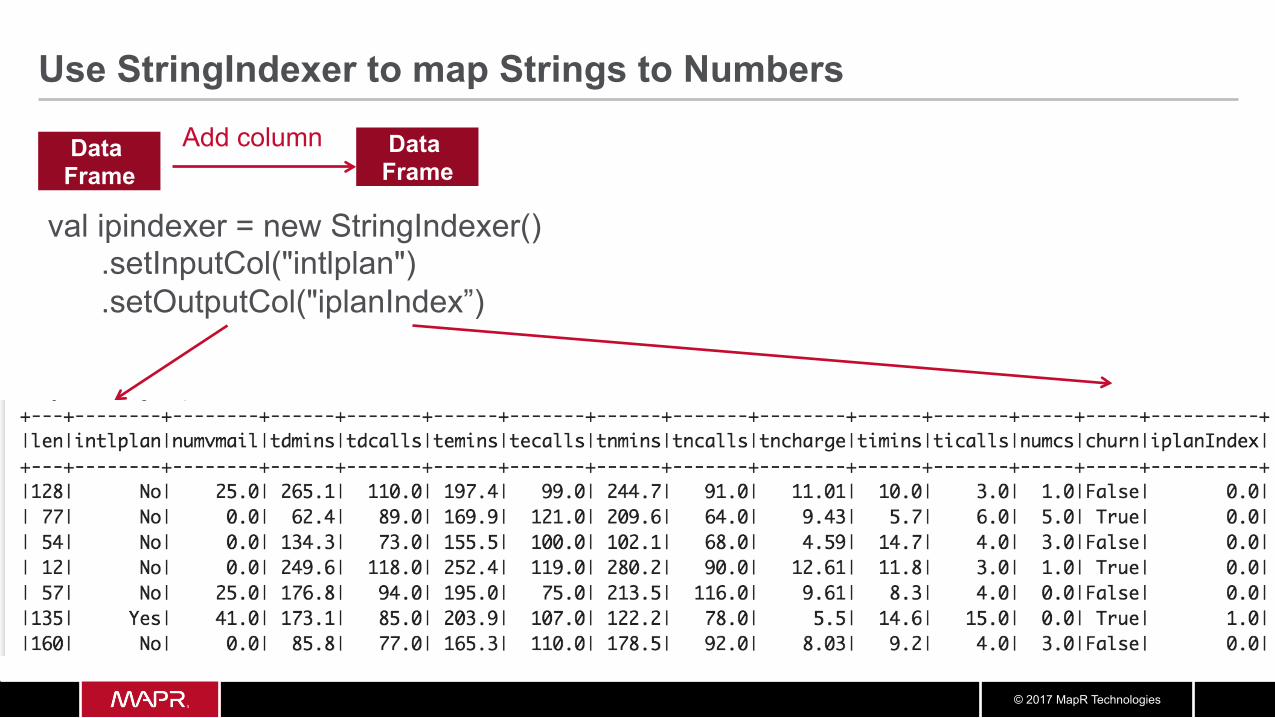
Use StringIndexer to map Strings to Numbers
val ipindexer = new StringIndexer() .setInputCol("intlplan") .setOutputCol("iplanIndex”)
Data Frame
© 2017 MapR Technologies
Data Frame
Add column
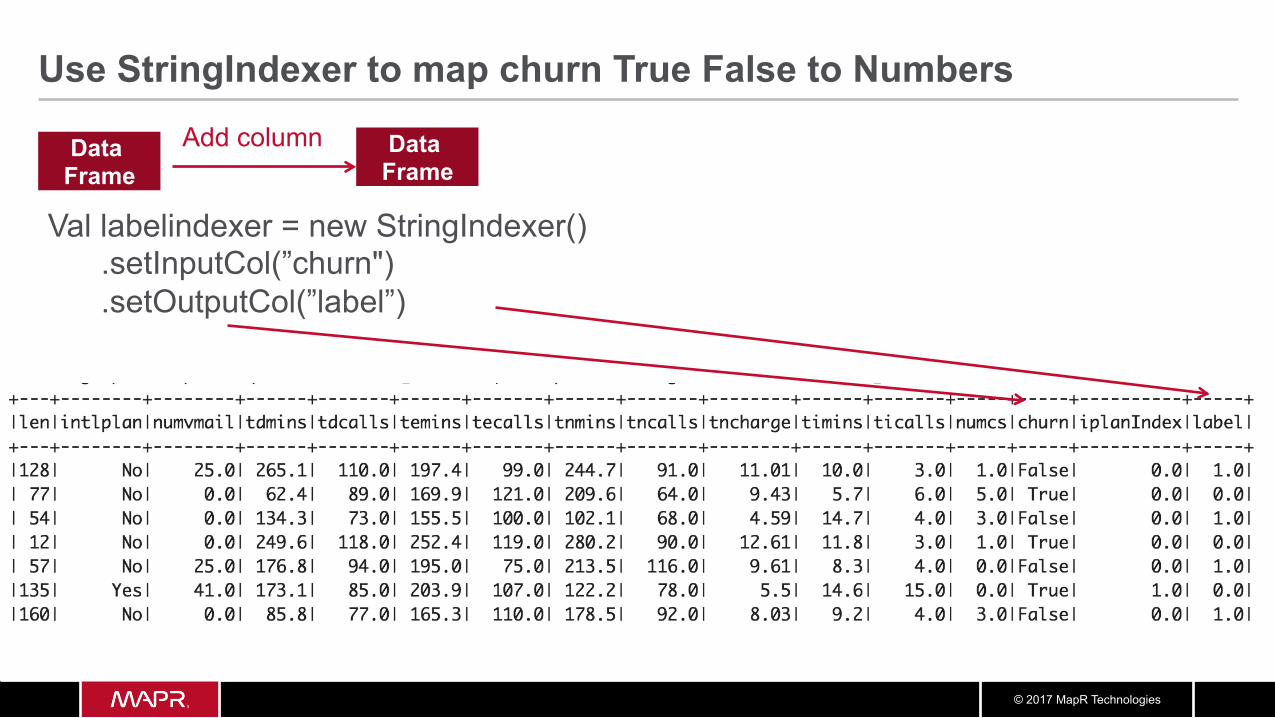
Use StringIndexer to map churn True False to Numbers
Val labelindexer = new StringIndexer() .setInputCol(”churn") .setOutputCol(”label”)
Data Frame
© 2017 MapR Technologies
Data Frame
Load data Add column DataFrame + Features
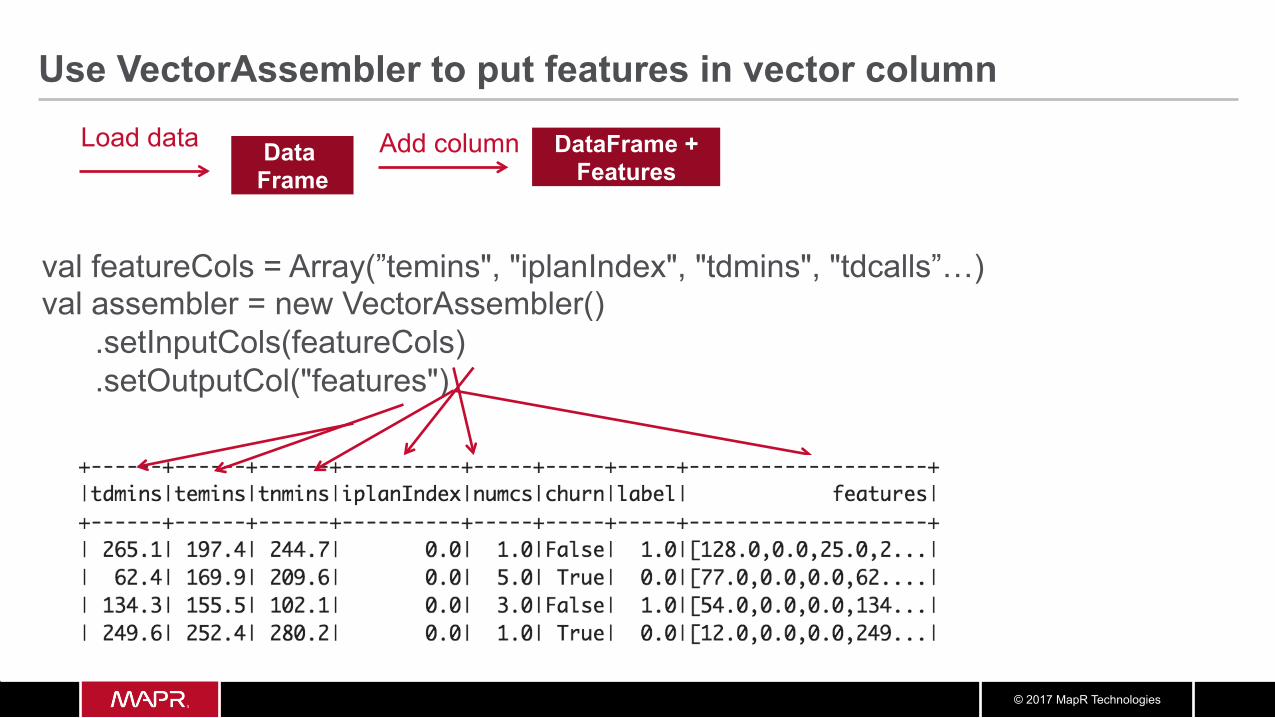
Use VectorAssembler to put features in vector column
val featureCols = Array(”temins", "iplanIndex", "tdmins", "tdcalls”…) val assembler = new VectorAssembler() .setInputCols(featureCols) .setOutputCol("features")
© 2017 MapR Technologies
Data Frame
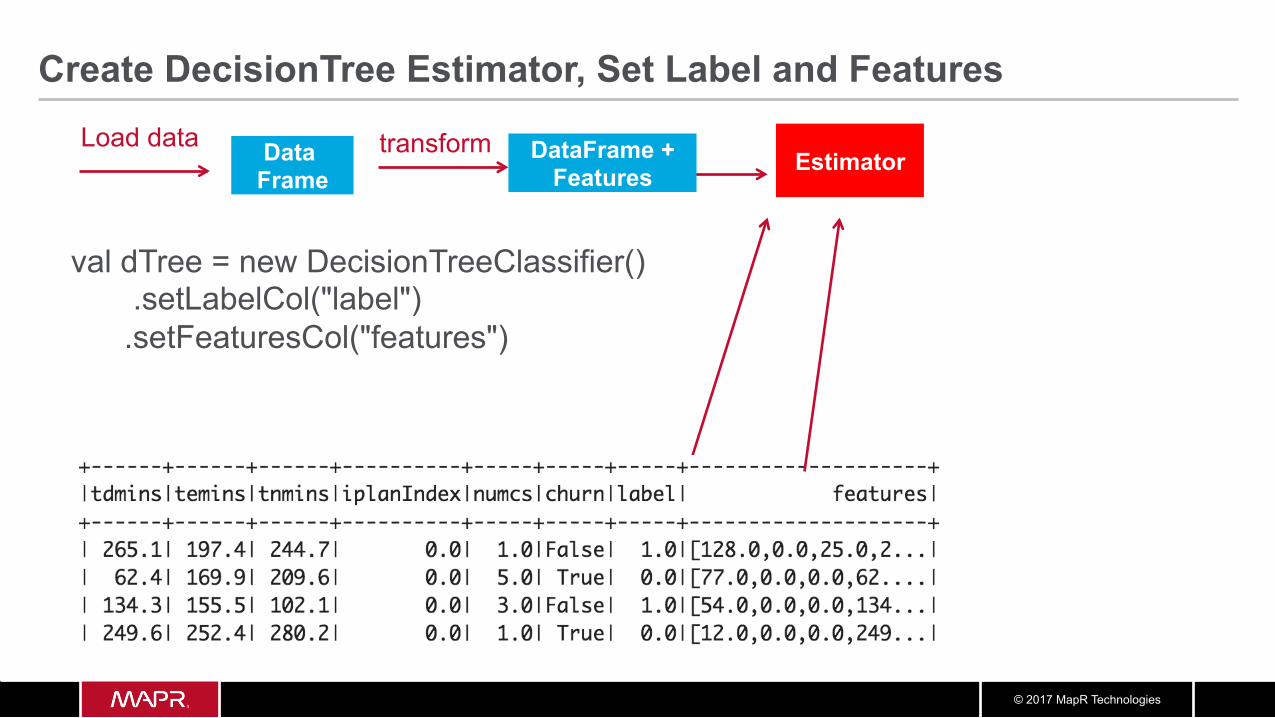
Load data transform Estimator
val dTree = new DecisionTreeClassifier() .setLabelCol("label") .setFeaturesCol("features")
Create DecisionTree Estimator, Set Label and Features
DataFrame + Features
© 2017 MapR Technologies
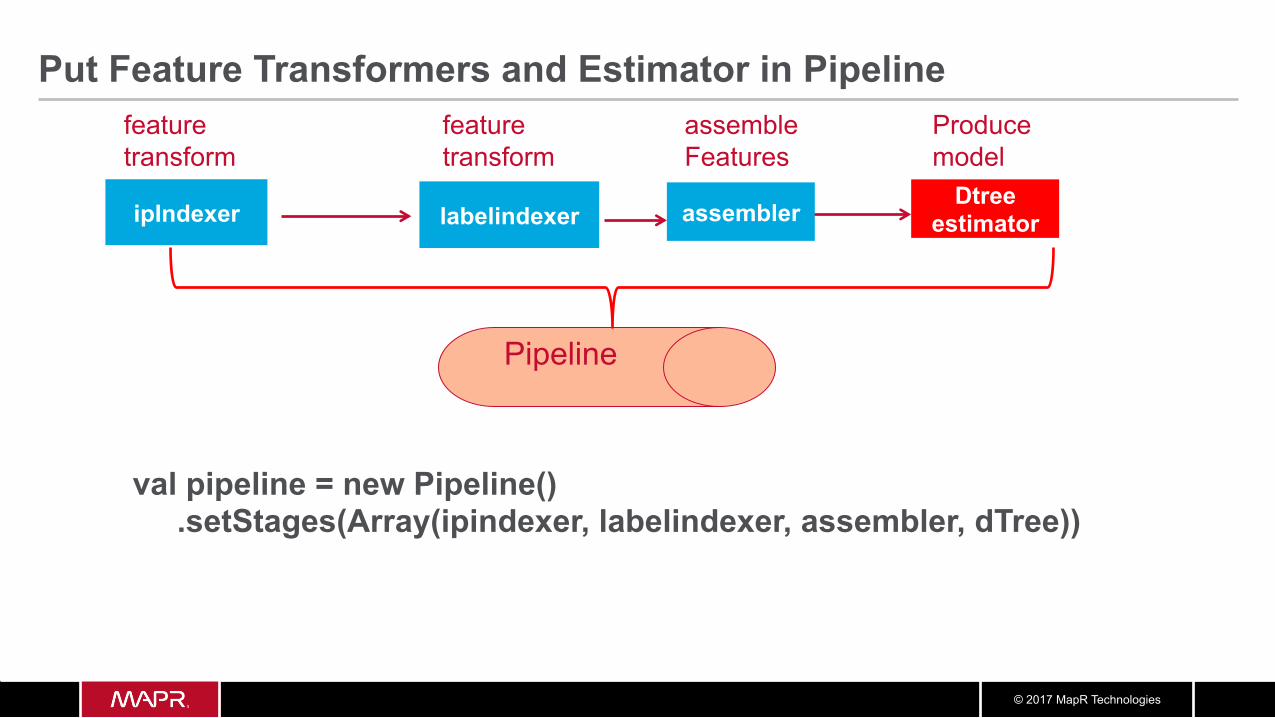
val pipeline = new Pipeline() .setStages(Array(ipindexer, labelindexer, assembler, dTree))
Put Feature Transformers and Estimator in Pipeline
Pipeline
ipIndexer
feature transform
assembler Dtree
estimator labelindexer
feature transform
assemble Features
Produce model
© 2017 MapR Technologies
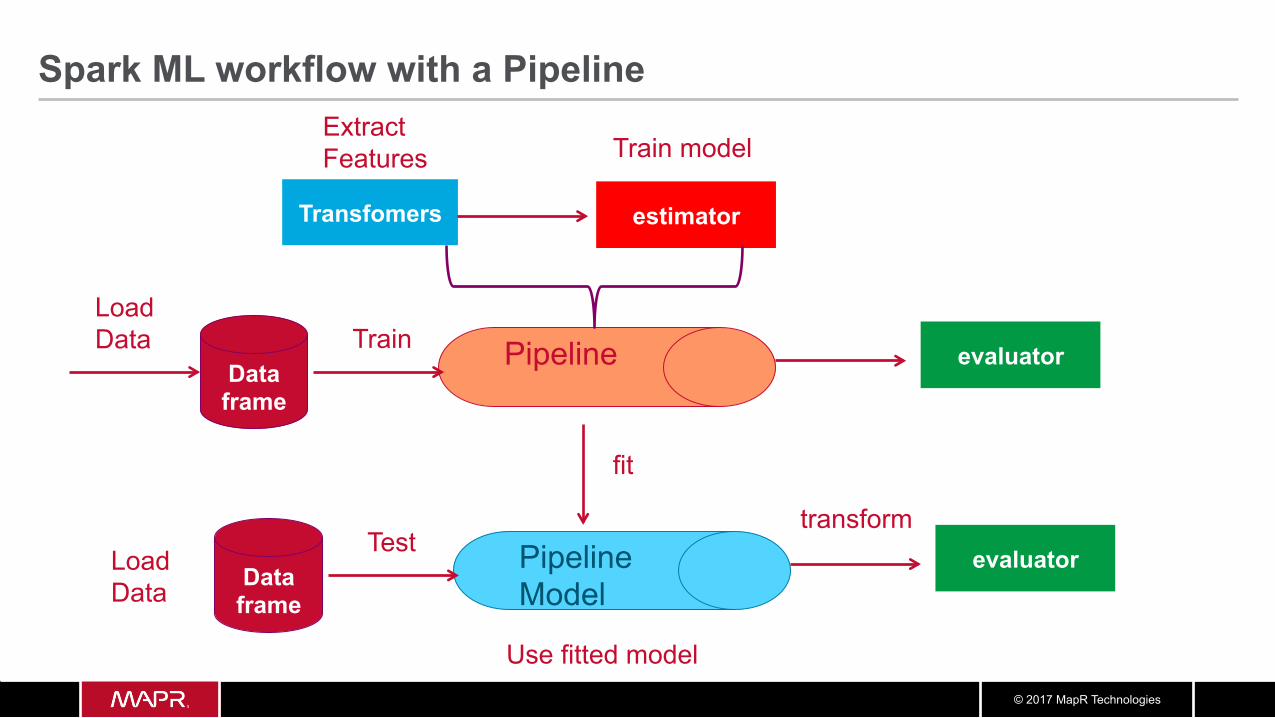
Spark ML workflow with a Pipeline
Pipeline
Transfomers
Load Data
estimator
Train model
Data frame
Extract Features
evaluator
Pipeline Model
Test Data
frame
evaluator
Use fitted model
Train
Load Data
fit
transform
© 2017 MapR Technologies
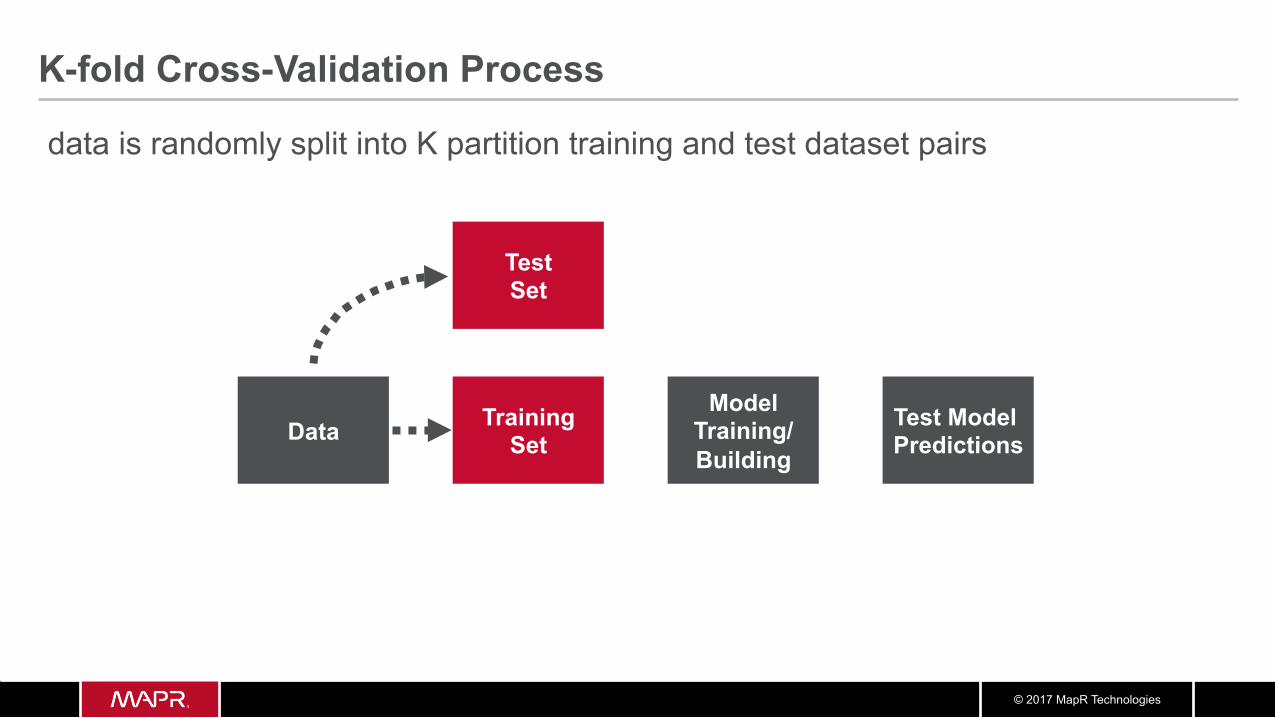
K-fold Cross-Validation Process
Data Model
Training/ Building
Training Set
Test Model Predictions
Test Set
data is randomly split into K partition training and test dataset pairs
© 2017 MapR Technologies
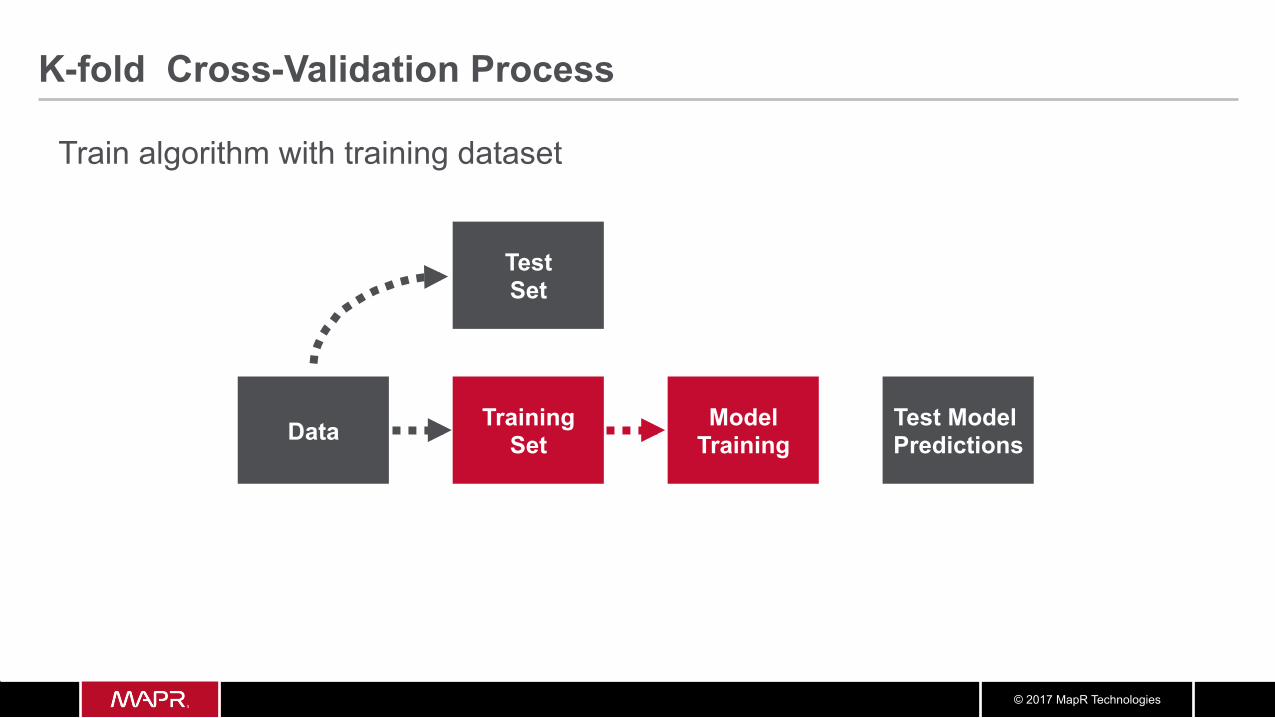
K-fold Cross-Validation Process
Data Model Training
Training Set
Test Model Predictions
Test Set
Train algorithm with training dataset
© 2017 MapR Technologies
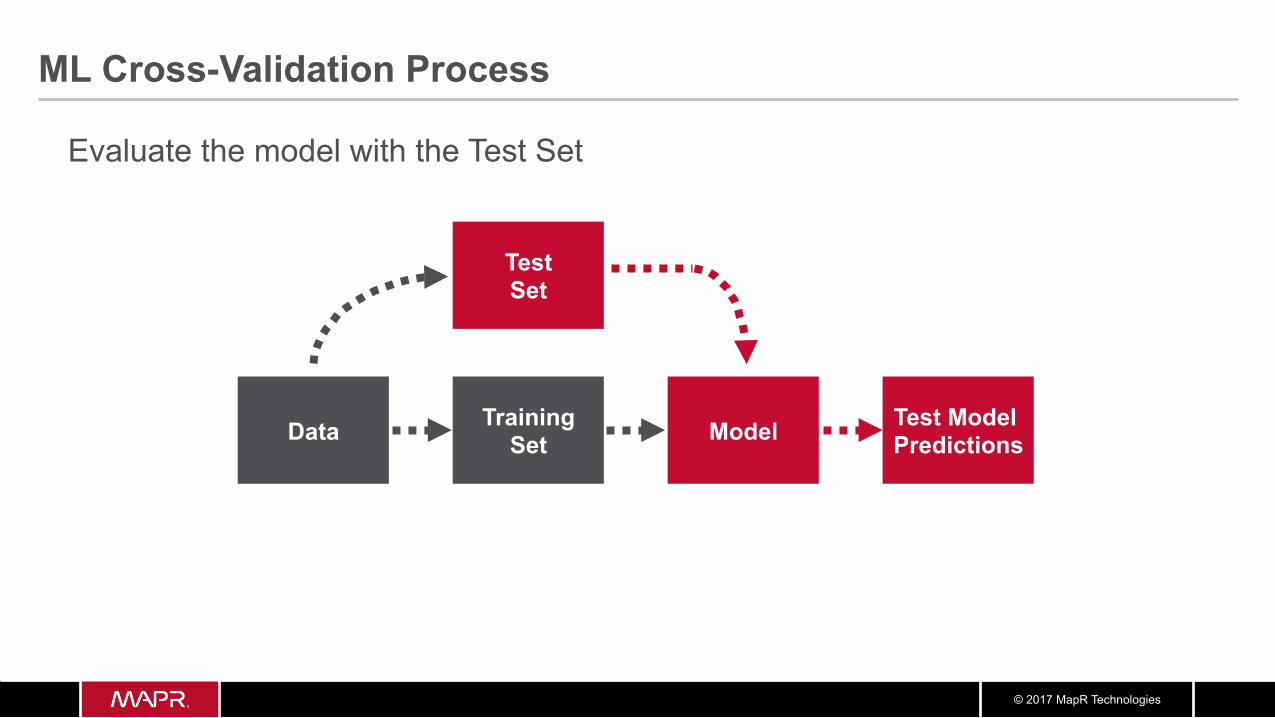
ML Cross-Validation Process
Data Model Training Set
Test Model Predictions
Test Set
Evaluate the model with the Test Set
© 2017 MapR Technologies
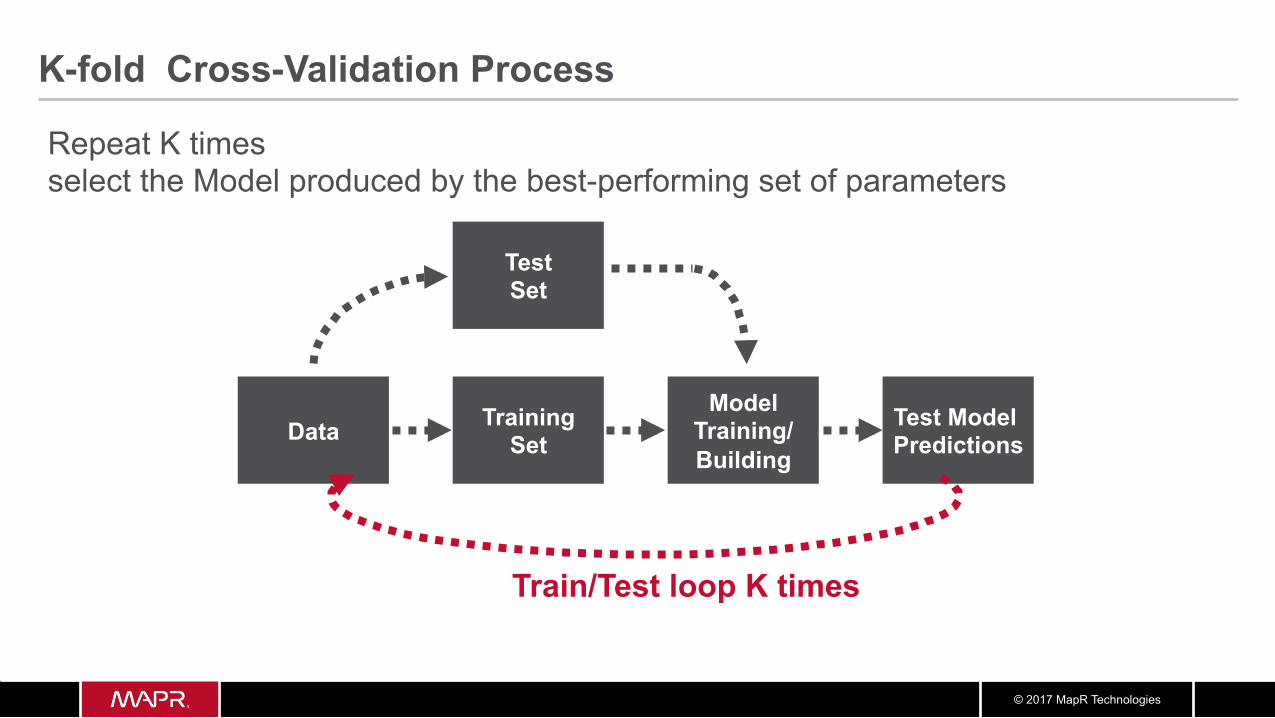
K-fold Cross-Validation Process
Data Model
Training/ Building
Training Set
Test Model Predictions
Test Set
Train/Test loop K times
Repeat K times select the Model produced by the best-performing set of parameters
© 2017 MapR Technologies
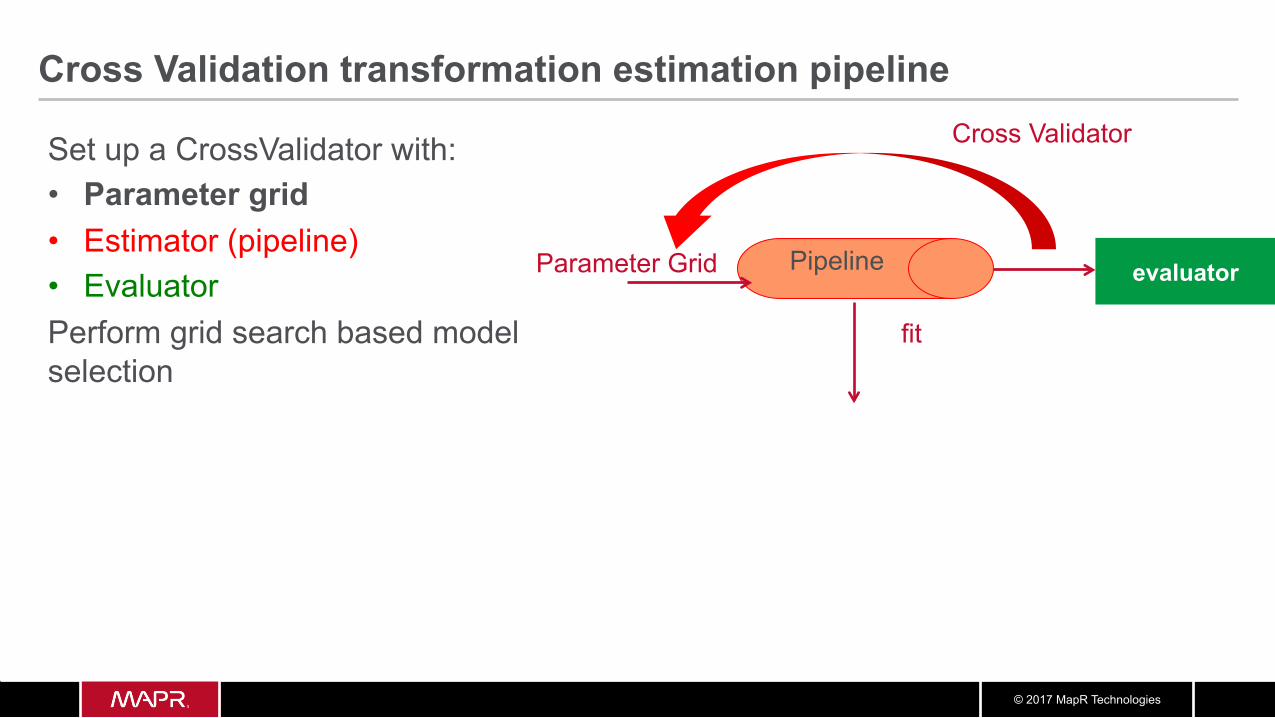
Cross Validation transformation estimation pipeline
Pipeline
Cross Validator
evaluator Parameter Grid
fit
Set up a CrossValidator with: • Parameter grid • Estimator (pipeline) • Evaluator Perform grid search based model selection
© 2017 MapR Technologies
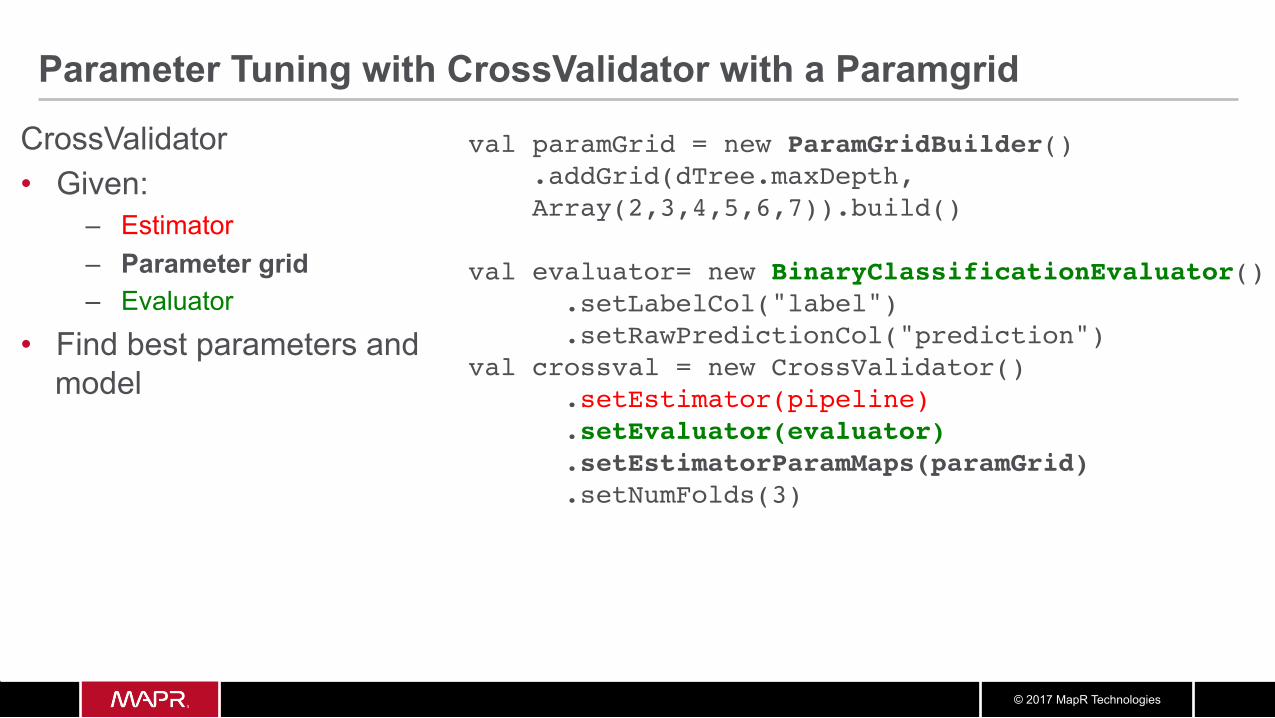
Parameter Tuning with CrossValidator with a Paramgrid
CrossValidator • Given:
– Estimator – Parameter grid – Evaluator
• Find best parameters and model
val paramGrid = new ParamGridBuilder().addGrid(dTree.maxDepth, Array(2,3,4,5,6,7)).build()
val evaluator= new BinaryClassificationEvaluator() .setLabelCol("label") .setRawPredictionCol("prediction")val crossval = new CrossValidator() .setEstimator(pipeline) .setEvaluator(evaluator) .setEstimatorParamMaps(paramGrid)
.setNumFolds(3)
© 2017 MapR Technologies
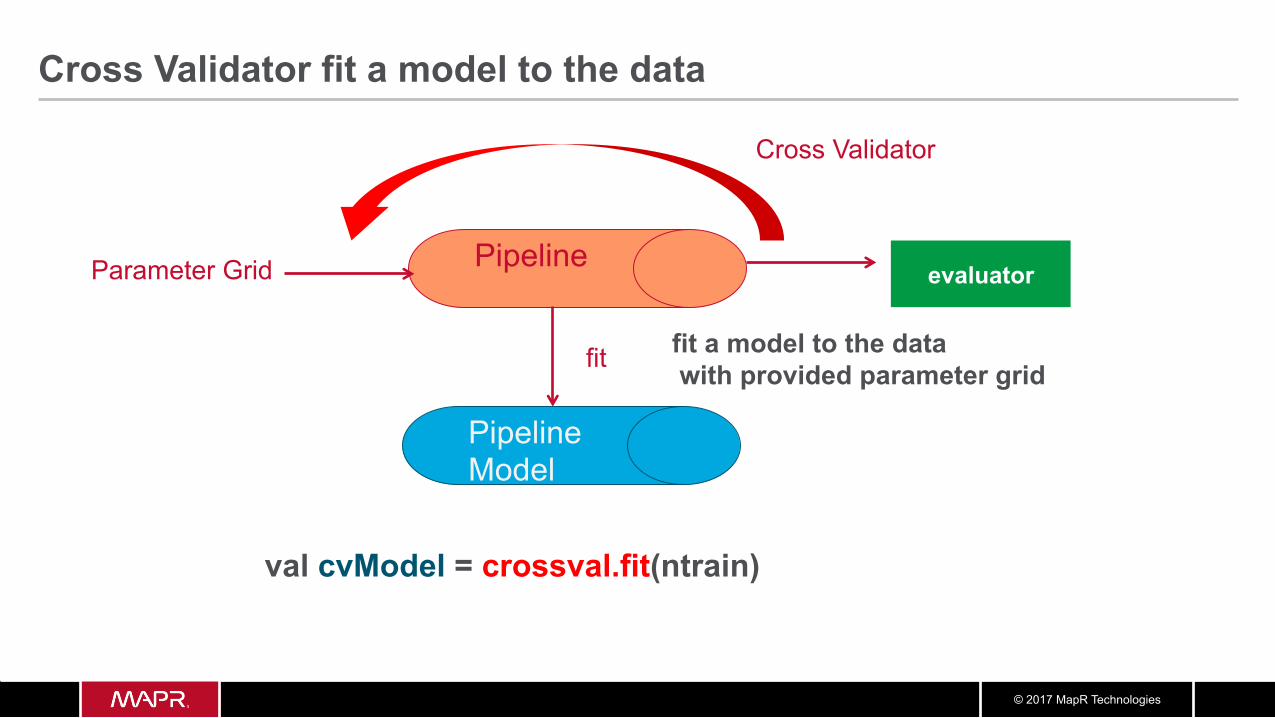
val cvModel = crossval.fit(ntrain)
Cross Validator fit a model to the data
Pipeline
Cross Validator
evaluator Parameter Grid
fit
Pipeline Model
fit a model to the data with provided parameter grid
© 2017 MapR Technologies
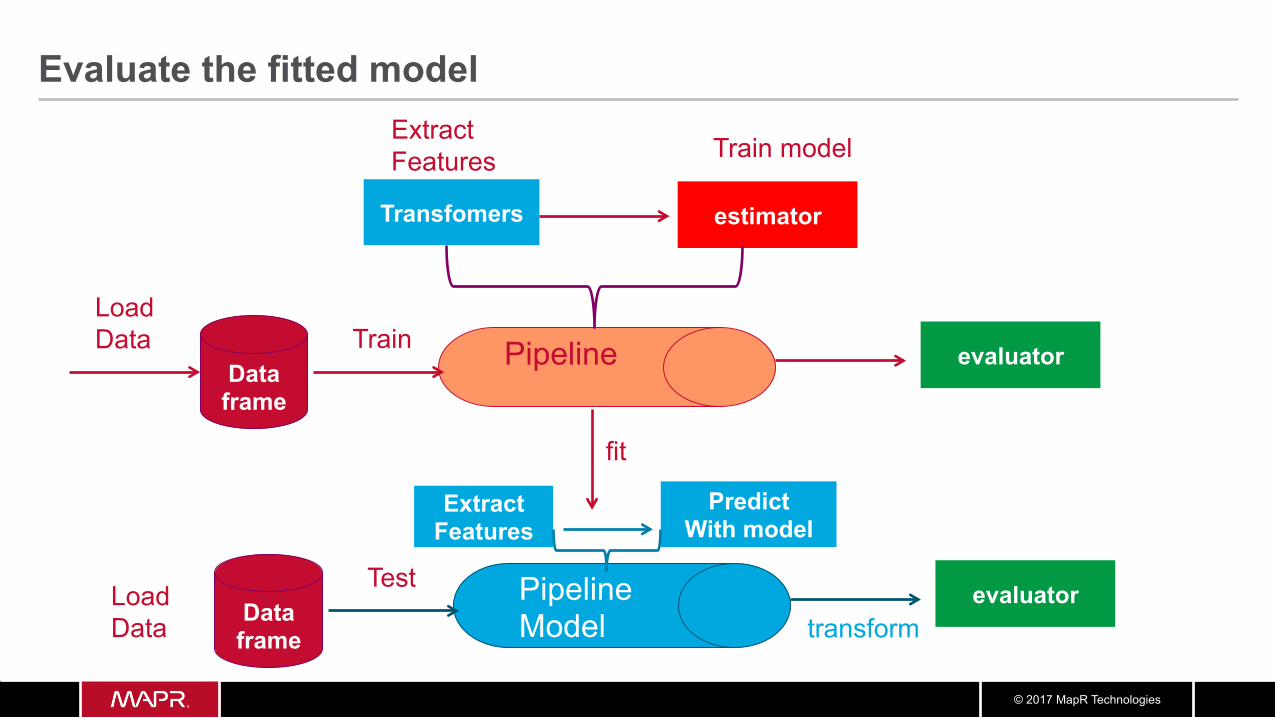
Evaluate the fitted model
Pipeline
Transfomers
Load Data
estimator
Train model
Data frame
Extract Features
evaluator
Pipeline Model
Test Data
frame
evaluator transform
Train
Load Data
Predict With model
Extract Features
fit
© 2017 MapR Technologies
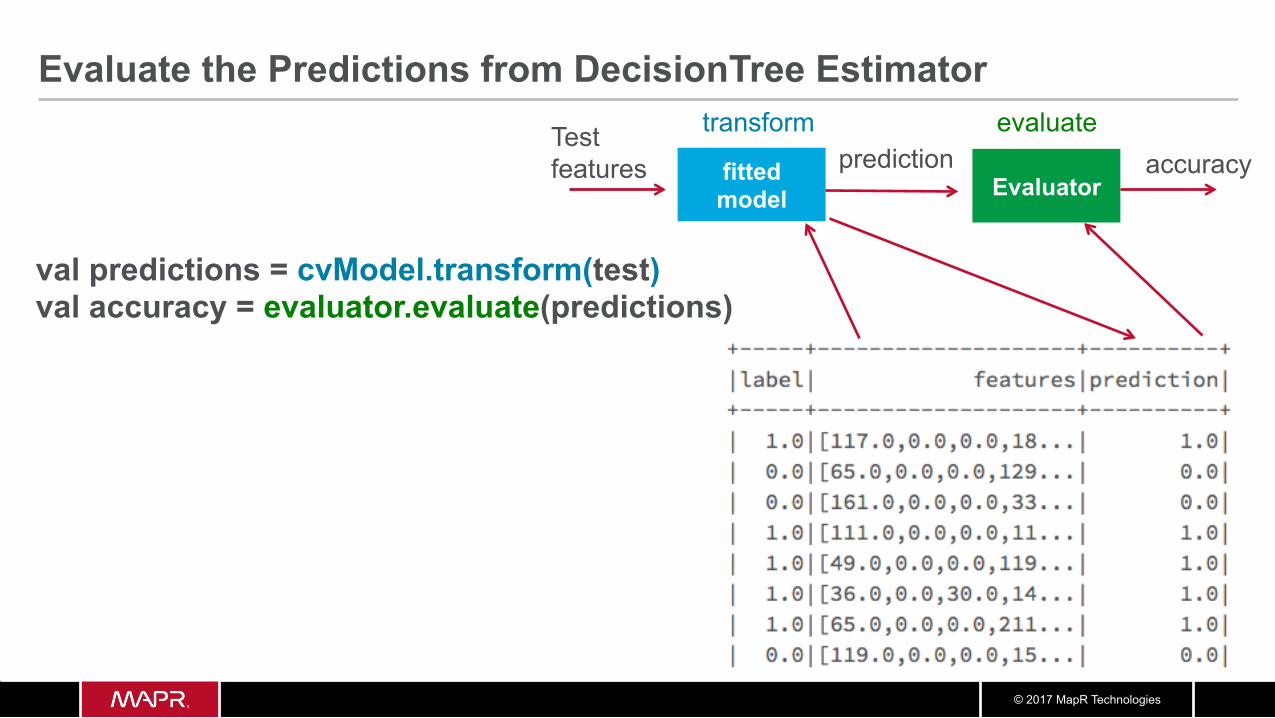
fitted model
Evaluate the Predictions from DecisionTree Estimator
Evaluator
transform Test features
val predictions = cvModel.transform(test) val accuracy = evaluator.evaluate(predictions)
evaluate prediction accuracy
© 2017 MapR Technologies
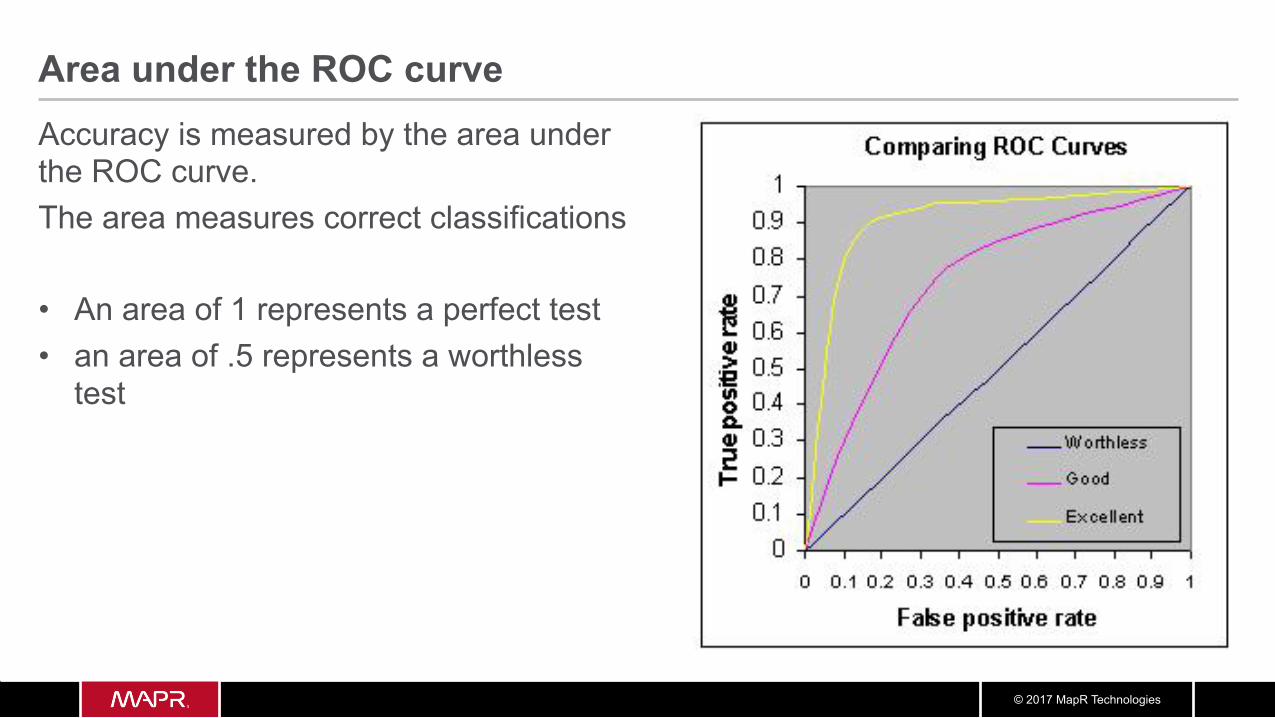
Area under the ROC curve Accuracy is measured by the area under the ROC curve. The area measures correct classifications • An area of 1 represents a perfect test • an area of .5 represents a worthless
test
© 2017 MapR Technologies
To Learn More: • Read about and download example code • https://mapr.com/blog/churn-prediction-sparkml/
© 2017 MapR Technologies
To Learn More: • End to End Application for Monitoring Uber Data using Spark ML • https://mapr.com/blog/monitoring-real-time-uber-data-using-spark-machine-
learning-streaming-and-kafka-api-part-1/

© 2017 MapR Technologies
To Learn More: • MapR Free ODT http://learn.mapr.com/
© 2017 MapR Technologies
For Q&A : • https://community.mapr.com/ • https://community.mapr.com/community/answers/pages/qa
© 2017 MapR Technologies
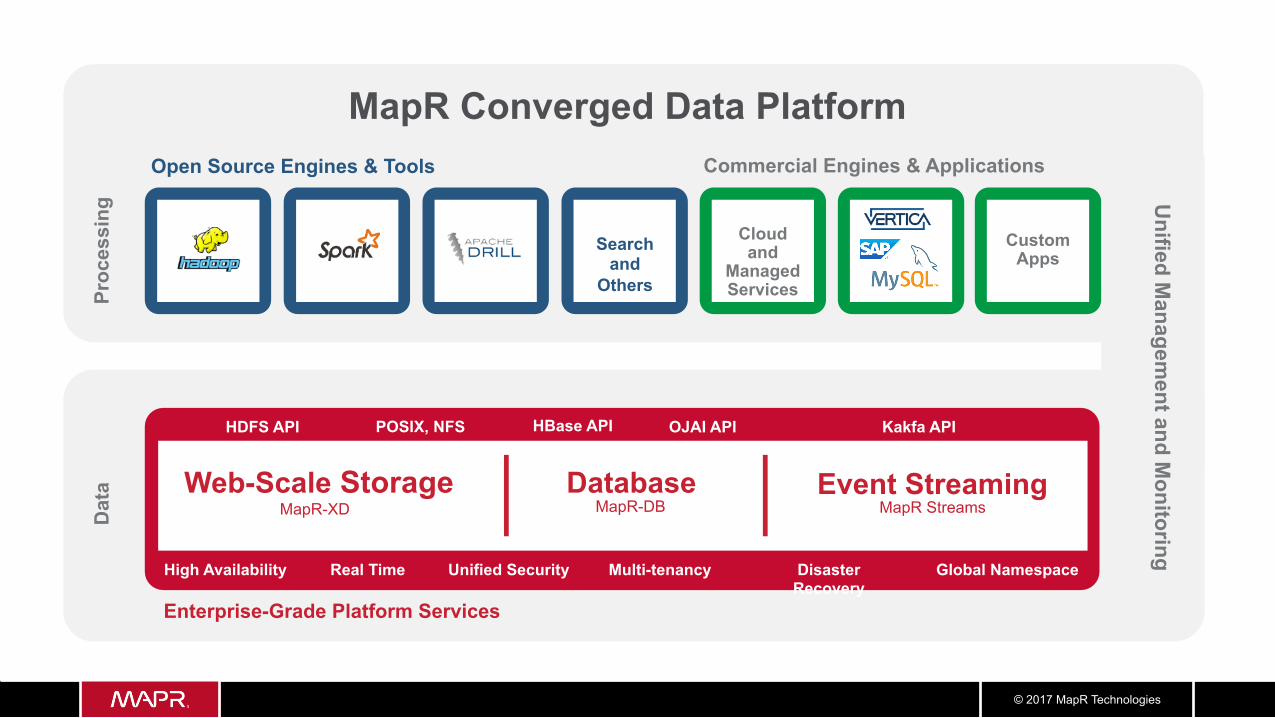
Open Source Engines & Tools Commercial Engines & Applications
Enterprise-Grade Platform Services
Dat
a Pr
oces
sing
Web-Scale Storage MapR-XD MapR-DB
Search and
Others
Real Time Unified Security Multi-tenancy Disaster Recovery
Global Namespace High Availability
MapR Streams
Cloud and
Managed Services
Search and Others
Unified M
anagement and M
onitoring
Search and
Others
Event Streaming Database
Custom Apps
MapR Converged Data Platform
HDFS API POSIX, NFS Kakfa API HBase API OJAI API

© 2017 MapR Technologies
Q&A
ENGAGE WITH US


![Customers Churn Prediction using Artificial Neural ... · devising of churn policy [16] is depicted in Fig. 2. Fig. 2. The Six Steps for Customer Churn Prediction. Churn prediction](https://img.pdfslide.us/doc/110x75/5e71a26fb4acff71e10cc1fe/customers-churn-prediction-using-artificial-neural-devising-of-churn-policy.jpg)


![Churn prediction in media [Dutch]](https://img.pdfslide.us/doc/110x75/558eb9d41a28abff058b4607/churn-prediction-in-media-dutch.jpg)