Embed Size (px)
Citation preview

Kaggle Digits Analysis
Zachary Combs, Philip Remmele, M.S. Data Science Candidates
South Dakota State University
July 2, 2015
Zachary Combs, Philip Remmele, M.S. Data Science Candidates Kaggle Digits Analysis

Introduction
In the following presentation we will be discussing our analysis of the Kaggle Digits data.
The Digits data set is comprised of a training set of 42,000 observations and 784
variables (not including the response), and a test set, containing 28,000 observations.
The variables contain pixelation values of hand written digits, ranging from 0-9.
For more information regarding the Kaggle Digits data please visit the site:
https://www.kaggle.com/c/digit-recognizer.
Zachary Combs, Philip Remmele, M.S. Data Science Candidates Kaggle Digits Analysis

Objective
Develop a classification model that is able to accurately classify digit labels in the
test set where class labels are unknown.
Zachary Combs, Philip Remmele, M.S. Data Science Candidates Kaggle Digits Analysis
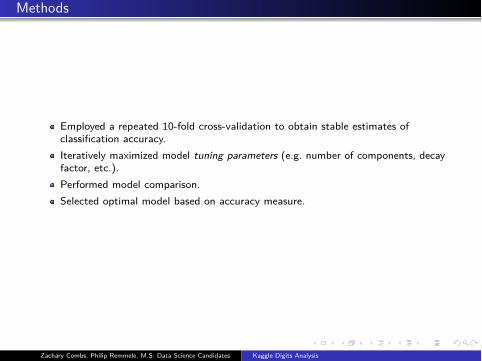
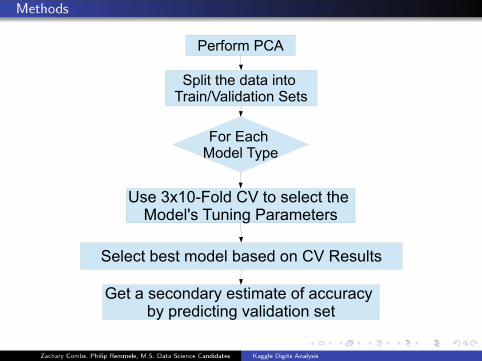
Methods
Employed a repeated 10-fold cross-validation to obtain stable estimates of
classification accuracy.
Iteratively maximized model tuning parameters (e.g. number of components, decay
factor, etc.).
Performed model comparison.
Selected optimal model based on accuracy measure.
Zachary Combs, Philip Remmele, M.S. Data Science Candidates Kaggle Digits Analysis
!"#$%#&'!()
*+,-.'./"'01.1'-2.%'3#1-2451,-01.-%2'*".6
7%#'819/':%0",'3;+"
<6"'=>?@A7%,0'(5'.%'6","9.'./"':%0",B6'3C2-2D'!1#1&"."#6
*","9.'E"6.'&%0",'E16"0'%2'(5'F"6C,.6
G".'1'6"9%201#;'"6.-&1."'%$'199C#19;'E;'+#"0-9.-2D'H1,-01.-%2'6".
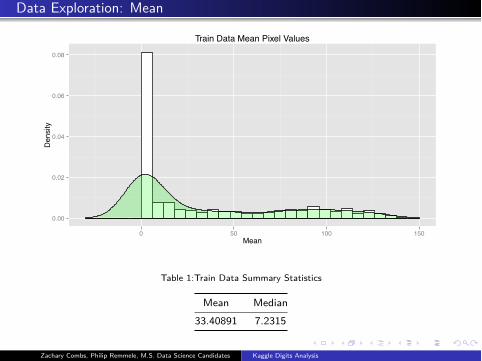
Data Exploration: Mean
0.00
0.02
0.04
0.06
0.08
0 50 100 150Mean
Den
sity
Train Data Mean Pixel Values
Table 1:Train Data Summary Statistics
Mean Median
33.40891 7.2315
Zachary Combs, Philip Remmele, M.S. Data Science Candidates Kaggle Digits Analysis
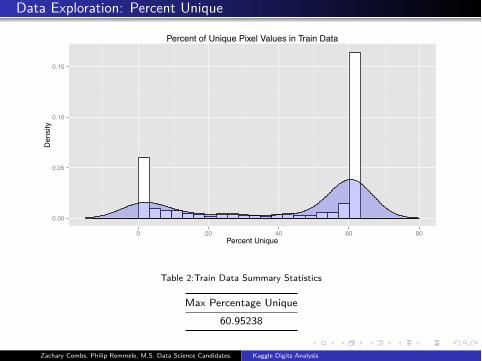
Data Exploration: Percent Unique
0.00
0.05
0.10
0.15
0 20 40 60 80Percent Unique
Den
sity
Percent of Unique Pixel Values in Train Data
Table 2:Train Data Summary Statistics
Max Percentage Unique
60.95238
Zachary Combs, Philip Remmele, M.S. Data Science Candidates Kaggle Digits Analysis
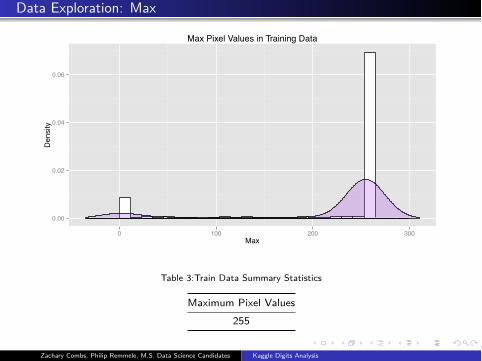
Data Exploration: Max
0.00
0.02
0.04
0.06
0 100 200 300Max
Den
sity
Max Pixel Values in Training Data
Table 3:Train Data Summary Statistics
Maximum Pixel Values
255
Zachary Combs, Philip Remmele, M.S. Data Science Candidates Kaggle Digits Analysis
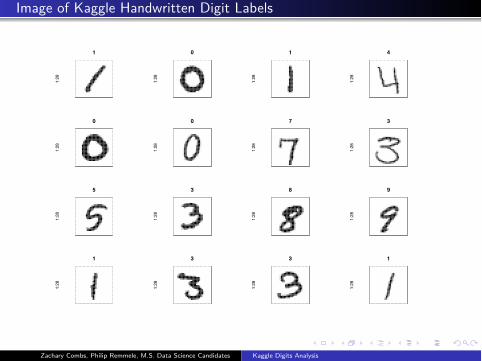
Image of Kaggle Handwritten Digit Labels
1
1:28
1:28
0
1:28
1:28
1
1:28
1:28
4
1:28
1:28
0
1:28
1:28
0
1:28
1:28
7
1:28
1:28
3
1:28
1:28
5
1:28
1:28
3
1:28
1:28
8
1:281:28
9
1:28
1:28
1
1:28
3
1:28
31:28
1
1:28
Zachary Combs, Philip Remmele, M.S. Data Science Candidates Kaggle Digits Analysis
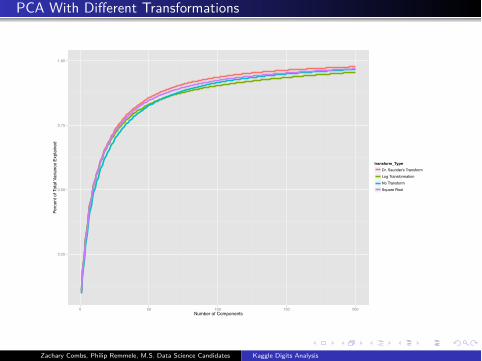
PCA With Different Transformations
0.25
0.50
0.75
1.00
0 50 100 150 200Number of Components
Perc
ent o
f Tot
al V
aria
nce
Expl
aine
d
transform_TypeDr. Saunder's TransformLog TransformationNo TransformSquare Root
Zachary Combs, Philip Remmele, M.S. Data Science Candidates Kaggle Digits Analysis
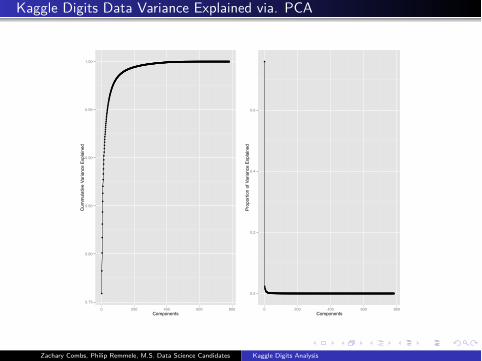
Kaggle Digits Data Variance Explained via. PCA
0.75
0.80
0.85
0.90
0.95
1.00
0 200 400 600 800Components
Cum
mul
ative
Var
ianc
e Ex
plai
ned
0.0
0.2
0.4
0.6
0 200 400 600 800Components
Prop
ortio
n of
Var
ianc
e Ex
plai
ned
Zachary Combs, Philip Remmele, M.S. Data Science Candidates Kaggle Digits Analysis
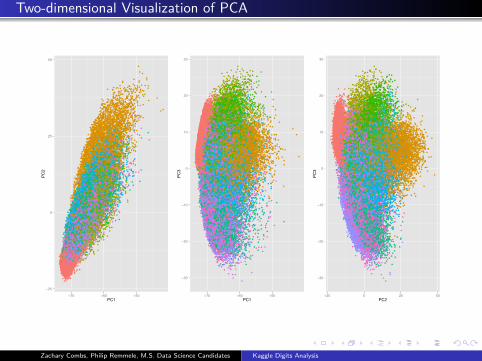
Two-dimensional Visualization of PCA
−25
0
25
50
−70 −60 −50PC1
PC2
−30
−20
−10
0
10
20
30
−70 −60 −50PC1
PC3
−30
−20
−10
0
10
20
30
−25 0 25 50PC2
PC3
Zachary Combs, Philip Remmele, M.S. Data Science Candidates Kaggle Digits Analysis
Shiny Applications: PCA Exploration
Shiny PCA 1
Shiny PCA 2
Zachary Combs, Philip Remmele, M.S. Data Science Candidates Kaggle Digits Analysis
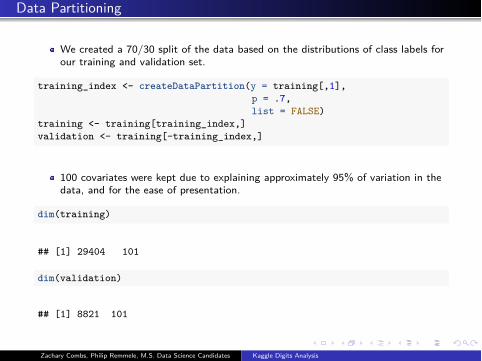
Data Partitioning
We created a 70/30 split of the data based on the distributions of class labels for
our training and validation set.
training_index <- createDataPartition(y = training[,1],p = .7,list = FALSE)
training <- training[training_index,]validation <- training[-training_index,]
100 covariates were kept due to explaining approximately 95% of variation in the
data, and for the ease of presentation.
dim(training)
## [1] 29404 101
dim(validation)
## [1] 8821 101
Zachary Combs, Philip Remmele, M.S. Data Science Candidates Kaggle Digits Analysis
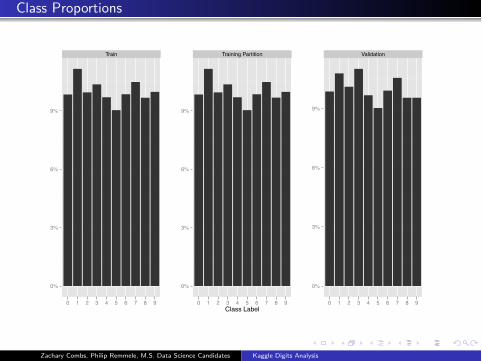
Class Proportions
Train
0%
3%
6%
9%
0 1 2 3 4 5 6 7 8 9
Training Partition
0%
3%
6%
9%
0 1 2 3 4 5 6 7 8 9Class Label
Validation
0%
3%
6%
9%
0 1 2 3 4 5 6 7 8 9
Zachary Combs, Philip Remmele, M.S. Data Science Candidates Kaggle Digits Analysis
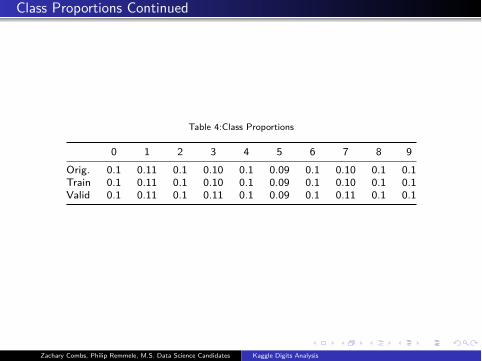
Class Proportions Continued
Table 4:Class Proportions
0 1 2 3 4 5 6 7 8 9
Orig. 0.1 0.11 0.1 0.10 0.1 0.09 0.1 0.10 0.1 0.1
Train 0.1 0.11 0.1 0.10 0.1 0.09 0.1 0.10 0.1 0.1
Valid 0.1 0.11 0.1 0.11 0.1 0.09 0.1 0.11 0.1 0.1
Zachary Combs, Philip Remmele, M.S. Data Science Candidates Kaggle Digits Analysis
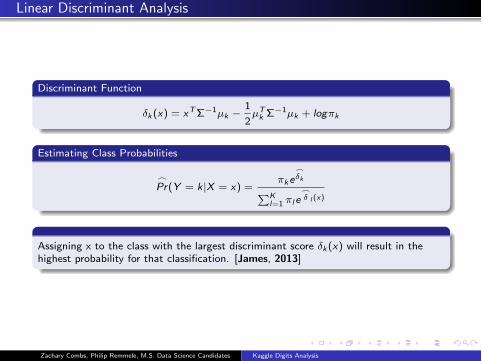
Linear Discriminant Analysis
Discriminant Function
δk (x) = xTΣ
−1µk −1
2µT
kΣ
−1µk + logπk
Estimating Class Probabilities
�Pr(Y = k|X = x) =
πke
�δk
�K
l=1πl e
�δ l (x)
Assigning x to the class with the largest discriminant score δk (x) will result in the
highest probability for that classification. [James, 2013]
Zachary Combs, Philip Remmele, M.S. Data Science Candidates Kaggle Digits Analysis
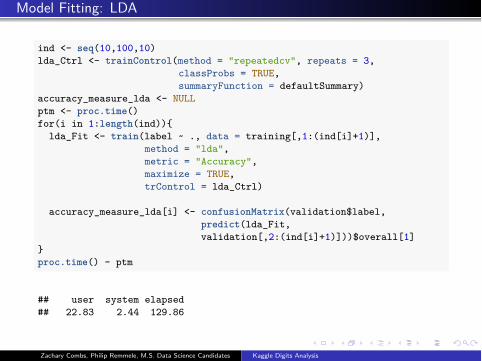
Model Fitting: LDA
ind <- seq(10,100,10)lda_Ctrl <- trainControl(method = "repeatedcv", repeats = 3,
classProbs = TRUE,summaryFunction = defaultSummary)
accuracy_measure_lda <- NULLptm <- proc.time()for(i in 1:length(ind)){
lda_Fit <- train(label ~ ., data = training[,1:(ind[i]+1)],method = "lda",metric = "Accuracy",maximize = TRUE,trControl = lda_Ctrl)
accuracy_measure_lda[i] <- confusionMatrix(validation$label,predict(lda_Fit,validation[,2:(ind[i]+1)]))$overall[1]
}proc.time() - ptm
## user system elapsed## 22.83 2.44 129.86
Zachary Combs, Philip Remmele, M.S. Data Science Candidates Kaggle Digits Analysis
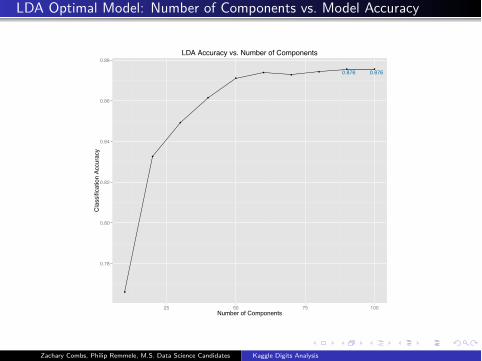
LDA Optimal Model: Number of Components vs. Model Accuracy
0.876 0.876
0.78
0.80
0.82
0.84
0.86
0.88
25 50 75 100Number of Components
Cla
ssifi
catio
n Ac
cura
cy
LDA Accuracy vs. Number of Components
Zachary Combs, Philip Remmele, M.S. Data Science Candidates Kaggle Digits Analysis
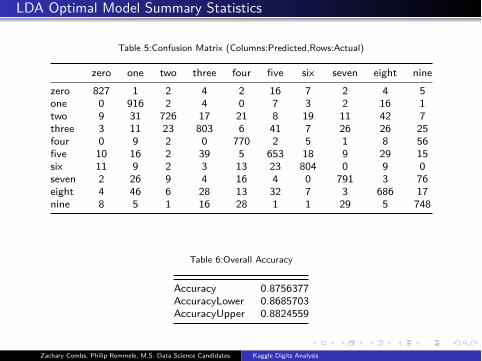
LDA Optimal Model Summary Statistics
Table 5:Confusion Matrix (Columns:Predicted,Rows:Actual)
zero one two three four five six seven eight nine
zero 827 1 2 4 2 16 7 2 4 5
one 0 916 2 4 0 7 3 2 16 1
two 9 31 726 17 21 8 19 11 42 7
three 3 11 23 803 6 41 7 26 26 25
four 0 9 2 0 770 2 5 1 8 56
five 10 16 2 39 5 653 18 9 29 15
six 11 9 2 3 13 23 804 0 9 0
seven 2 26 9 4 16 4 0 791 3 76
eight 4 46 6 28 13 32 7 3 686 17
nine 8 5 1 16 28 1 1 29 5 748
Table 6:Overall Accuracy
Accuracy 0.8756377
AccuracyLower 0.8685703
AccuracyUpper 0.8824559
Zachary Combs, Philip Remmele, M.S. Data Science Candidates Kaggle Digits Analysis
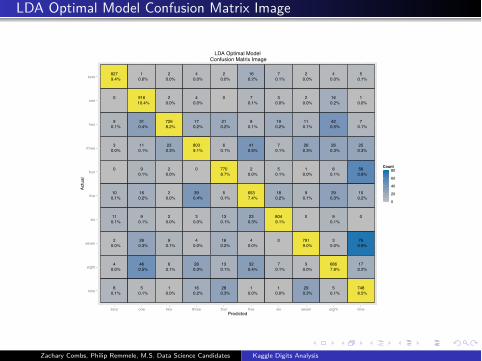
LDA Optimal Model Confusion Matrix Image
827 1 2 4 2 16 7 2 4 5
0 916 2 4 0 7 3 2 16 1
9 31 726 17 21 8 19 11 42 7
3 11 23 803 6 41 7 26 26 25
0 9 2 0 770 2 5 1 8 56
10 16 2 39 5 653 18 9 29 15
11 9 2 3 13 23 804 0 9 0
2 26 9 4 16 4 0 791 3 76
4 46 6 28 13 32 7 3 686 17
8 5 1 16 28 1 1 29 5 748
9.4% 0.0% 0.0% 0.0% 0.0% 0.2% 0.1% 0.0% 0.0% 0.1%
10.4% 0.0% 0.0% 0.1% 0.0% 0.0% 0.2% 0.0%
0.1% 0.4% 8.2% 0.2% 0.2% 0.1% 0.2% 0.1% 0.5% 0.1%
0.0% 0.1% 0.3% 9.1% 0.1% 0.5% 0.1% 0.3% 0.3% 0.3%
0.1% 0.0% 8.7% 0.0% 0.1% 0.0% 0.1% 0.6%
0.1% 0.2% 0.0% 0.4% 0.1% 7.4% 0.2% 0.1% 0.3% 0.2%
0.1% 0.1% 0.0% 0.0% 0.1% 0.3% 9.1% 0.1%
0.0% 0.3% 0.1% 0.0% 0.2% 0.0% 9.0% 0.0% 0.9%
0.0% 0.5% 0.1% 0.3% 0.1% 0.4% 0.1% 0.0% 7.8% 0.2%
0.1% 0.1% 0.0% 0.2% 0.3% 0.0% 0.0% 0.3% 0.1% 8.5%nine
eight
seven
six
five
four
three
two
one
zero
zero one two three four five six seven eight ninePredicted
Actu
al
0
20
40
60
80Count
LDA Optimal Model Confusion Matrix Image
Zachary Combs, Philip Remmele, M.S. Data Science Candidates Kaggle Digits Analysis
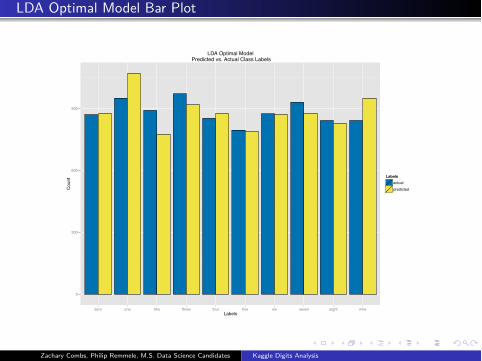
LDA Optimal Model Bar Plot
0
300
600
900
zero one two three four five six seven eight nineLabels
Coun
t Labelsactualpredicted
LDA Optimal Model Predicted vs. Actual Class Labels
Zachary Combs, Philip Remmele, M.S. Data Science Candidates Kaggle Digits Analysis

LDA Optimal Model Predictions for Test Set
2
1:28
1:28
0
1:28
1:28
9
1:28
1:28
4
1:28
1:28
3
1:28
1:28
7
1:28
1:28
0
1:281:28
3
1:28
1:28
0
1:28
1:28
3
1:28
1:28
5
1:28
1:28
7
1:28
1:28
4
1:28
1:28
0
1:28
1:28
4
1:28
1:28
0
1:28
1:28
2
1:28
1:28
1
1:28
1:28
9
1:28
1:28
0
1:28
1:28
9
1:28
1:28
1
1:28
1:28
8
1:28
1:28
5
1:28
1:28
7
1:28
1:28
Zachary Combs, Philip Remmele, M.S. Data Science Candidates Kaggle Digits Analysis
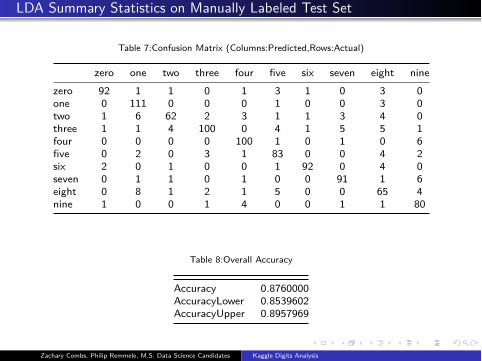
LDA Summary Statistics on Manually Labeled Test Set
Table 7:Confusion Matrix (Columns:Predicted,Rows:Actual)
zero one two three four five six seven eight nine
zero 92 1 1 0 1 3 1 0 3 0
one 0 111 0 0 0 1 0 0 3 0
two 1 6 62 2 3 1 1 3 4 0
three 1 1 4 100 0 4 1 5 5 1
four 0 0 0 0 100 1 0 1 0 6
five 0 2 0 3 1 83 0 0 4 2
six 2 0 1 0 0 1 92 0 4 0
seven 0 1 1 0 1 0 0 91 1 6
eight 0 8 1 2 1 5 0 0 65 4
nine 1 0 0 1 4 0 0 1 1 80
Table 8:Overall Accuracy
Accuracy 0.8760000
AccuracyLower 0.8539602
AccuracyUpper 0.8957969
Zachary Combs, Philip Remmele, M.S. Data Science Candidates Kaggle Digits Analysis
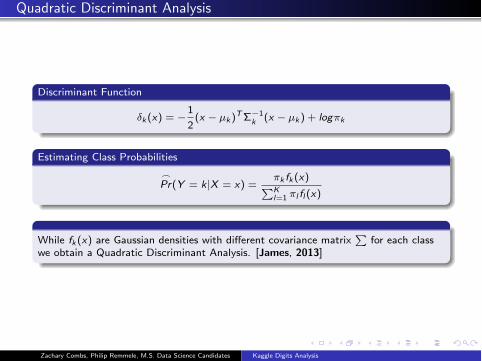
Quadratic Discriminant Analysis
Discriminant Function
δk (x) = −1
2(x − µk )
TΣ
−1
k(x − µk ) + logπk
Estimating Class Probabilities
�Pr(Y = k|X = x) =
πk fk (x)�K
l=1πl fl (x)
While fk (x) are Gaussian densities with different covariance matrix�
for each class
we obtain a Quadratic Discriminant Analysis. [James, 2013]
Zachary Combs, Philip Remmele, M.S. Data Science Candidates Kaggle Digits Analysis
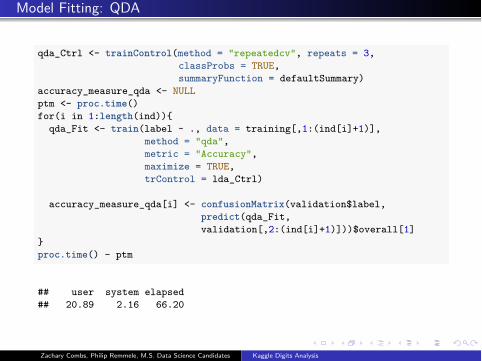
Model Fitting: QDA
qda_Ctrl <- trainControl(method = "repeatedcv", repeats = 3,classProbs = TRUE,summaryFunction = defaultSummary)
accuracy_measure_qda <- NULLptm <- proc.time()for(i in 1:length(ind)){
qda_Fit <- train(label ~ ., data = training[,1:(ind[i]+1)],method = "qda",metric = "Accuracy",maximize = TRUE,trControl = lda_Ctrl)
accuracy_measure_qda[i] <- confusionMatrix(validation$label,predict(qda_Fit,validation[,2:(ind[i]+1)]))$overall[1]
}proc.time() - ptm
## user system elapsed## 20.89 2.16 66.20
Zachary Combs, Philip Remmele, M.S. Data Science Candidates Kaggle Digits Analysis
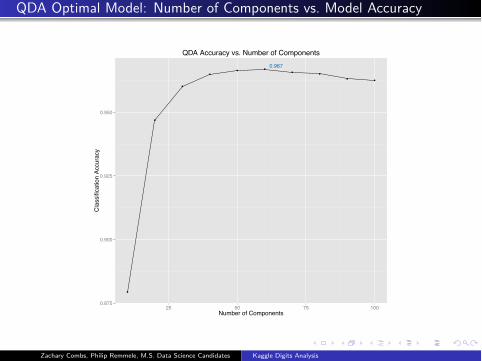
QDA Optimal Model: Number of Components vs. Model Accuracy
0.967
0.875
0.900
0.925
0.950
25 50 75 100Number of Components
Cla
ssifi
catio
n Ac
cura
cy
QDA Accuracy vs. Number of Components
Zachary Combs, Philip Remmele, M.S. Data Science Candidates Kaggle Digits Analysis
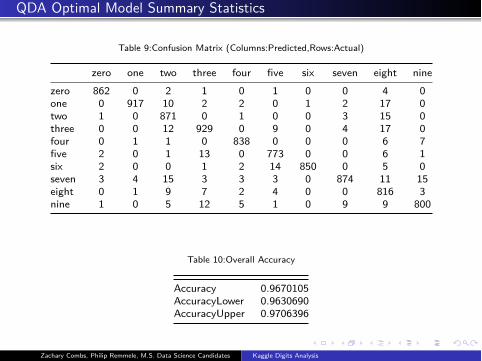
QDA Optimal Model Summary Statistics
Table 9:Confusion Matrix (Columns:Predicted,Rows:Actual)
zero one two three four five six seven eight nine
zero 862 0 2 1 0 1 0 0 4 0
one 0 917 10 2 2 0 1 2 17 0
two 1 0 871 0 1 0 0 3 15 0
three 0 0 12 929 0 9 0 4 17 0
four 0 1 1 0 838 0 0 0 6 7
five 2 0 1 13 0 773 0 0 6 1
six 2 0 0 1 2 14 850 0 5 0
seven 3 4 15 3 3 3 0 874 11 15
eight 0 1 9 7 2 4 0 0 816 3
nine 1 0 5 12 5 1 0 9 9 800
Table 10:Overall Accuracy
Accuracy 0.9670105
AccuracyLower 0.9630690
AccuracyUpper 0.9706396
Zachary Combs, Philip Remmele, M.S. Data Science Candidates Kaggle Digits Analysis
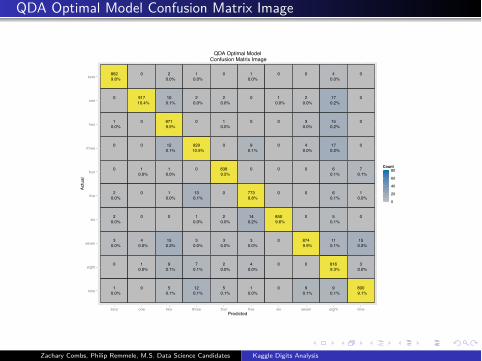
QDA Optimal Model Confusion Matrix Image
862 0 2 1 0 1 0 0 4 0
0 917 10 2 2 0 1 2 17 0
1 0 871 0 1 0 0 3 15 0
0 0 12 929 0 9 0 4 17 0
0 1 1 0 838 0 0 0 6 7
2 0 1 13 0 773 0 0 6 1
2 0 0 1 2 14 850 0 5 0
3 4 15 3 3 3 0 874 11 15
0 1 9 7 2 4 0 0 816 3
1 0 5 12 5 1 0 9 9 800
9.8% 0.0% 0.0% 0.0% 0.0%
10.4% 0.1% 0.0% 0.0% 0.0% 0.0% 0.2%
0.0% 9.9% 0.0% 0.0% 0.2%
0.1% 10.5% 0.1% 0.0% 0.2%
0.0% 0.0% 9.5% 0.1% 0.1%
0.0% 0.0% 0.1% 8.8% 0.1% 0.0%
0.0% 0.0% 0.0% 0.2% 9.6% 0.1%
0.0% 0.0% 0.2% 0.0% 0.0% 0.0% 9.9% 0.1% 0.2%
0.0% 0.1% 0.1% 0.0% 0.0% 9.3% 0.0%
0.0% 0.1% 0.1% 0.1% 0.0% 0.1% 0.1% 9.1%nine
eight
seven
six
five
four
three
two
one
zero
zero one two three four five six seven eight ninePredicted
Actu
al
0
20
40
60
80Count
QDA Optimal Model Confusion Matrix Image
Zachary Combs, Philip Remmele, M.S. Data Science Candidates Kaggle Digits Analysis
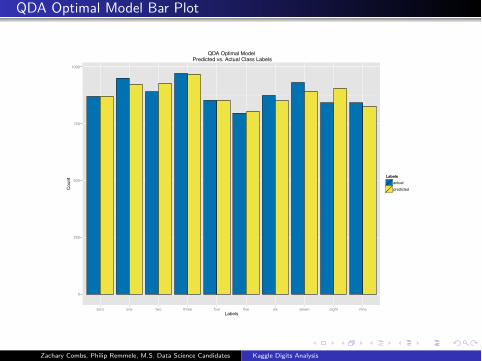
QDA Optimal Model Bar Plot
0
250
500
750
1000
zero one two three four five six seven eight nineLabels
Coun
t Labelsactualpredicted
QDA Optimal Model Predicted vs. Actual Class Labels
Zachary Combs, Philip Remmele, M.S. Data Science Candidates Kaggle Digits Analysis

QDA Optimal Model Predictions for Test Set
2
1:28
1:28
0
1:28
1:28
9
1:28
1:28
9
1:28
1:28
3
1:28
1:28
7
1:28
1:28
0
1:281:28
3
1:28
1:28
0
1:28
1:28
3
1:28
1:28
5
1:28
1:28
7
1:28
1:28
4
1:28
1:28
0
1:28
1:28
4
1:28
1:28
3
1:28
1:28
3
1:28
1:28
1
1:28
1:28
9
1:28
1:28
0
1:28
1:28
9
1:28
1:28
1
1:28
1:28
8
1:28
1:28
5
1:28
1:28
7
1:28
1:28
Zachary Combs, Philip Remmele, M.S. Data Science Candidates Kaggle Digits Analysis
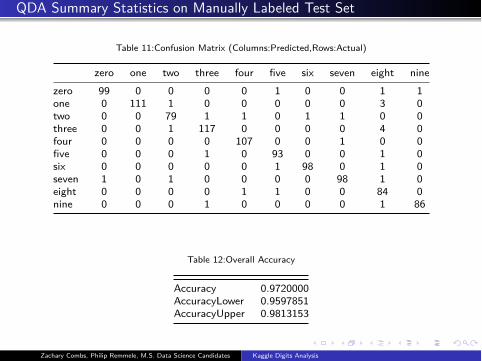
QDA Summary Statistics on Manually Labeled Test Set
Table 11:Confusion Matrix (Columns:Predicted,Rows:Actual)
zero one two three four five six seven eight nine
zero 99 0 0 0 0 1 0 0 1 1
one 0 111 1 0 0 0 0 0 3 0
two 0 0 79 1 1 0 1 1 0 0
three 0 0 1 117 0 0 0 0 4 0
four 0 0 0 0 107 0 0 1 0 0
five 0 0 0 1 0 93 0 0 1 0
six 0 0 0 0 0 1 98 0 1 0
seven 1 0 1 0 0 0 0 98 1 0
eight 0 0 0 0 1 1 0 0 84 0
nine 0 0 0 1 0 0 0 0 1 86
Table 12:Overall Accuracy
Accuracy 0.9720000
AccuracyLower 0.9597851
AccuracyUpper 0.9813153
Zachary Combs, Philip Remmele, M.S. Data Science Candidates Kaggle Digits Analysis
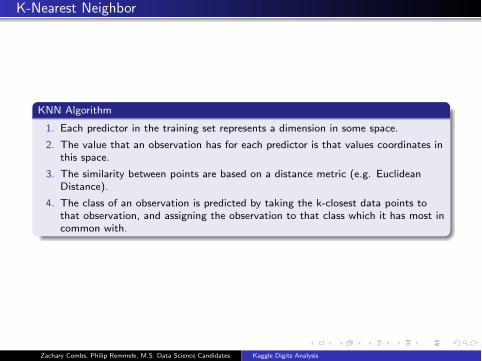
K-Nearest Neighbor
KNN Algorithm
1. Each predictor in the training set represents a dimension in some space.
2. The value that an observation has for each predictor is that values coordinates in
this space.
3. The similarity between points are based on a distance metric (e.g. Euclidean
Distance).
4. The class of an observation is predicted by taking the k-closest data points to
that observation, and assigning the observation to that class which it has most in
common with.
Zachary Combs, Philip Remmele, M.S. Data Science Candidates Kaggle Digits Analysis
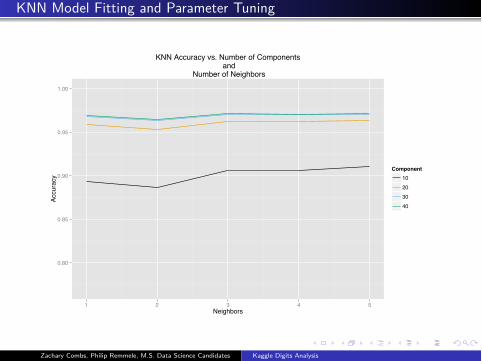
KNN Model Fitting and Parameter Tuning
0.80
0.85
0.90
0.95
1.00
1 2 3 4 5Neighbors
Accu
racy
Component10203040
KNN Accuracy vs. Number of Components and
Number of Neighbors
Zachary Combs, Philip Remmele, M.S. Data Science Candidates Kaggle Digits Analysis
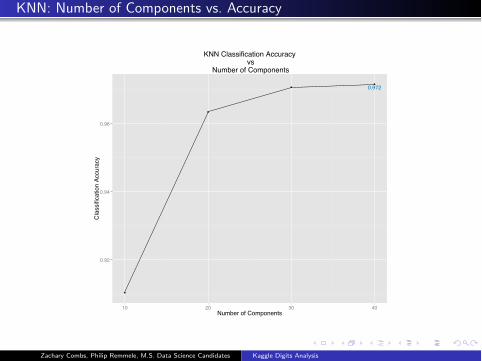
KNN: Number of Components vs. Accuracy
0.972
0.92
0.94
0.96
10 20 30 40Number of Components
Cla
ssifi
catio
n Ac
cura
cy
KNN Classification Accuracy vs
Number of Components
Zachary Combs, Philip Remmele, M.S. Data Science Candidates Kaggle Digits Analysis
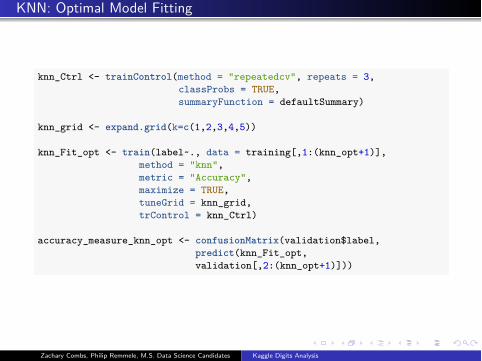
KNN: Optimal Model Fitting
knn_Ctrl <- trainControl(method = "repeatedcv", repeats = 3,classProbs = TRUE,summaryFunction = defaultSummary)
knn_grid <- expand.grid(k=c(1,2,3,4,5))
knn_Fit_opt <- train(label~., data = training[,1:(knn_opt+1)],method = "knn",metric = "Accuracy",maximize = TRUE,tuneGrid = knn_grid,trControl = knn_Ctrl)
accuracy_measure_knn_opt <- confusionMatrix(validation$label,predict(knn_Fit_opt,validation[,2:(knn_opt+1)]))
Zachary Combs, Philip Remmele, M.S. Data Science Candidates Kaggle Digits Analysis
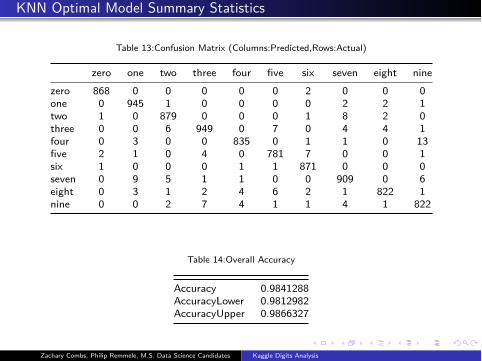
KNN Optimal Model Summary Statistics
Table 13:Confusion Matrix (Columns:Predicted,Rows:Actual)
zero one two three four five six seven eight nine
zero 868 0 0 0 0 0 2 0 0 0
one 0 945 1 0 0 0 0 2 2 1
two 1 0 879 0 0 0 1 8 2 0
three 0 0 6 949 0 7 0 4 4 1
four 0 3 0 0 835 0 1 1 0 13
five 2 1 0 4 0 781 7 0 0 1
six 1 0 0 0 1 1 871 0 0 0
seven 0 9 5 1 1 0 0 909 0 6
eight 0 3 1 2 4 6 2 1 822 1
nine 0 0 2 7 4 1 1 4 1 822
Table 14:Overall Accuracy
Accuracy 0.9841288
AccuracyLower 0.9812982
AccuracyUpper 0.9866327
Zachary Combs, Philip Remmele, M.S. Data Science Candidates Kaggle Digits Analysis
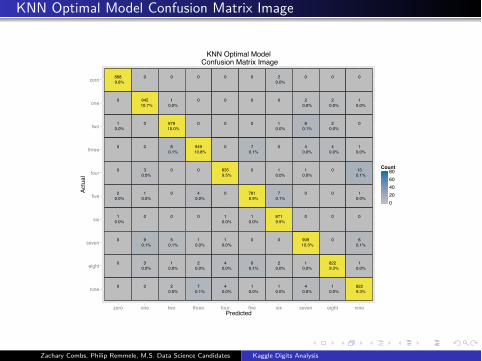
KNN Optimal Model Confusion Matrix Image
868 0 0 0 0 0 2 0 0 0
0 945 1 0 0 0 0 2 2 1
1 0 879 0 0 0 1 8 2 0
0 0 6 949 0 7 0 4 4 1
0 3 0 0 835 0 1 1 0 13
2 1 0 4 0 781 7 0 0 1
1 0 0 0 1 1 871 0 0 0
0 9 5 1 1 0 0 909 0 6
0 3 1 2 4 6 2 1 822 1
0 0 2 7 4 1 1 4 1 822
9.8% 0.0%
10.7% 0.0% 0.0% 0.0% 0.0%
0.0% 10.0% 0.0% 0.1% 0.0%
0.1% 10.8% 0.1% 0.0% 0.0% 0.0%
0.0% 9.5% 0.0% 0.0% 0.1%
0.0% 0.0% 0.0% 8.9% 0.1% 0.0%
0.0% 0.0% 0.0% 9.9%
0.1% 0.1% 0.0% 0.0% 10.3% 0.1%
0.0% 0.0% 0.0% 0.0% 0.1% 0.0% 0.0% 9.3% 0.0%
0.0% 0.1% 0.0% 0.0% 0.0% 0.0% 0.0% 9.3%nine
eight
seven
six
five
four
three
two
one
zero
zero one two three four five six seven eight ninePredicted
Actu
al
020406080
Count
KNN Optimal Model Confusion Matrix Image
Zachary Combs, Philip Remmele, M.S. Data Science Candidates Kaggle Digits Analysis
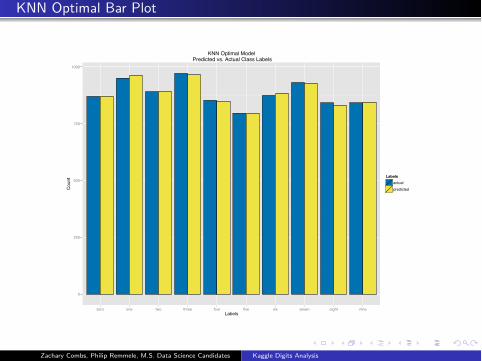
KNN Optimal Bar Plot
0
250
500
750
1000
zero one two three four five six seven eight nineLabels
Coun
t Labelsactualpredicted
KNN Optimal Model Predicted vs. Actual Class Labels
Zachary Combs, Philip Remmele, M.S. Data Science Candidates Kaggle Digits Analysis
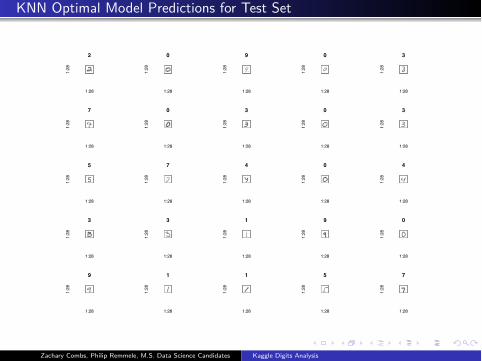
KNN Optimal Model Predictions for Test Set
2
1:28
1:28
0
1:28
1:28
9
1:28
1:28
0
1:28
1:28
3
1:28
1:28
7
1:28
1:28
0
1:281:28
3
1:28
1:28
0
1:28
1:28
3
1:28
1:28
5
1:28
1:28
7
1:28
1:28
4
1:28
1:28
0
1:28
1:28
4
1:28
1:28
3
1:28
1:28
3
1:28
1:28
1
1:28
1:28
9
1:28
1:28
0
1:28
1:28
9
1:28
1:28
1
1:28
1:28
1
1:28
1:28
5
1:28
1:28
7
1:28
1:28
Zachary Combs, Philip Remmele, M.S. Data Science Candidates Kaggle Digits Analysis

KNN Summary Statistics on Manually Labeled Test Set
Table 15:Confusion Matrix (Columns:Predicted,Rows:Actual)
zero one two three four five six seven eight nine
zero 101 0 0 0 0 0 0 0 0 1
one 0 115 0 0 0 0 0 0 0 0
two 0 0 81 0 1 0 0 1 0 0
three 0 0 2 116 0 1 0 1 2 0
four 0 0 0 0 105 0 0 0 0 3
five 0 0 0 0 0 95 0 0 0 0
six 0 1 0 0 0 2 97 0 0 0
seven 0 1 0 0 1 0 0 99 0 0
eight 0 1 0 0 0 1 0 0 82 2
nine 0 0 0 0 0 1 0 0 1 86
Table 16:Overall Accuracy
Accuracy 0.9770000
AccuracyLower 0.9656877
AccuracyUpper 0.9853654
Zachary Combs, Philip Remmele, M.S. Data Science Candidates Kaggle Digits Analysis
Random Forest
”A random forest is a classifier consisting of a collection of tree-structured
classifiers {h(x , θk ), k = 1} where the {θk} are independent identically
distributed random vectors and each tree casts a unit vote for the most
popular class input x.” [Breiman, 2001]
Zachary Combs, Philip Remmele, M.S. Data Science Candidates Kaggle Digits Analysis
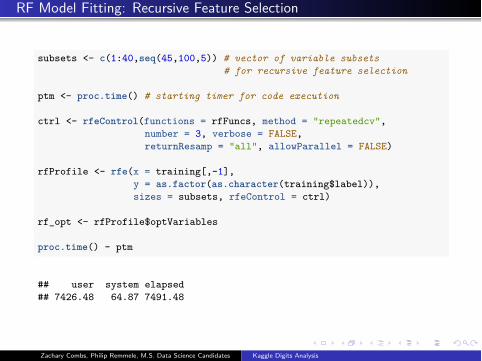
RF Model Fitting: Recursive Feature Selection
subsets <- c(1:40,seq(45,100,5)) # vector of variable subsets# for recursive feature selection
ptm <- proc.time() # starting timer for code execution
ctrl <- rfeControl(functions = rfFuncs, method = "repeatedcv",number = 3, verbose = FALSE,returnResamp = "all", allowParallel = FALSE)
rfProfile <- rfe(x = training[,-1],y = as.factor(as.character(training$label)),sizes = subsets, rfeControl = ctrl)
rf_opt <- rfProfile$optVariables
proc.time() - ptm
## user system elapsed## 7426.48 64.87 7491.48
Zachary Combs, Philip Remmele, M.S. Data Science Candidates Kaggle Digits Analysis
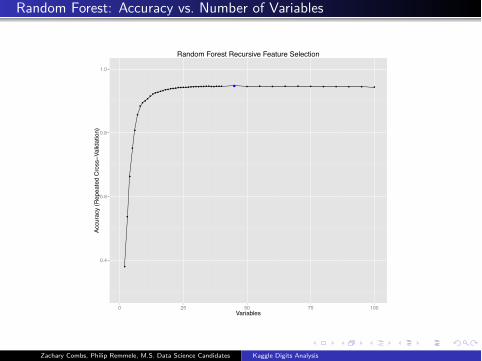
Random Forest: Accuracy vs. Number of Variables
0.4
0.6
0.8
1.0
0 25 50 75 100Variables
Accu
racy
(Rep
eate
d C
ross−V
alid
atio
n)
Random Forest Recursive Feature Selection
Zachary Combs, Philip Remmele, M.S. Data Science Candidates Kaggle Digits Analysis
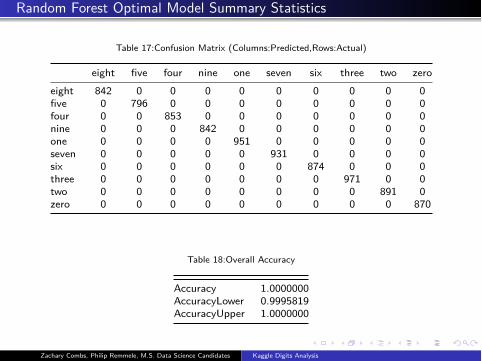
Random Forest Optimal Model Summary Statistics
Table 17:Confusion Matrix (Columns:Predicted,Rows:Actual)
eight five four nine one seven six three two zero
eight 842 0 0 0 0 0 0 0 0 0
five 0 796 0 0 0 0 0 0 0 0
four 0 0 853 0 0 0 0 0 0 0
nine 0 0 0 842 0 0 0 0 0 0
one 0 0 0 0 951 0 0 0 0 0
seven 0 0 0 0 0 931 0 0 0 0
six 0 0 0 0 0 0 874 0 0 0
three 0 0 0 0 0 0 0 971 0 0
two 0 0 0 0 0 0 0 0 891 0
zero 0 0 0 0 0 0 0 0 0 870
Table 18:Overall Accuracy
Accuracy 1.0000000
AccuracyLower 0.9995819
AccuracyUpper 1.0000000
Zachary Combs, Philip Remmele, M.S. Data Science Candidates Kaggle Digits Analysis
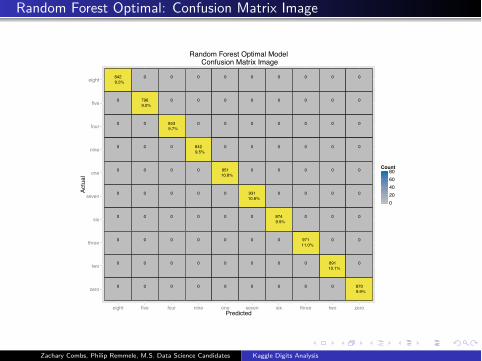
Random Forest Optimal: Confusion Matrix Image
842 0 0 0 0 0 0 0 0 0
0 796 0 0 0 0 0 0 0 0
0 0 853 0 0 0 0 0 0 0
0 0 0 842 0 0 0 0 0 0
0 0 0 0 951 0 0 0 0 0
0 0 0 0 0 931 0 0 0 0
0 0 0 0 0 0 874 0 0 0
0 0 0 0 0 0 0 971 0 0
0 0 0 0 0 0 0 0 891 0
0 0 0 0 0 0 0 0 0 870
9.5%
9.0%
9.7%
9.5%
10.8%
10.6%
9.9%
11.0%
10.1%
9.9%zero
two
three
six
seven
one
nine
four
five
eight
eight five four nine one seven six three two zeroPredicted
Actu
al
020406080
Count
Random Forest Optimal Model Confusion Matrix Image
Zachary Combs, Philip Remmele, M.S. Data Science Candidates Kaggle Digits Analysis
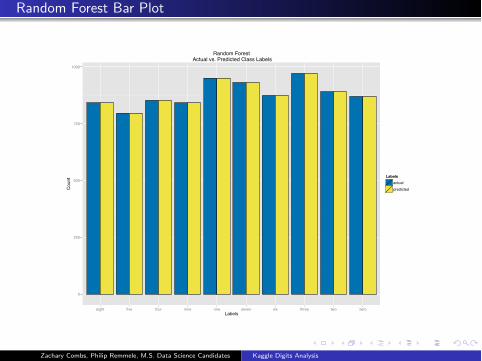
Random Forest Bar Plot
0
250
500
750
1000
eight five four nine one seven six three two zeroLabels
Cou
nt
Labelsactualpredicted
Random Forest Actual vs. Predicted Class Labels
Zachary Combs, Philip Remmele, M.S. Data Science Candidates Kaggle Digits Analysis
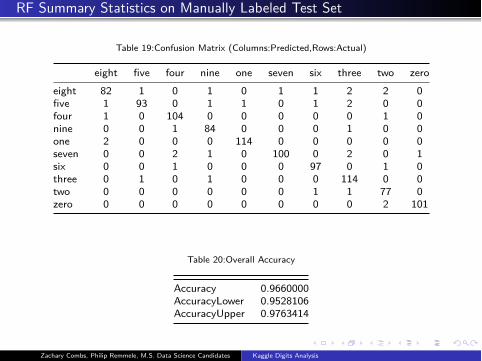
RF Summary Statistics on Manually Labeled Test Set
Table 19:Confusion Matrix (Columns:Predicted,Rows:Actual)
eight five four nine one seven six three two zero
eight 82 1 0 1 0 1 1 2 2 0
five 1 93 0 1 1 0 1 2 0 0
four 1 0 104 0 0 0 0 0 1 0
nine 0 0 1 84 0 0 0 1 0 0
one 2 0 0 0 114 0 0 0 0 0
seven 0 0 2 1 0 100 0 2 0 1
six 0 0 1 0 0 0 97 0 1 0
three 0 1 0 1 0 0 0 114 0 0
two 0 0 0 0 0 0 1 1 77 0
zero 0 0 0 0 0 0 0 0 2 101
Table 20:Overall Accuracy
Accuracy 0.9660000
AccuracyLower 0.9528106
AccuracyUpper 0.9763414
Zachary Combs, Philip Remmele, M.S. Data Science Candidates Kaggle Digits Analysis
Conditional Inference Tree
General Recursive Partitioning Tree
1. Perform an exhaustive search over all possible splits
2. Maximize information measure of node impurity
3. Select covariate split that maximized this measure
CTREE
1. In each node the partial hypotheses Hj
o : D(Y |Xj ) = D(Y ) is tested against the
global null hypothesis of H0 =�
m
j=1 Hj
0.
2. If the global hypothesis can be rejected then the association between Y and eachof the covariates Xj , j = 1...,m is measured by P-value.
3. If we are unable to reject H0 at the specified α then recursion is stopped.[Hothorn, 2006]
Zachary Combs, Philip Remmele, M.S. Data Science Candidates Kaggle Digits Analysis
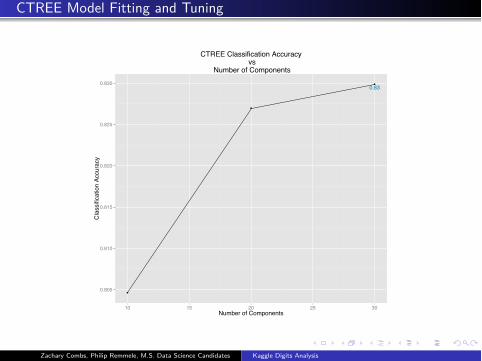
CTREE Model Fitting and Tuning
0.83
0.805
0.810
0.815
0.820
0.825
0.830
10 15 20 25 30Number of Components
Cla
ssifi
catio
n Ac
cura
cy
CTREE Classification Accuracy vs
Number of Components
Zachary Combs, Philip Remmele, M.S. Data Science Candidates Kaggle Digits Analysis
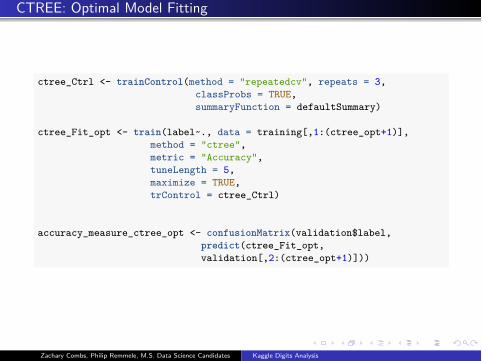
CTREE: Optimal Model Fitting
ctree_Ctrl <- trainControl(method = "repeatedcv", repeats = 3,classProbs = TRUE,summaryFunction = defaultSummary)
ctree_Fit_opt <- train(label~., data = training[,1:(ctree_opt+1)],method = "ctree",metric = "Accuracy",tuneLength = 5,maximize = TRUE,trControl = ctree_Ctrl)
accuracy_measure_ctree_opt <- confusionMatrix(validation$label,predict(ctree_Fit_opt,validation[,2:(ctree_opt+1)]))
Zachary Combs, Philip Remmele, M.S. Data Science Candidates Kaggle Digits Analysis
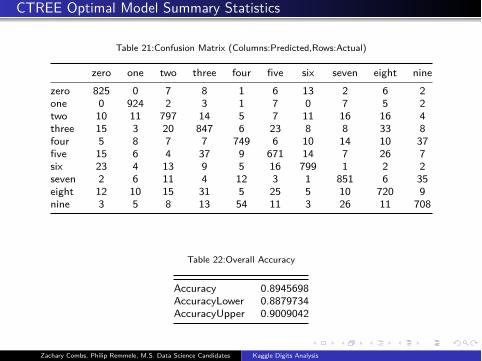
CTREE Optimal Model Summary Statistics
Table 21:Confusion Matrix (Columns:Predicted,Rows:Actual)
zero one two three four five six seven eight nine
zero 825 0 7 8 1 6 13 2 6 2
one 0 924 2 3 1 7 0 7 5 2
two 10 11 797 14 5 7 11 16 16 4
three 15 3 20 847 6 23 8 8 33 8
four 5 8 7 7 749 6 10 14 10 37
five 15 6 4 37 9 671 14 7 26 7
six 23 4 13 9 5 16 799 1 2 2
seven 2 6 11 4 12 3 1 851 6 35
eight 12 10 15 31 5 25 5 10 720 9
nine 3 5 8 13 54 11 3 26 11 708
Table 22:Overall Accuracy
Accuracy 0.8945698
AccuracyLower 0.8879734
AccuracyUpper 0.9009042
Zachary Combs, Philip Remmele, M.S. Data Science Candidates Kaggle Digits Analysis
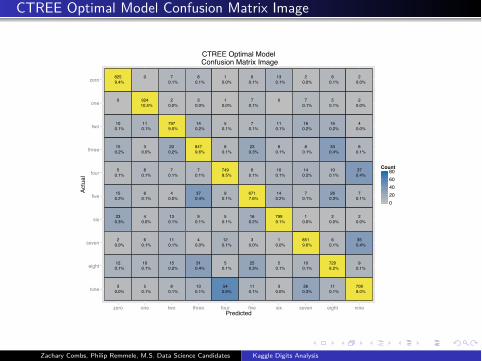
CTREE Optimal Model Confusion Matrix Image
825 0 7 8 1 6 13 2 6 2
0 924 2 3 1 7 0 7 5 2
10 11 797 14 5 7 11 16 16 4
15 3 20 847 6 23 8 8 33 8
5 8 7 7 749 6 10 14 10 37
15 6 4 37 9 671 14 7 26 7
23 4 13 9 5 16 799 1 2 2
2 6 11 4 12 3 1 851 6 35
12 10 15 31 5 25 5 10 720 9
3 5 8 13 54 11 3 26 11 708
9.4% 0.1% 0.1% 0.0% 0.1% 0.1% 0.0% 0.1% 0.0%
10.5% 0.0% 0.0% 0.0% 0.1% 0.1% 0.1% 0.0%
0.1% 0.1% 9.0% 0.2% 0.1% 0.1% 0.1% 0.2% 0.2% 0.0%
0.2% 0.0% 0.2% 9.6% 0.1% 0.3% 0.1% 0.1% 0.4% 0.1%
0.1% 0.1% 0.1% 0.1% 8.5% 0.1% 0.1% 0.2% 0.1% 0.4%
0.2% 0.1% 0.0% 0.4% 0.1% 7.6% 0.2% 0.1% 0.3% 0.1%
0.3% 0.0% 0.1% 0.1% 0.1% 0.2% 9.1% 0.0% 0.0% 0.0%
0.0% 0.1% 0.1% 0.0% 0.1% 0.0% 0.0% 9.6% 0.1% 0.4%
0.1% 0.1% 0.2% 0.4% 0.1% 0.3% 0.1% 0.1% 8.2% 0.1%
0.0% 0.1% 0.1% 0.1% 0.6% 0.1% 0.0% 0.3% 0.1% 8.0%nine
eight
seven
six
five
four
three
two
one
zero
zero one two three four five six seven eight ninePredicted
Actu
al
020406080
Count
CTREE Optimal Model Confusion Matrix Image
Zachary Combs, Philip Remmele, M.S. Data Science Candidates Kaggle Digits Analysis
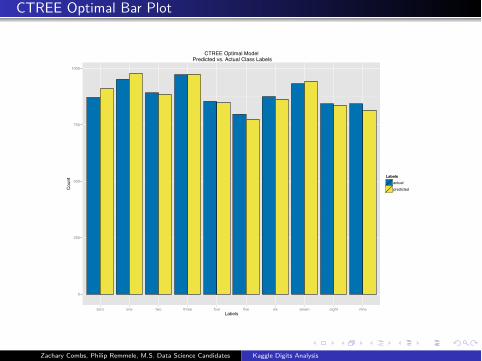
CTREE Optimal Bar Plot
0
250
500
750
1000
zero one two three four five six seven eight nineLabels
Coun
t Labelsactualpredicted
CTREE Optimal Model Predicted vs. Actual Class Labels
Zachary Combs, Philip Remmele, M.S. Data Science Candidates Kaggle Digits Analysis
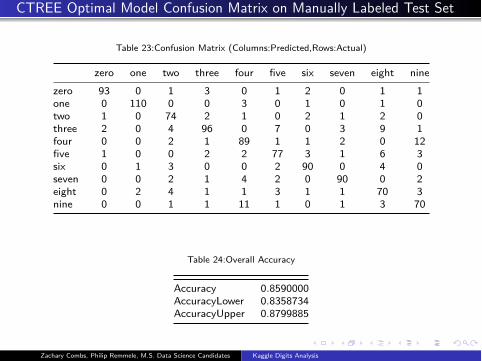
CTREE Optimal Model Confusion Matrix on Manually Labeled Test Set
Table 23:Confusion Matrix (Columns:Predicted,Rows:Actual)
zero one two three four five six seven eight nine
zero 93 0 1 3 0 1 2 0 1 1
one 0 110 0 0 3 0 1 0 1 0
two 1 0 74 2 1 0 2 1 2 0
three 2 0 4 96 0 7 0 3 9 1
four 0 0 2 1 89 1 1 2 0 12
five 1 0 0 2 2 77 3 1 6 3
six 0 1 3 0 0 2 90 0 4 0
seven 0 0 2 1 4 2 0 90 0 2
eight 0 2 4 1 1 3 1 1 70 3
nine 0 0 1 1 11 1 0 1 3 70
Table 24:Overall Accuracy
Accuracy 0.8590000
AccuracyLower 0.8358734
AccuracyUpper 0.8799885
Zachary Combs, Philip Remmele, M.S. Data Science Candidates Kaggle Digits Analysis
Multinomial Logistic Regression
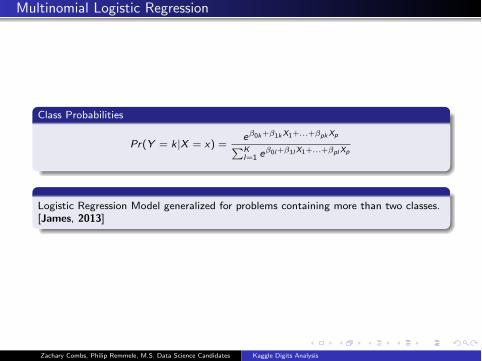
Class Probabilities
Pr(Y = k|X = x) =eβ0k+β1kX1+...+βpkXp
�K
l=1eβ0l+β1l X1+...+βpl Xp
Logistic Regression Model generalized for problems containing more than two classes.
[James, 2013]
Zachary Combs, Philip Remmele, M.S. Data Science Candidates Kaggle Digits Analysis
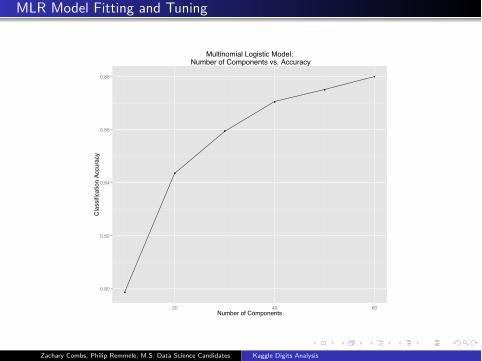
MLR Model Fitting and Tuning
0.80
0.82
0.84
0.86
0.88
20 40 60Number of Components
Cla
ssifi
catio
n Ac
cura
cy
Multinomial Logistic Model: Number of Components vs. Accuracy
Zachary Combs, Philip Remmele, M.S. Data Science Candidates Kaggle Digits Analysis
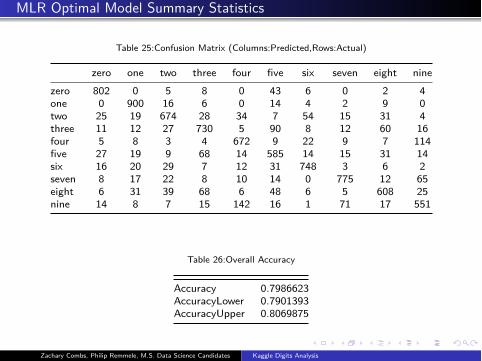
MLR Optimal Model Summary Statistics
Table 25:Confusion Matrix (Columns:Predicted,Rows:Actual)
zero one two three four five six seven eight nine
zero 802 0 5 8 0 43 6 0 2 4
one 0 900 16 6 0 14 4 2 9 0
two 25 19 674 28 34 7 54 15 31 4
three 11 12 27 730 5 90 8 12 60 16
four 5 8 3 4 672 9 22 9 7 114
five 27 19 9 68 14 585 14 15 31 14
six 16 20 29 7 12 31 748 3 6 2
seven 8 17 22 8 10 14 0 775 12 65
eight 6 31 39 68 6 48 6 5 608 25
nine 14 8 7 15 142 16 1 71 17 551
Table 26:Overall Accuracy
Accuracy 0.7986623
AccuracyLower 0.7901393
AccuracyUpper 0.8069875
Zachary Combs, Philip Remmele, M.S. Data Science Candidates Kaggle Digits Analysis
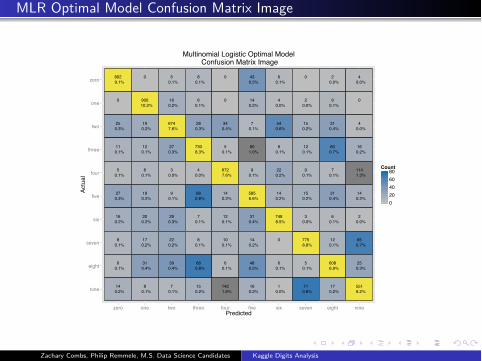
MLR Optimal Model Confusion Matrix Image
802 0 5 8 0 43 6 0 2 4
0 900 16 6 0 14 4 2 9 0
25 19 674 28 34 7 54 15 31 4
11 12 27 730 5 90 8 12 60 16
5 8 3 4 672 9 22 9 7 114
27 19 9 68 14 585 14 15 31 14
16 20 29 7 12 31 748 3 6 2
8 17 22 8 10 14 0 775 12 65
6 31 39 68 6 48 6 5 608 25
14 8 7 15 142 16 1 71 17 551
9.1% 0.1% 0.1% 0.5% 0.1% 0.0% 0.0%
10.2% 0.2% 0.1% 0.2% 0.0% 0.0% 0.1%
0.3% 0.2% 7.6% 0.3% 0.4% 0.1% 0.6% 0.2% 0.4% 0.0%
0.1% 0.1% 0.3% 8.3% 0.1% 1.0% 0.1% 0.1% 0.7% 0.2%
0.1% 0.1% 0.0% 0.0% 7.6% 0.1% 0.2% 0.1% 0.1% 1.3%
0.3% 0.2% 0.1% 0.8% 0.2% 6.6% 0.2% 0.2% 0.4% 0.2%
0.2% 0.2% 0.3% 0.1% 0.1% 0.4% 8.5% 0.0% 0.1% 0.0%
0.1% 0.2% 0.2% 0.1% 0.1% 0.2% 8.8% 0.1% 0.7%
0.1% 0.4% 0.4% 0.8% 0.1% 0.5% 0.1% 0.1% 6.9% 0.3%
0.2% 0.1% 0.1% 0.2% 1.6% 0.2% 0.0% 0.8% 0.2% 6.2%nine
eight
seven
six
five
four
three
two
one
zero
zero one two three four five six seven eight ninePredicted
Actu
al
020406080
Count
Multinomial Logistic Optimal Model Confusion Matrix Image
Zachary Combs, Philip Remmele, M.S. Data Science Candidates Kaggle Digits Analysis
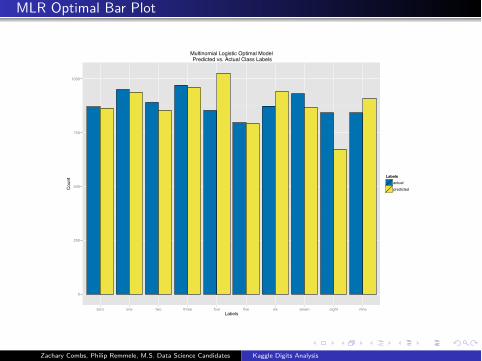
MLR Optimal Bar Plot
0
250
500
750
1000
zero one two three four five six seven eight nineLabels
Coun
t Labelsactualpredicted
Multinomial Logistic Optimal Model Predicted vs. Actual Class Labels
Zachary Combs, Philip Remmele, M.S. Data Science Candidates Kaggle Digits Analysis
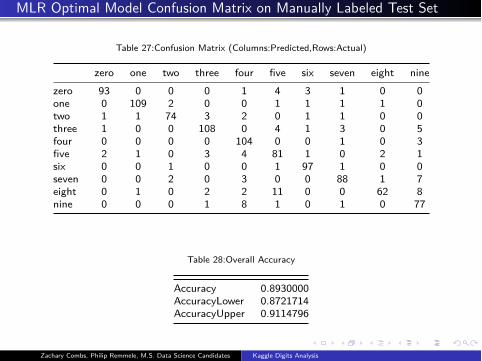
MLR Optimal Model Confusion Matrix on Manually Labeled Test Set
Table 27:Confusion Matrix (Columns:Predicted,Rows:Actual)
zero one two three four five six seven eight nine
zero 93 0 0 0 1 4 3 1 0 0
one 0 109 2 0 0 1 1 1 1 0
two 1 1 74 3 2 0 1 1 0 0
three 1 0 0 108 0 4 1 3 0 5
four 0 0 0 0 104 0 0 1 0 3
five 2 1 0 3 4 81 1 0 2 1
six 0 0 1 0 0 1 97 1 0 0
seven 0 0 2 0 3 0 0 88 1 7
eight 0 1 0 2 2 11 0 0 62 8
nine 0 0 0 1 8 1 0 1 0 77
Table 28:Overall Accuracy
Accuracy 0.8930000
AccuracyLower 0.8721714
AccuracyUpper 0.9114796
Zachary Combs, Philip Remmele, M.S. Data Science Candidates Kaggle Digits Analysis
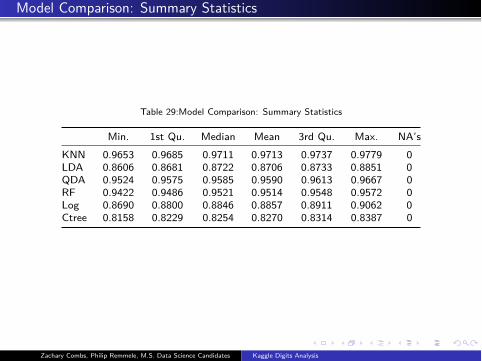
Model Comparison: Summary Statistics
Table 29:Model Comparison: Summary Statistics
Min. 1st Qu. Median Mean 3rd Qu. Max. NA’s
KNN 0.9653 0.9685 0.9711 0.9713 0.9737 0.9779 0
LDA 0.8606 0.8681 0.8722 0.8706 0.8733 0.8851 0
QDA 0.9524 0.9575 0.9585 0.9590 0.9613 0.9667 0
RF 0.9422 0.9486 0.9521 0.9514 0.9548 0.9572 0
Log 0.8690 0.8800 0.8846 0.8857 0.8911 0.9062 0
Ctree 0.8158 0.8229 0.8254 0.8270 0.8314 0.8387 0
Zachary Combs, Philip Remmele, M.S. Data Science Candidates Kaggle Digits Analysis
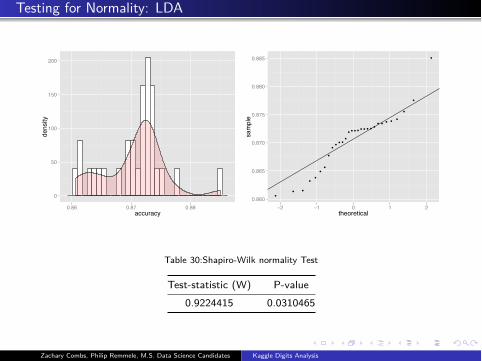
Testing for Normality: LDA
0
50
100
150
200
0.86 0.87 0.88accuracy
density
0.860
0.865
0.870
0.875
0.880
0.885
−2 −1 0 1 2theoretical
sample
Table 30:Shapiro-Wilk normality Test
Test-statistic (W) P-value
0.9224415 0.0310465
Zachary Combs, Philip Remmele, M.S. Data Science Candidates Kaggle Digits Analysis
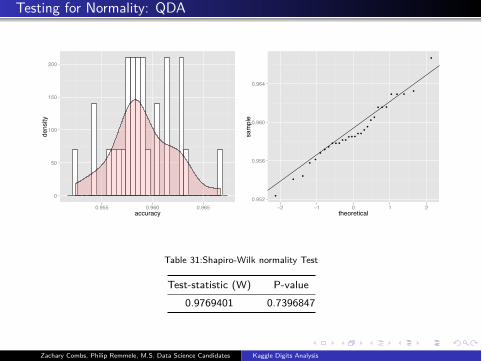
Testing for Normality: QDA
0
50
100
150
200
0.955 0.960 0.965accuracy
density
0.952
0.956
0.960
0.964
−2 −1 0 1 2theoretical
sample
Table 31:Shapiro-Wilk normality Test
Test-statistic (W) P-value
0.9769401 0.7396847
Zachary Combs, Philip Remmele, M.S. Data Science Candidates Kaggle Digits Analysis
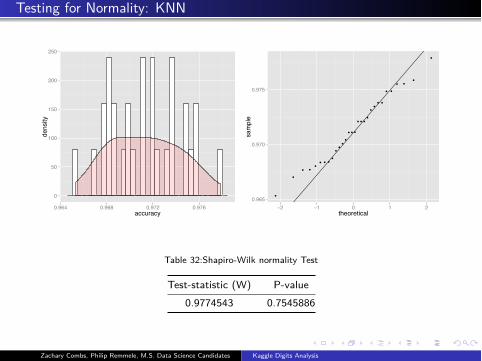
Testing for Normality: KNN
0
50
100
150
200
250
0.964 0.968 0.972 0.976accuracy
density
0.965
0.970
0.975
−2 −1 0 1 2theoretical
sample
Table 32:Shapiro-Wilk normality Test
Test-statistic (W) P-value
0.9774543 0.7545886
Zachary Combs, Philip Remmele, M.S. Data Science Candidates Kaggle Digits Analysis
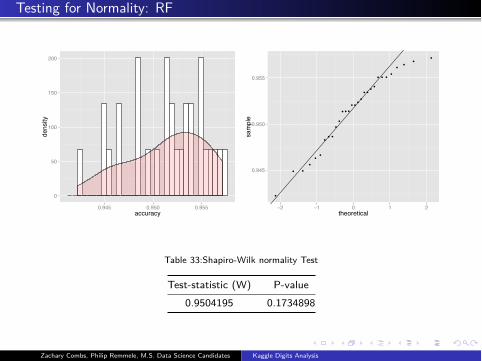
Testing for Normality: RF
0
50
100
150
200
0.945 0.950 0.955accuracy
density
0.945
0.950
0.955
−2 −1 0 1 2theoretical
sample
Table 33:Shapiro-Wilk normality Test
Test-statistic (W) P-value
0.9504195 0.1734898
Zachary Combs, Philip Remmele, M.S. Data Science Candidates Kaggle Digits Analysis
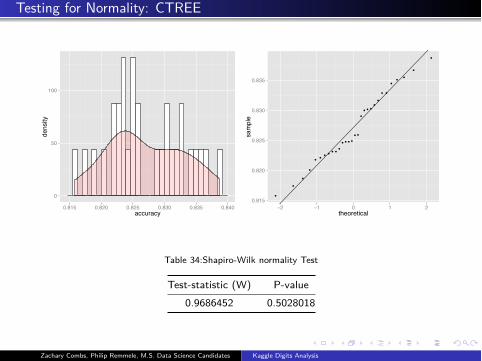
Testing for Normality: CTREE
0
50
100
0.815 0.820 0.825 0.830 0.835 0.840accuracy
density
0.815
0.820
0.825
0.830
0.835
−2 −1 0 1 2theoretical
sample
Table 34:Shapiro-Wilk normality Test
Test-statistic (W) P-value
0.9686452 0.5028018
Zachary Combs, Philip Remmele, M.S. Data Science Candidates Kaggle Digits Analysis
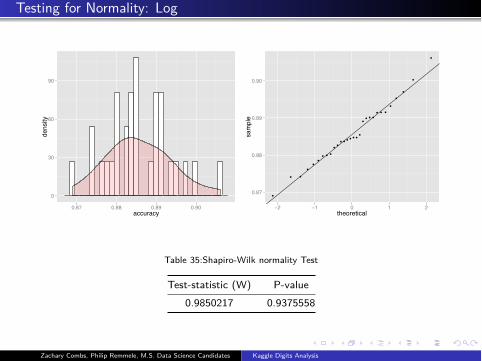
Testing for Normality: Log
0
30
60
90
0.87 0.88 0.89 0.90accuracy
density
0.87
0.88
0.89
0.90
−2 −1 0 1 2theoretical
sample
Table 35:Shapiro-Wilk normality Test
Test-statistic (W) P-value
0.9850217 0.9375558
Zachary Combs, Philip Remmele, M.S. Data Science Candidates Kaggle Digits Analysis
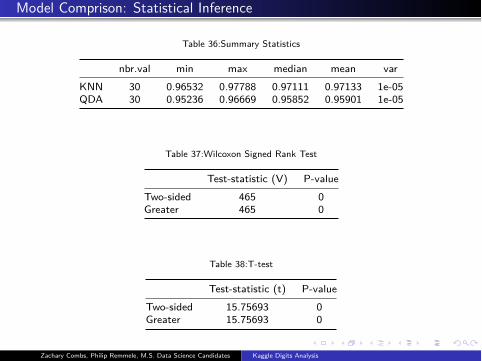
Model Comprison: Statistical Inference
Table 36:Summary Statistics
nbr.val min max median mean var
KNN 30 0.96532 0.97788 0.97111 0.97133 1e-05
QDA 30 0.95236 0.96669 0.95852 0.95901 1e-05
Table 37:Wilcoxon Signed Rank Test
Test-statistic (V) P-value
Two-sided 465 0
Greater 465 0
Table 38:T-test
Test-statistic (t) P-value
Two-sided 15.75693 0
Greater 15.75693 0
Zachary Combs, Philip Remmele, M.S. Data Science Candidates Kaggle Digits Analysis
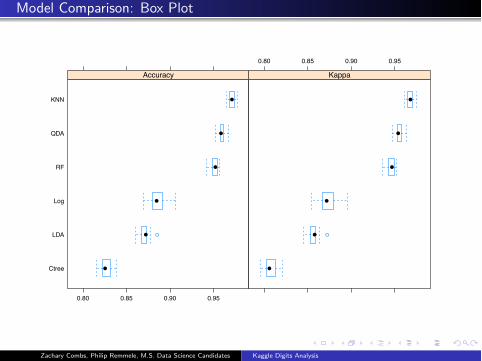
Model Comparison: Box Plot
Ctree
LDA
Log
RF
QDA
KNN
0.80 0.85 0.90 0.95
Accuracy
0.80 0.85 0.90 0.95
Kappa
Zachary Combs, Philip Remmele, M.S. Data Science Candidates Kaggle Digits Analysis
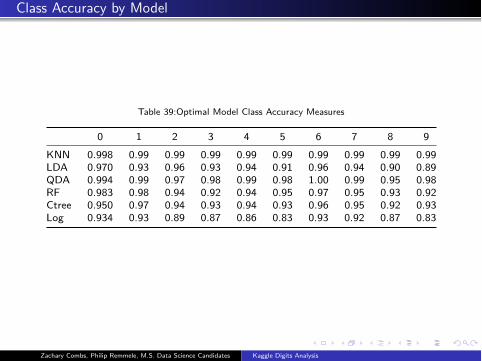
Class Accuracy by Model
Table 39:Optimal Model Class Accuracy Measures
0 1 2 3 4 5 6 7 8 9
KNN 0.998 0.99 0.99 0.99 0.99 0.99 0.99 0.99 0.99 0.99
LDA 0.970 0.93 0.96 0.93 0.94 0.91 0.96 0.94 0.90 0.89
QDA 0.994 0.99 0.97 0.98 0.99 0.98 1.00 0.99 0.95 0.98
RF 0.983 0.98 0.94 0.92 0.94 0.95 0.97 0.95 0.93 0.92
Ctree 0.950 0.97 0.94 0.93 0.94 0.93 0.96 0.95 0.92 0.93
Log 0.934 0.93 0.89 0.87 0.86 0.83 0.93 0.92 0.87 0.83
Zachary Combs, Philip Remmele, M.S. Data Science Candidates Kaggle Digits Analysis
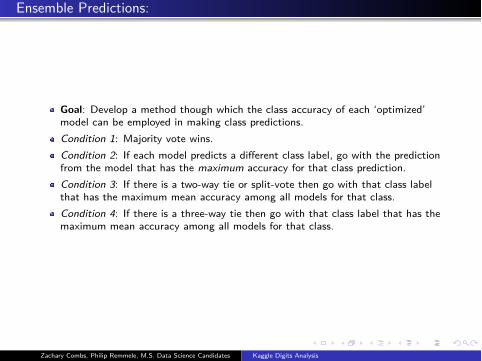
Ensemble Predictions:
Goal: Develop a method though which the class accuracy of each ‘optimized’
model can be employed in making class predictions.
Condition 1: Majority vote wins.
Condition 2: If each model predicts a different class label, go with the prediction
from the model that has the maximum accuracy for that class prediction.
Condition 3: If there is a two-way tie or split-vote then go with that class label
that has the maximum mean accuracy among all models for that class.
Condition 4: If there is a three-way tie then go with that class label that has the
maximum mean accuracy among all models for that class.
Zachary Combs, Philip Remmele, M.S. Data Science Candidates Kaggle Digits Analysis
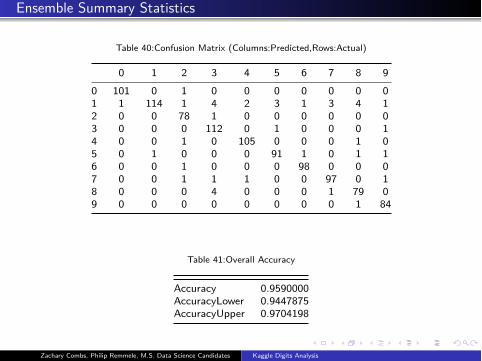
Ensemble Summary Statistics
Table 40:Confusion Matrix (Columns:Predicted,Rows:Actual)
0 1 2 3 4 5 6 7 8 9
0 101 0 1 0 0 0 0 0 0 0
1 1 114 1 4 2 3 1 3 4 1
2 0 0 78 1 0 0 0 0 0 0
3 0 0 0 112 0 1 0 0 0 1
4 0 0 1 0 105 0 0 0 1 0
5 0 1 0 0 0 91 1 0 1 1
6 0 0 1 0 0 0 98 0 0 0
7 0 0 1 1 1 0 0 97 0 1
8 0 0 0 4 0 0 0 1 79 0
9 0 0 0 0 0 0 0 0 1 84
Table 41:Overall Accuracy
Accuracy 0.9590000
AccuracyLower 0.9447875
AccuracyUpper 0.9704198
Zachary Combs, Philip Remmele, M.S. Data Science Candidates Kaggle Digits Analysis
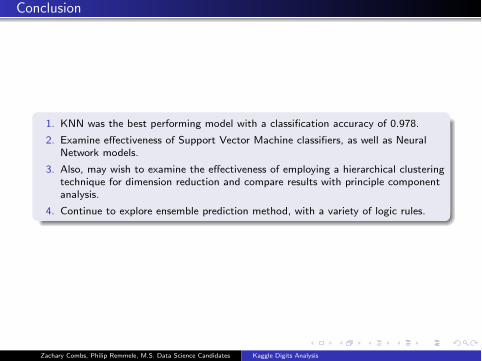
Conclusion
1. KNN was the best performing model with a classification accuracy of 0.978.
2. Examine effectiveness of Support Vector Machine classifiers, as well as NeuralNetwork models.
3. Also, may wish to examine the effectiveness of employing a hierarchical clusteringtechnique for dimension reduction and compare results with principle componentanalysis.
4. Continue to explore ensemble prediction method, with a variety of logic rules.
Zachary Combs, Philip Remmele, M.S. Data Science Candidates Kaggle Digits Analysis
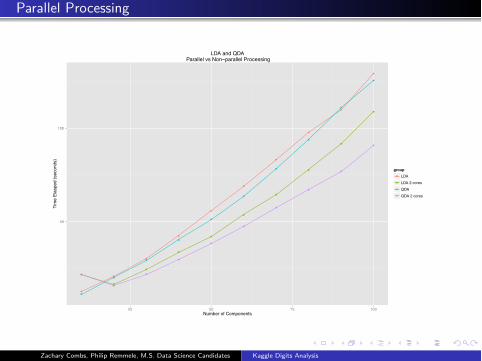
Parallel Processing
50
100
25 50 75 100Number of Components
Tim
e El
aspe
d (s
econ
ds)
groupLDALDA 2 coresQDAQDA 2 cores
LDA and QDA Parallel vs Non−parallel Processing
Zachary Combs, Philip Remmele, M.S. Data Science Candidates Kaggle Digits Analysis
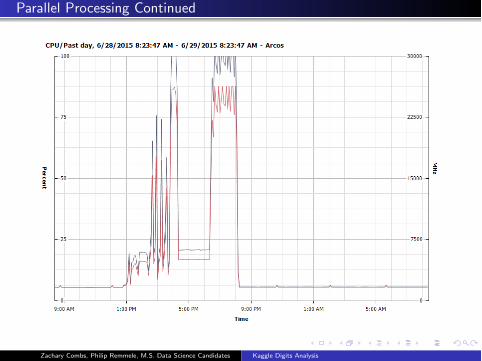
Parallel Processing Continued
Zachary Combs, Philip Remmele, M.S. Data Science Candidates Kaggle Digits Analysis
References
Breiman, L. (2001). ”Random forests.” Machine learning 45(1): 5-32.
Hothorn, T., et al. (2006). ”Unbiased recursive partitioning: A conditional inference
framework.” Journal of Computational and Graphical statistics 15(3): 651-674.
James, G., et al. (2013). An introduction to statistical learning, Springer.
Kuhn, M. and K. Johnson (2013). Applied predictive Modeling, Springer.
Zachary Combs, Philip Remmele, M.S. Data Science Candidates Kaggle Digits Analysis