Embed Size (px)
Citation preview
Previously known as
Think Big. Move Fast.
Iris Multi-Class Classifier with Azure ML
A friendly tutorial in 10 Steps
V 1.0 – February 2015
Davide Mauri
@mauridb
About this tutorial
• The objective of this tutorial is to show how to use the original IRIS Dataset with AzureML for multiclass classification• On AzureML the existing dataset is limited to a binary classification…• …but the original one is much more interesting!
• We’ll publish the trained model as a web service to be used in your applications
• You’ll need a • AzureML Account (free in Preview)
• We’ll use a “Supervised Learning” algorithm• Specifically the we’ll be using a Neural Network
Useful References
• AzureML• https://studio.azureml.net/
• Machine Learning• http://en.wikipedia.org/wiki/Machine_learning
• Supervised Learning• http://en.wikipedia.org/wiki/Supervised_learning
• Neural Networks• http://en.wikipedia.org/wiki/Artificial_neural_network
IRIS Dataset
• Available from UC Irvine Machine Learning Repository• http://archive.ics.uci.edu/ml/datasets/Iris
• Classification of three Iris species, with four features• Sepal Width & Length, Petal Width & Length
• http://en.wikipedia.org/wiki/Iris_flower_data_set
• «This is perhaps the best known database to be found in the pattern recognition literature. […] The data set contains 3 classes of 50 instances each, where each class refers to a type of iris plant. One class is linearly separable from the other 2; the latter are NOT linearly separable from each other.»
UC Irvine Machine Learning Repository
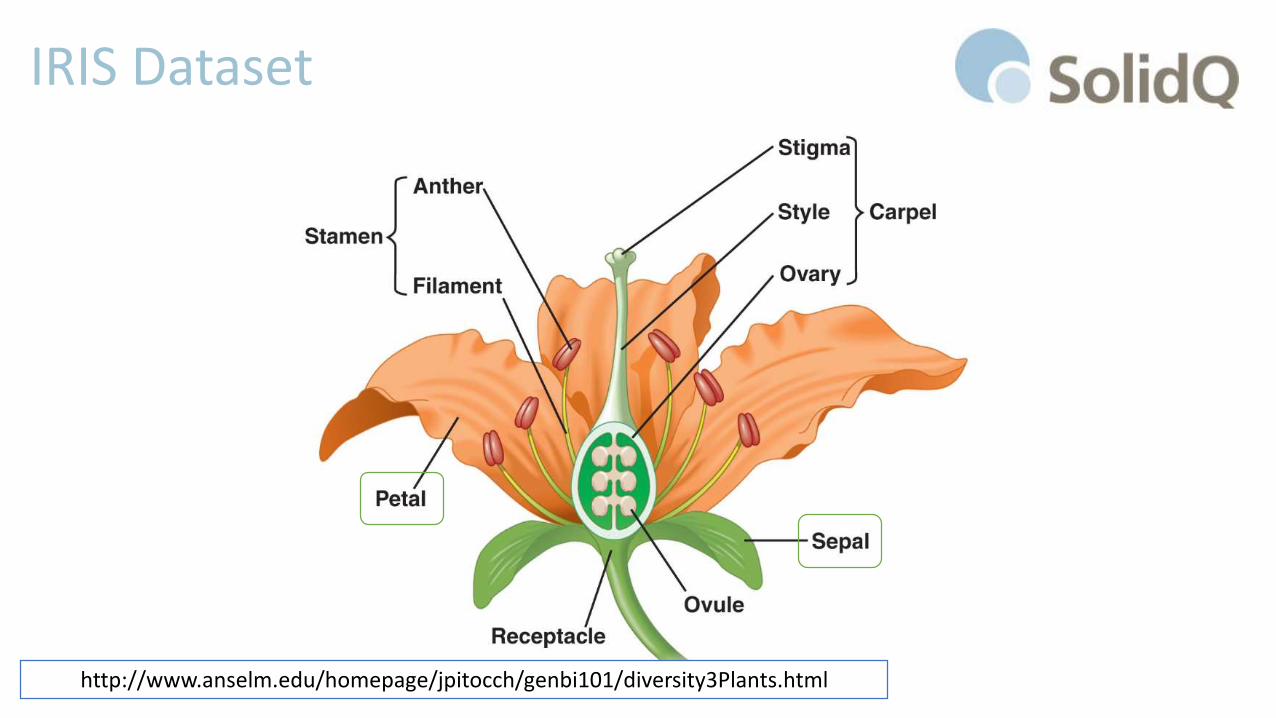
IRIS Dataset
http://www.anselm.edu/homepage/jpitocch/genbi101/diversity3Plants.html
Create The Dataset
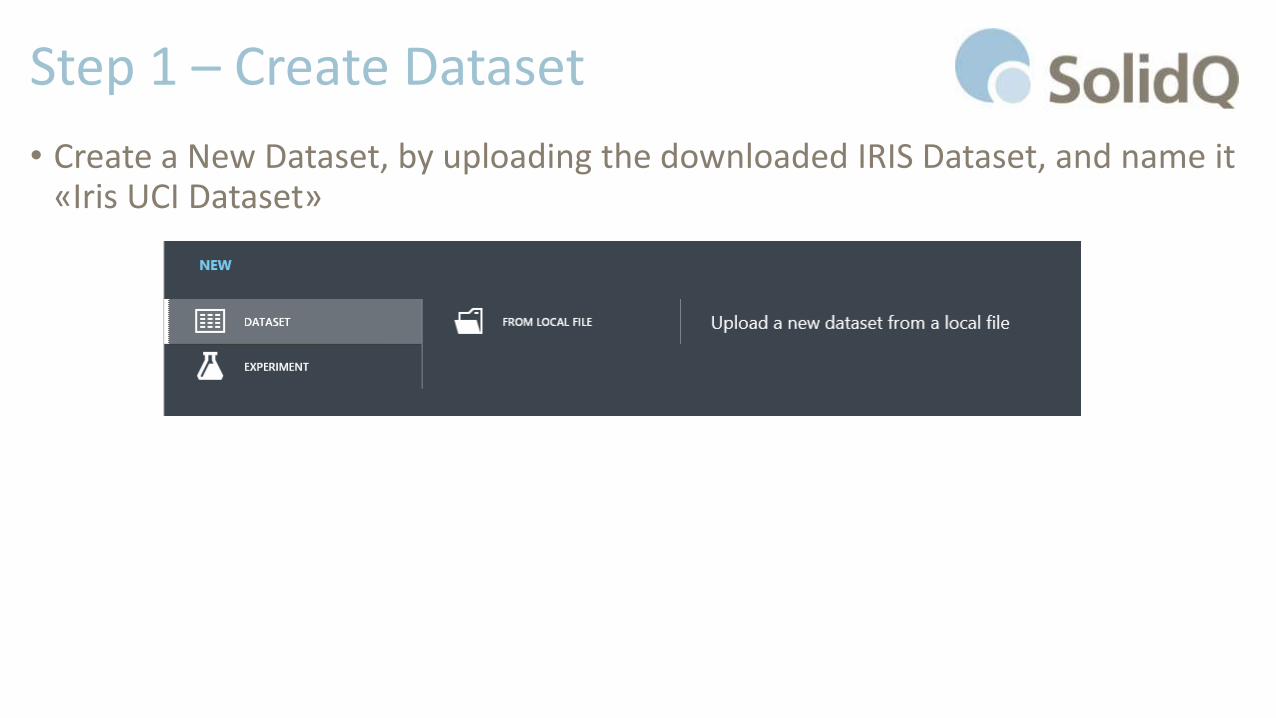
Step 1 – Create Dataset
• Create a New Dataset, by uploading the downloaded IRIS Dataset, and name it «Iris UCI Dataset»

Train the Model
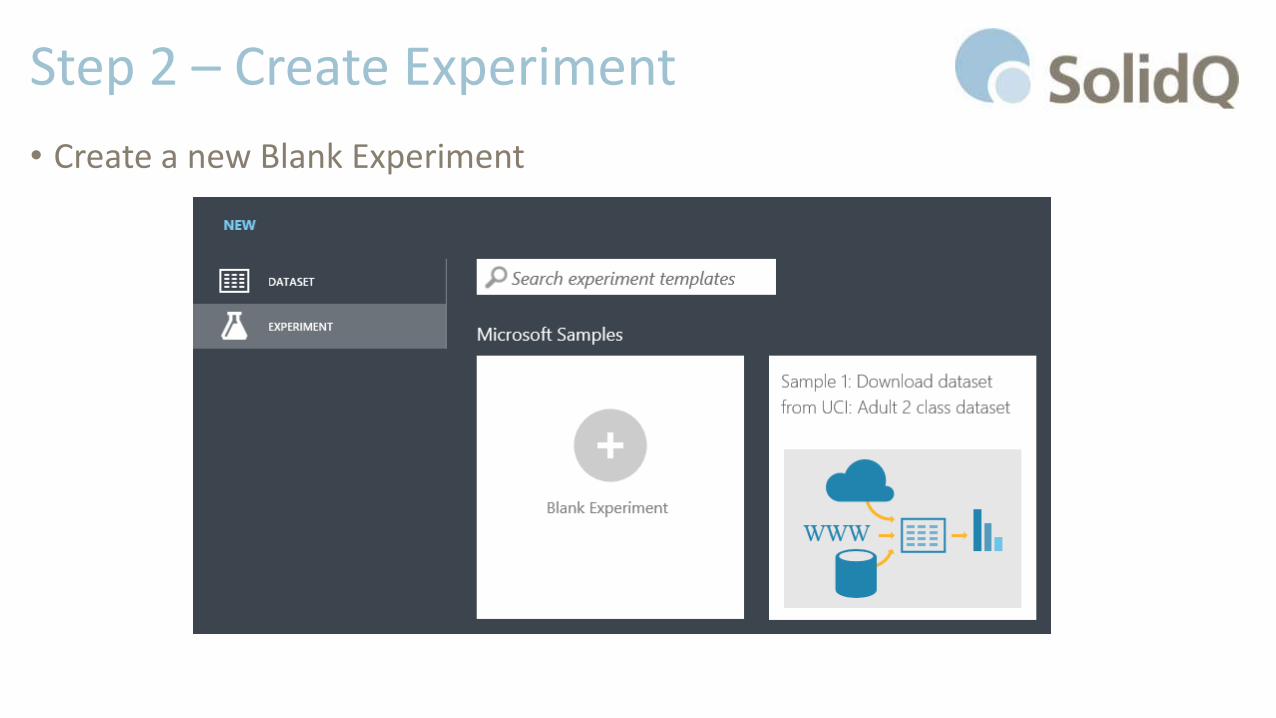
Step 2 – Create Experiment
• Create a new Blank Experiment
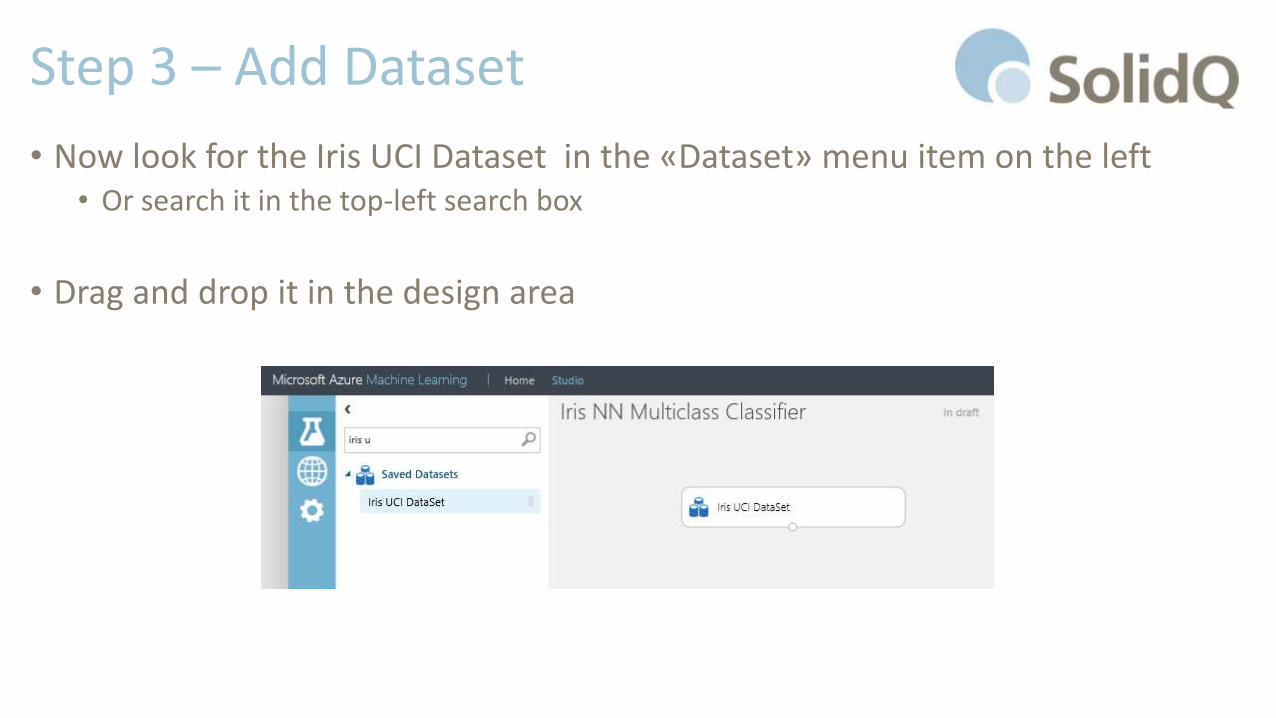
Step 3 – Add Dataset
• Now look for the Iris UCI Dataset in the «Dataset» menu item on the left• Or search it in the top-left search box
• Drag and drop it in the design area
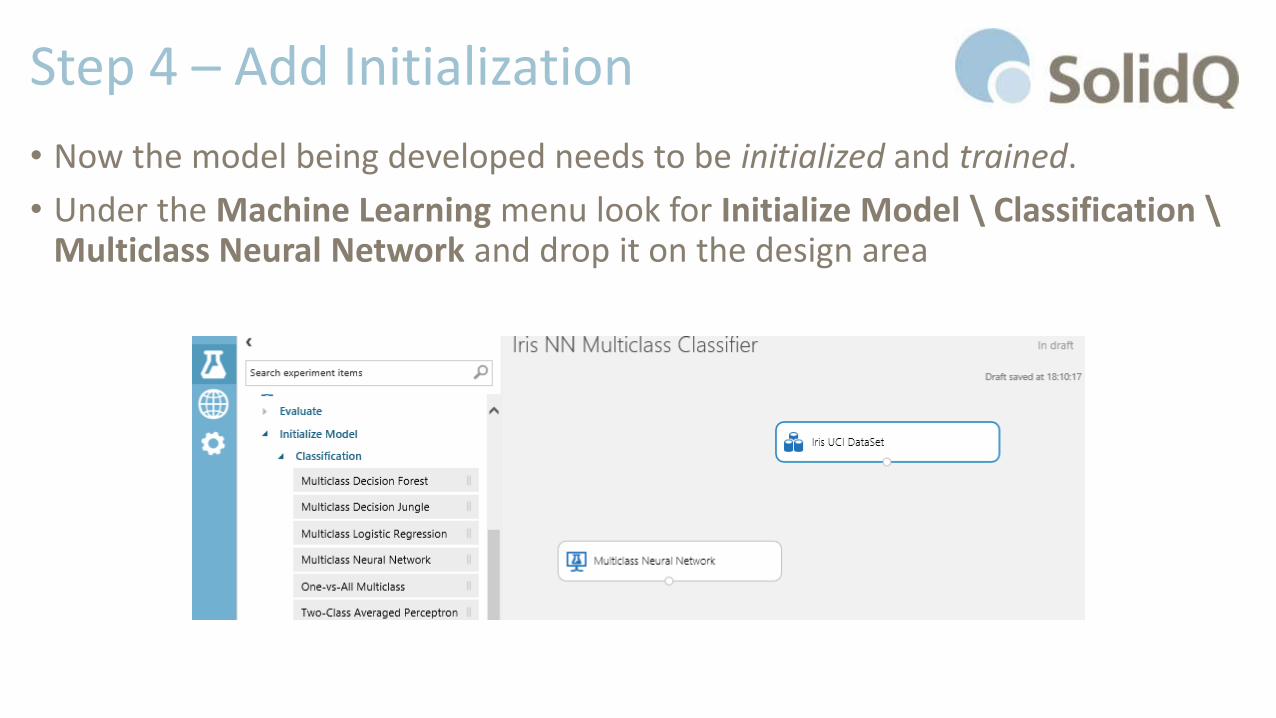
Step 4 – Add Initialization
• Now the model being developed needs to be initialized and trained.
• Under the Machine Learning menu look for Initialize Model \ Classification \Multiclass Neural Network and drop it on the design area
Step 5 – Split Data
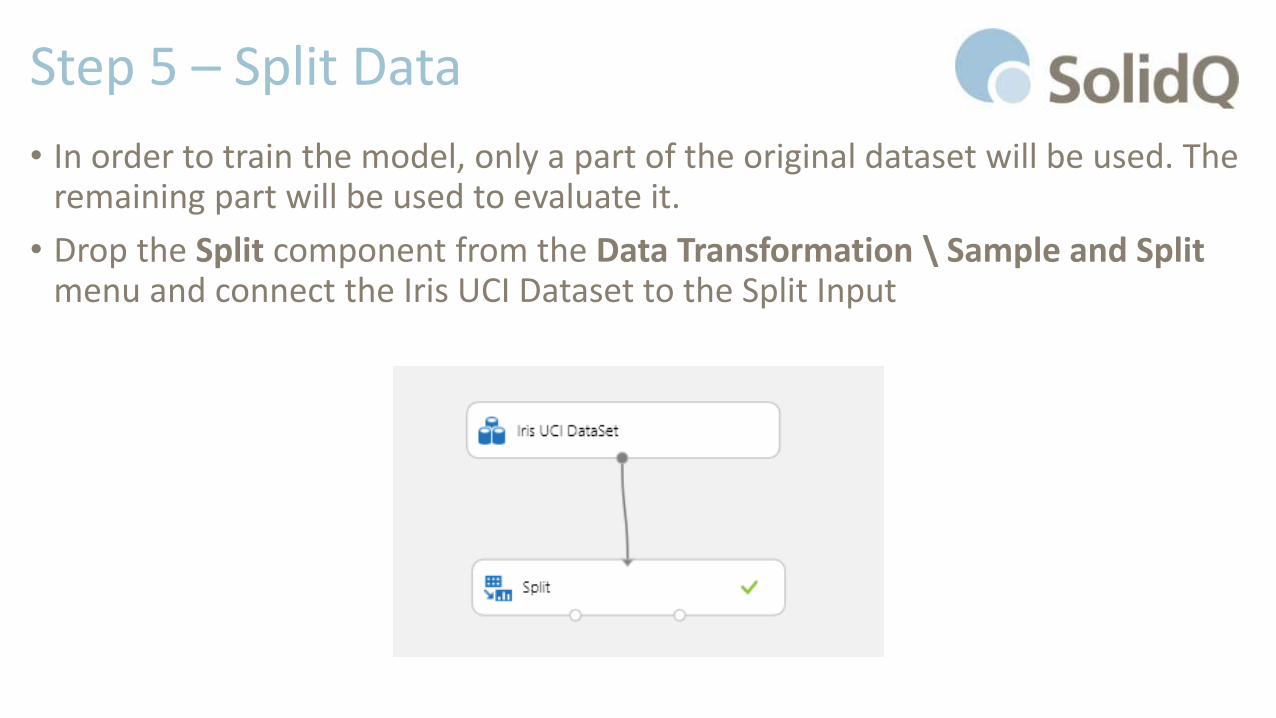
• In order to train the model, only a part of the original dataset will be used. The remaining part will be used to evaluate it.
• Drop the Split component from the Data Transformation \ Sample and Split menu and connect the Iris UCI Dataset to the Split Input
Step 5 – Split Data
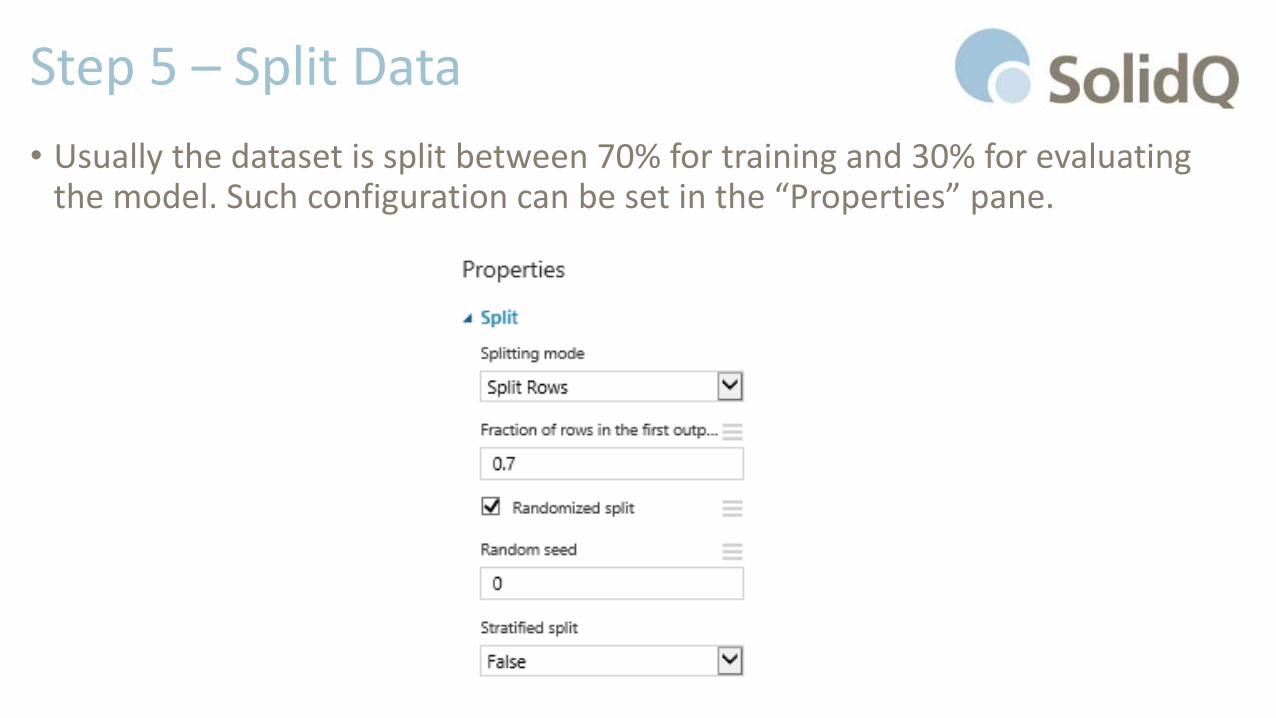
• Usually the dataset is split between 70% for training and 30% for evaluating the model. Such configuration can be set in the “Properties” pane.
Step 6 – Train Model
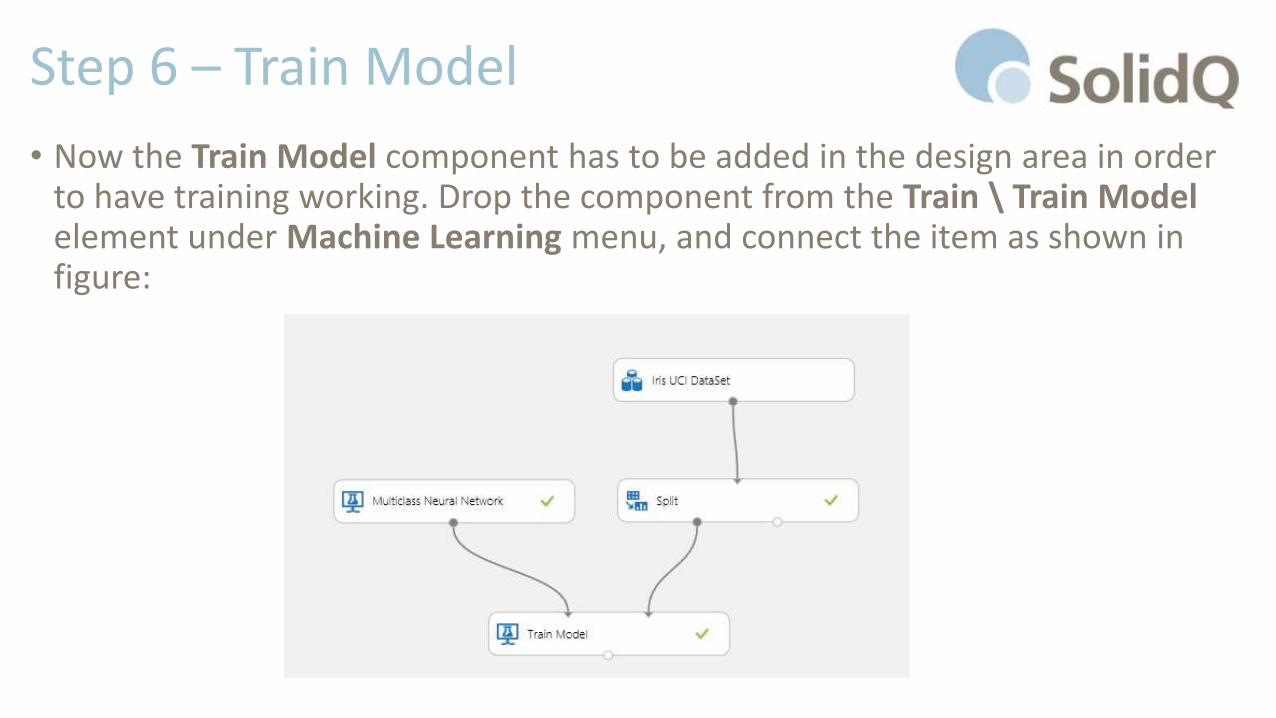
• Now the Train Model component has to be added in the design area in order to have training working. Drop the component from the Train \ Train Model element under Machine Learning menu, and connect the item as shown in figure:
Step 6 – Train Model
• Now select which column will be used as predictors. The Iris Dataset has 5 columns• sepal length in cm
• sepal width in cm
• petal length in cm
• petal width in cm
• class
• The class column contains the value that we want to be predicted based on the value of the others four columns
Step 6 – Train Model
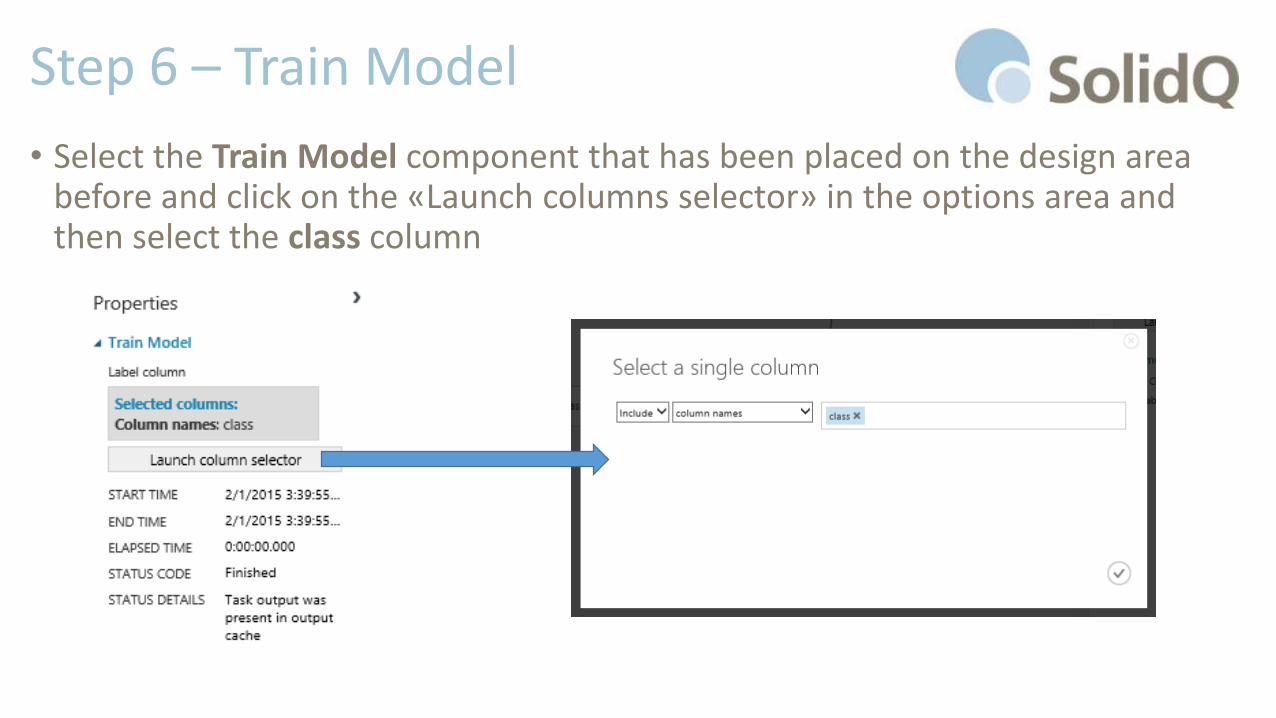
• Select the Train Model component that has been placed on the design area before and click on the «Launch columns selector» in the options area and then select the class column
Step 6 – Train Model
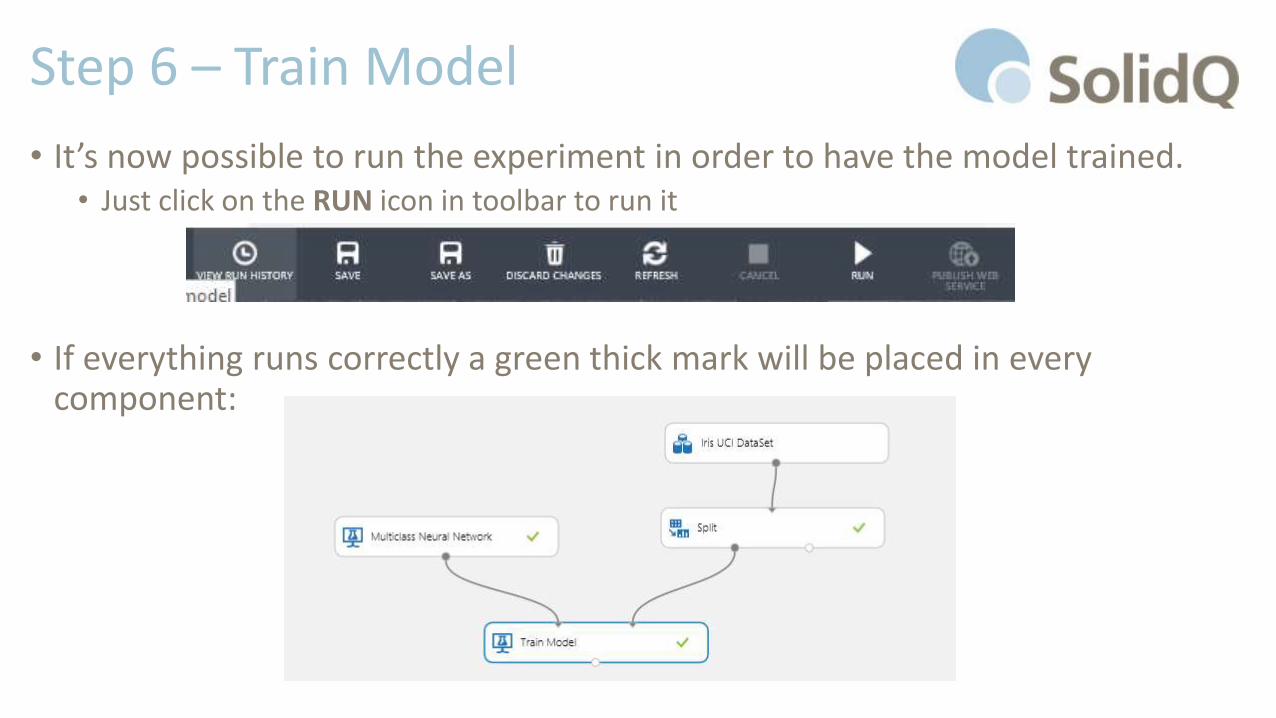
• It’s now possible to run the experiment in order to have the model trained.• Just click on the RUN icon in toolbar to run it
• If everything runs correctly a green thick mark will be placed in every component:
Step 7 – Save the Trained Model
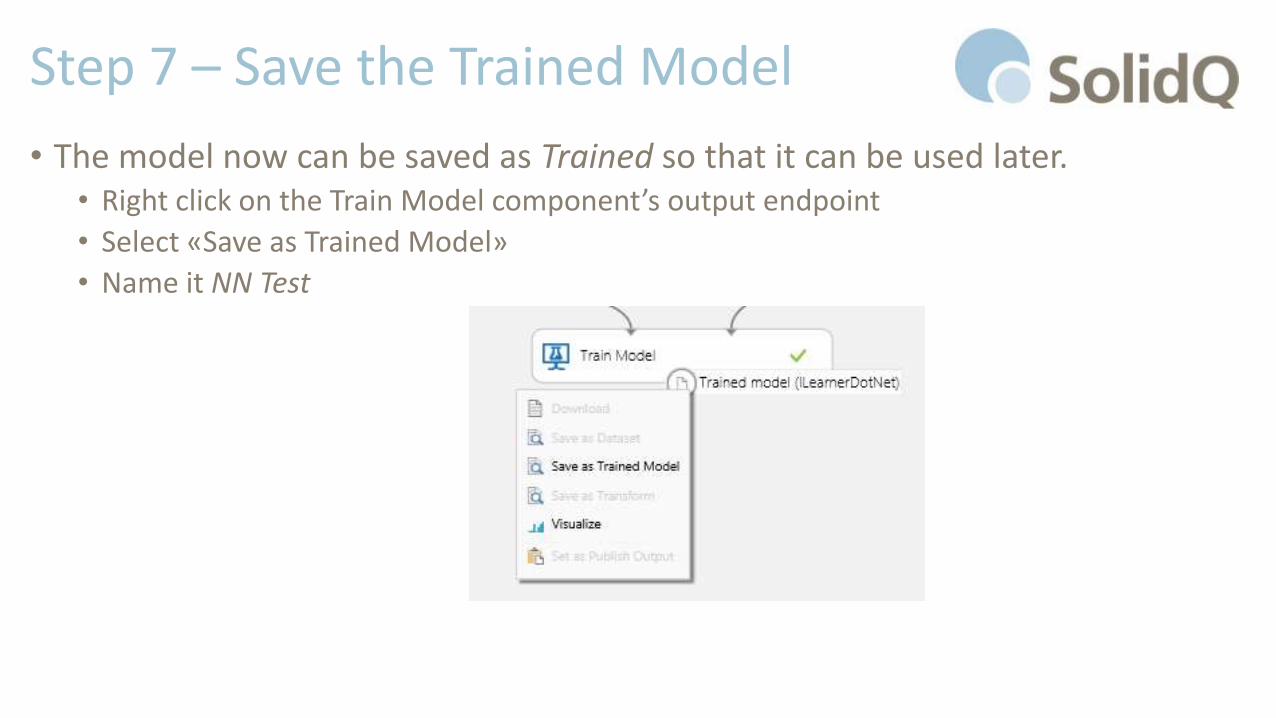
• The model now can be saved as Trained so that it can be used later.• Right click on the Train Model component’s output endpoint
• Select «Save as Trained Model»
• Name it NN Test

Score the Model
Step 8 – Score the Model
• Create a new experiment. In the design area add• Iris UCI Dataset
• Split component
• NN Test from Trained Models
• Score Model from Machine Learning \ Score
• Connect• Iris UCI Dataset to Split
• Second Split output to second Score Model input• Configure the Split as did before (70/30)
• NN Test to first Score Model input
Step 9 – Score the Model
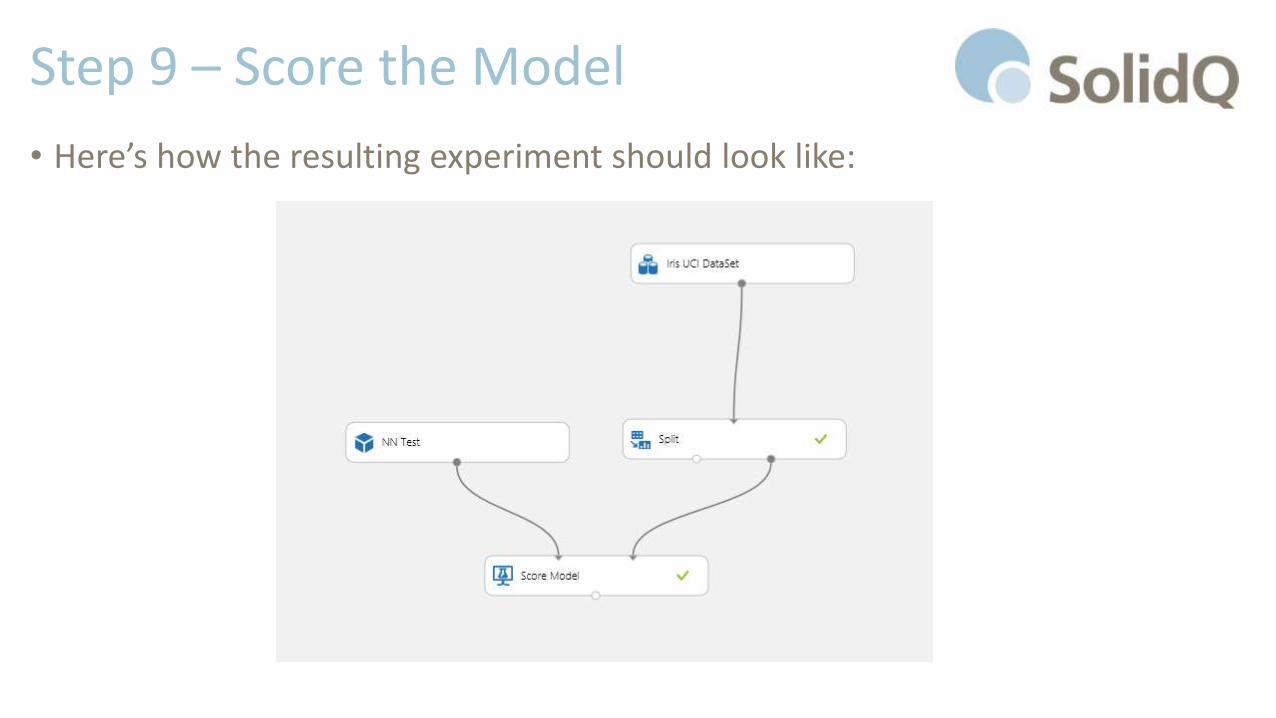
• Here’s how the resulting experiment should look like:
Step 9 – Score the Model
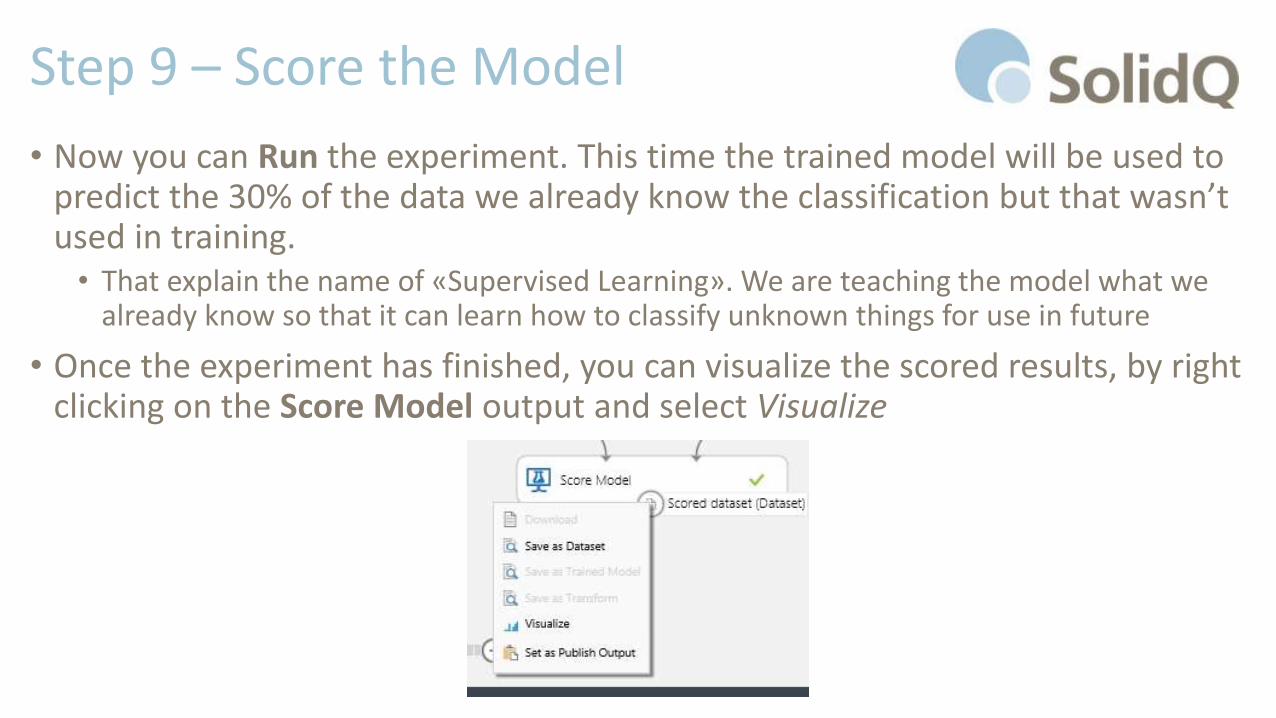
• Now you can Run the experiment. This time the trained model will be used to predict the 30% of the data we already know the classification but that wasn’t used in training.• That explain the name of «Supervised Learning». We are teaching the model what we
already know so that it can learn how to classify unknown things for use in future
• Once the experiment has finished, you can visualize the scored results, by right clicking on the Score Model output and select Visualize
Step 9 – Score the Model
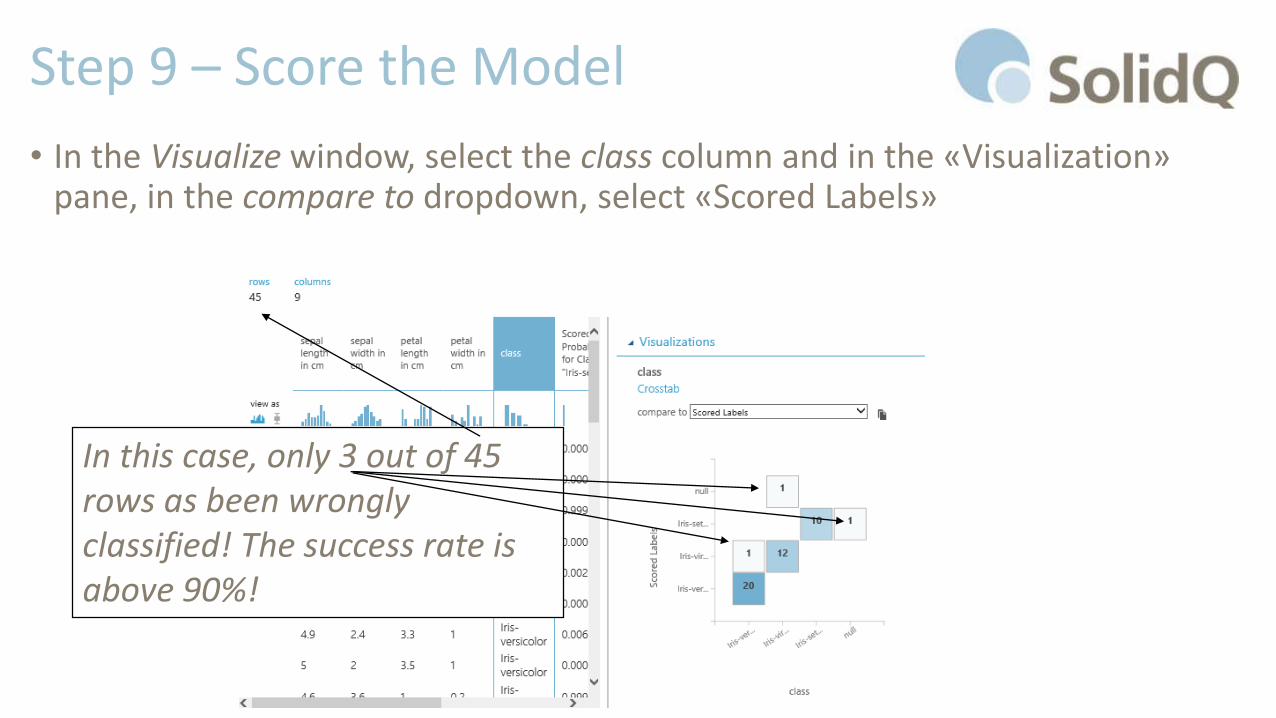
• In the Visualize window, select the class column and in the «Visualization» pane, in the compare to dropdown, select «Scored Labels»
In this case, only 3 out of 45 rows as been wrongly classified! The success rate is above 90%!

Publish Web Service
Step 10 - Publish Web Service
• Create a new experiment. In the design area add• Iris UCI Dataset
• Project Columns from Data Transformation \ Manipulation
• NN Test from Trained Models
• Score Model from Machine Learning \ Score
Step 10 - Publish Web Service
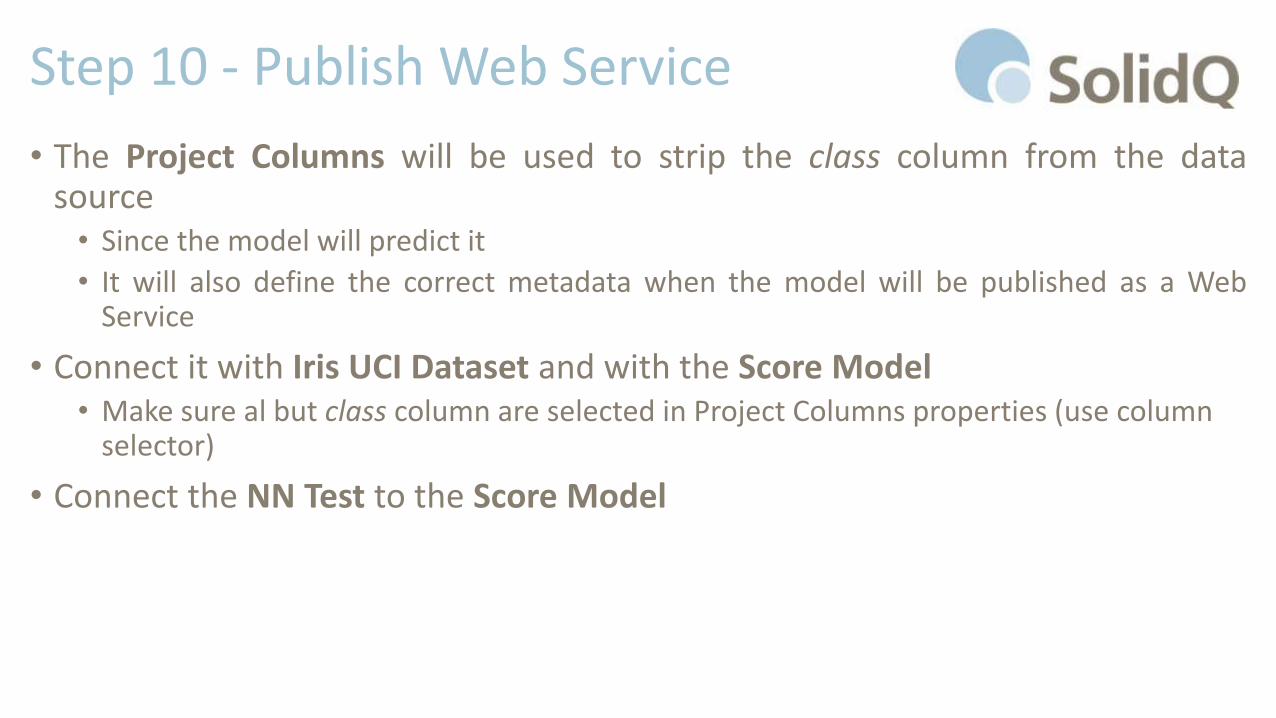
• The Project Columns will be used to strip the class column from the datasource• Since the model will predict it
• It will also define the correct metadata when the model will be published as a WebService
• Connect it with Iris UCI Dataset and with the Score Model• Make sure al but class column are selected in Project Columns properties (use column
selector)
• Connect the NN Test to the Score Model
Step 10 - Publish Web Service
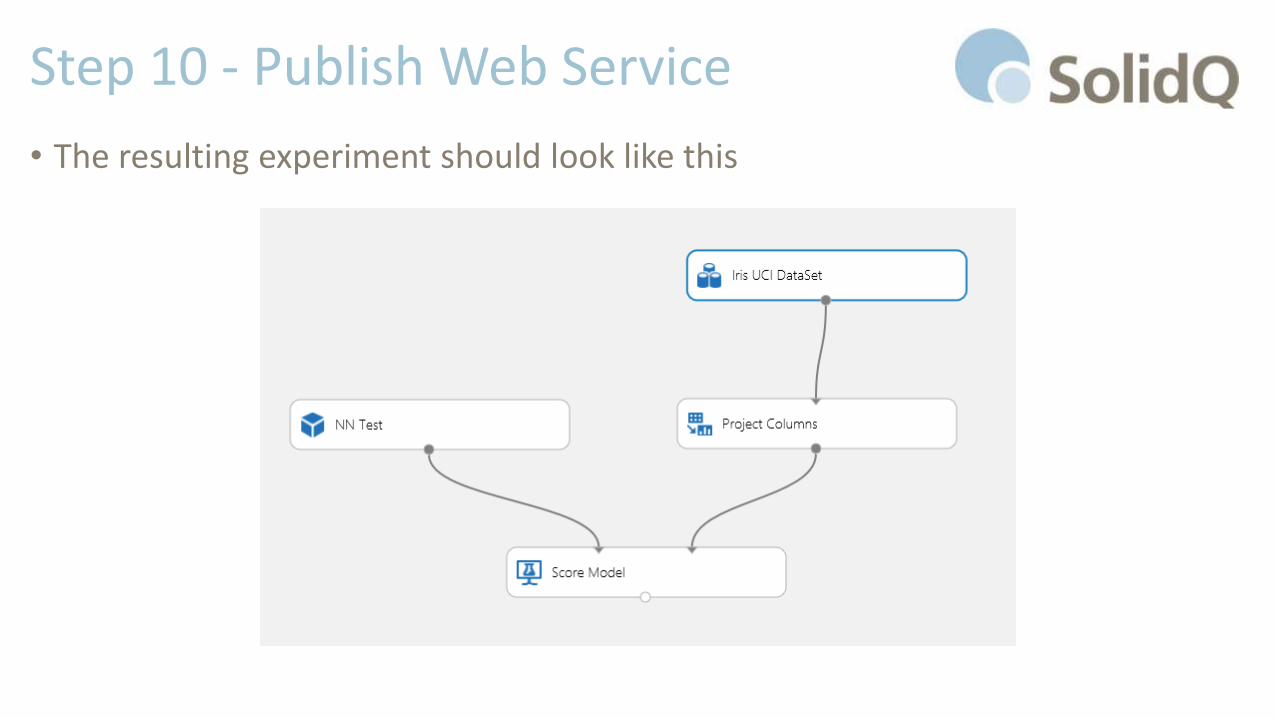
• The resulting experiment should look like this
Step 10 - Publish Web Service
• Run the Experiment
• After experiment has finished correctly, add another Project Columns connected to the Score Model• In the column selector select «All Scores»
• (At present time) The «All Scores» option is available ONLY after the first run.
• This is need for the web service, to strip out all the source columns and keep only the results
• Run the experiment again
Step 10 - Publish Web Service
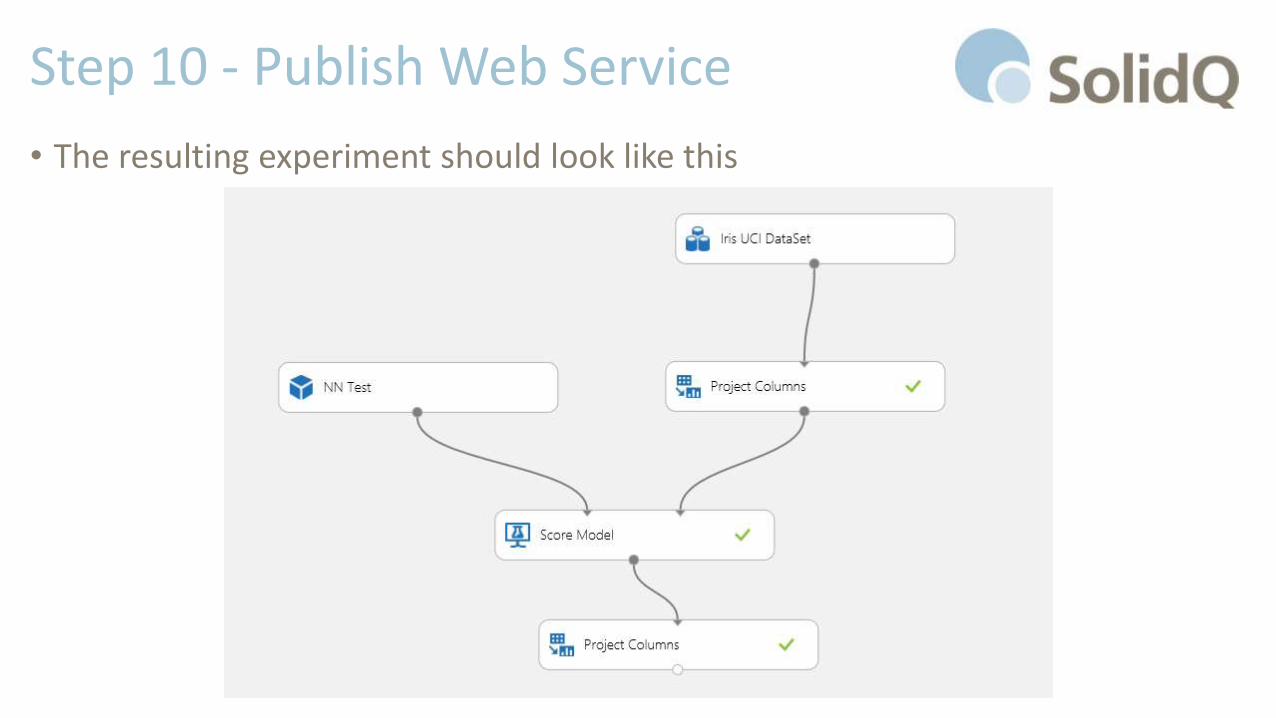
• The resulting experiment should look like this
Step 10 - Publish Web Service
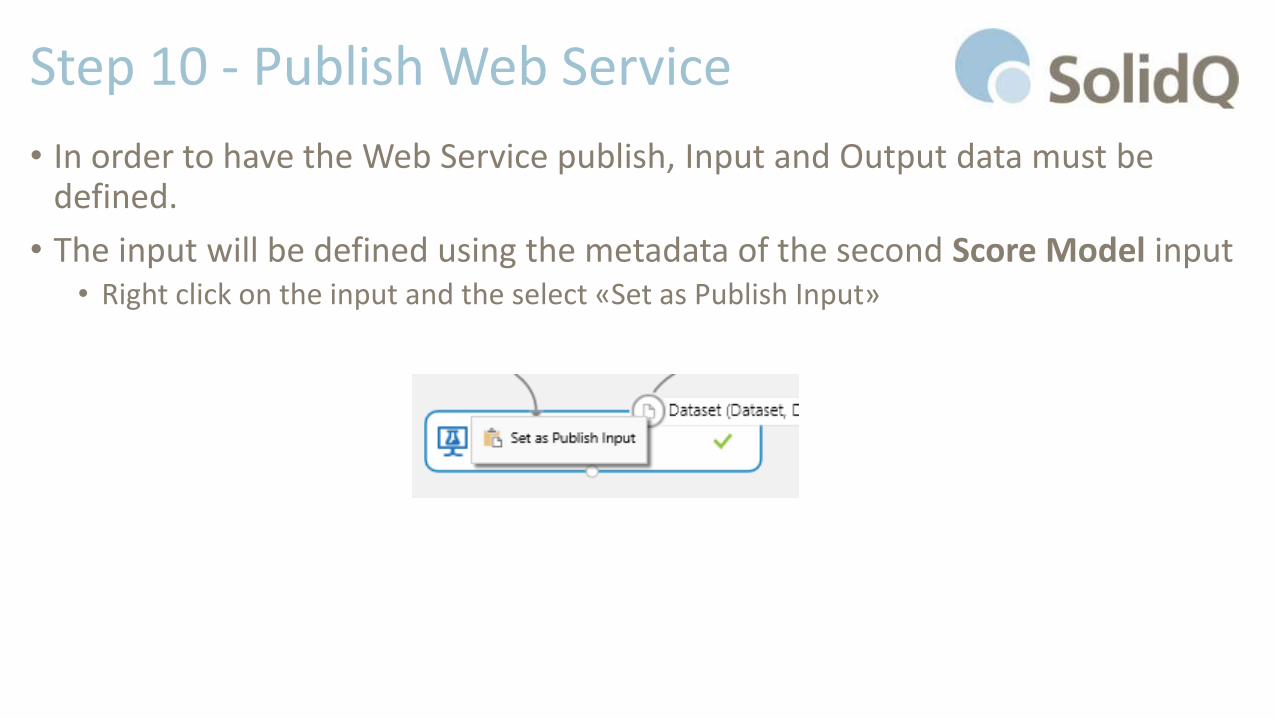
• In order to have the Web Service publish, Input and Output data must be defined.
• The input will be defined using the metadata of the second Score Model input• Right click on the input and the select «Set as Publish Input»
Step 10 - Publish Web Service
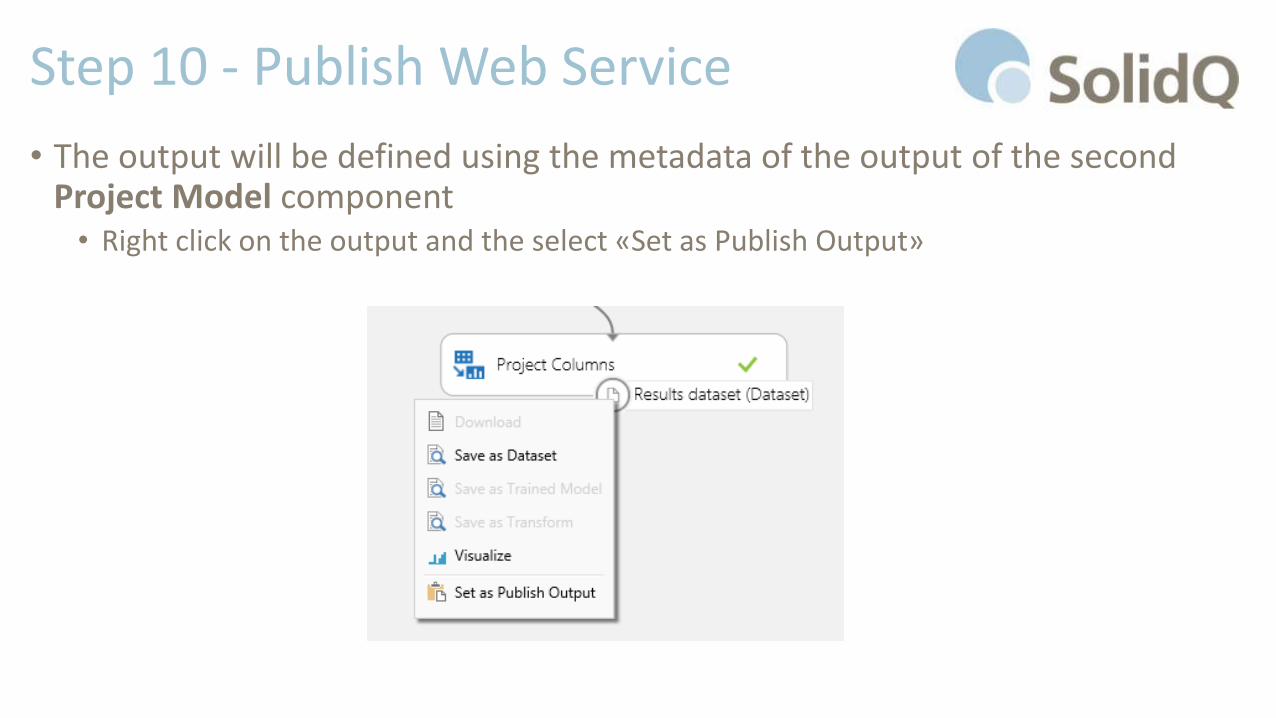
• The output will be defined using the metadata of the output of the second Project Model component• Right click on the output and the select «Set as Publish Output»
Step 10 - Publish Web Service
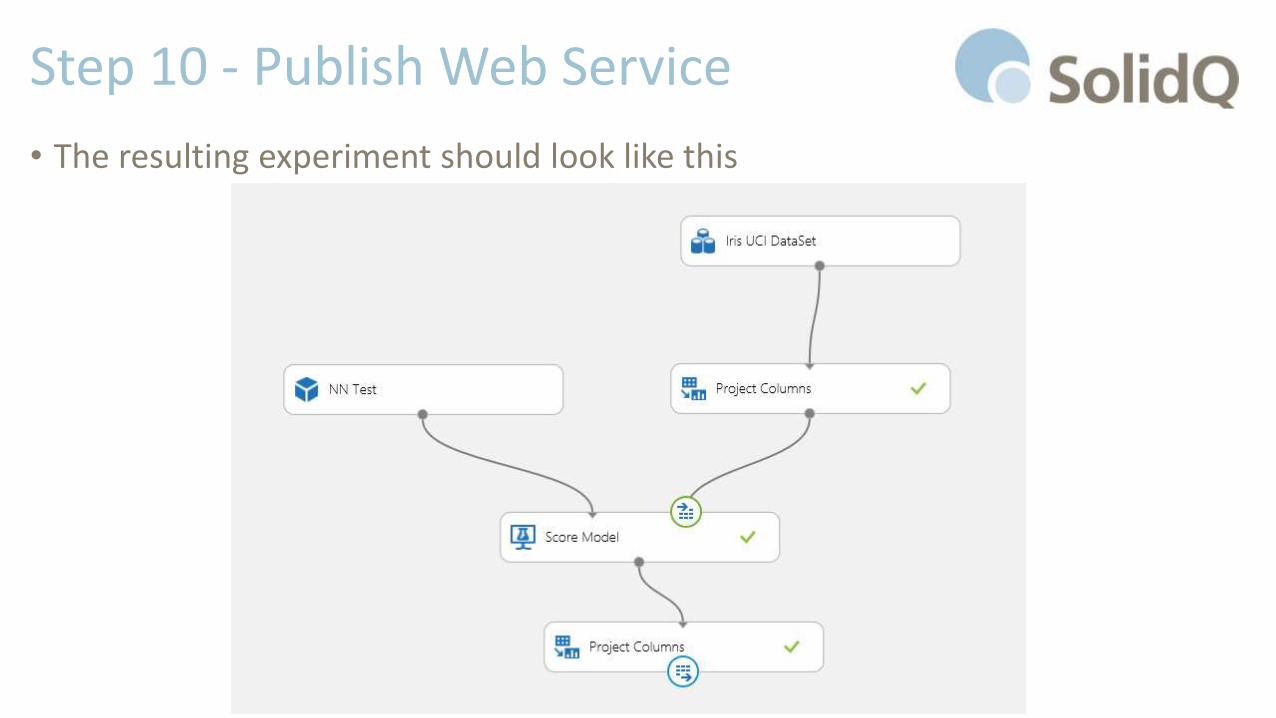
• The resulting experiment should look like this
Step 10 - Publish Web Service
• Click on the «Publish Web Service» icon
• Now the web service can be tested and give sepal and petal data as input, it will return the probability for each class and the most probable class as result
• You’ll find the Web Service in the «Web Service» section of AzureML homepage.
• Web Service also provides a testing page and examples to use it with• C#, R, Python

Conclusion
Conclusion
• We created three experiments just for the tutorial purpose but actually only two are needed.• Experiment one and two (Training and Scoring) can be merged together
• We only used the Neural Network Classifier but there other Multiclass classifier that could (and should) be used• Test all of them and take the one that give best predictions

Previously known as
Think Big. Move Fast.