Embed Size (px)
Citation preview

Welcome to
Melissa MartinezWeb Analytics CoachCooperate.NYCCohort 3 – Summer 2015
Web Analytics
In Partnership with
+Agenda
Day 1: Intro to Analytics Definition & Purpose
User Interface Navigation
Key Metrics & Dimensions
Day 2: Gathering Data External Tools
Segmentation
Prepping for Reporting
Day 3: Application & Reports Actionable Insights
User Profiles
Reports
+Day 2 Presentation: Shortlinks
PowerPoint Presentation
bit.ly/COOPc3WebAnalyticsPPT2
Web Analytics Reference Guide
bit.ly/COOPc3WebAnalyticsGuide
Web Analytics Workbook
bit.ly/COOPc3WebAnalyticsWorkbook2
+Day 2: Agenda
Part 1: Review
Exercise 1: UI Navigation Practice
Part 2: External Web Analytic Tools
Part 3: Segmentation
Exercise 2: Segmentation
Part 4: Prepping for Reporting
Exercise 3: Prepping for Reporting
Wrap-Up: Questions
External Resources
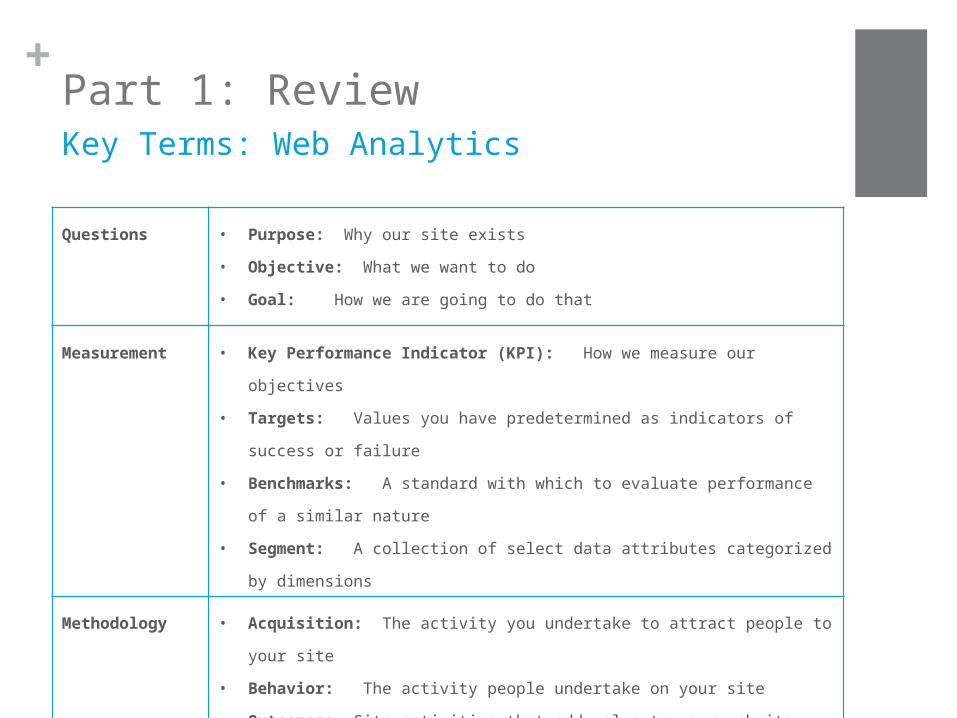
+Part 1: Review
Questions • Purpose: Why our site exists
• Objective: What we want to do
• Goal: How we are going to do that
Measurement • Key Performance Indicator (KPI): How we measure our objectives
• Targets: Values you have predetermined as indicators of success or failure
• Benchmarks: A standard with which to evaluate performance of a similar nature
• Segment: A collection of select data attributes categorized by dimensions
Methodology • Acquisition: The activity you undertake to attract people to your site
• Behavior: The activity people undertake on your site
• Outcomes: Site activities that add value to your website
Key Terms: Web Analytics
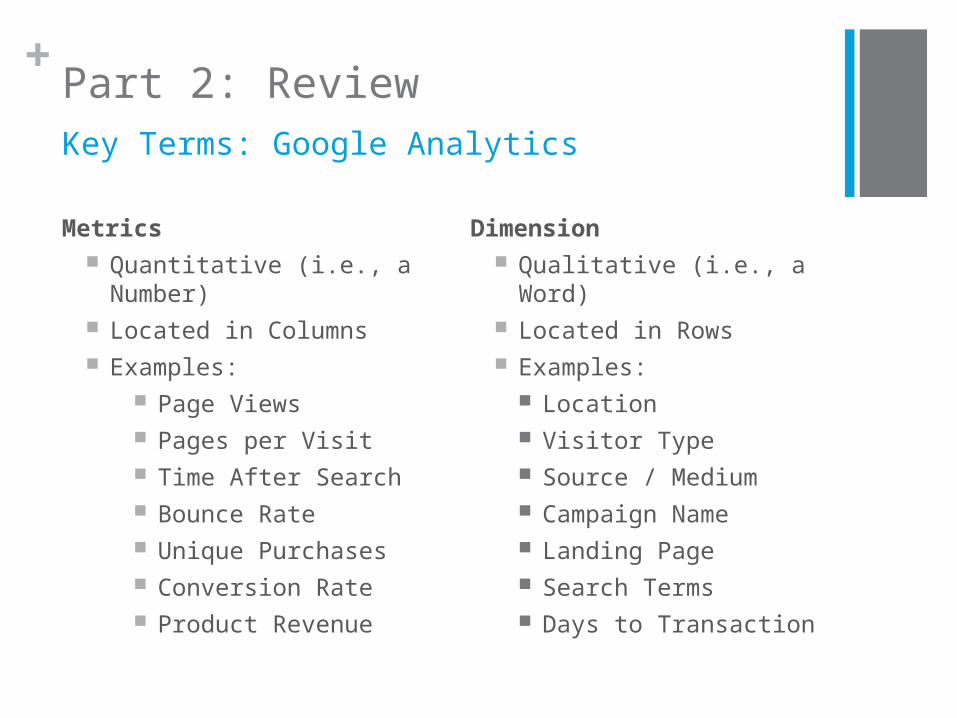
+Part 2: Review
Metrics Quantitative (i.e., a Number) Located in Columns Examples:
Page Views Pages per Visit Time After Search Bounce Rate Unique Purchases Conversion Rate Product Revenue
Dimension Qualitative (i.e., a Word) Located in Rows Examples:
Location Visitor Type Source / Medium Campaign Name Landing Page Search Terms Days to Transaction
Key Terms: Google Analytics
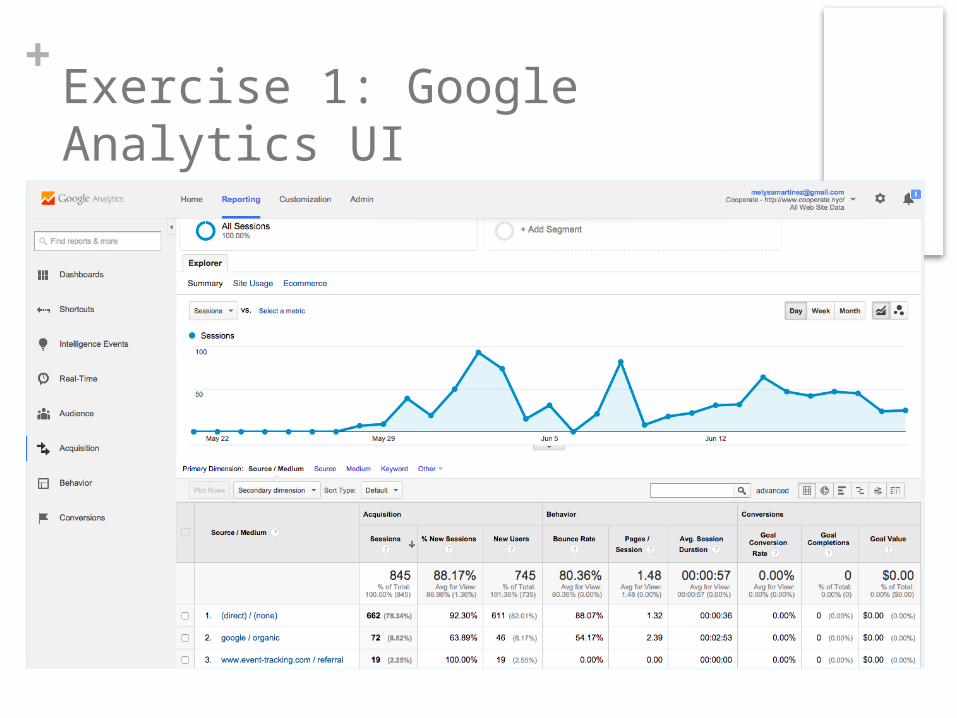
+Exercise 1: Google Analytics UI
+Exercise 1: Google Analytics UI
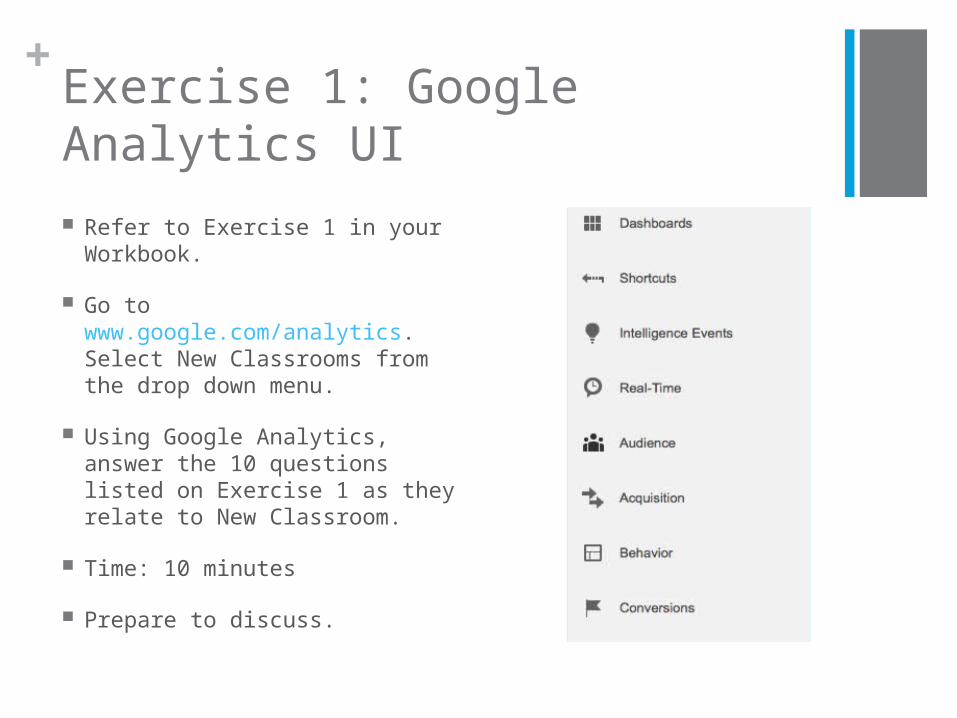
Refer to Exercise 1 in your Workbook.
Go to www.google.com/analytics. Select New Classrooms from the drop down menu.
Using Google Analytics, answer the 10 questions listed on Exercise 1 as they relate to New Classroom.
Time: 10 minutes
Prepare to discuss.
+Exercise 1: Google Analytics UI
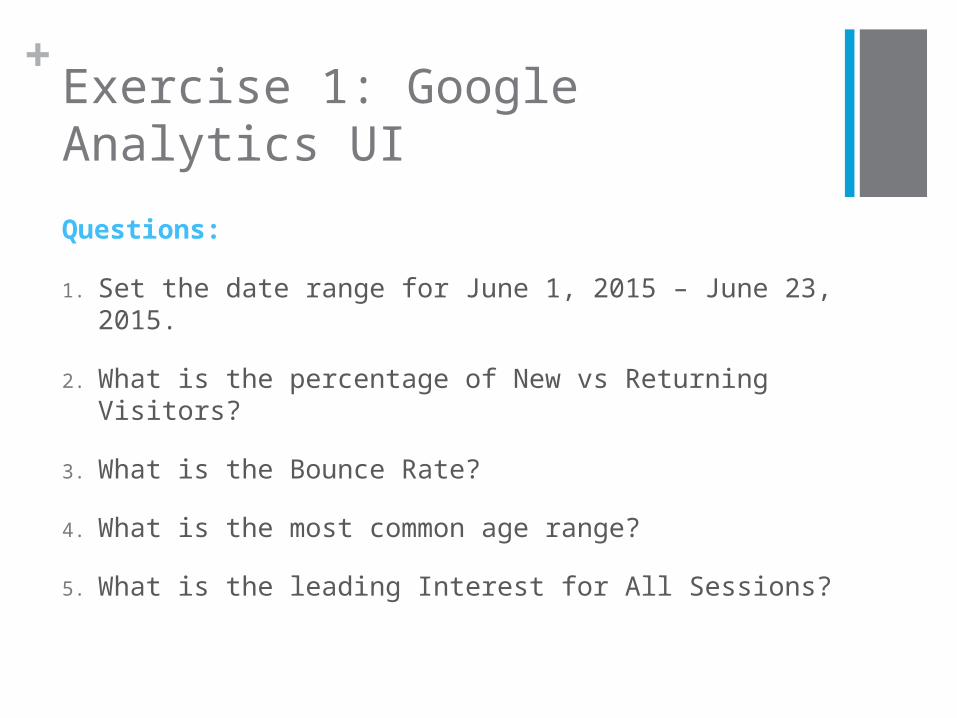
Questions:
1. Set the date range for June 1, 2015 – June 23, 2015.
2. What is the percentage of New vs Returning Visitors?
3. What is the Bounce Rate?
4. What is the most common age range?
5. What is the leading Interest for All Sessions?
+Exercise 1: Google Analytics UI
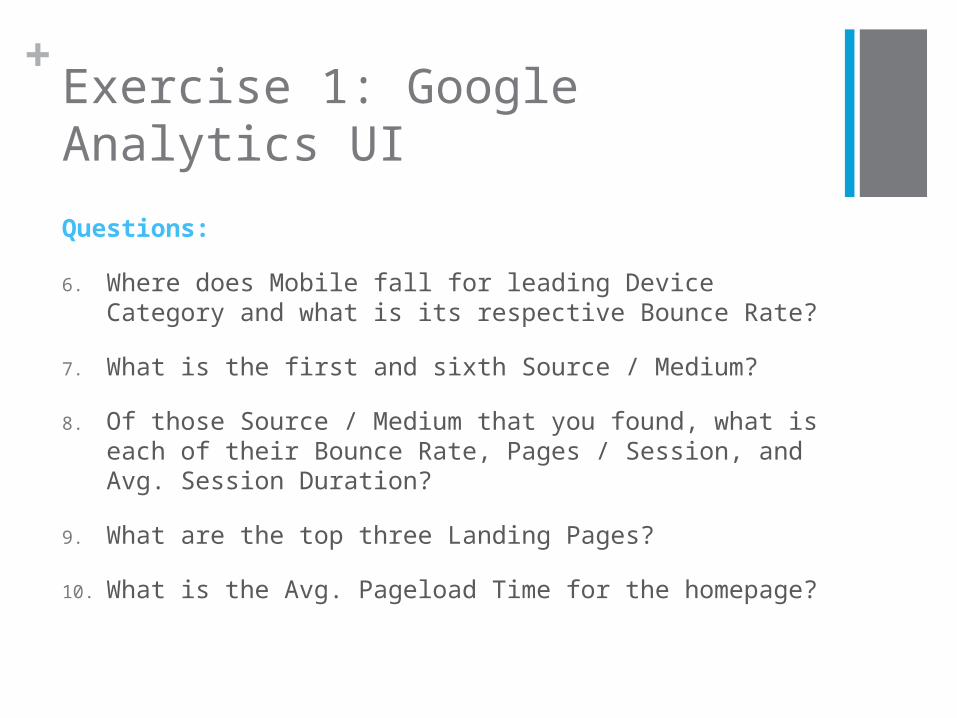
Questions:
6. Where does Mobile fall for leading Device Category and what is its respective Bounce Rate?
7. What is the first and sixth Source / Medium?
8. Of those Source / Medium that you found, what is each of their Bounce Rate, Pages / Session, and Avg. Session Duration?
9. What are the top three Landing Pages?
10. What is the Avg. Pageload Time for the homepage?
+Exercise 1: Google Analytics UI
Answers:
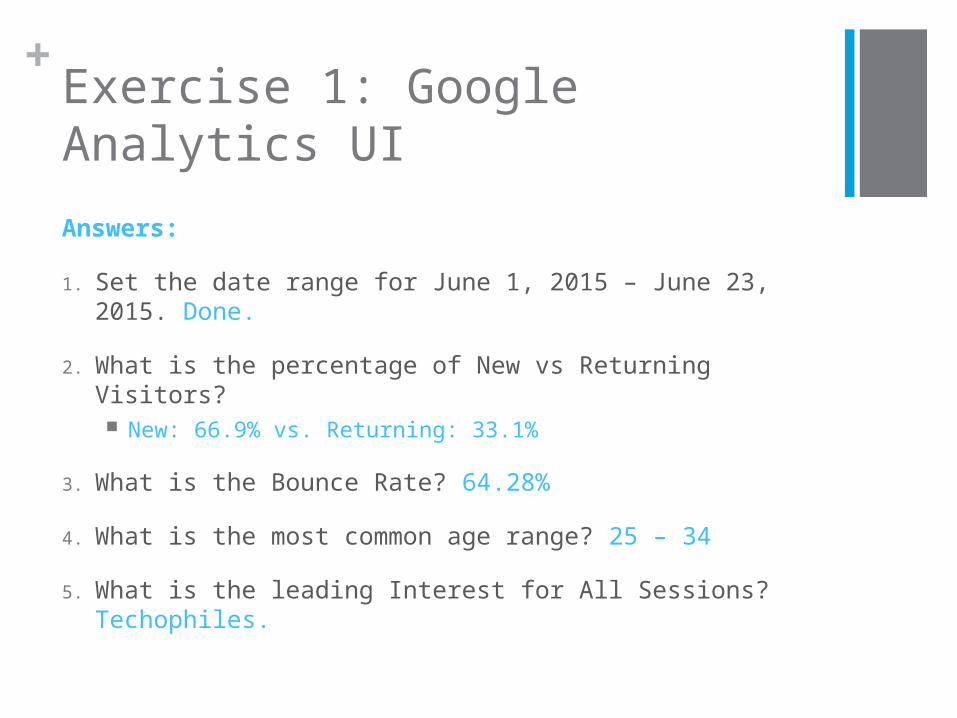
1. Set the date range for June 1, 2015 – June 23, 2015. Done.
2. What is the percentage of New vs Returning Visitors? New: 66.9% vs. Returning: 33.1%
3. What is the Bounce Rate? 64.28%
4. What is the most common age range? 25 – 34
5. What is the leading Interest for All Sessions? Techophiles.
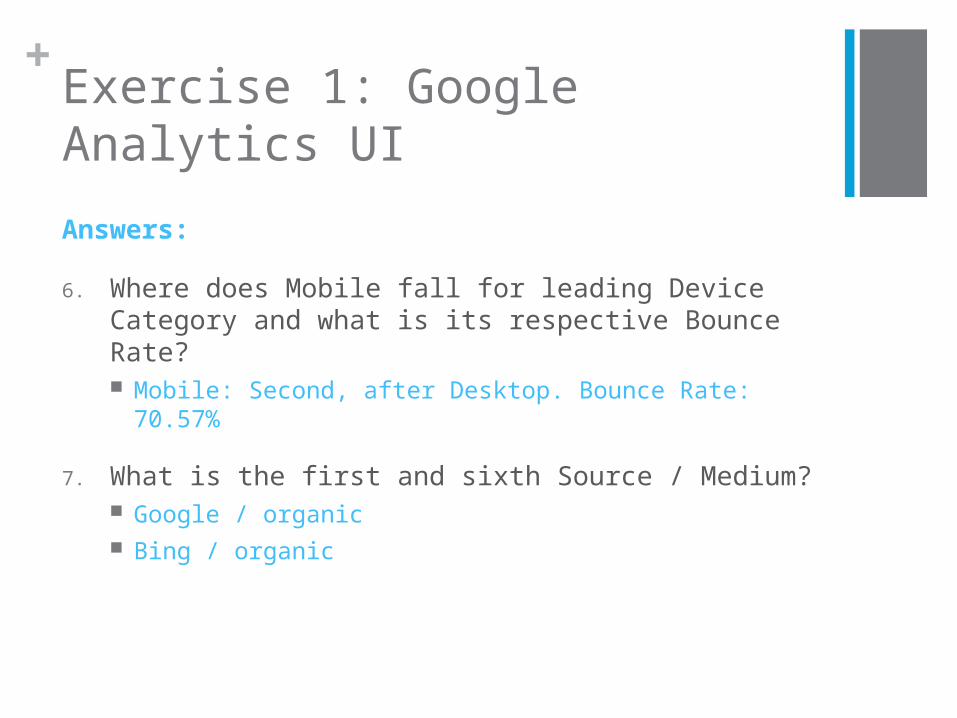
+Exercise 1: Google Analytics UI
Answers:
6. Where does Mobile fall for leading Device Category and what is its respective Bounce Rate? Mobile: Second, after Desktop. Bounce Rate: 70.57%
7. What is the first and sixth Source / Medium? Google / organic Bing / organic

+Exercise 1: Google Analytics UI
Answers:
8. Of those Source / Medium that you found, what is each of their Bounce Rate, Pages / Session, and Avg. Session Duration?
Google / Organic Bounce Rate: 60.68% Pages / Session: 1.90 Avg. Session Duration: 1:54
Bing / Organic Bounce Rate: 39.29% Pages / Session: 2.36 Avg. Session Duration: 1:22
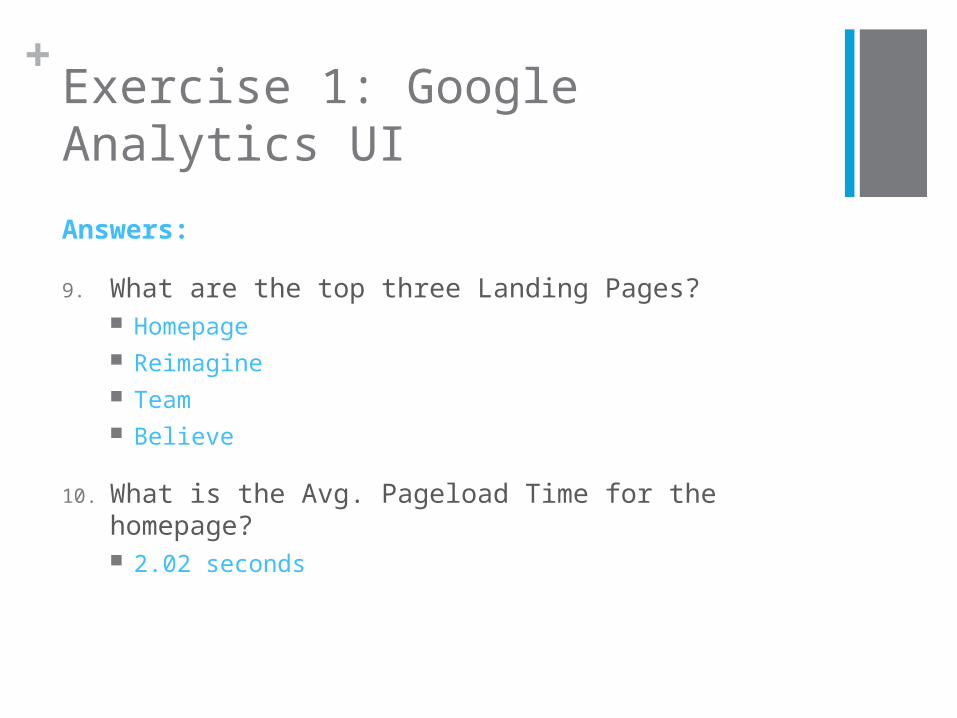
+Exercise 1: Google Analytics UI
Answers:
9. What are the top three Landing Pages? Homepage Reimagine Team Believe
10. What is the Avg. Pageload Time for the homepage? 2.02 seconds

+Part 2: External ToolsCompetitors, Trends & More
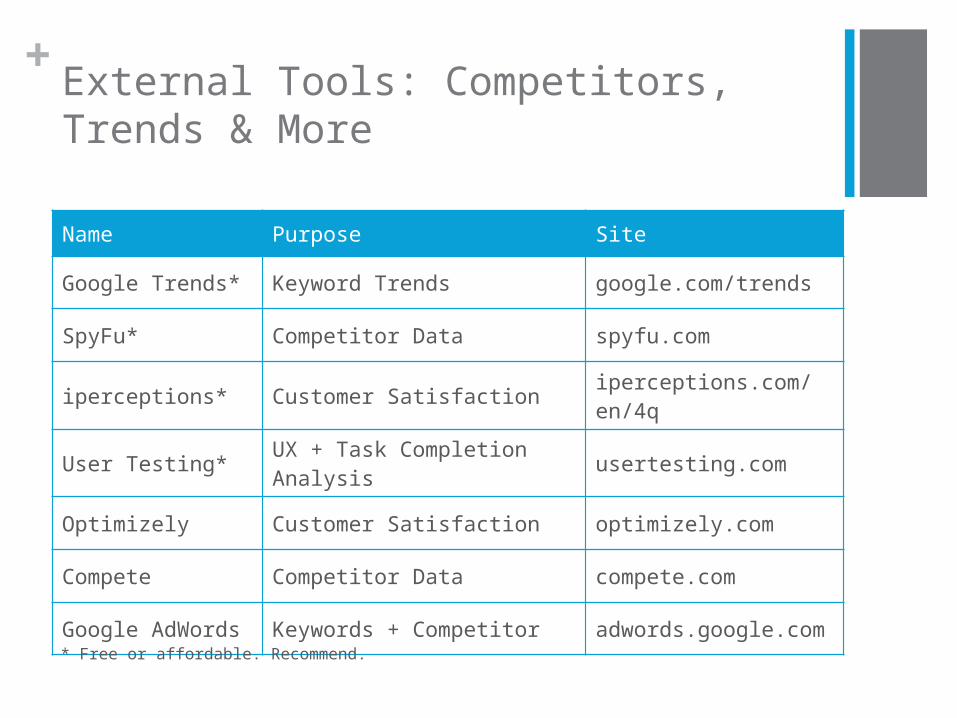
+External Tools: Competitors, Trends & More
Name Purpose Site
Google Trends* Keyword Trends google.com/trends
SpyFu* Competitor Data spyfu.com
iperceptions* Customer Satisfaction iperceptions.com/en/4q
User Testing* UX + Task Completion Analysis usertesting.com
Optimizely Customer Satisfaction optimizely.com
Compete Competitor Data compete.com
Google AdWords Keywords + Competitor adwords.google.com
* Free or affordable. Recommend.

+Part 3: Segmentation
+Segmentation
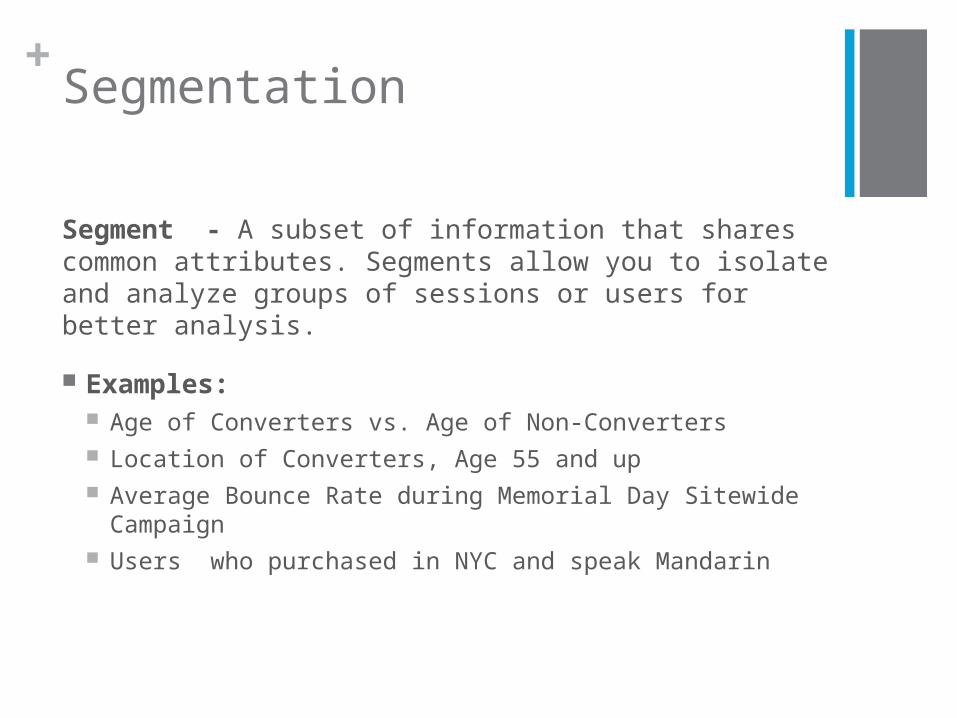
Segment - A subset of information that shares common attributes. Segments allow you to isolate and analyze groups of sessions or users for better analysis.
Examples: Age of Converters vs. Age of Non-Converters Location of Converters, Age 55 and up Average Bounce Rate during Memorial Day Sitewide Campaign Users who purchased in NYC and speak Mandarin
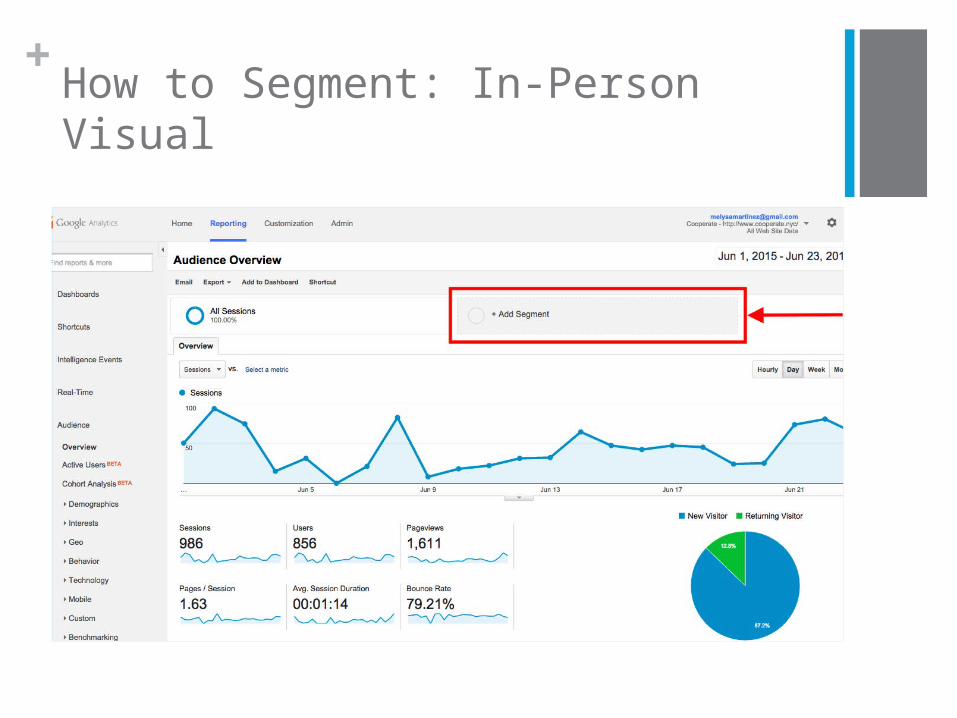
+How to Segment: In-Person Visual

+Exercise 2: Segmentation
Refer to Exercise 2 in your Workbook.
Go to www.google.com/analytics. Select New Classrooms from the drop down menu.
Using Google Analytics, follow the segmentation steps listed and answer the questions as they relate to the client.
Time: 5minutes
Prepare to discuss.

+Part 3: Prepping for Reporting
+Prepping for Reporting
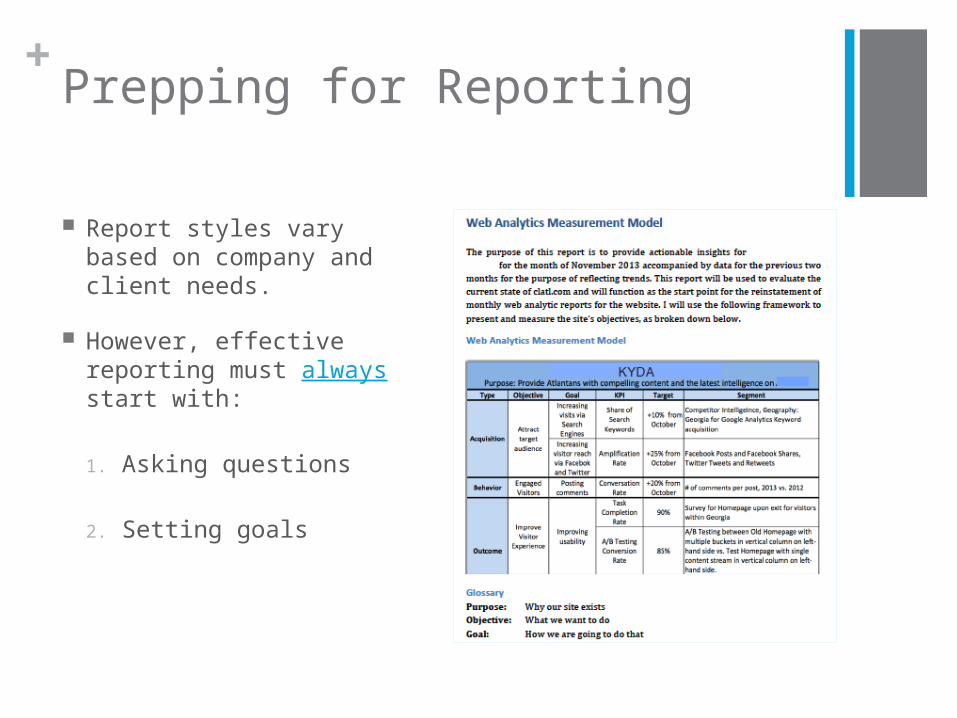
Report styles vary based on company and client needs.
However, effective reporting must always start with:
1. Asking questions
2. Setting goals
+Exercise 3: Prepping for Reporting
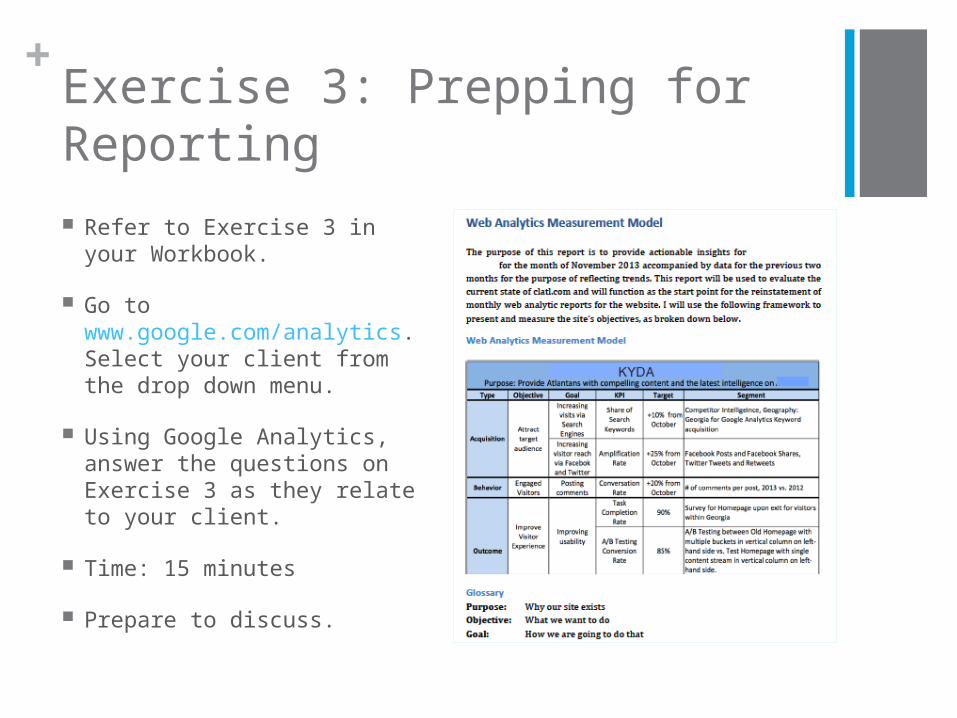
Refer to Exercise 3 in your Workbook.
Go to www.google.com/analytics. Select your client from the drop down menu.
Using Google Analytics, answer the questions on Exercise 3 as they relate to your client.
Time: 15 minutes
Prepare to discuss.

+Day 2 Wrap-Up: Questions

+External Resources: Web Analytics
Web Analytics: Key Definitions, Metrics, Dimensions & More http://www.kaushik.net/avinash/web-analytics-101-definitions-goals-metrics-
kpis-dimensions-targets/ http://www.kaushik.net/avinash/smart-analytics-dashboard-modules-
insightful-dimensions-best-metrics/
Key Performance Indicators (KPIs) http://www.kaushik.net/avinash/best-web-metrics-kpis-small-medium-large-
business/ http://www.kaushik.net/avinash/measure-choose-smarter-kpis-incentives/
How To Create a Digital Marketing Measurement Model http://www.kaushik.net/avinash/digital-marketing-and-measurement-model/ http://www.kaushik.net/avinash/biggest-web-analysts-mistake-how-to-avoid/
+External Resources: Google Analytics
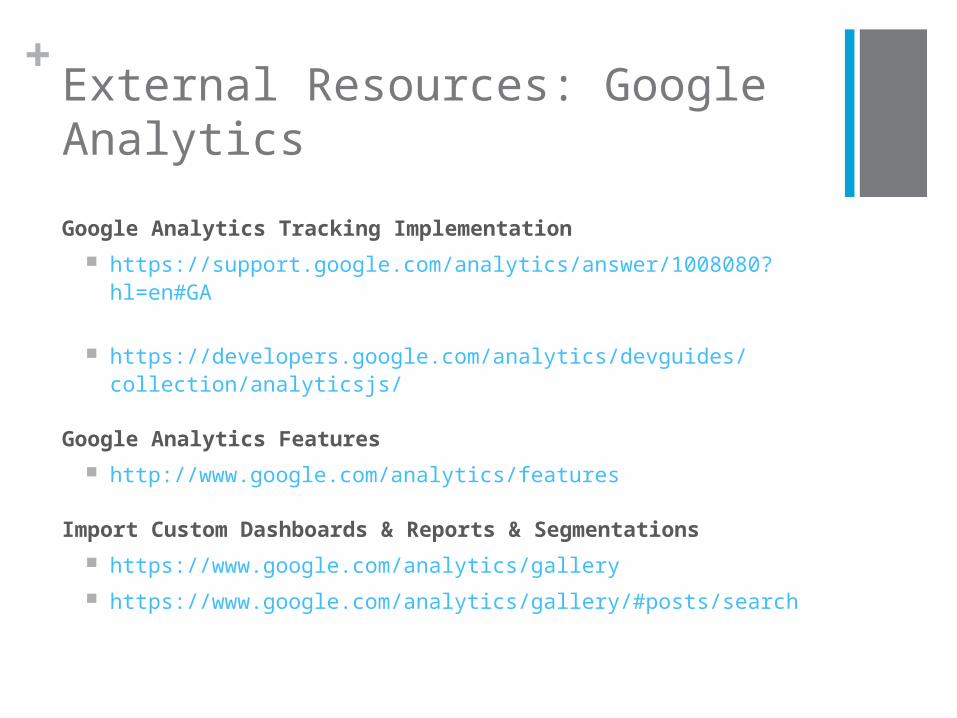
Google Analytics Tracking Implementation
https://support.google.com/analytics/answer/1008080?hl=en#GA
https://developers.google.com/analytics/devguides/collection/analyticsjs/
Google Analytics Features
http://www.google.com/analytics/features
Import Custom Dashboards & Reports & Segmentations
https://www.google.com/analytics/gallery
https://www.google.com/analytics/gallery/#posts/search
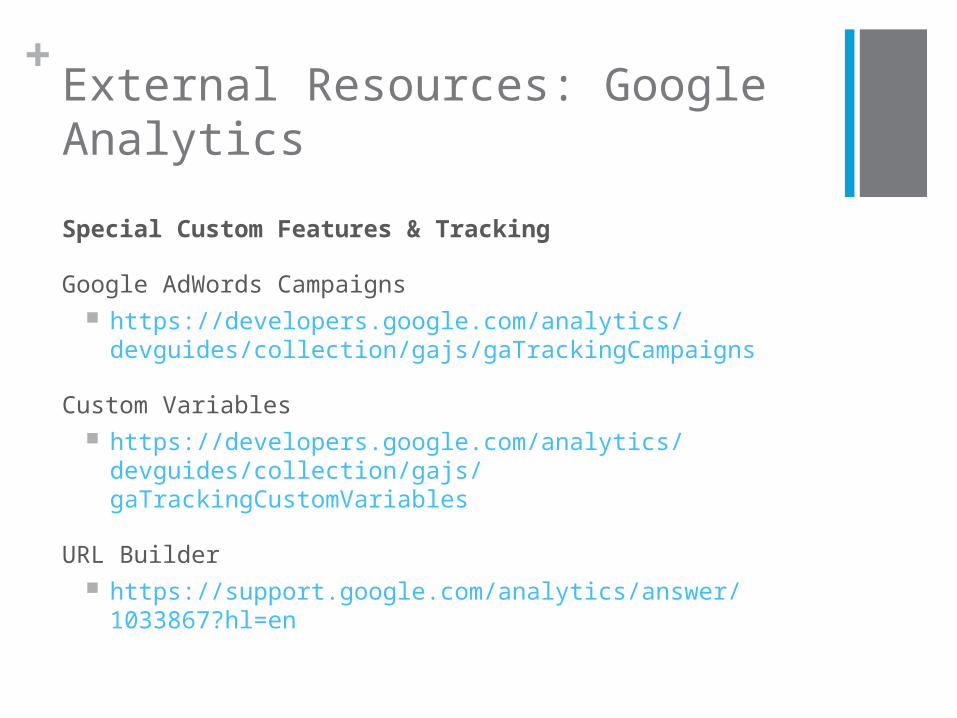
+External Resources: Google Analytics
Special Custom Features & Tracking
Google AdWords Campaigns https://developers.google.com/analytics/devguides/collection/gajs/
gaTrackingCampaigns
Custom Variables https://developers.google.com/analytics/devguides/collection/gajs/
gaTrackingCustomVariables
URL Builder https://support.google.com/analytics/answer/1033867?hl=en
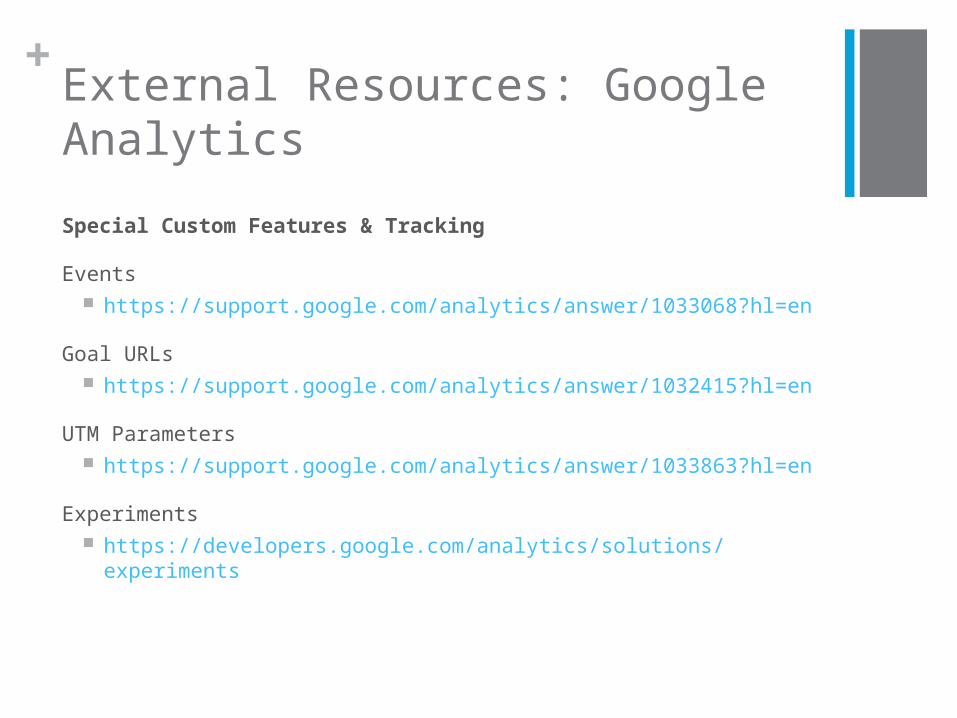
+External Resources: Google Analytics
Special Custom Features & Tracking
Events https://support.google.com/analytics/answer/1033068?hl=en
Goal URLs https://support.google.com/analytics/answer/1032415?hl=en
UTM Parameters https://support.google.com/analytics/answer/1033863?hl=en
Experiments https://developers.google.com/analytics/solutions/experiments
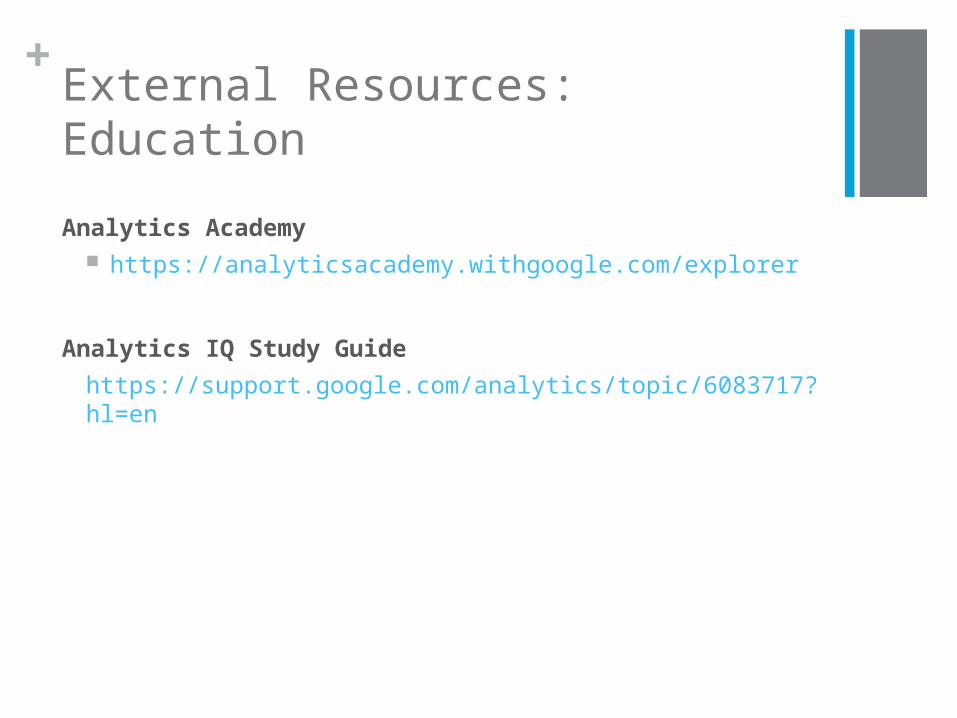
+External Resources: Education
Analytics Academy https://analyticsacademy.withgoogle.com/explorer
Analytics IQ Study Guide
https://support.google.com/analytics/topic/6083717?hl=en