Embed Size (px)
Citation preview
Taking the Front Office Beyond Traditional Business IntelligenceMark CyrEquity Distribution COOBank of America Merrill Lynch
May 20, 2015
#inspire15
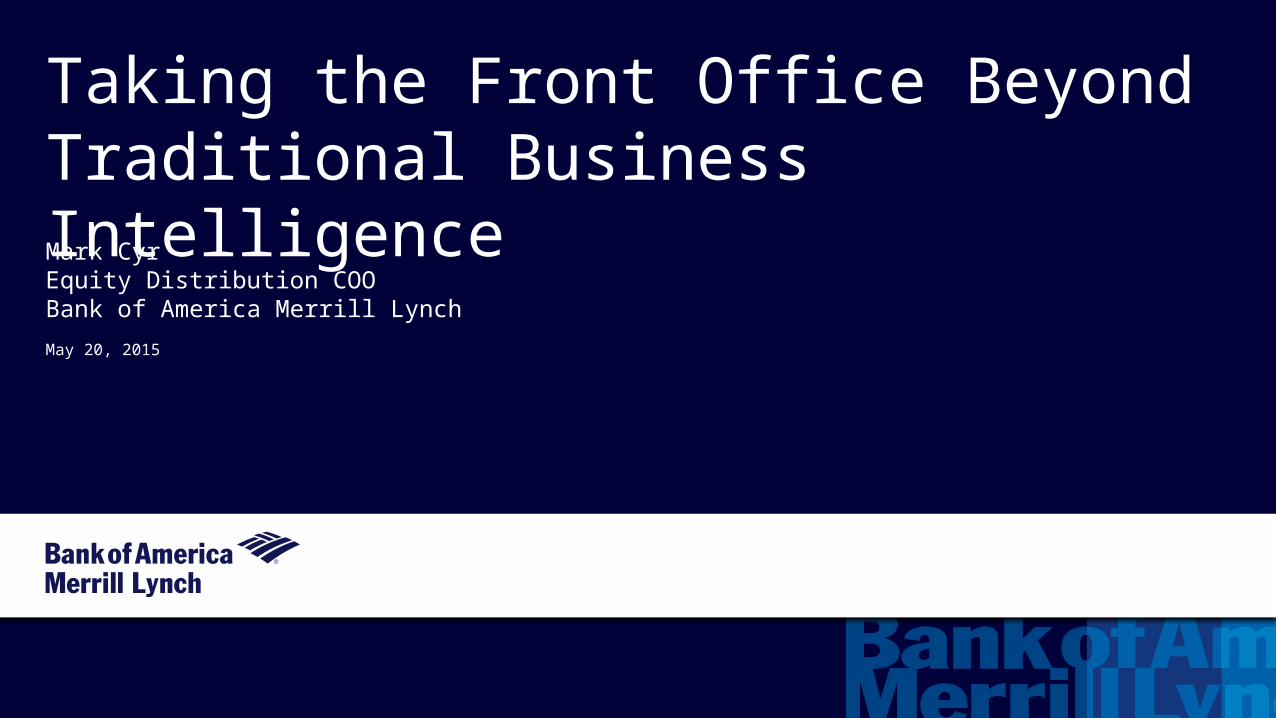
For more than 200 years, Bank of America has been focused on serving the financial needs of our customers and clients. Today, we provide a full range of banking, investment management and other financial and risk management products and services to three groups of customers – people, companies and institutional clients.
Bank of America
All statements speak as of, and only at, March 15, 2015 unless noted. Bank of America is under no obligation to update this information
#inspire15
Bank of America Merrill Lynch
Bank of America
Consumer Banking Global Banking and Markets
Global Commercial Banking
Global Wealth andInvestment Management
Global Corporate Banking /Global Investment Banking Global Markets Global Research
Equities Fixed IncomeDistributionCOO
Technology &Operations MarketingLegalCFO Human
Resources RiskCredit
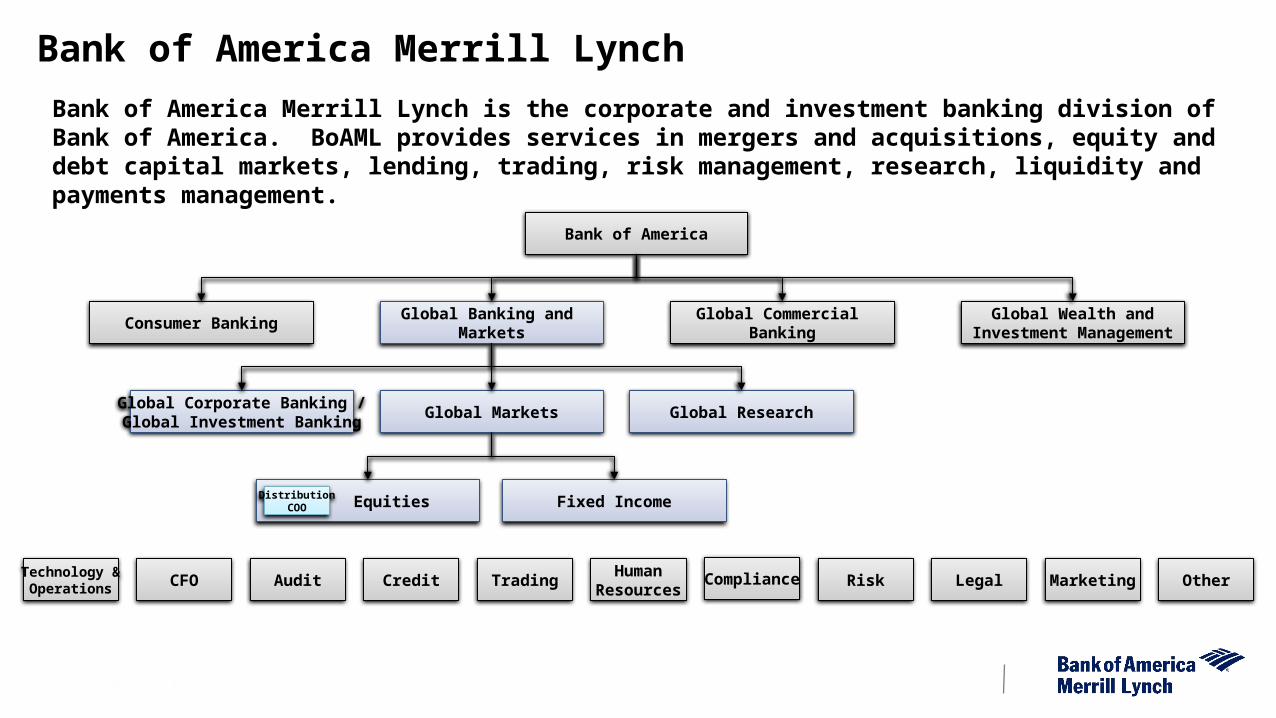
Bank of America Merrill Lynch is the corporate and investment banking division of Bank of America. BoAML provides services in mergers and acquisitions, equity and debt capital markets, lending, trading, risk management, research, liquidity and payments management.
OtherAudit Trading Compliance
#inspire15
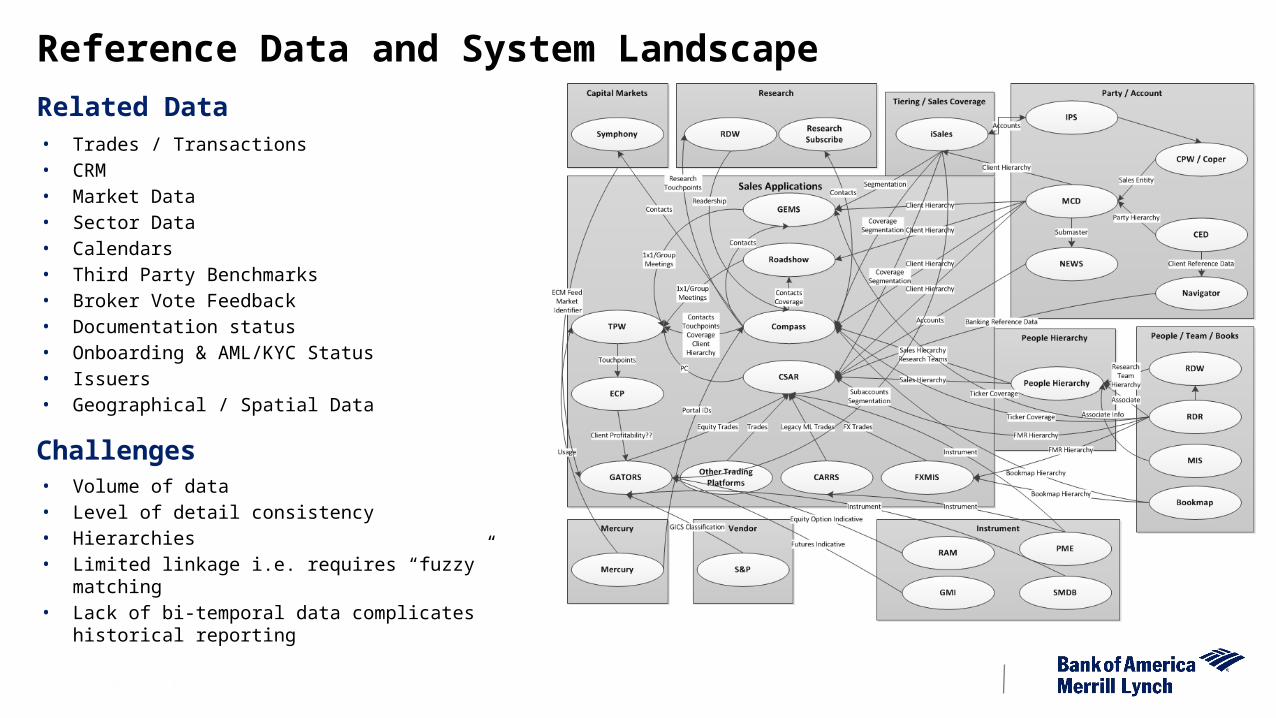
Related Data• Trades / Transactions• CRM• Market Data• Sector Data• Calendars• Third Party Benchmarks• Broker Vote Feedback• Documentation status• Onboarding & AML/KYC Status• Issuers• Geographical / Spatial Data
Reference Data and System Landscape
Challenges• Volume of data• Level of detail consistency• Hierarchies• Limited linkage i.e. requires “fuzzy” matching• Lack of bi-temporal data complicates historical
reporting
#inspire15
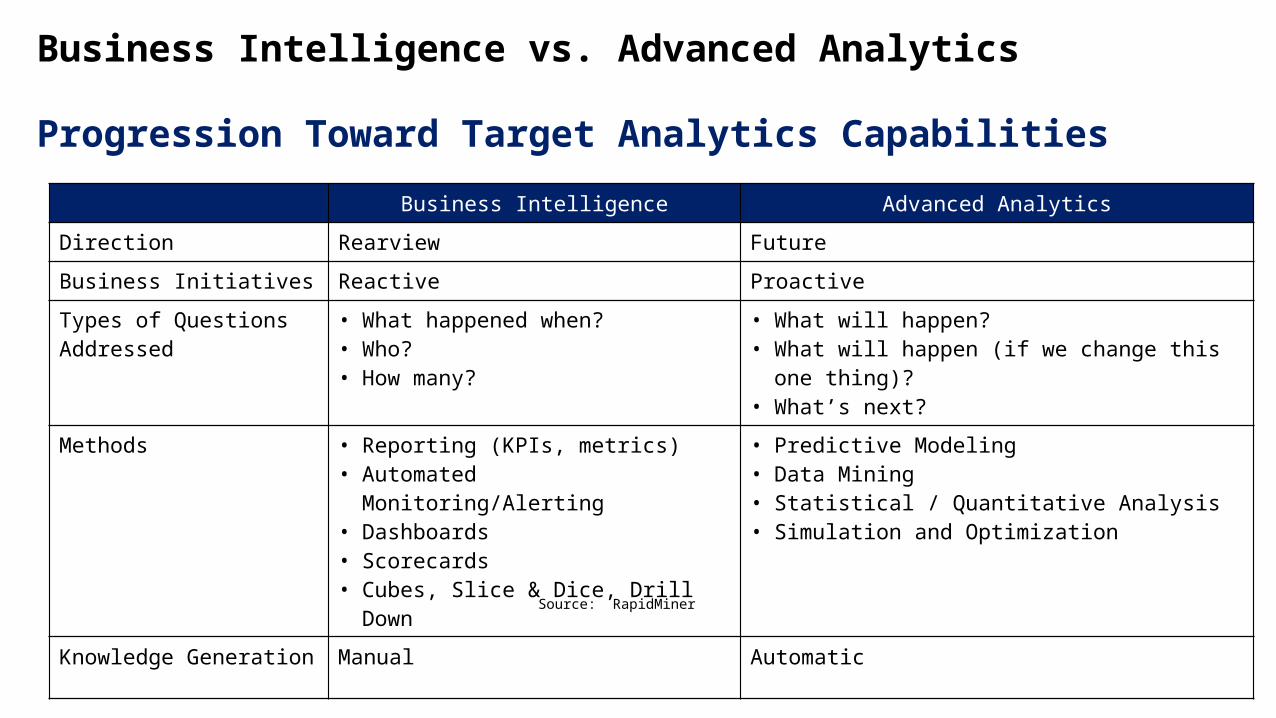
Business Intelligence vs. Advanced Analytics
Business Intelligence Advanced Analytics
Direction Rearview Future
Business Initiatives Reactive Proactive
Types of Questions Addressed • What happened when?• Who?• How many?
• What will happen?• What will happen (if we change this one thing)?• What’s next?
Methods • Reporting (KPIs, metrics)• Automated Monitoring/Alerting• Dashboards• Scorecards• Cubes, Slice & Dice, Drill Down
• Predictive Modeling• Data Mining• Statistical / Quantitative Analysis• Simulation and Optimization
Knowledge Generation Manual Automatic
Progression Toward Target Analytics Capabilities
Source: RapidMiner
#inspire15
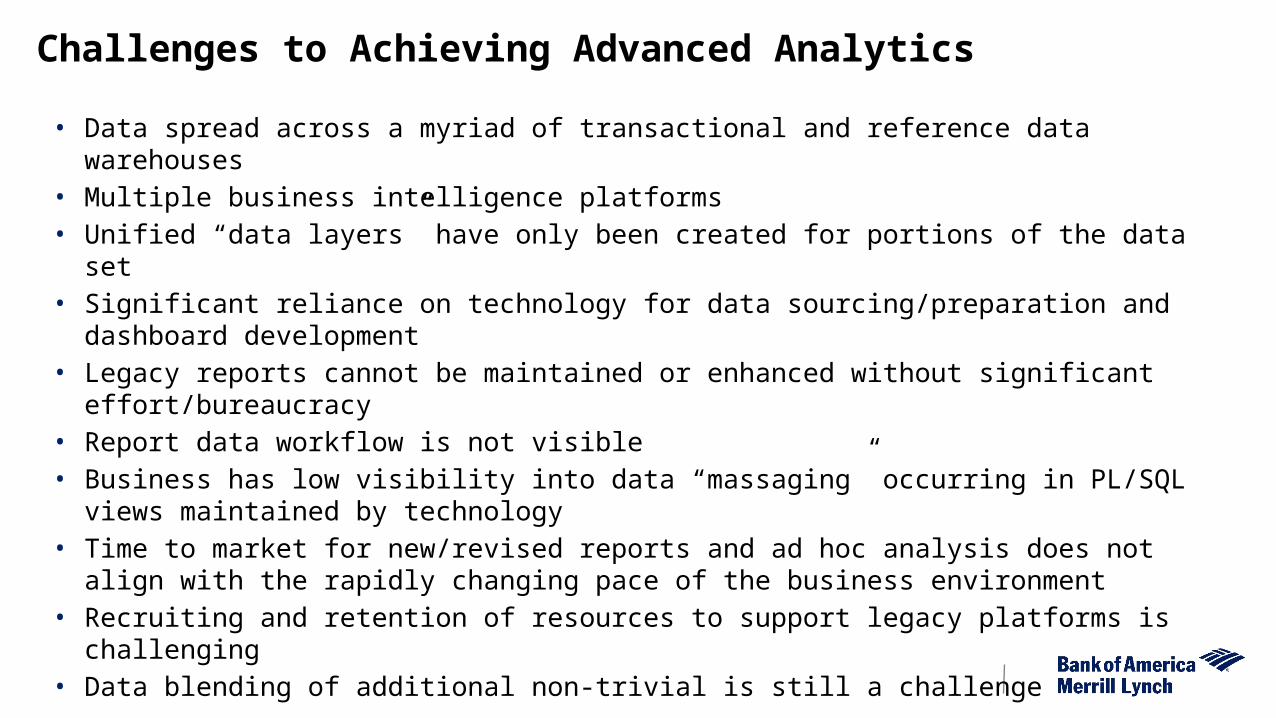
• Data spread across a myriad of transactional and reference data warehouses• Multiple business intelligence platforms• Unified “data layers” have only been created for portions of the data set• Significant reliance on technology for data sourcing/preparation and dashboard development• Legacy reports cannot be maintained or enhanced without significant effort/bureaucracy• Report data workflow is not visible• Business has low visibility into data “massaging” occurring in PL/SQL views maintained by technology • Time to market for new/revised reports and ad hoc analysis does not align with the rapidly changing pace
of the business environment• Recruiting and retention of resources to support legacy platforms is challenging• Data blending of additional non-trivial is still a challenge
Challenges to Achieving Advanced Analytics

Use Cases
#inspire15
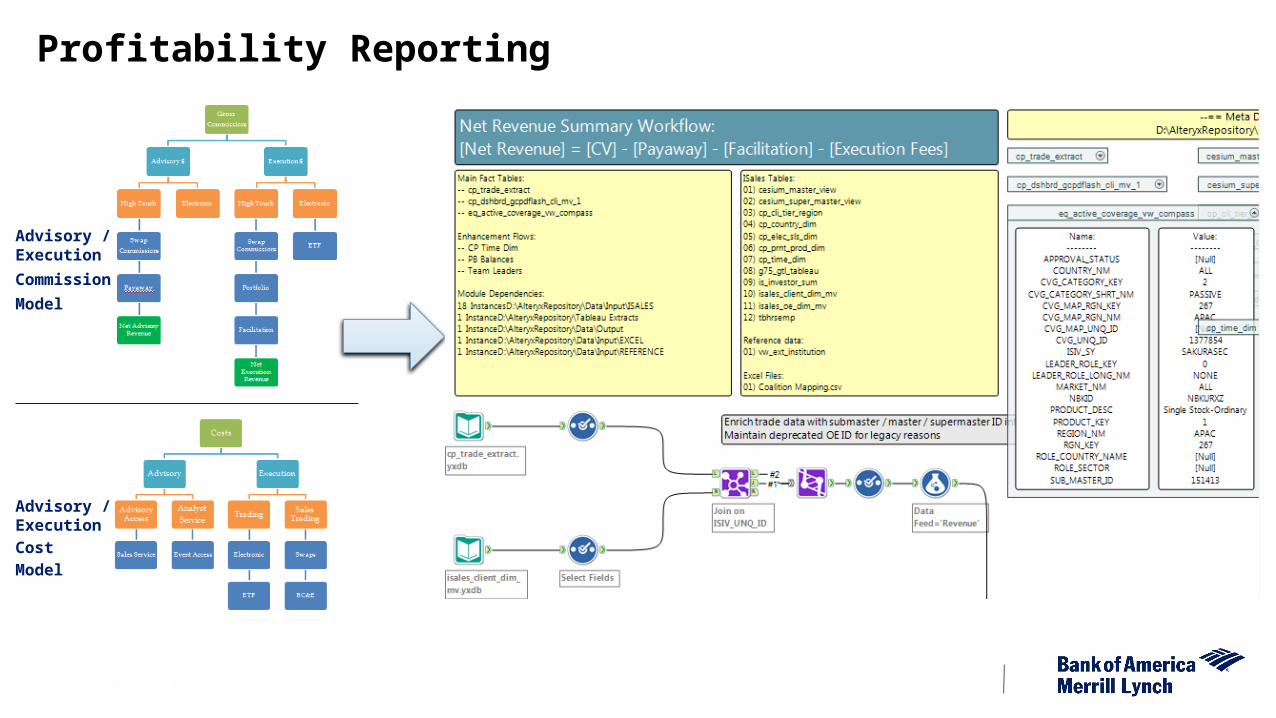
Profitability Reporting
Advisory / Execution
Commission
Model
Advisory / ExecutionCostModel
#inspire15
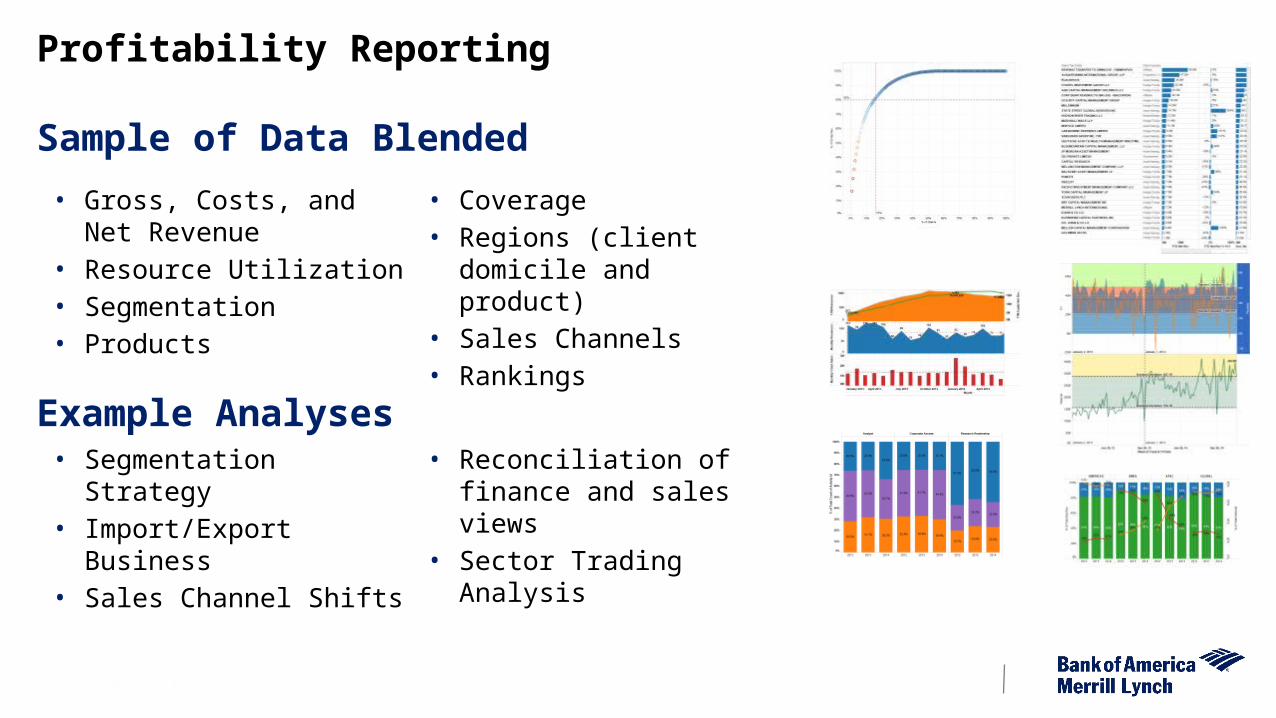
Sample of Data Blended
• Gross, Costs, and Net Revenue
• Resource Utilization• Segmentation• Products
• Coverage• Regions (client domicile and
product)• Sales Channels• Rankings
Profitability Reporting
Example Analyses• Segmentation Strategy• Import/Export Business• Sales Channel Shifts• Reconciliation of finance and
sales views
• Sector Trading Analysis
#inspire15
Volcker Rule / RENTD (Reasonably Expected Near Term Demand)
• Inventory must be based on reasonably expected near term demands of clients, customers, and counterparties
• Goal was to quickly identify the percentage of listed derivative orders facilitated for customers versus other hedging activity
• Leveraged 2 years of listed order fills (several million individual fills) • Capacity to crank through iterative analysis and assumptions in days would ordinarily
have taken weeks using traditional tools/methods
Ad Hoc Data Investigation
#inspire15
Documentation Team / Resource Utilization
• Areas of Focus:• Focus negotiation resources on the right clients• Execute the right documents• Recover resource expenditure and realize incremental revenue• Resource the documentation team appropriately
• Analysis leverages documentation workflow data, client hierarchy, revenue data, and customer segmentation
• Example of ad hoc investigation evolving into a production report
Ad Hoc Data Investigation
#inspire15
Competitive Benchmarking
• External benchmark data (market share, upside opportunities)• Goal was to address management feedback:• Data not aligned to internal view of the client or reference data• Large data sets were difficult to handle in Excel• Data often stale by the time it was distributed
• Automated Process aligns clients, products, and regions at a consistent level• Automated Process also blends internal metrics e.g. client domicile, client industry,
segmentation, touch points, broker vote ranks, coverage, net revenue• Management now have self-service access with robust scenario analysis
Data Blending
#inspire15
Complex Reconciliation Solution
• Operations team 100% dedicated to reconciling client trade data with internal systems• Leverages trade data, agreement terms, multiple client mappings, etc• Initial tactical solution scraped data from Web-based applications and blended with
database • 200+ agreements, 2-3 hours per client = 400-600 hours per month = 3-4 FTE• Automated process takes 10 minutes to pull all data and reconciles each client in 3
seconds• Total process takes 20 minutes including generation of all reports and related outputs
Process Automation
#inspire15
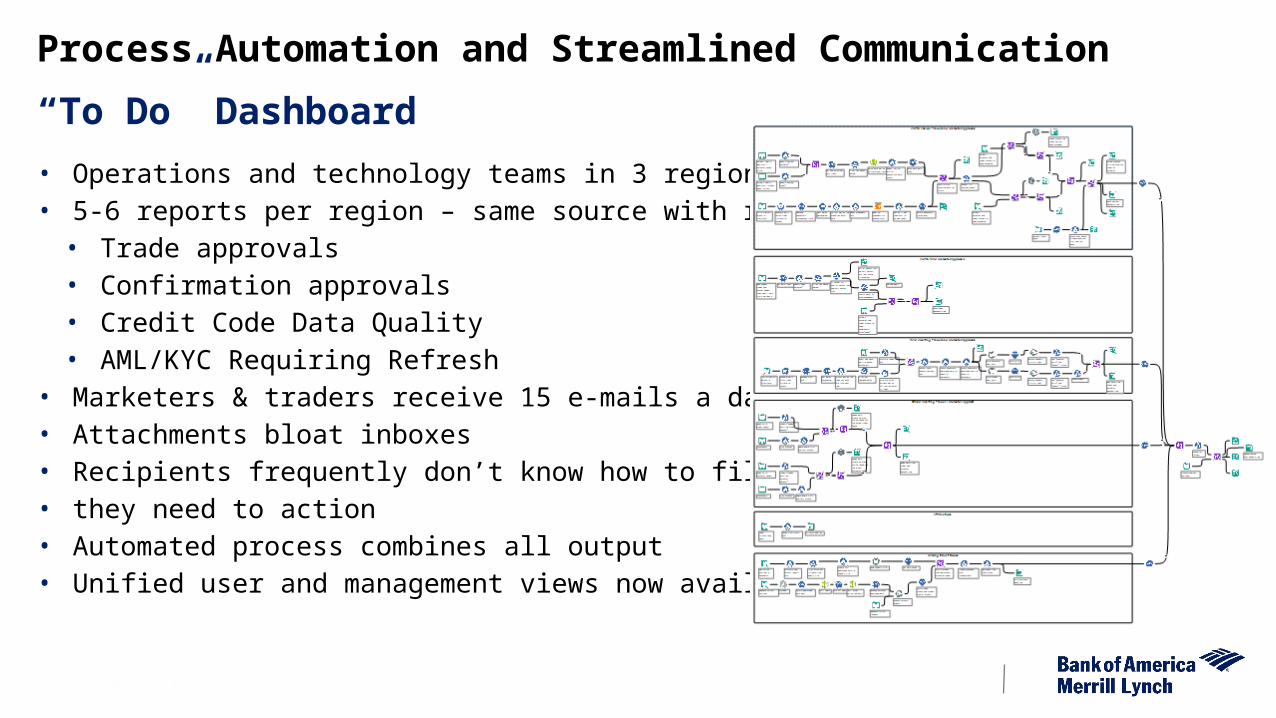
“To Do” Dashboard
• Operations and technology teams in 3 regions• 5-6 reports per region – same source with regional filters• Trade approvals• Confirmation approvals• Credit Code Data Quality• AML/KYC Requiring Refresh
• Marketers & traders receive 15 e-mails a day• Attachments bloat inboxes• Recipients frequently don’t know how to filter for items • they need to action• Automated process combines all output• Unified user and management views now available
Process Automation and Streamlined Communication
#inspire15
Regression Testing of Business Intelligence Dashboards
• Regression testing hundreds of published views had been a challenge• Dashboard files are both stored as XML• Generated dependency maps of:• Published/in-development workbooks to data layers• Workbooks & data layers to specific dimensions / measures• Generated inventory of all tools used across every workflow• Focused testing strategy for each release i.e. what workbooks/views need to be tested
Release Management
#inspire15
• Gaining more benefit from business intelligence platforms• Talent needs are evolving• Prototypes delivered more quickly• Data quality issues identified, rectified, and monitored more quickly• Process automation will influence shape of organization over time• Significant improvements in time to market of ad hoc data investigations requiring large
and complex data sets• Federated and reusable workflows exposed via the Web
• Powerful utilities for non-technical users e.g. bulk in/bulk out, fuzzy matching of names to IDs, etc
Summary of Progress

Thank You!
#