Embed Size (px)
Citation preview

Innovations in marketing effectiveness measurement.
1
Content
2
Content Page
Forward. Solving the short-comings or traditional MM modeling and marketing ROI measurement 3
Towards a new paradigm for marketing measurement and MM Models 4
Global Analytics Partners/Bottom-Line Analytics: Experience & Track Record 5 - 7
Key Deliverables for Standard Marketing-Mix Models 8
Next Generation Marketing Mix Modeling: The basic proposition free of marketing silos 9
Four measurement innovations for Next-Generation Marketing-Mix Modeling 10
Measuring the long-term effect of media & why it is critical 11
Measuring ads and ad creative ROI 12
Case study. Using copy test metrics in Next-Generation MM models to monetize ad creative 13-14
Integrated marketing and measurement of "marketing synergies and interactions" 15-16
Getting Digital ROI Measurement Right 17
Solving for Multi-Touch Attributin bias 18-23
Simulation and Forecasting tools 24
Measuring the "Voice-of-the-Customer" via Social Media 25-37
Global-Analytics Partners 38
Reasons for Working with US 39
Contact 40

Forward
• Since the late eighties and early nineties, marketing-mix modeling has been touted as the gold standard of marketing measurement. Yet, despite tremendous change in the market-place and growth in media channels, especially digital ones, there has been little or no change or adaptation of MM modeling to the new market realities
– MM Modeling has been criticized for its focus only on short-term marketing response and, for the most part, not adapting to more advanced methods for measuring long-term marketing impacts and customer loyalty and repeat-purchase dynamics. Because MM models mostly focus only on short-term effects of adverting, this has relegated the ad investment to negative ROI in about 85% of cases. Without consideration of the larger long-term effects of advertising, there is a major under-estimation of the true value of advertising and marketing and this has caused an incorrect focus on short-term only marketing.
– A lot of the underlying method of MM models relies on statistical assumptions which assume complete independence of the marketing drivers. Marketing can not be relegated to silos. All of this ignores the synergistic and more complex symphony represented by multiple marketing activities acting together.
– Marketing is all about a brand’s “relationship” with customers. Yet, through all of this, “the voice-of-the-customer” remains silent in the MM modeling exercise. The proper step for MM modeling requires developing a means for measuring the various aspects of the customer-brand-experience and clearly understanding the brand value proposition directly from the customer’s perspective
– MM modeling focuses pretty much exclusively on marketing channels. Media effectiveness is seen through the lenses of TV, radio, print or digital channels. All of this ignores that marketing is really about “message and communication”. MM Modeling needs to change its focus and measurement towards the effectiveness of ad message and creative. This is a major missing piece that limits MM Modeling from being an effective and powerful tool for forming marketing communications strategies.
– MM modeling has also been criticized for its inability to accurately address the issue of digital multi-touch attribution. Single equation econometric models often yield biased solutions, with extreme solutions favoring the media or activity closest in proximity to the sales conversion and giving no or little credit to key touch-points along the customer journey path. This means that more advanced “multi-equation” econometric solutions need to be employed which will better account for and accommodate the actual pathways and media touch points of the customer journey.
3

Marketing-Mix Modeling: Reinventing a new paradigm for marketing measurement
• Everybody agrees that the last 20-30 years has witnessed a significant and seismic change in the general marketing landscape. Marketing has become significantly more complex:
– Explosion of new marketing channels, especially of a digital nature
– Expansion of direct marketing and above/below the line marketing programs
– Rapid expansion of social media and a power-shift tilted more directly towards the “voice-of-the-customer”.
– A greater reliance on data and a CEO infused demand for more accountability from marketing investments
• Beginning in the late 1980’s, Marketing-Mix models have become the de facto standard of evaluating return on investment, driving billions of dollars in marketing spending across industries. Yet, with all the dramatic change in the marketing landscape, there has been little to no change in how these models calibrate and measure marketing ROI. The tools have failed to adapt and this has stimulated a chorus of criticisms, wondering if Marketing-Mix Modeling is obsolete
• In a recent AdAge article entitled “Marketing-Mix Models Get Pushback As Media Landscape Changes” (Apr. 2013), we hear a growing chorus of critics.
• “Some critics believe the models have been wrong all along, and work even worse after three decades of change in the media landscape. They say the models underestimate the impact of advertising, particularly of broad-reach network TV; overstate the value of price promotion, mislead marketers into buying thinly rated programming; wrongly downplay risks of going dark for weeks on end; and fail to account for how online search has made all advertising more effective”.
• There seems to be a consensus that a new paradigm needs to be developed for marketing measurement. Such a paradigm needs to provide tools and solutions which shift the dialogue for traditional MM modeling away from short-term solutions and more towards inclusion of long-term ROI assessments and a focus more centered on marketing messaging and providing measurement and feedback from the “voice-of-the-customer”.
• This document and intent is totally focused on developing this new paradigm, which we call “Next Generation Marketing-Mix Modeling”. 4
Introducing…
Bottom-Line Analytics & GAP is a full service consulting group focusing on marketing effectiveness and brand performance analytics.
Our modeling experts have a total of over 150 years of direct experiencewith marketing mix modeling with direct experience in over 40 countries
We are dedicated to the principles of innovation, excellence and uncompromising customer service.
Everything we do is geared towards improving commercial performance.
5
&
Full Service Analytics Capability
Social Media ROI
Marketing Mix Modelling
Pricing Optimization
Radial Landscape Mapping
Key Drivers Analysis
Demand Forecasting
Customer Satisfaction Modelling
Digital Performance Analytics Dashboards
Segmentation Analysis
Decision-Support Systems
6
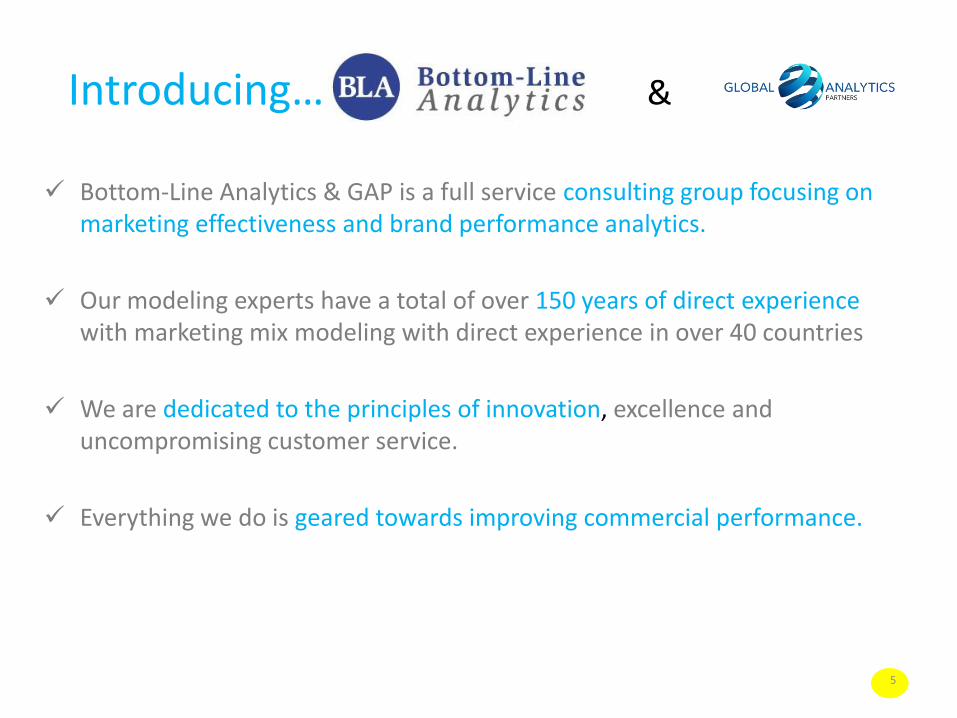
BLA is a trusted advisor to a wide array of clients
We believe in the continuous innovative application of analytics to advance customer centric decision
making for improved business performance.
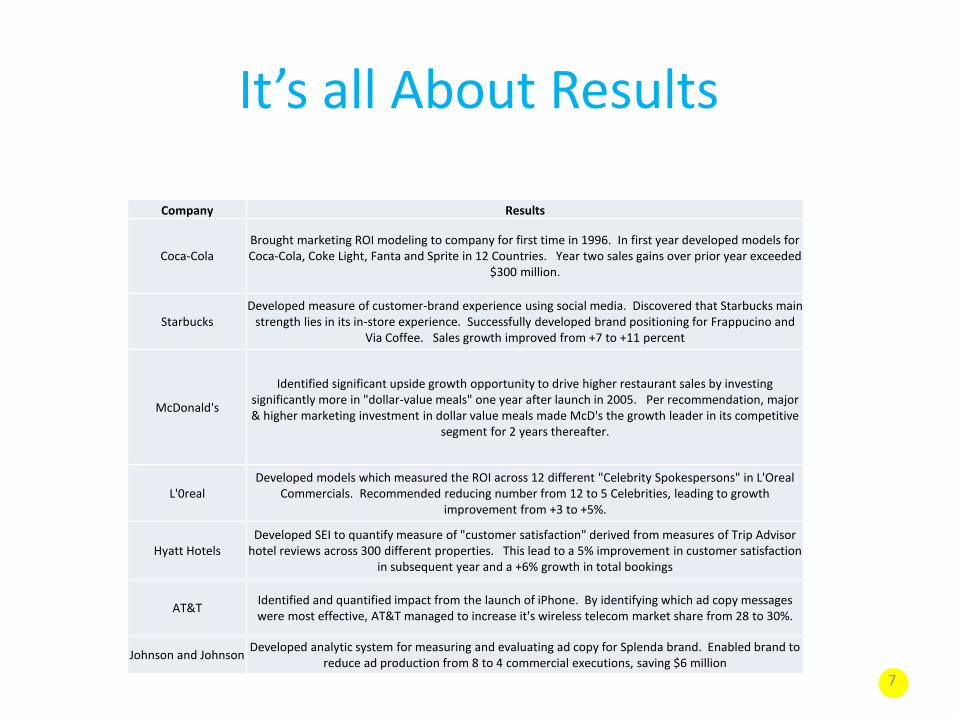
It’s all About Results
Company Results
Coca-ColaBrought marketing ROI modeling to company for first time in 1996. In first year developed models for Coca-Cola, Coke Light, Fanta and Sprite in 12 Countries. Year two sales gains over prior year exceeded
$300 million.
StarbucksDeveloped measure of customer-brand experience using social media. Discovered that Starbucks main
strength lies in its in-store experience. Successfully developed brand positioning for Frappucino and Via Coffee. Sales growth improved from +7 to +11 percent
McDonald's
Identified significant upside growth opportunity to drive higher restaurant sales by investing significantly more in "dollar-value meals" one year after launch in 2005. Per recommendation, major & higher marketing investment in dollar value meals made McD's the growth leader in its competitive
segment for 2 years thereafter.
L'0realDeveloped models which measured the ROI across 12 different "Celebrity Spokespersons" in L'Oreal
Commercials. Recommended reducing number from 12 to 5 Celebrities, leading to growth improvement from +3 to +5%.
Hyatt HotelsDeveloped SEI to quantify measure of "customer satisfaction" derived from measures of Trip Advisor
hotel reviews across 300 different properties. This lead to a 5% improvement in customer satisfaction in subsequent year and a +6% growth in total bookings
AT&TIdentified and quantified impact from the launch of iPhone. By identifying which ad copy messages were most effective, AT&T managed to increase it's wireless telecom market share from 28 to 30%.
Johnson and JohnsonDeveloped analytic system for measuring and evaluating ad copy for Splenda brand. Enabled brand to
reduce ad production from 8 to 4 commercial executions, saving $6 million
7
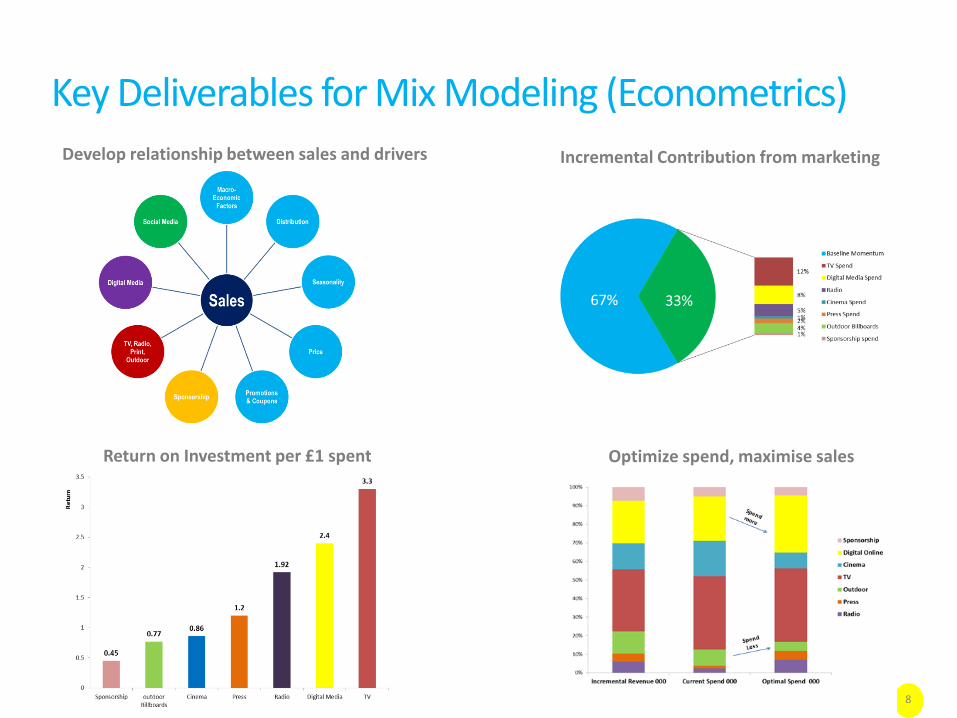
Incremental Contribution from marketing
Return on Investment per £1 spent Optimize spend, maximise sales
Develop relationship between sales and drivers
Key Deliverables for Mix Modeling (Econometrics)
8
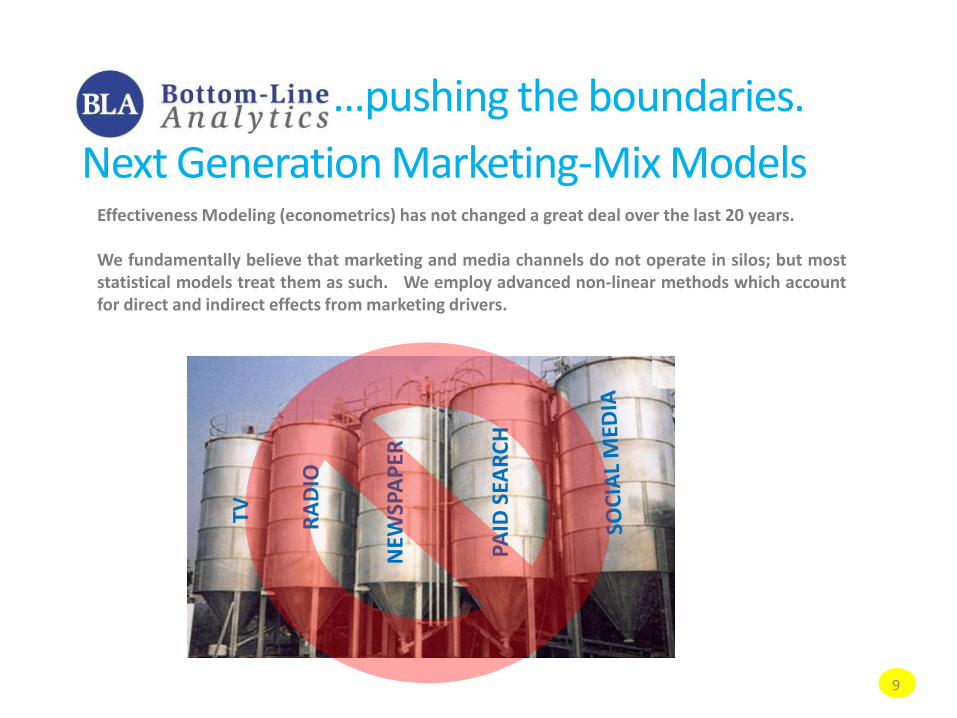
…pushing the boundaries.
Next Generation Marketing-Mix Models
TV RA
DIO
NEW
SPA
PER
PAID
SEA
RC
H
9
Effectiveness Modeling (econometrics) has not changed a great deal over the last 20 years.
We fundamentally believe that marketing and media channels do not operate in silos; but moststatistical models treat them as such. We employ advanced non-linear methods which accountfor direct and indirect effects from marketing drivers.
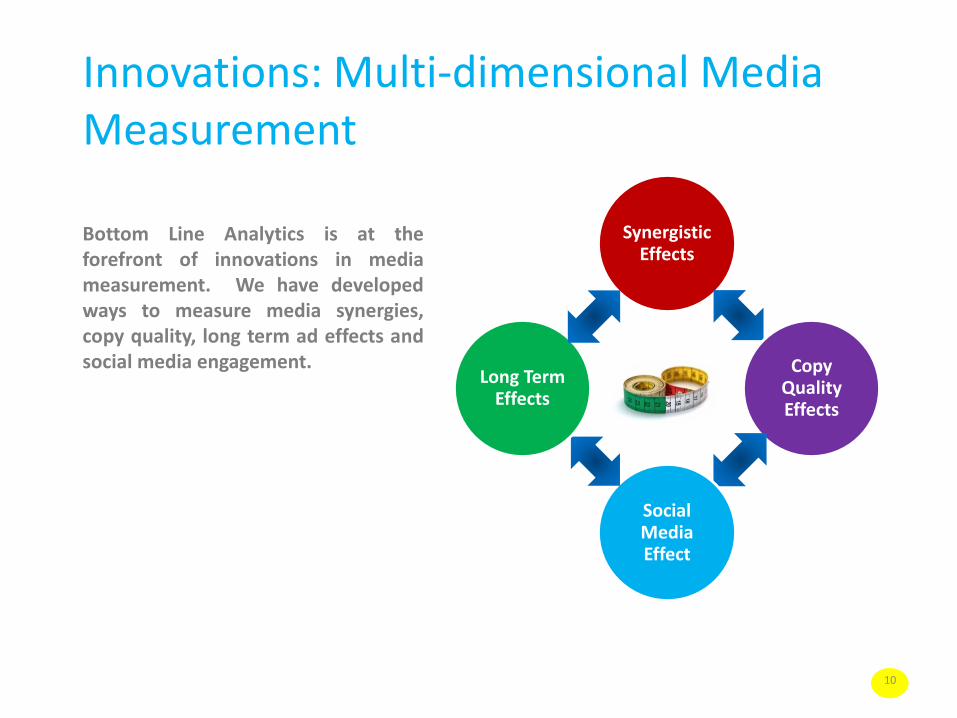
Synergistic Effects
Copy Quality Effects
Social Media Effect
Long Term Effects
Innovations: Multi-dimensional Media Measurement
Bottom Line Analytics is at theforefront of innovations in mediameasurement. We have developedways to measure media synergies,copy quality, long term ad effects andsocial media engagement.
10
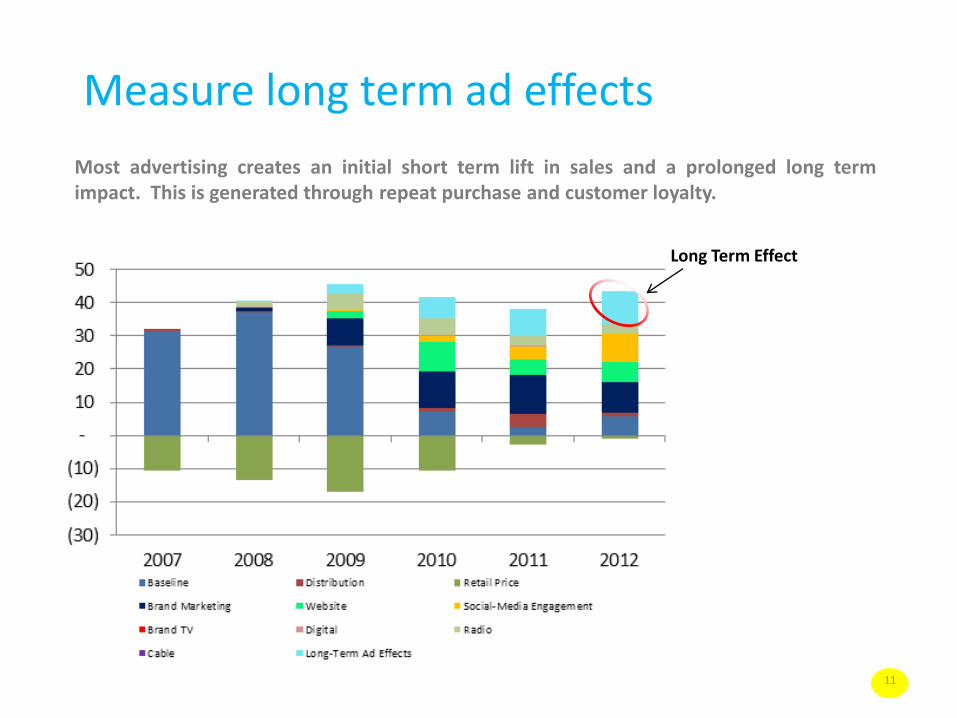
Measure long term ad effects
Most advertising creates an initial short term lift in sales and a prolonged long termimpact. This is generated through repeat purchase and customer loyalty.
Long Term Effect
11
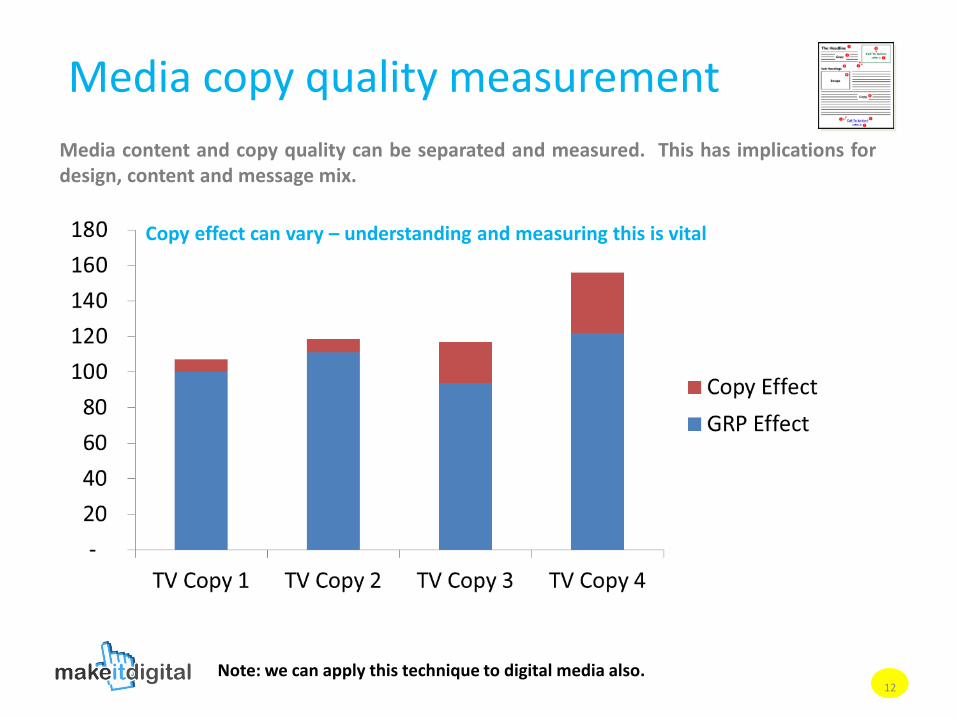
Media copy quality measurement
Media content and copy quality can be separated and measured. This has implications fordesign, content and message mix.
Copy effect can vary – understanding and measuring this is vital
Note: we can apply this technique to digital media also.12
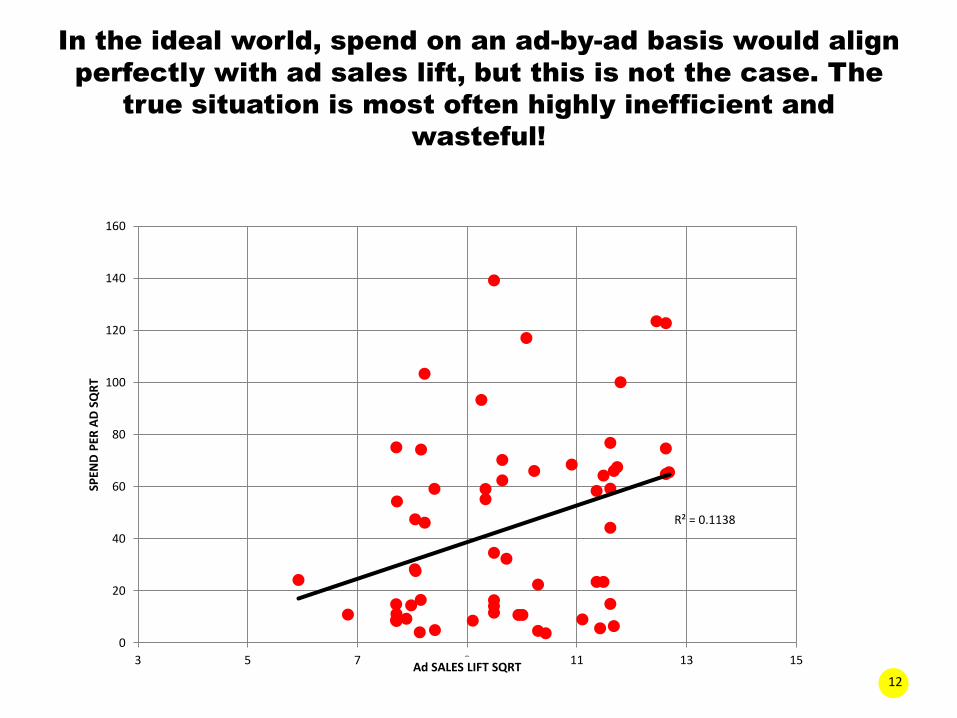
In the ideal world, spend on an ad-by-ad basis would align
perfectly with ad sales lift, but this is not the case. The
true situation is most often highly inefficient and
wasteful!
R² = 0.1138
0
20
40
60
80
100
120
140
160
3 5 7 9 11 13 15
SPEN
D P
ER A
D S
QR
T
Ad SALES LIFT SQRT12
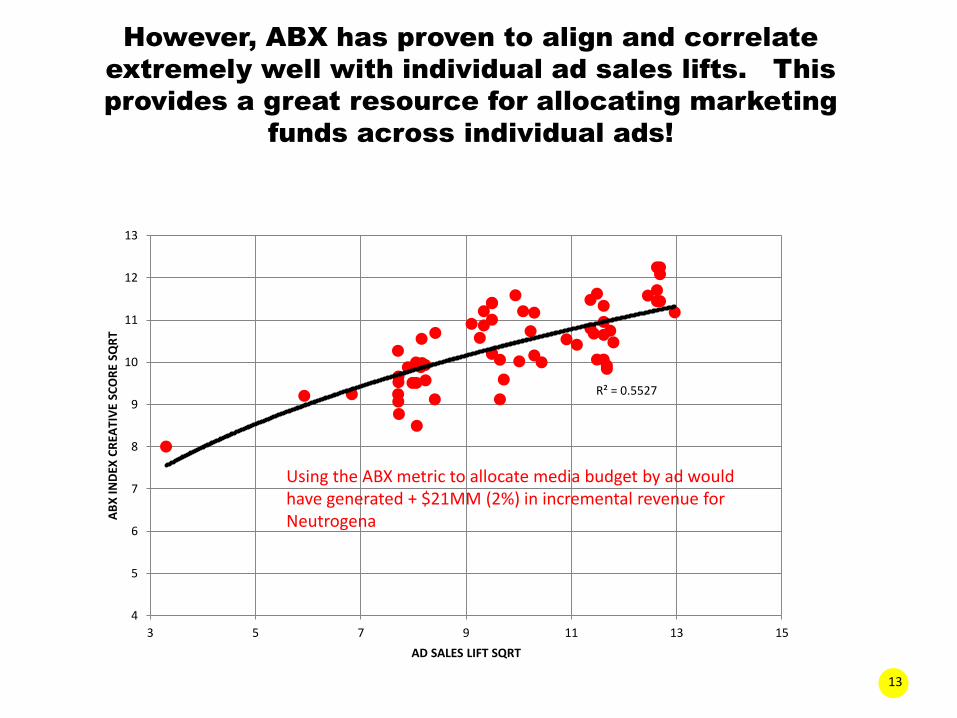
However, ABX has proven to align and correlate
extremely well with individual ad sales lifts. This
provides a great resource for allocating marketing
funds across individual ads!
R² = 0.5527
4
5
6
7
8
9
10
11
12
13
3 5 7 9 11 13 15
AB
X IN
DEX
CR
EATI
VE
SCO
RE
SQR
T
AD SALES LIFT SQRT
Using the ABX metric to allocate media budget by ad would have generated + $21MM (2%) in incremental revenue for Neutrogena
13

Marketing Synergies
-
500
1,000
1,500
2,000
2,500
3,000
3,500
4,000
Separate Impact Simultaneous Activation
Marketing Synergy
Radio
Digital
Radio and Digital Media are most effective when executed together. There is about a +45% synergy or additional lift due to simultaneous activation.
15
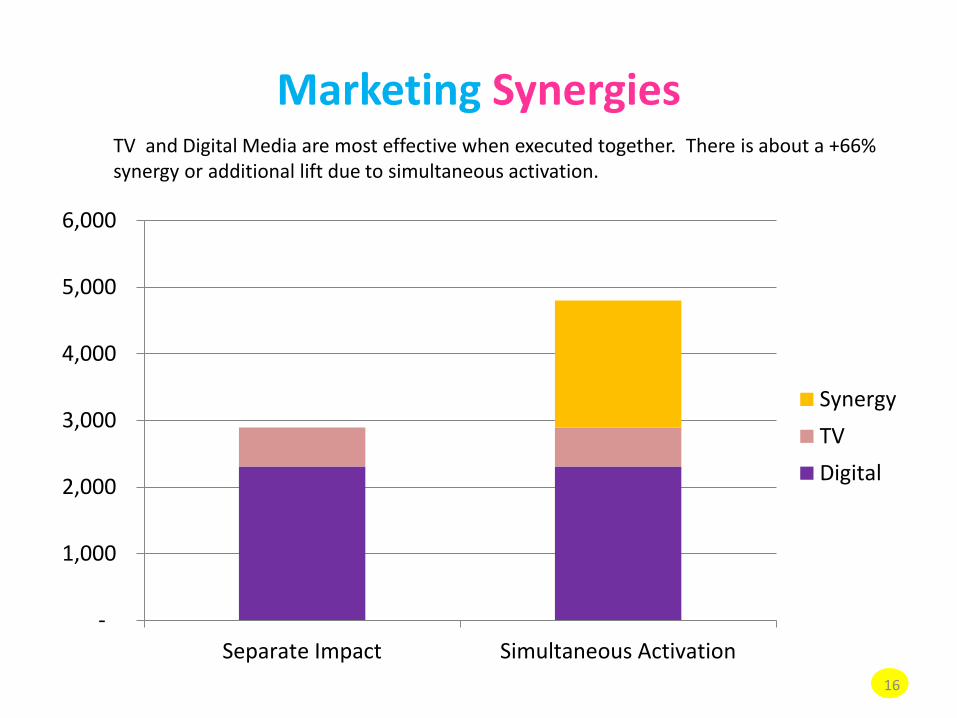
Marketing Synergies
-
1,000
2,000
3,000
4,000
5,000
6,000
Separate Impact Simultaneous Activation
Synergy
TV
Digital
TV and Digital Media are most effective when executed together. There is about a +66% synergy or additional lift due to simultaneous activation.
16
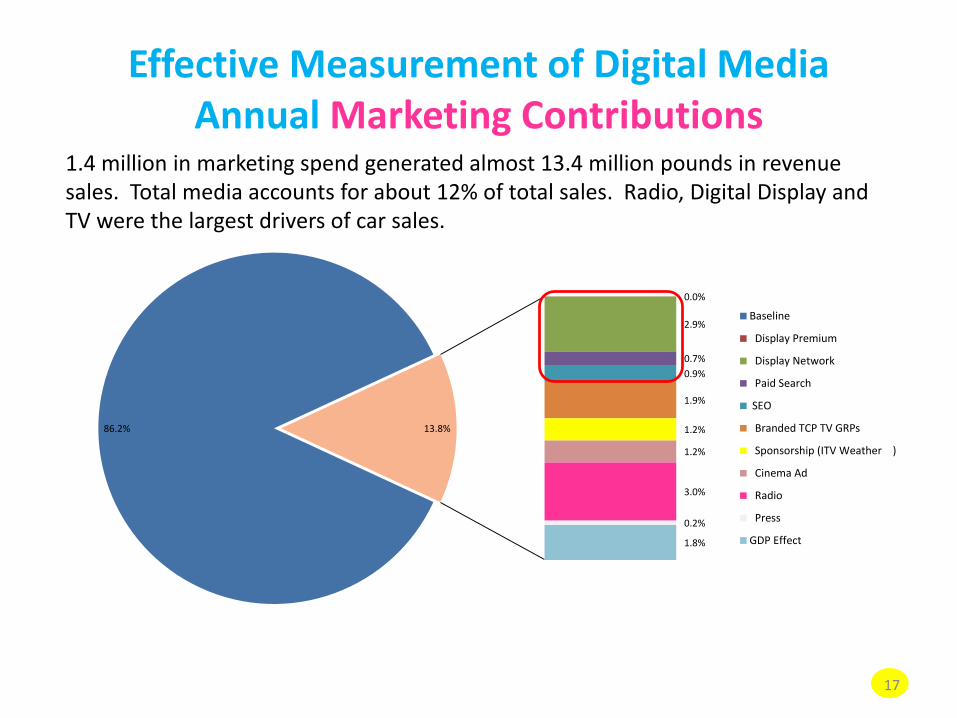
Effective Measurement of Digital MediaAnnual Marketing Contributions
86.2%
0.0%
2.9%
0.7%
0.9%
1.9%
1.2%
1.2%
3.0%
0.2%
1.8%
13.8%
Baseline
Display Premium
Display Network
Paid Search
SEO
Branded TCP TV GRPs
Sponsorship (ITV Weather )
Cinema Ad
Radio
Press
GDP Effect
1.4 million in marketing spend generated almost 13.4 million pounds in revenue sales. Total media accounts for about 12% of total sales. Radio, Digital Display and TV were the largest drivers of car sales.
17
Addressing the issue or “multi-touch” marketing attribution bias
• A common and well-known criticism of current MM models is their failure to accurately cover and reflect the influence of different channels, especially digital ones, that reflect the customer journey towards sales conversions. Frequently, what we find is a bias that favors the specific channel closest to the sales conversion, attributing most of the impact to that single last-touch point.
• MTA or multi-touch attribution covers the challenge of attributing accurate impact of our marketing and advertising efforts across multiple devices (desktop, laptop, mobile, TV) and/or channels.
• On the next slide, we illustrate how different model methodologies generate results from the same data case study.
• Our findings reveal that common “single equation” econometrics yields extreme results, assigning near full credit to one single channel.
• By using more advanced and multi-equation econometric methods, we are able to develop models which simulate a path-solution rather then point-in time responses. These more advanced multi-equation models allow for each marketing channel to assume its more accurate impact based on the true consumer purchase path.
17
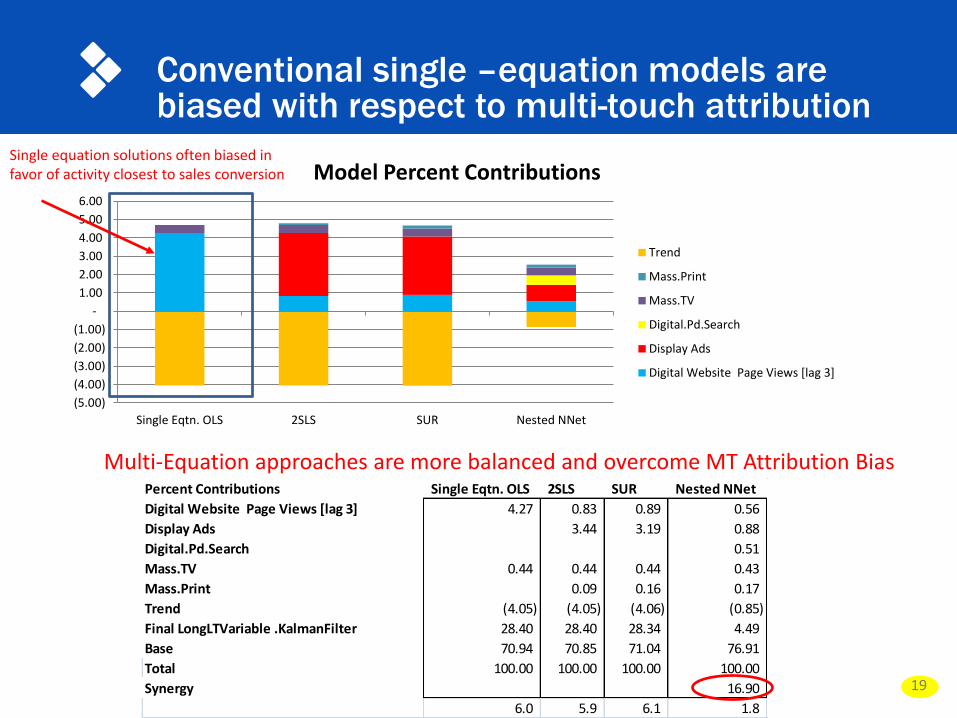
Percent Contributions Single Eqtn. OLS 2SLS SUR Nested NNet
Digital Website Page Views [lag 3] 4.27 0.83 0.89 0.56
Display Ads 3.44 3.19 0.88
Digital.Pd.Search 0.51
Mass.TV 0.44 0.44 0.44 0.43
Mass.Print 0.09 0.16 0.17
Trend (4.05) (4.05) (4.06) (0.85)
Final LongLTVariable .KalmanFilter 28.40 28.40 28.34 4.49
Base 70.94 70.85 71.04 76.91
Total 100.00 100.00 100.00 100.00
Synergy 16.90
6.0 5.9 6.1 1.8
Conventional single –equation models are biased with respect to multi-touch attribution
19
(5.00)
(4.00)
(3.00)
(2.00)
(1.00)
-
1.00
2.00
3.00
4.00
5.00
6.00
Single Eqtn. OLS 2SLS SUR Nested NNet
Model Percent Contributions
Trend
Mass.Print
Mass.TV
Digital.Pd.Search
Display Ads
Digital Website Page Views [lag 3]
Multi-Equation approaches are more balanced and overcome MT Attribution Bias
Single equation solutions often biased in favor of activity closest to sales conversion

Single Equation Regression Model
Sales
Web Page View
TVPrint
BaseTrend
Lag 3
1) Sales is attributed to Web Page Views, TV, Base and Trend
2) Numerous variables are not significant + multicollinear
20
Long Term
Media
3) Very high attribution on 1 variable (last touch?)
Competitor
Ads
Display Ads
Paid Search
20
The most common approach to MM modeling is single-equation models, which have a highlikelihood of generating biased attribution due to “last-touch attribution bias”.
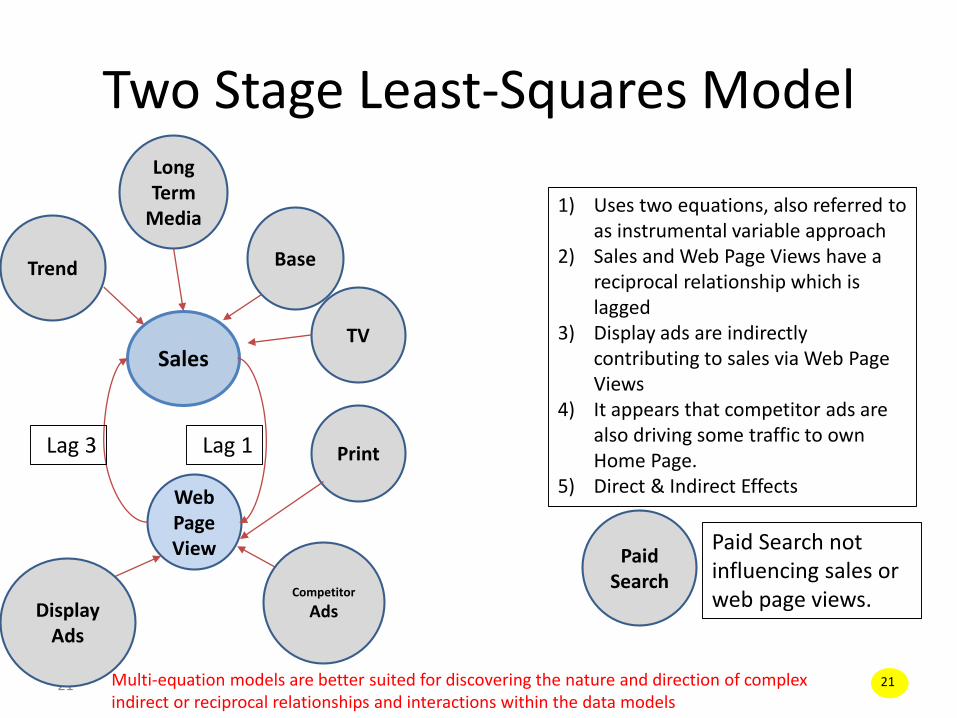
Two Stage Least-Squares Model
Sales
Web Page View
TV
BaseTrend
Lag 3 Lag 1
1) Uses two equations, also referred to as instrumental variable approach
2) Sales and Web Page Views have a reciprocal relationship which is lagged
3) Display ads are indirectly contributing to sales via Web Page Views
4) It appears that competitor ads are also driving some traffic to own Home Page.
5) Direct & Indirect Effects
Paid Search not influencing sales or web page views.
21
Paid Search
Display Ads
Competitor
Ads
Long Term
Media
21Multi-equation models are better suited for discovering the nature and direction of complexindirect or reciprocal relationships and interactions within the data models

Seemingly Unrelated Regressions (SUR)
22
Display Ads
Sales
Web Page View
TV
Long Term
Media
Trend
This variables is not significantPaid
Search
Lag 1Lag 3
1) Like SEM for time series modeling. SUR is a true Multi-equation system
2) When errors are correlated, solution is a path rather than discrete data variables. This path can be assumed to be the attribution path.
3) But when the regression errors really are unrelated, then we are just generating single eqtn. OLS results
Competitor
Ads
22

Nested Neural-Network Model
23Sales
TV PrintDisplay
AdsPaid Search
Long Term Media
AllMarCom
Competitor
Ads
Web Page Views
Trend
1) All MarCom Variables pooled into meta-variable and dynamically weighted
2) Good for discovery of non-linearity, interaction and synergistic effects without a priori knowledge
3) Have undeserved reputation for being black-box & can be trained to be stupid.

Play out marketing What-if scenarios
An interactive dashboard allows you to simulate different marketing mix/spend
scenarios and assess the resultant impact on sales and profitability.
1. Set marketing budgets.
2. Set your spend levels across media channels
3. Assess the resultant impact on sales & profit
24
Measuring the “Voice-of-the-Customer” via Social MediaA breakthrough in measuring social media engagement
25

Can social media be measured?
1 The Growing Importance of Word of Mouth, www.boundless.com26
Social Media really isn’t Media as we know it. It doesn’t have “inventory” and it’s not meant to deliver “ads” like traditional “media”
Marketing was once seen as a one way relationship, with firms broadcasting their offerings and value proposition.
• Now Marketing is seen more as a conversation between marketers and customers.1
• Social media is a key and critical channel for this two-way communication
Current social media metrics are expressed in terms of “sentiment”• Positive and negative commentaries about brands
• These metrics do not seem to explain or predict purchase behavior
Many have given up and say social media can not be measured
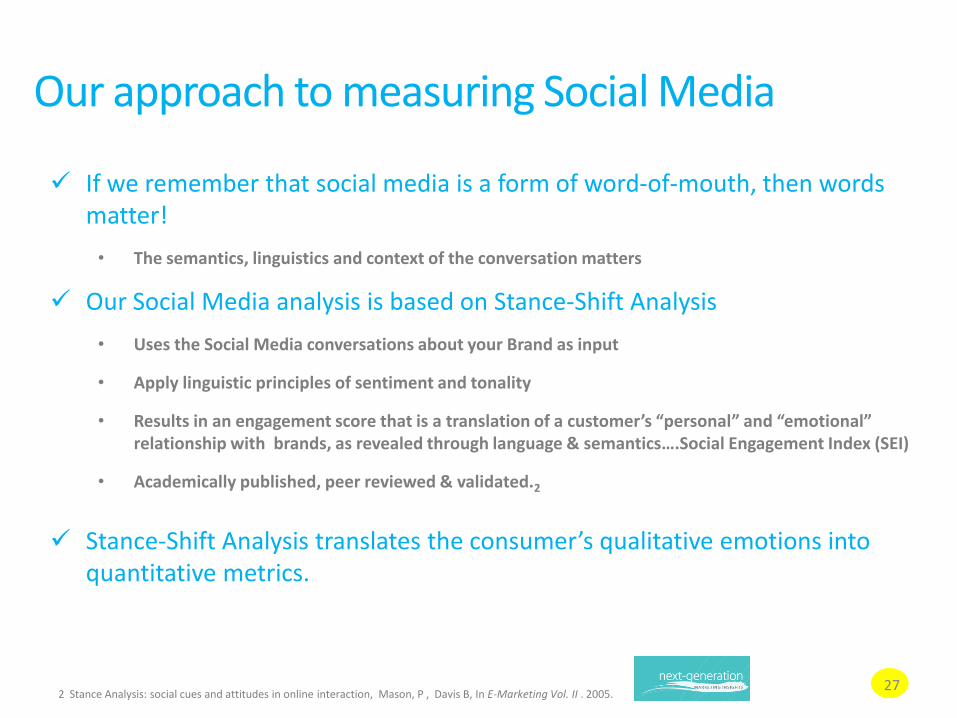
If we remember that social media is a form of word-of-mouth, then words matter!
• The semantics, linguistics and context of the conversation matters
Our Social Media analysis is based on Stance-Shift Analysis
• Uses the Social Media conversations about your Brand as input
• Apply linguistic principles of sentiment and tonality
• Results in an engagement score that is a translation of a customer’s “personal” and “emotional” relationship with brands, as revealed through language & semantics….Social Engagement Index (SEI)
• Academically published, peer reviewed & validated.2
Stance-Shift Analysis translates the consumer’s qualitative emotions into quantitative metrics.
Our approach to measuring Social Media
2 Stance Analysis: social cues and attitudes in online interaction, Mason, P , Davis B, In E-Marketing Vol. II . 2005.27

Developing the Social Engagement Index (SEI)
Net Positive SEI Index
1. Mine all brand related social media reviews and commentary.
2. Parse into positive & negative review groups
3. Apply Social Engagement Indexalgorithm to “score” reviews
4. Time code by period and aggregate metrics
Positive Reviews
NegativeReviews
Positive Scores
NegativeScores
LOW MEDIUM HIGH
HIGH 0 5 7
MEDIUM -5 0 5
LOW -7 -5 0
Emotional Effect
Per
son
alis
atio
n
28

SOCIAL
ENGAGEMENT
INDEX (SEI)
Conversations are scored on personal and emotional content
“I HAD A DIET COKE FOR LUNCH TODAY”
“THE WARM DIET COKE WAS RATHER BLAND”
29
“I REALLY LOVE MY COKE WITH PIZZA”
“I LIKE THE TASTE OF SPRITE WITH LEMON”
“MY COKE HAS LOST ITS FIZZ AND TASTES AWFUL”
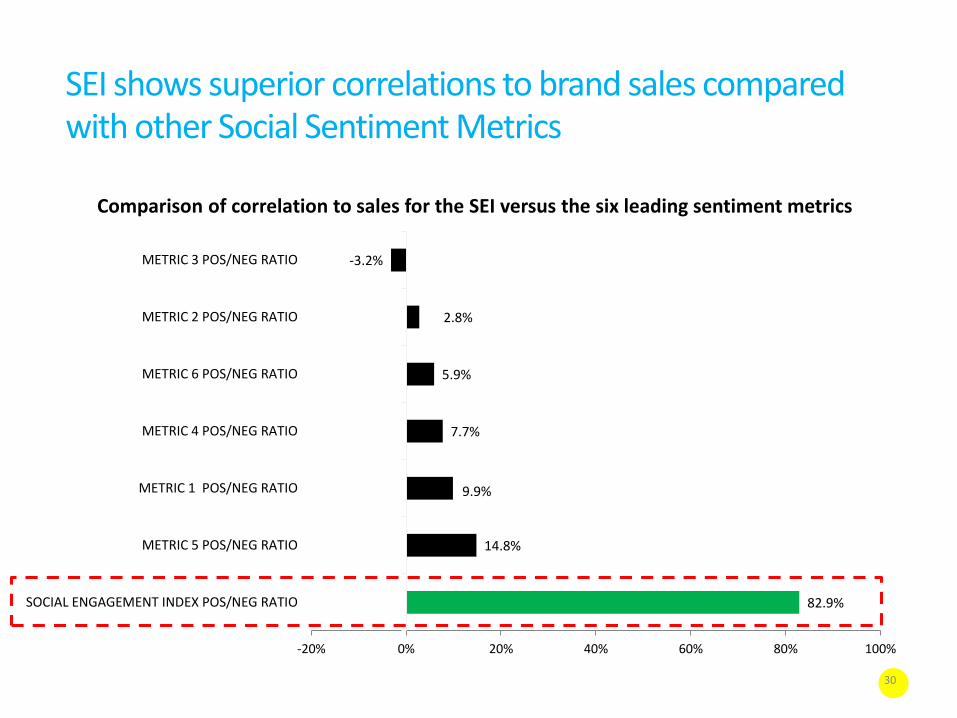
SEI shows superior correlations to brand sales compared with other Social Sentiment Metrics
82.9%
14.8%
9.9%
7.7%
5.9%
2.8%
-3.2%
-20% 0% 20% 40% 60% 80% 100%
SOCIAL ENGAGEMENT INDEX POS/NEG RATIO
METRIC 5 POS/NEG RATIO
METRIC 1 POS/NEG RATIO
METRIC 4 POS/NEG RATIO
METRIC 6 POS/NEG RATIO
METRIC 2 POS/NEG RATIO
METRIC 3 POS/NEG RATIO
Comparison of correlation to sales for the SEI versus the six leading sentiment metrics
30
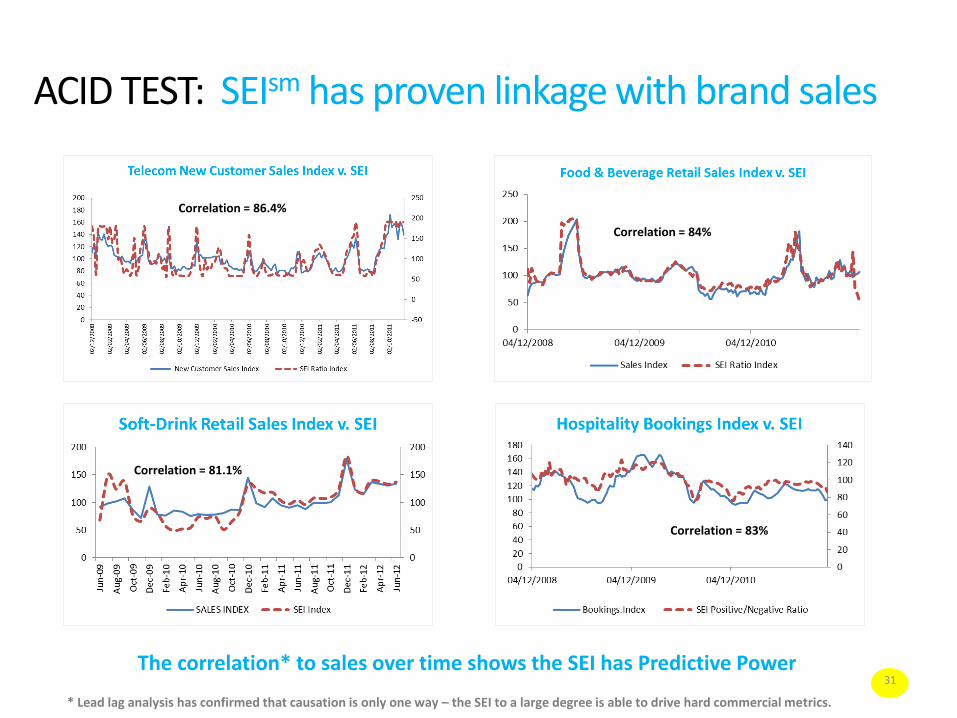
The correlation* to sales over time shows the SEI has Predictive Power31
ACID TEST: SEIsm has proven linkage with brand sales
Correlation = 86.4%
Correlation = 84%
Correlation = 81.1%
Correlation = 83%Correlation = 83%
* Lead lag analysis has confirmed that causation is only one way – the SEI to a large degree is able to drive hard commercial metrics.
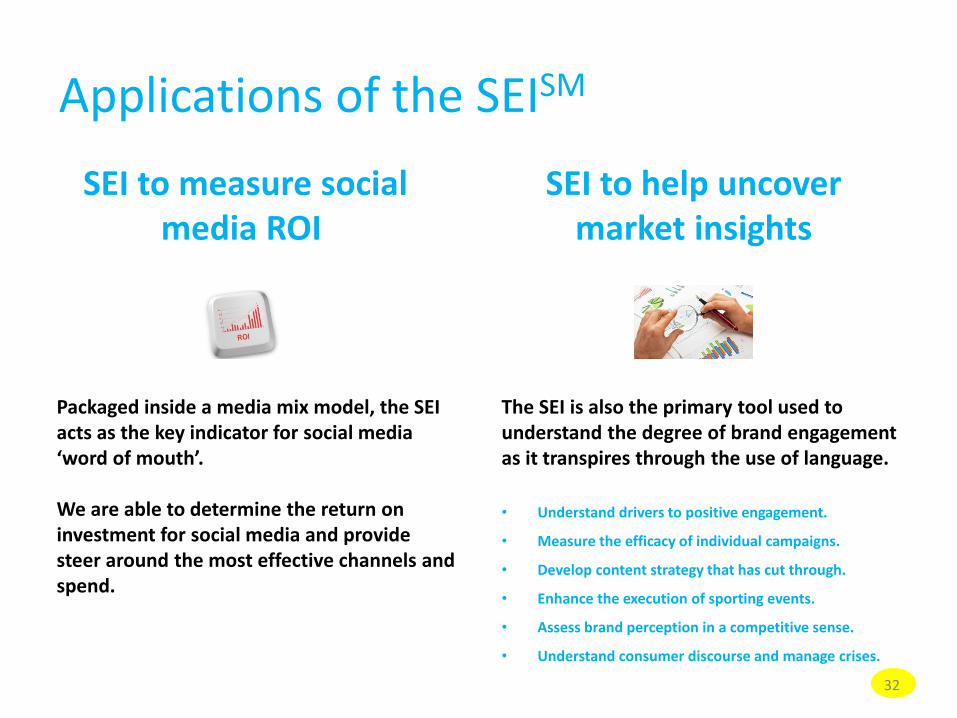
Applications of the SEISM
Packaged inside a media mix model, the SEI acts as the key indicator for social media ‘word of mouth’.
We are able to determine the return on investment for social media and provide steer around the most effective channels and spend.
SEI to help uncover market insights
The SEI is also the primary tool used to understand the degree of brand engagement as it transpires through the use of language.
• Understand drivers to positive engagement.
• Measure the efficacy of individual campaigns.
• Develop content strategy that has cut through.
• Enhance the execution of sporting events.
• Assess brand perception in a competitive sense.
• Understand consumer discourse and manage crises.
SEI to measure social media ROI
32
33
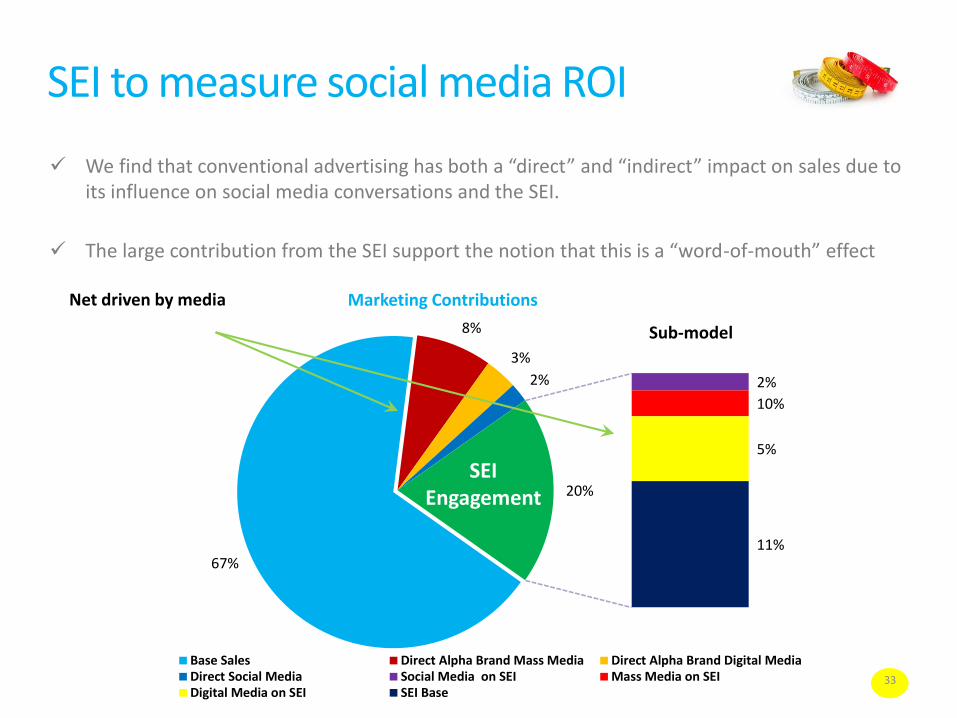
SEI to measure social media ROI
We find that conventional advertising has both a “direct” and “indirect” impact on sales due to its influence on social media conversations and the SEI.
The large contribution from the SEI support the notion that this is a “word-of-mouth” effect
67%
8%
3%
2% 2%
10%
5%
11%
20%
Marketing Contributions
Base Sales Direct Alpha Brand Mass Media Direct Alpha Brand Digital MediaDirect Social Media Social Media on SEI Mass Media on SEIDigital Media on SEI SEI Base
Net driven by media
SEIEngagement
Sub-model

34
The impact of Social Media sentiment
A key insight we uncovered across clients is the difference between “positive” and “negative” brand conversations
Negative-toned conversation have a significantly greater net impact on brand sales
+4.4%
+16.5%
0%
5%
10%
15%
20%
Positive Sentiment Negative Sentiment
The absolute impact from positive & negative consumer reviews
Marketers need to develop strategies and tactics to immediately mitigate “Negative News” and prevent them from going Viral.
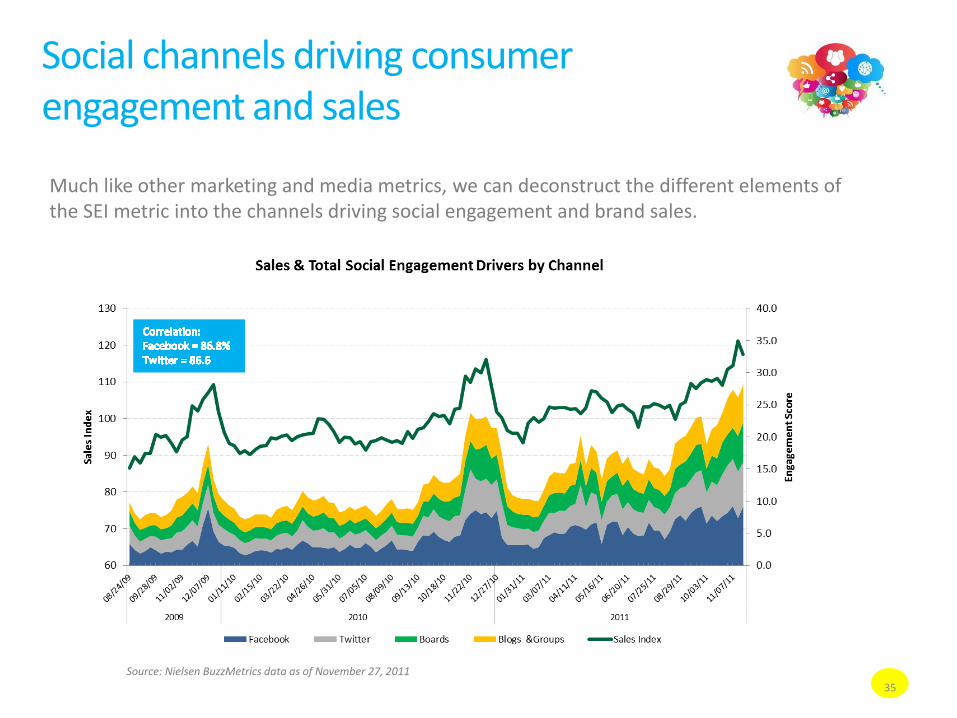
Much like other marketing and media metrics, we can deconstruct the different elements of the SEI metric into the channels driving social engagement and brand sales.
Source: Nielsen BuzzMetrics data as of November 27, 2011
Social channels driving consumer engagement and sales
35
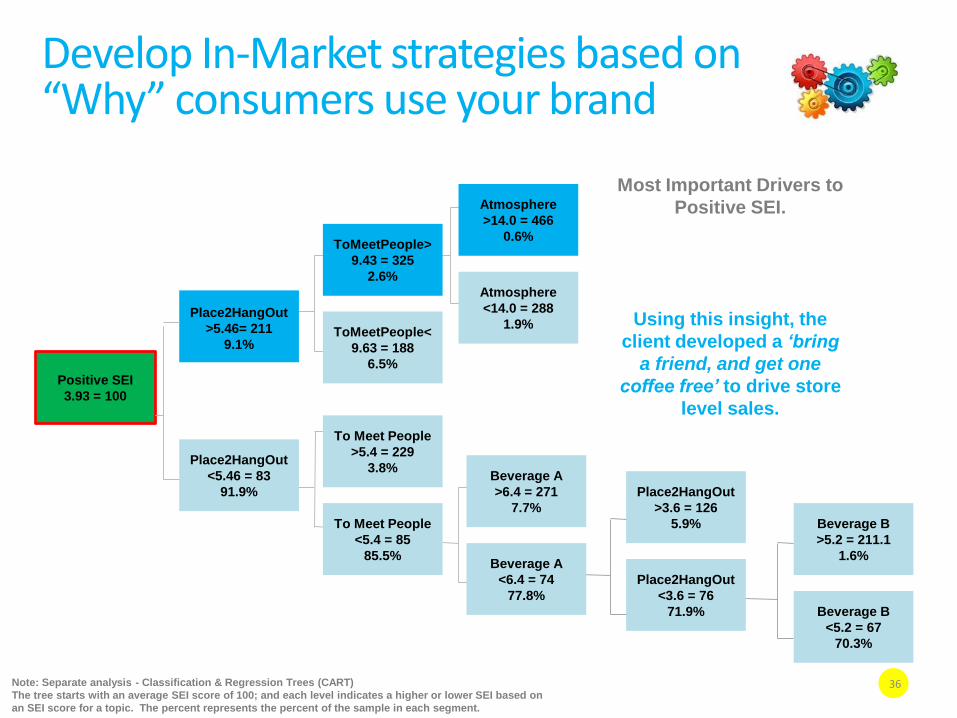
Most Important Drivers to
Positive SEI.
Using this insight, the
client developed a ‘bring
a friend, and get one
coffee free’ to drive store
level sales.
Positive SEI
3.93 = 100
Place2HangOut
>5.46= 211
9.1%
Place2HangOut
<5.46 = 83
91.9%
ToMeetPeople>
9.43 = 325
2.6%
ToMeetPeople<
9.63 = 188
6.5%
Atmosphere
>14.0 = 466
0.6%
Atmosphere
<14.0 = 288
1.9%
To Meet People
>5.4 = 229
3.8%
To Meet People
<5.4 = 85
85.5%
Beverage A
>6.4 = 271
7.7%
Beverage A
<6.4 = 74
77.8%
Place2HangOut
>3.6 = 126
5.9%
Place2HangOut
<3.6 = 76
71.9%
Beverage B
>5.2 = 211.1
1.6%
Beverage B
<5.2 = 67
70.3%
Note: Separate analysis - Classification & Regression Trees (CART)
The tree starts with an average SEI score of 100; and each level indicates a higher or lower SEI based on
an SEI score for a topic. The percent represents the percent of the sample in each segment.
Develop In-Market strategies based on “Why” consumers use your brand
36
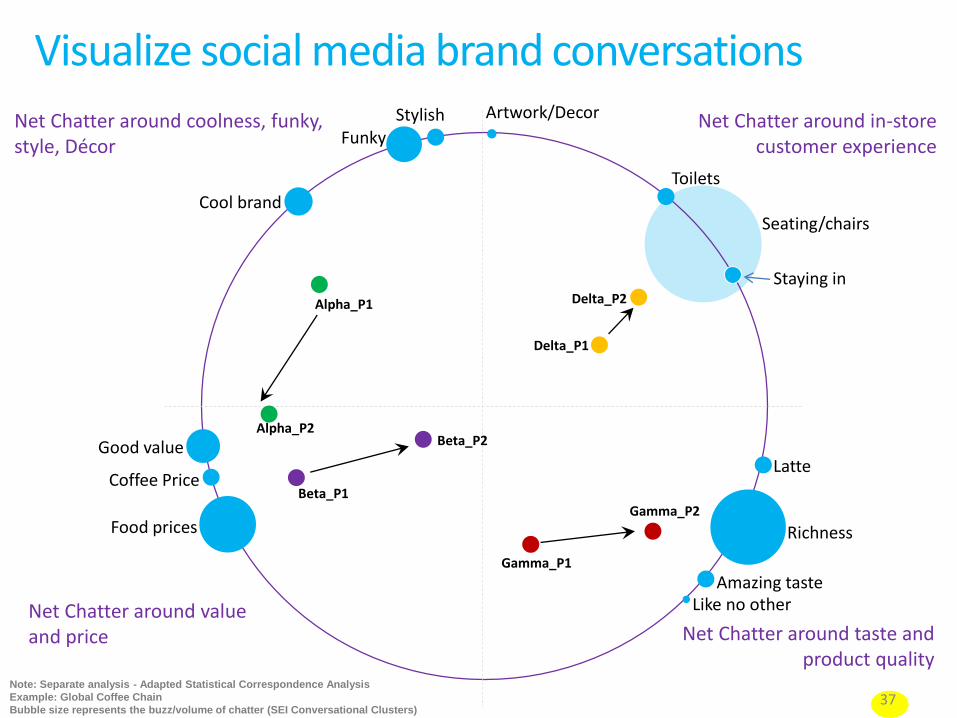
Alpha_P1
Beta_P1
Note: Separate analysis - Adapted Statistical Correspondence Analysis
Example: Global Coffee Chain
Bubble size represents the buzz/volume of chatter (SEI Conversational Clusters)
Alpha_P2Beta_P2
Gamma_P1
Gamma_P2
Net Chatter around value and price
Net Chatter around coolness, funky, style, Décor
Net Chatter around taste and product quality
Net Chatter around in-store customer experience
Delta_P2
Delta_P1
Good value
Coffee Price
Food prices
Staying in
Seating/chairs
Toilets
Richness
Latte
Amazing tasteLike no other
Cool brand
FunkyStylish Artwork/Decor
Visualize social media brand conversations
37
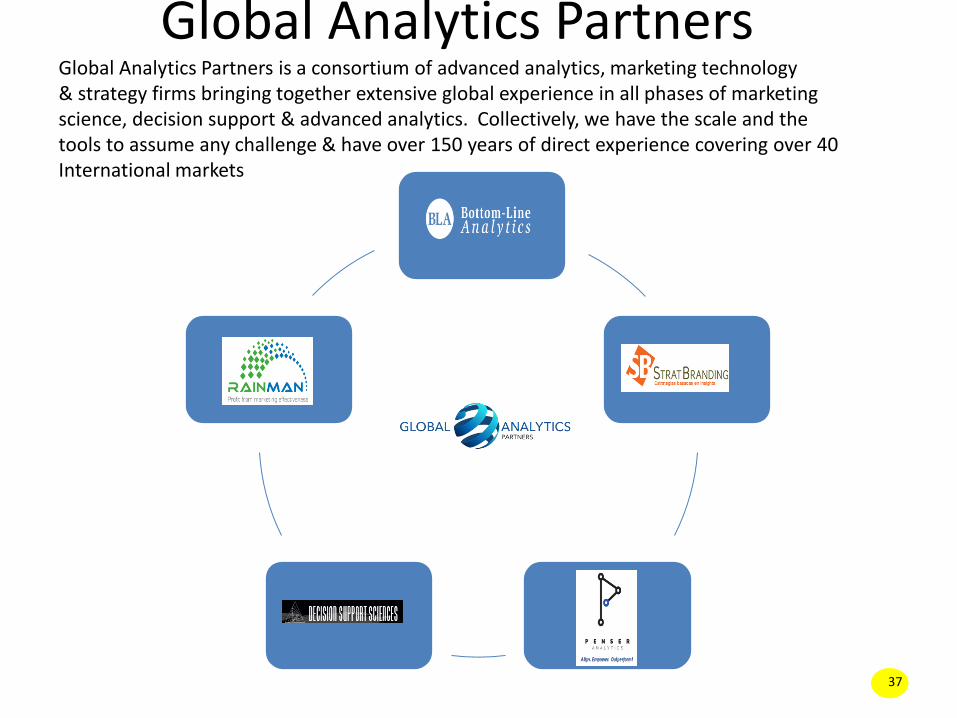
Global Analytics Partners
37
Global Analytics Partners is a consortium of advanced analytics, marketing technology& strategy firms bringing together extensive global experience in all phases of marketingscience, decision support & advanced analytics. Collectively, we have the scale and thetools to assume any challenge & have over 150 years of direct experience covering over 40International markets
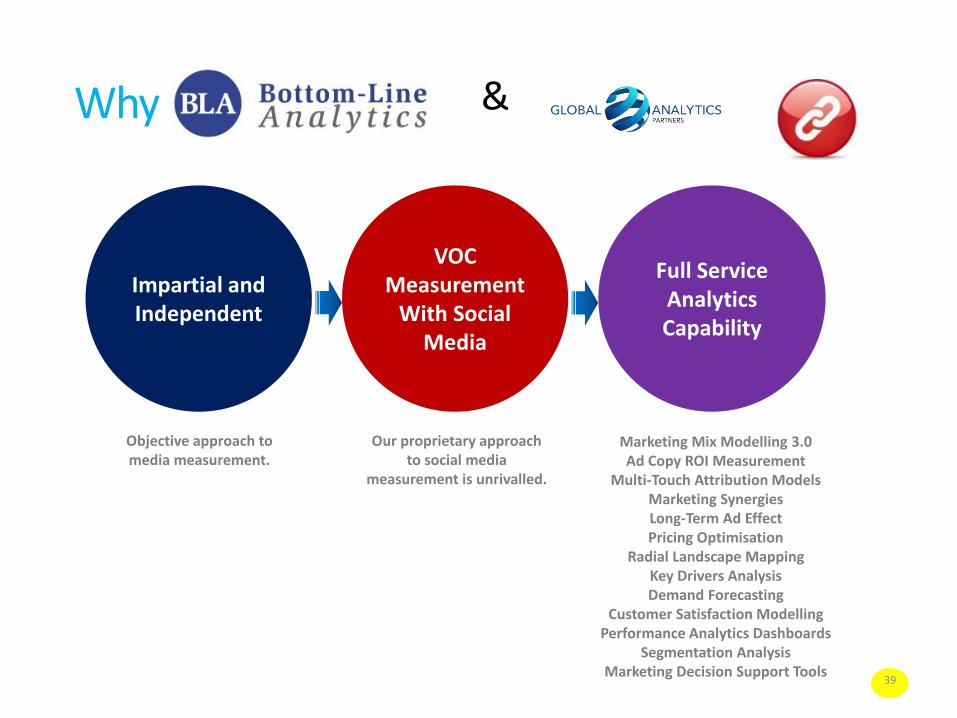
Why
Impartial and Independent
Full Service Analytics Capability
VOC Measurement
With Social Media
Marketing Mix Modelling 3.0Ad Copy ROI Measurement
Multi-Touch Attribution ModelsMarketing SynergiesLong-Term Ad EffectPricing Optimisation
Radial Landscape MappingKey Drivers AnalysisDemand Forecasting
Customer Satisfaction ModellingPerformance Analytics Dashboards
Segmentation AnalysisMarketing Decision Support Tools
Our proprietary approach to social media
measurement is unrivalled.
Objective approach to media measurement.
39
&

Bangalore, IN Office:No. 141, 2nd Cross, 2nd Main,Domlur, 2nd Stage, Bangalore 560071Phone: +91 80 40917572, +91 80 [email protected]
Contact Us US Office:Suite 100, 1780 Chadds Lake Dr, NEMarietta, Georgia, 30068-1608Atlanta, [email protected]