Embed Size (px)
Citation preview
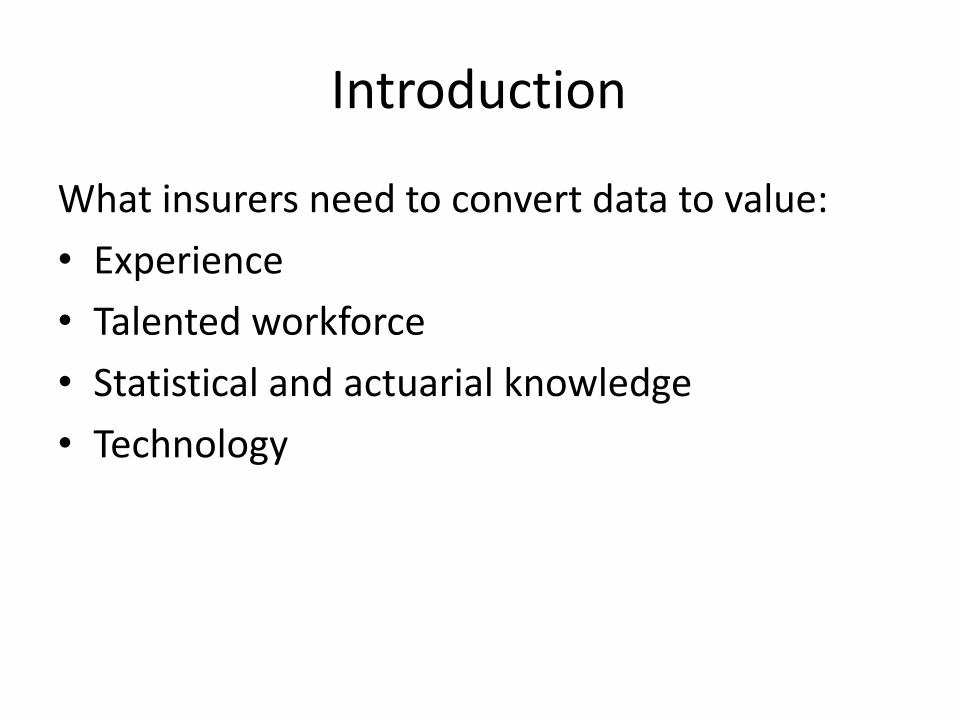
Introduction
What insurers need to convert data to value:
• Experience
• Talented workforce
• Statistical and actuarial knowledge
• Technology
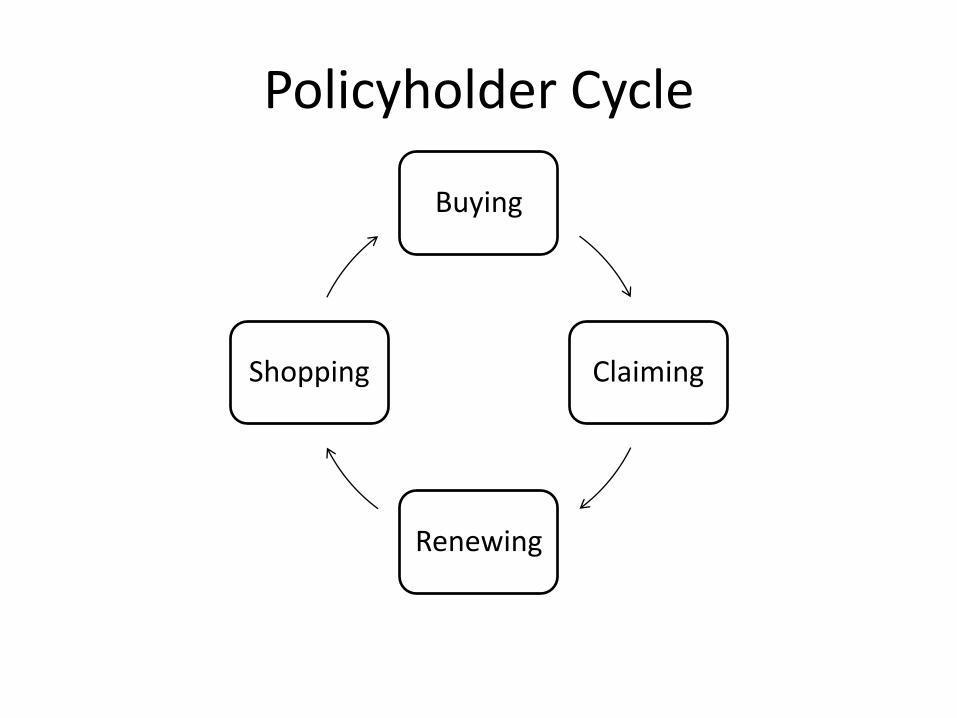
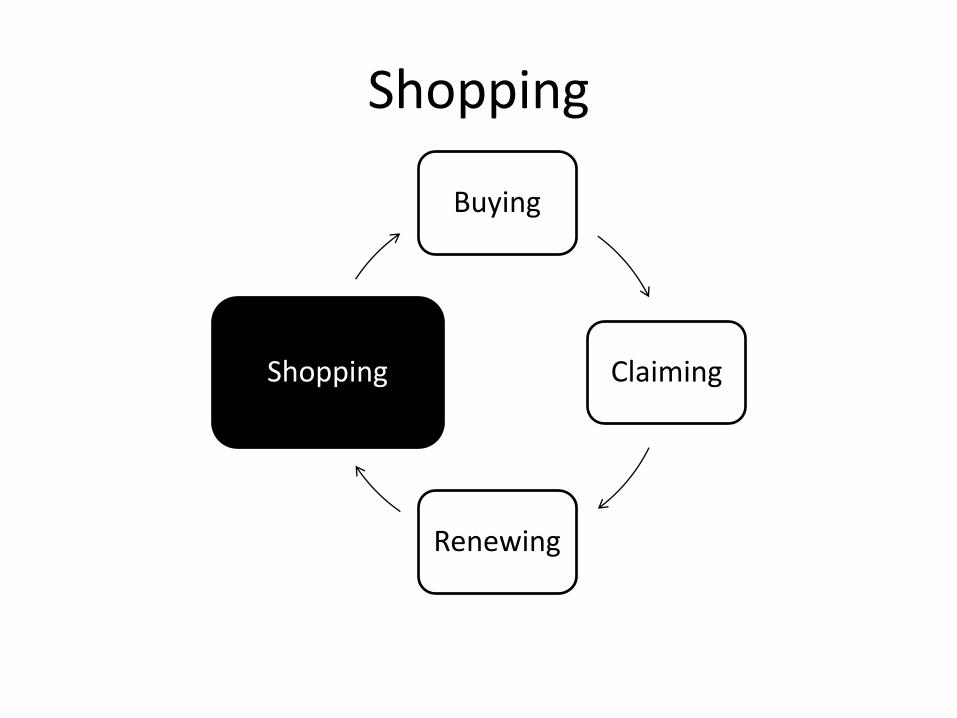
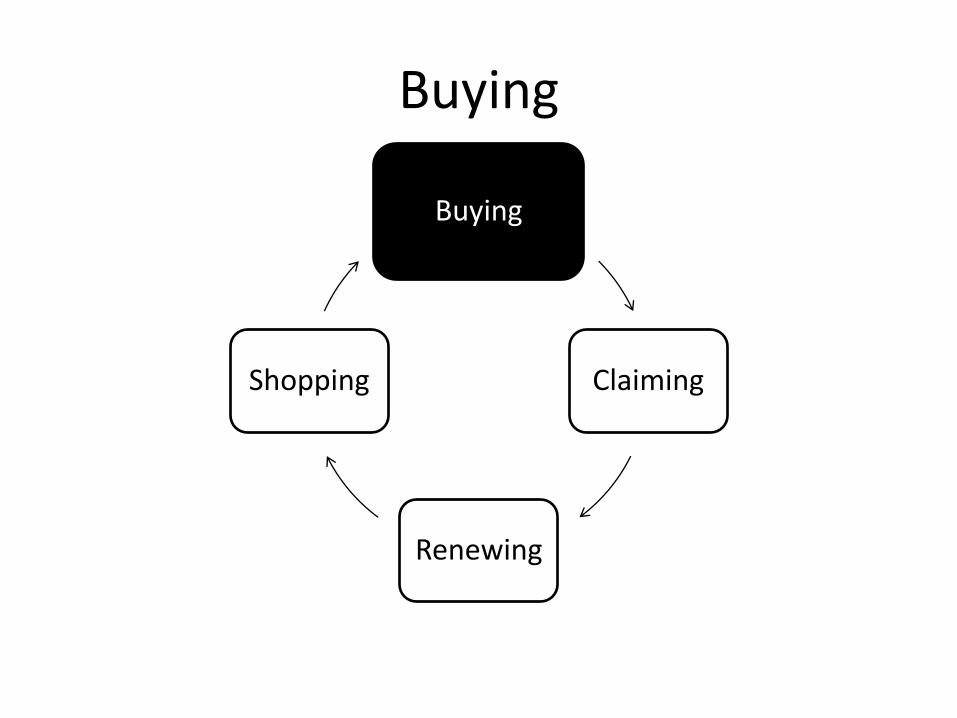
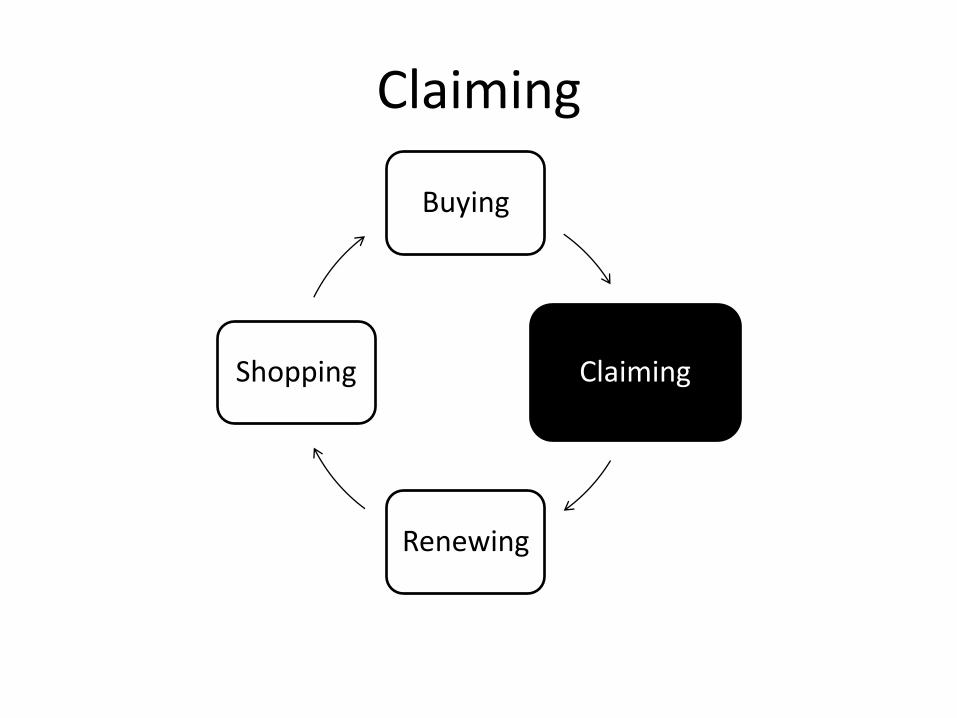
Policyholder Cycle
Buying
Claiming
Renewing
Shopping
Shopping
Buying
Claiming
Renewing
Shopping
Shopping
• Marketing analytics: how effective are my marketing campaigns?
• Sentiment analysis: what is the public’s opinion of my brand?
• Propensity modelling: to increase cross-selling and better target your customers.
• Using open data: such as the Census, to supplement your knowledge of customers.
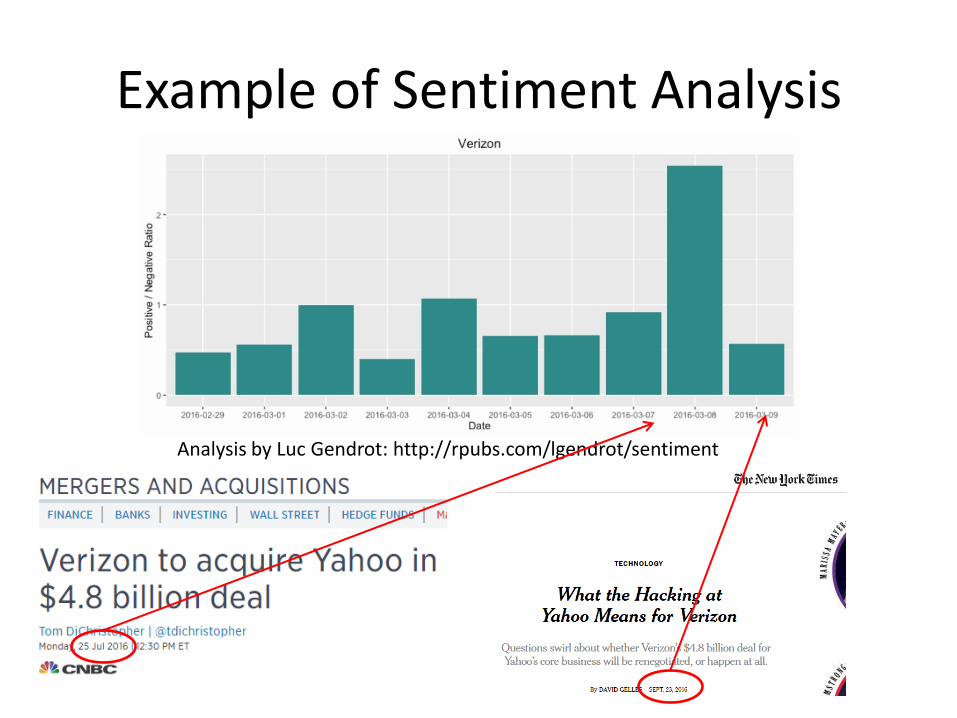
Example of Sentiment Analysis
Analysis by Luc Gendrot: http://rpubs.com/lgendrot/sentiment
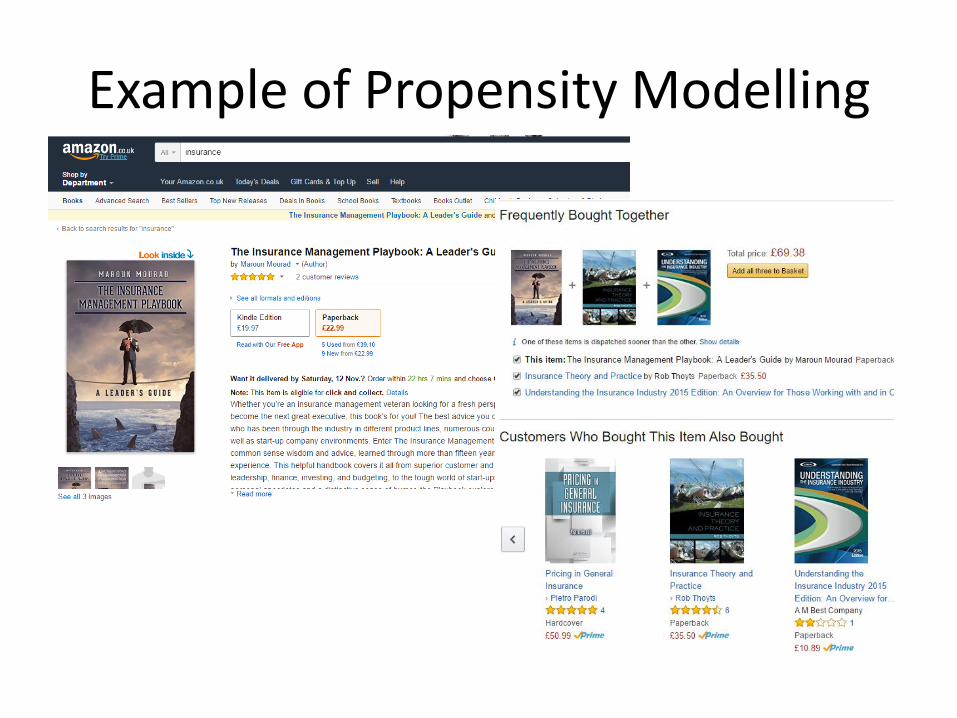
Example of Propensity Modelling
Buying
Buying
Claiming
Renewing
Shopping
Buying
• Price Optimisation: combining price elasticity, customer behaviour and expected claims to optimise business goals.
• Customer Lifetime Value: to know which customers are more valuable to the company.
• Detecting Underwriting Fraud: or accidental non-disclosure.
• Compliance Analytics: for early detection of conduct risk, Politically Exposed Persons, etc.
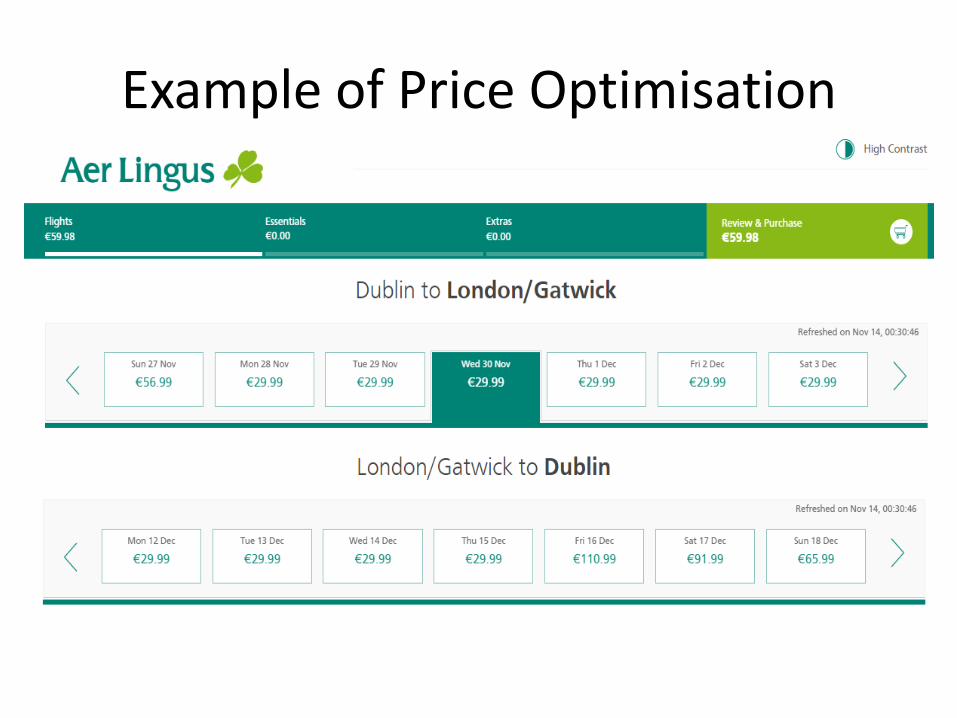
Example of Price Optimisation
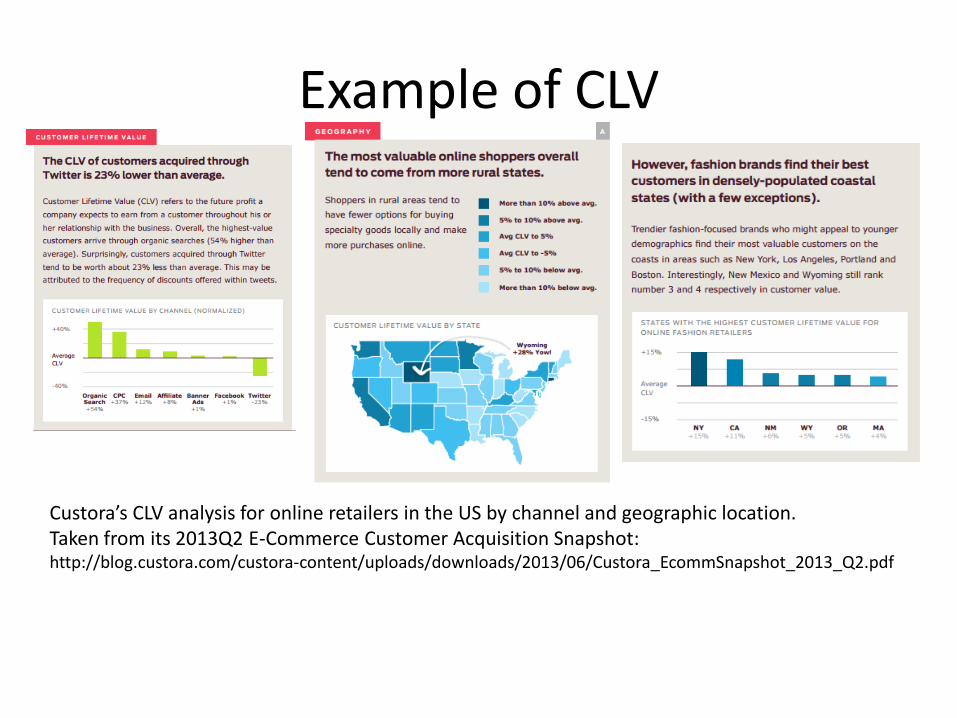
Example of CLV
Custora’s CLV analysis for online retailers in the US by channel and geographic location. Taken from its 2013Q2 E-Commerce Customer Acquisition Snapshot: http://blog.custora.com/custora-content/uploads/downloads/2013/06/Custora_EcommSnapshot_2013_Q2.pdf
Claiming
Buying
Claiming
Renewing
Shopping
Claiming
• Claims Fraud Detection: using classification models or network analysis.
• Claims Submission Analysis: to capture important information in claims forms.
• Claims Triage: to allocate complex claims to more experienced handlers, also reducing operational risk.
• Telematics: to price motor insurance policies according to individual driving patterns.
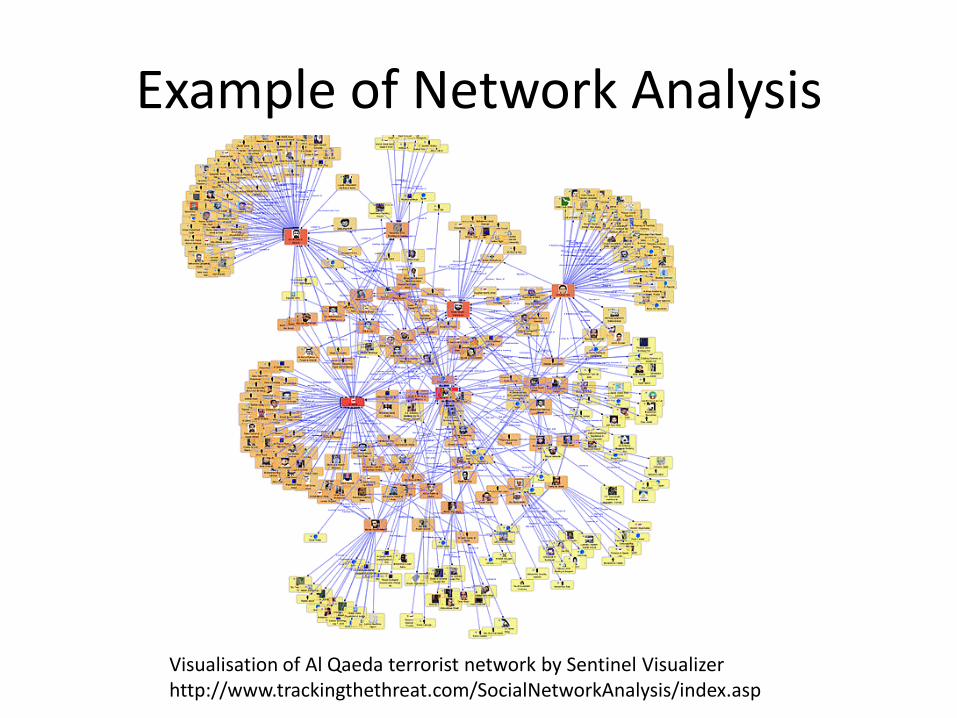
Example of Network Analysis
Visualisation of Al Qaeda terrorist network by Sentinel Visualizer http://www.trackingthethreat.com/SocialNetworkAnalysis/index.asp
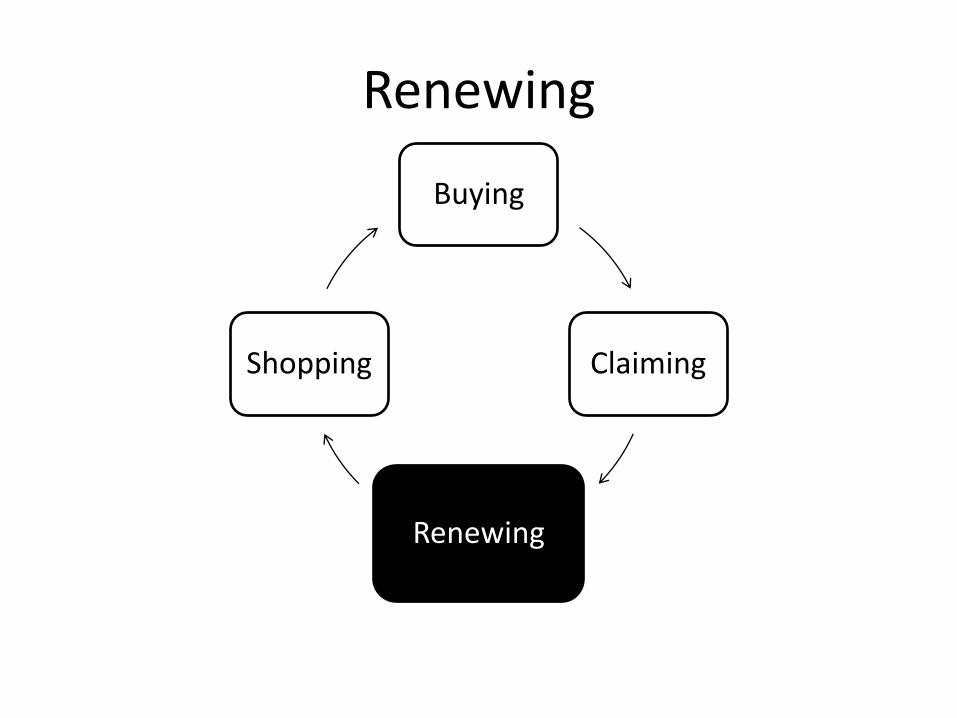
Renewing
Buying
Claiming
Renewing
Shopping
Renewing
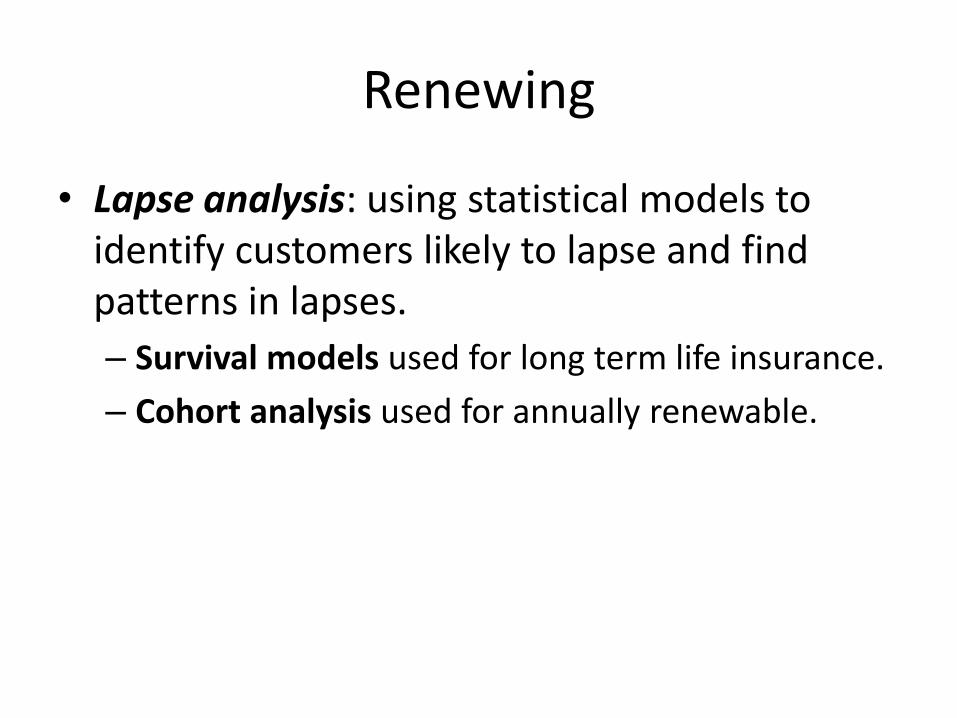
• Lapse analysis: using statistical models to identify customers likely to lapse and find patterns in lapses.
– Survival models used for long term life insurance.
– Cohort analysis used for annually renewable.
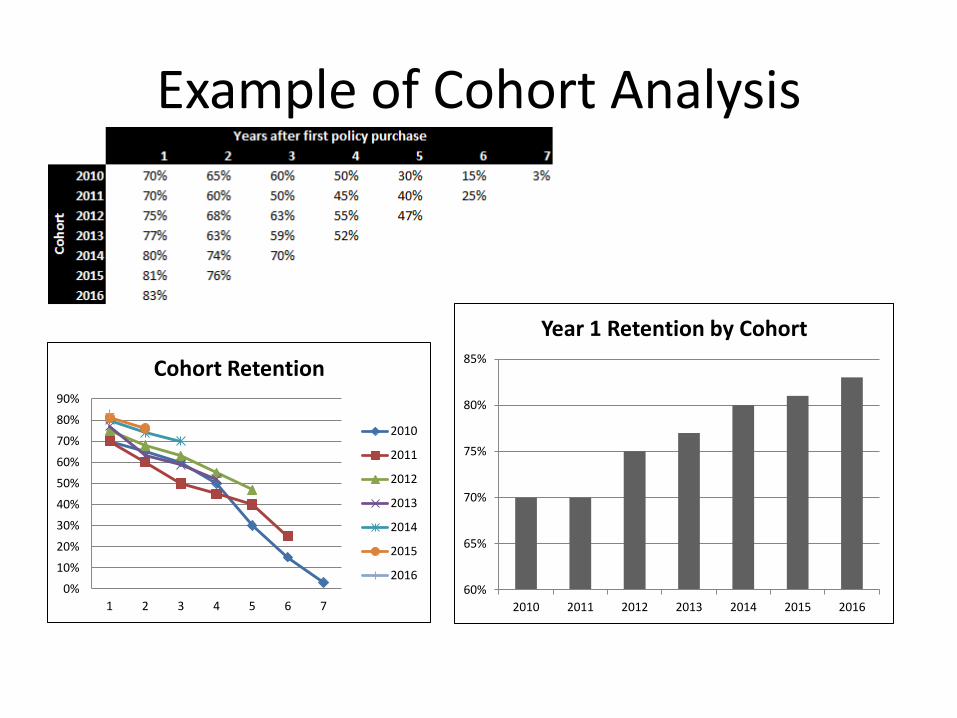
Example of Cohort Analysis
0%
10%
20%
30%
40%
50%
60%
70%
80%
90%
1 2 3 4 5 6 7
Cohort Retention
2010
2011
2012
2013
2014
2015
2016 60%
65%
70%
75%
80%
85%
2010 2011 2012 2013 2014 2015 2016
Year 1 Retention by Cohort
Not enough data or too much data?
• Big data vs. Right data: collect data with a goal, or size will only slow you down.
• Relevance is more important than quantity.
• Data quality saves time: 80% of data analytics time is data cleaning and preparation.
• Exercise careful judgement when using public data. Regulation will likely apply and the public may not like you using their data.
Technology
• NoSQL, Hadoop, etc. to deal with massive amounts of data.
• Tableau, Power BI, etc. for visualisation.
• Cloud Computing (AWS, Google Cloud, Microsoft Azure)
• GPU Computing.
• Artificial Intelligence (IBM’s Watson, Theano, Google’s Tensorflow)
Summary
• Insurers have much data but most of it is unstructured. However, it can be used and can be valuable.
• Abundance of publicly available data.
• Technology develops very fast. Converting data to value is becoming easier and cheaper.
• So much can be done that insurers must set clear data goals, aligned with their business strategy.
Next Five years
• Insurers successfully engaging with digital customers.
• Management understands how data analytics adds value.
• Insurance companies ready to change operational models to become data driven.
• First Internet of Things insurance?