Embed Size (px)
Citation preview
High Dimensional Data Visualization
Presented by Fabian Keller
Seminar: Large Scale Visualization
Advisor: Steffen Koch
University of Stuttgart, Summer Term 2015
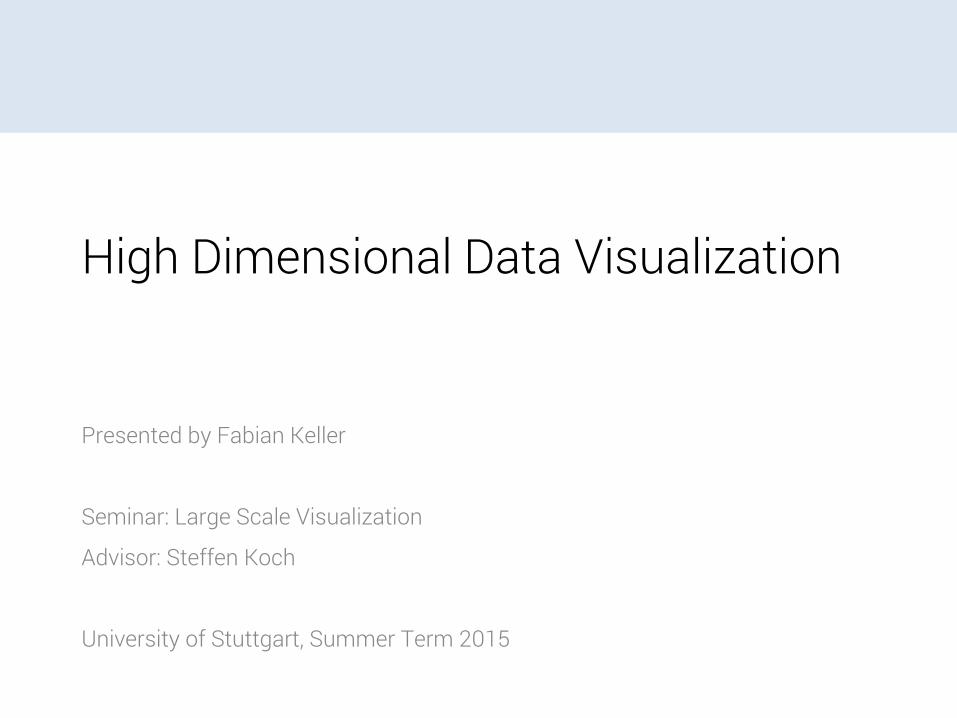
MotivationWhat do you see?
16.07.2015 Fabian Keller 2
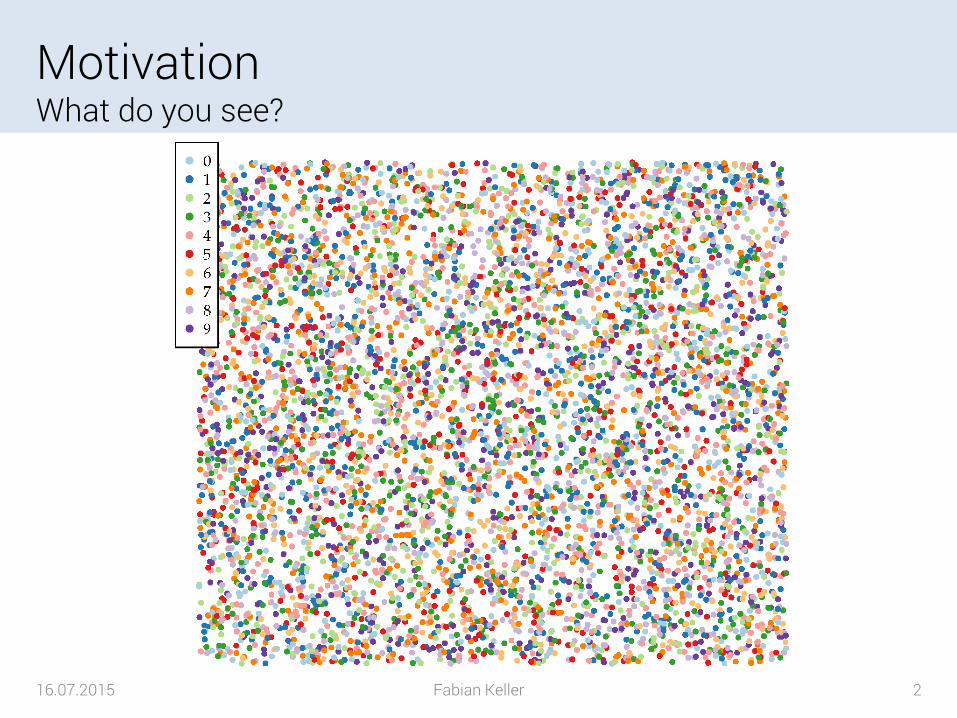
MotivationI can see…
16.07.2015 Fabian Keller 3
Agenda
• Introduction
• Dimension Reduction Techniques
PCA / LLE / ISOMAP / t-SNE
• Visualization Techniques
Scatterplots / Parallel Coordinate Plots / Glyphs
• Conclusion
16.07.2015 Fabian Keller 4
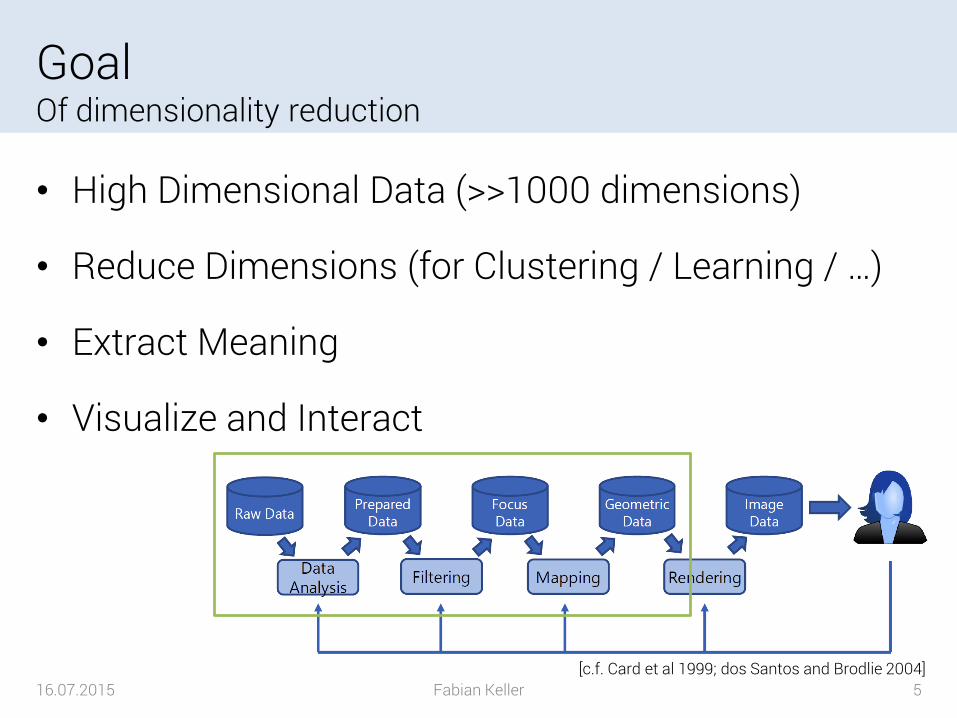
GoalOf dimensionality reduction
• High Dimensional Data (>>1000 dimensions)
• Reduce Dimensions (for Clustering / Learning / …)
• Extract Meaning
• Visualize and Interact
16.07.2015 Fabian Keller 5[c.f. Card et al 1999; dos Santos and Brodlie 2004]
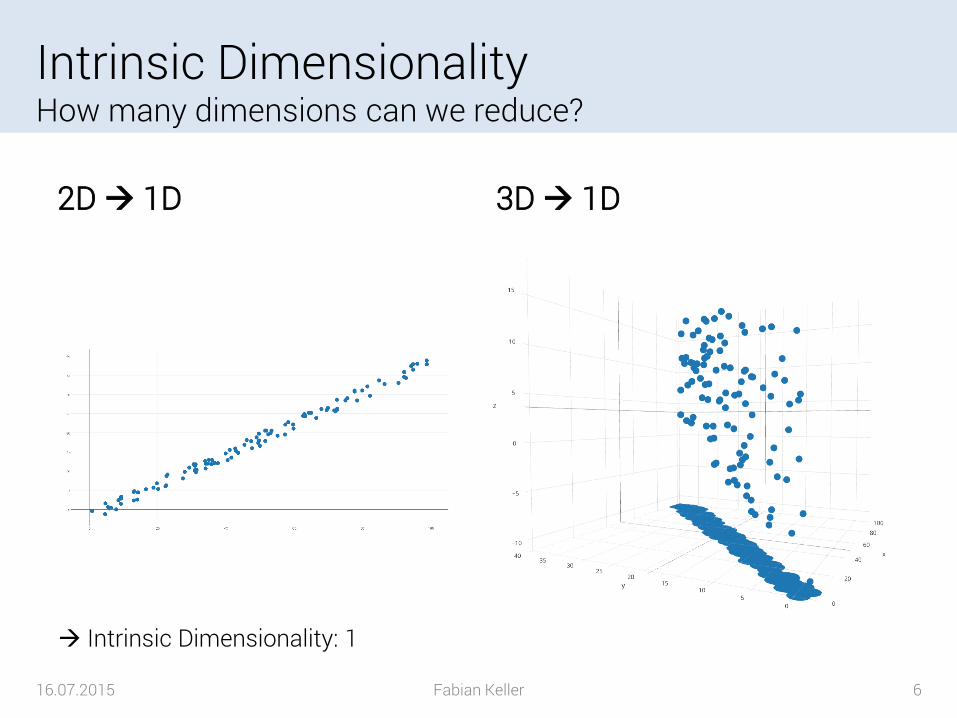
Intrinsic DimensionalityHow many dimensions can we reduce?
2D 1D 3D 1D
16.07.2015 Fabian Keller 6
Intrinsic Dimensionality: 1
Agenda
• Introduction
• Dimension Reduction Techniques
PCA / LLE / ISOMAP / t-SNE
• Visualization Techniques
Scatterplots / Parallel Coordinate Plots / Glyphs
• Conclusion
16.07.2015 Fabian Keller 7
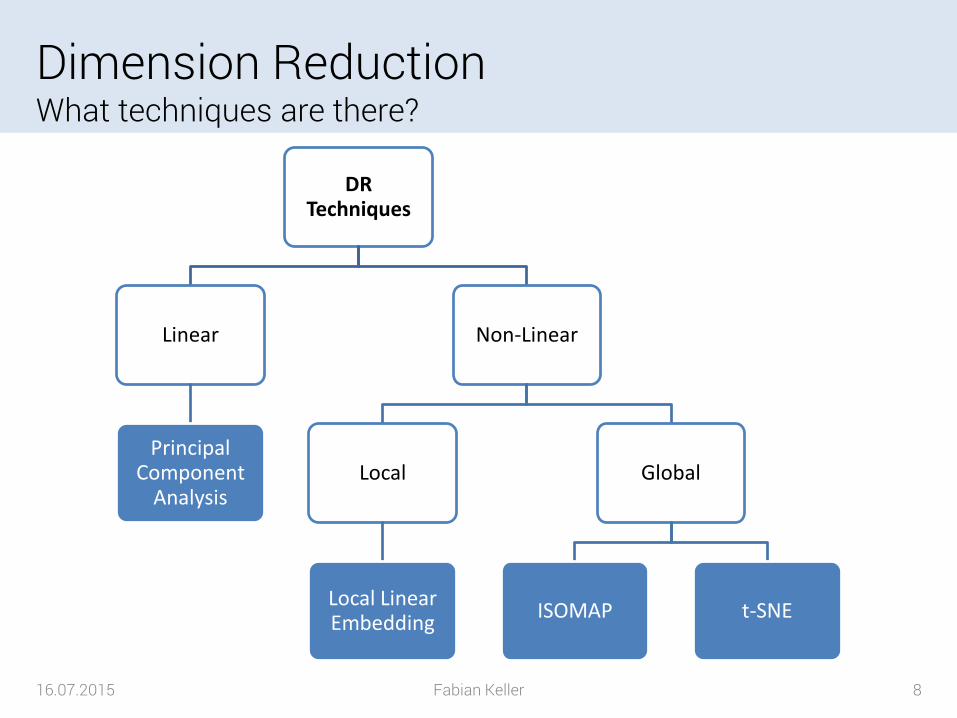
Dimension ReductionWhat techniques are there?
DR Techniques
Linear
Principal Component
Analysis
Non-Linear
Local
Local Linear Embedding
Global
ISOMAP t-SNE
16.07.2015 Fabian Keller 8
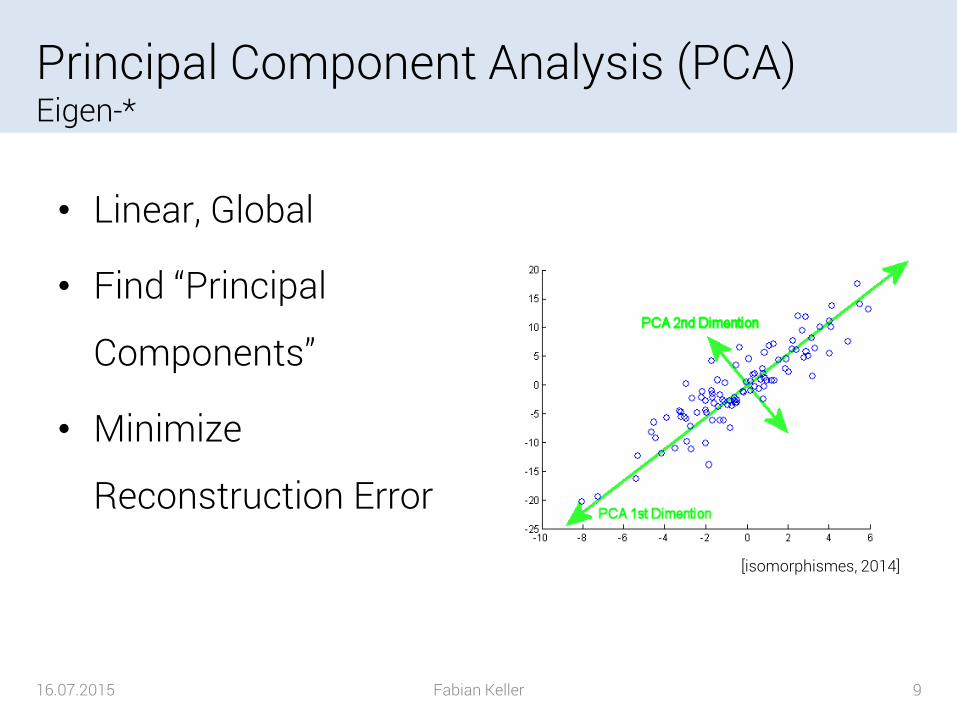
Principal Component Analysis (PCA)Eigen-*
16.07.2015 Fabian Keller 9
• Linear, Global
• Find “Principal
Components”
• Minimize
Reconstruction Error
[isomorphismes, 2014]
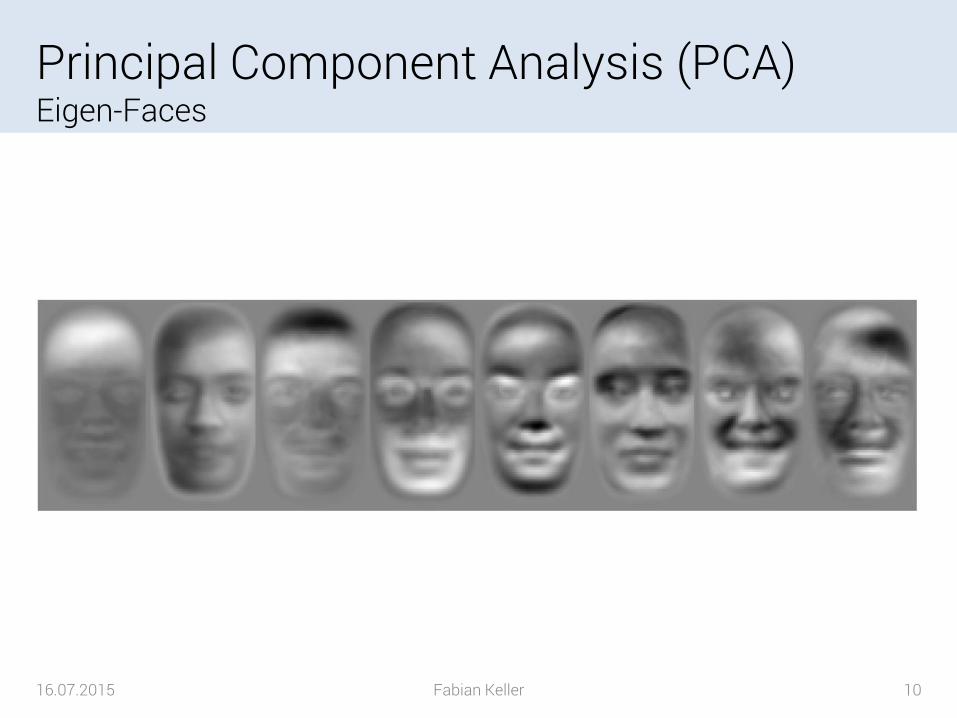
Principal Component Analysis (PCA)Eigen-Faces
16.07.2015 Fabian Keller 10
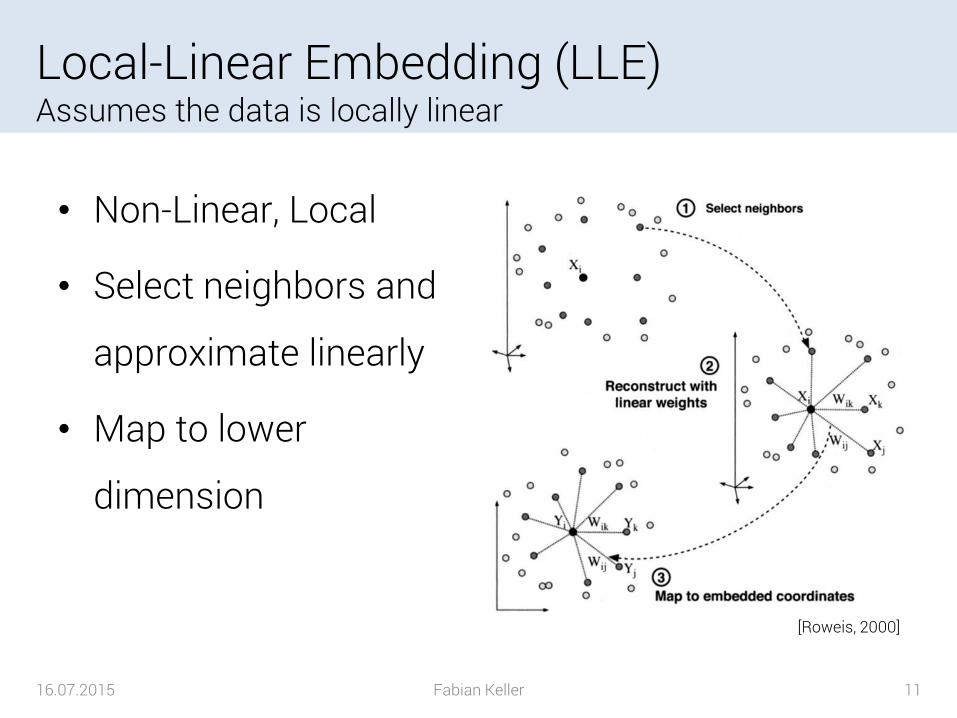
Local-Linear Embedding (LLE)Assumes the data is locally linear
• Non-Linear, Local
• Select neighbors and
approximate linearly
• Map to lower
dimension
16.07.2015 Fabian Keller 11
[Roweis, 2000]
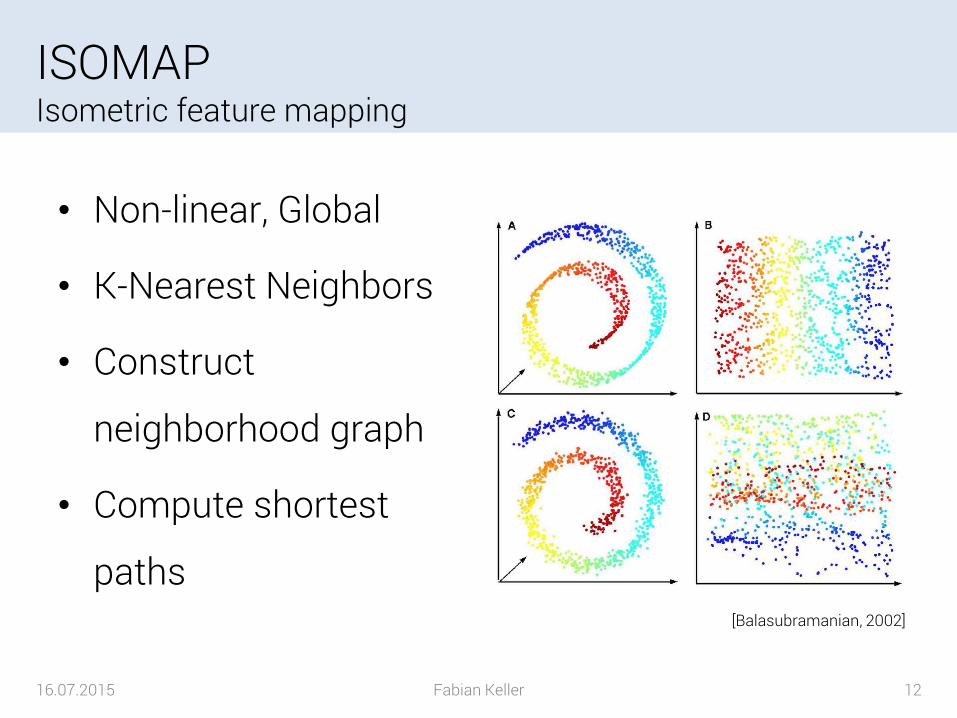
ISOMAPIsometric feature mapping
16.07.2015 Fabian Keller 12
• Non-linear, Global
• K-Nearest Neighbors
• Construct
neighborhood graph
• Compute shortest
paths[Balasubramanian, 2002]
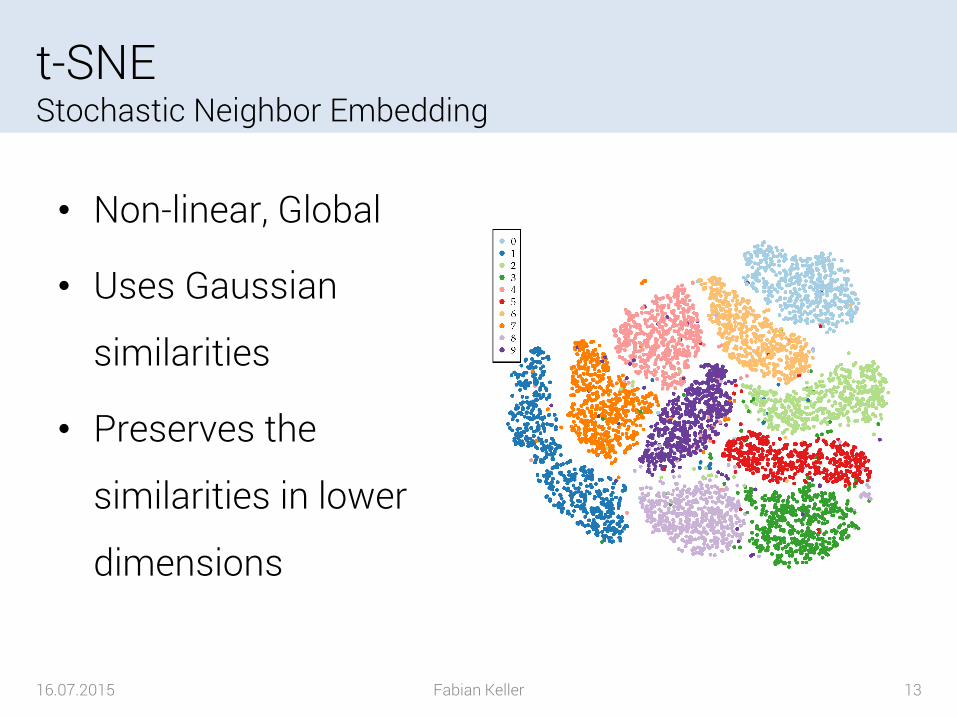
t-SNEStochastic Neighbor Embedding
• Non-linear, Global
• Uses Gaussian
similarities
• Preserves the
similarities in lower
dimensions
16.07.2015 Fabian Keller 13
Agenda
• Introduction
• Dimension Reduction Techniques
PCA / LLE / ISOMAP / t-SNE
• Visualization Techniques
Scatterplots / Parallel Coordinate Plots / Glyphs
• Conclusion
16.07.2015 Fabian Keller 14
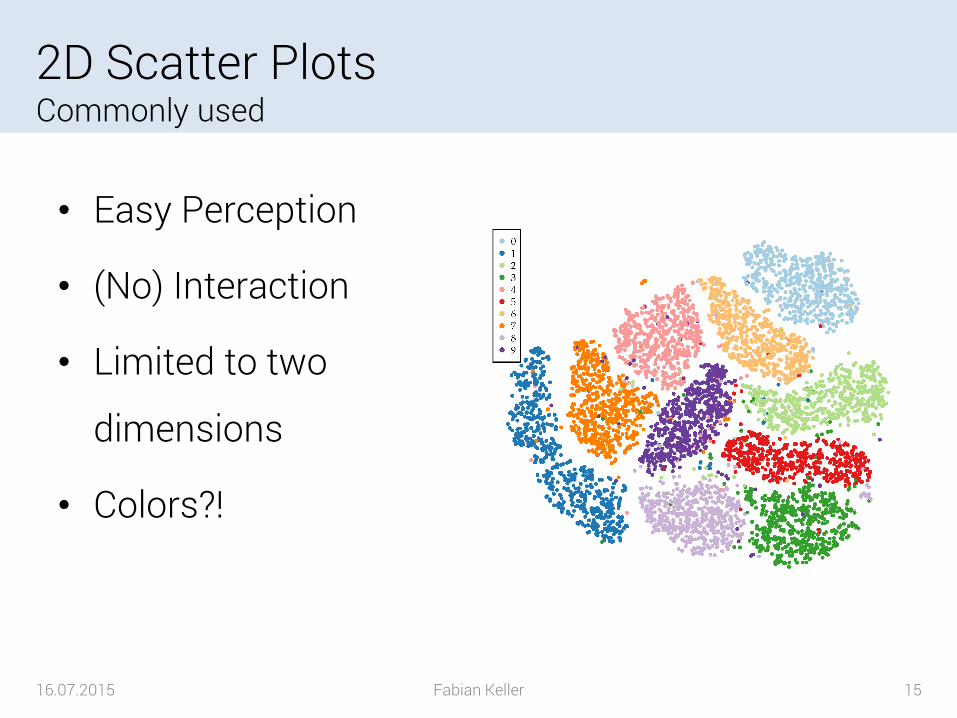
2D Scatter PlotsCommonly used
• Easy Perception
• (No) Interaction
• Limited to two
dimensions
• Colors?!
16.07.2015 Fabian Keller 15
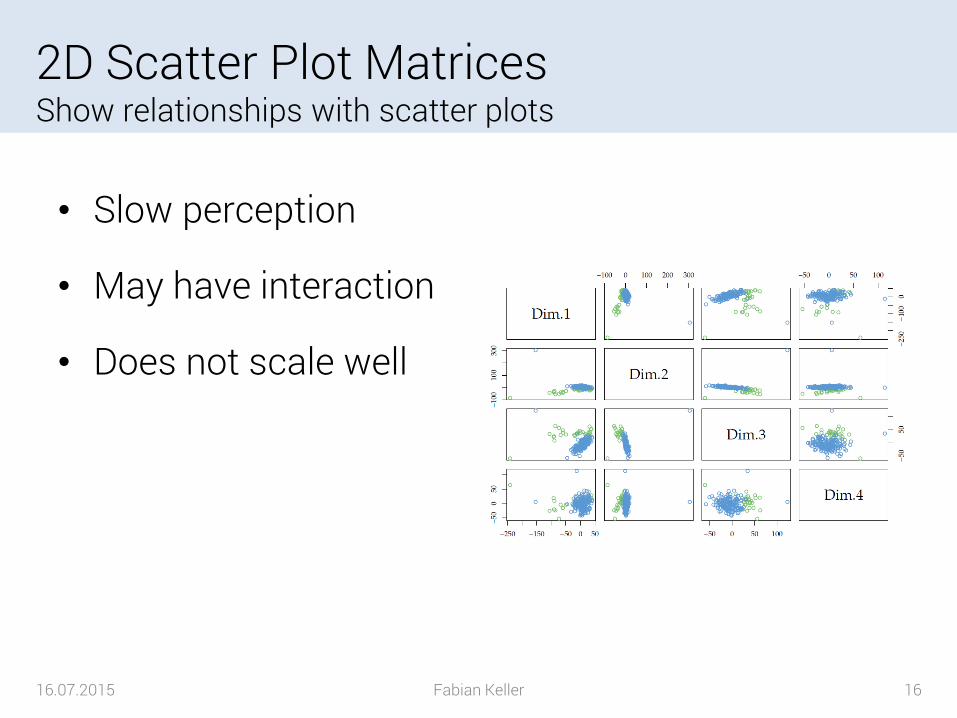
2D Scatter Plot MatricesShow relationships with scatter plots
• Slow perception
• May have interaction
• Does not scale well
16.07.2015 Fabian Keller 16
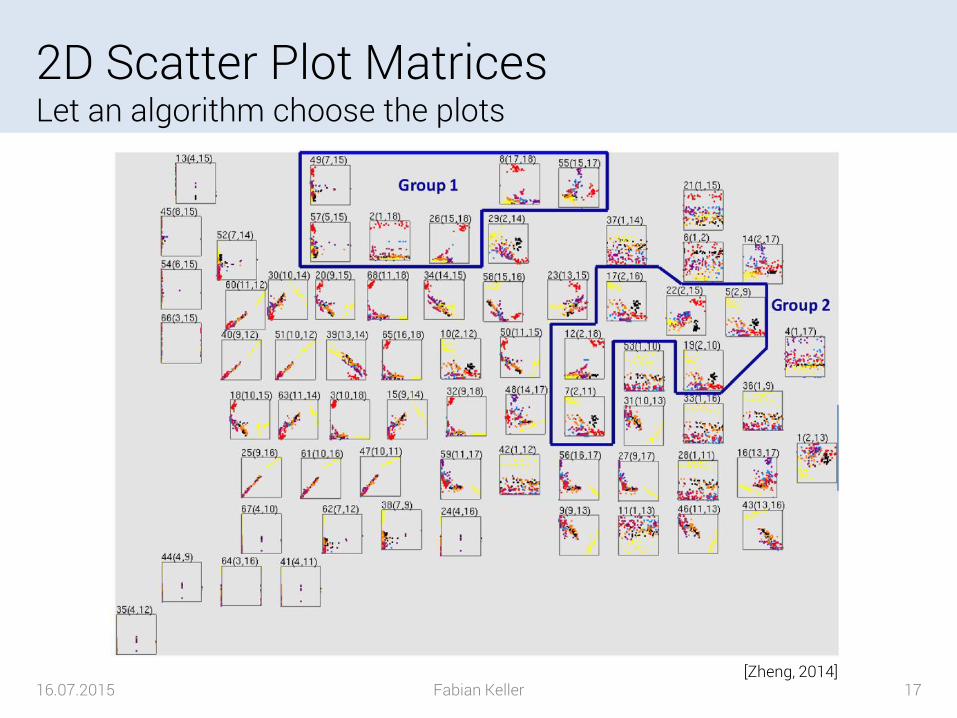
2D Scatter Plot MatricesLet an algorithm choose the plots
16.07.2015 Fabian Keller 17[Zheng, 2014]
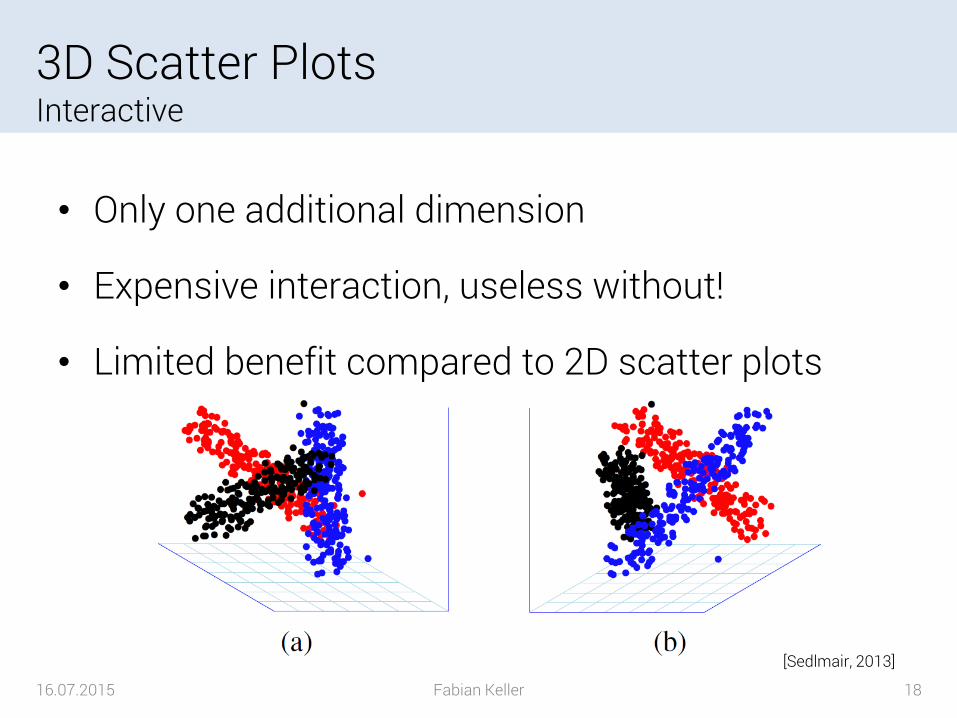
3D Scatter PlotsInteractive
• Only one additional dimension
• Expensive interaction, useless without!
• Limited benefit compared to 2D scatter plots
16.07.2015 Fabian Keller 18
[Sedlmair, 2013]
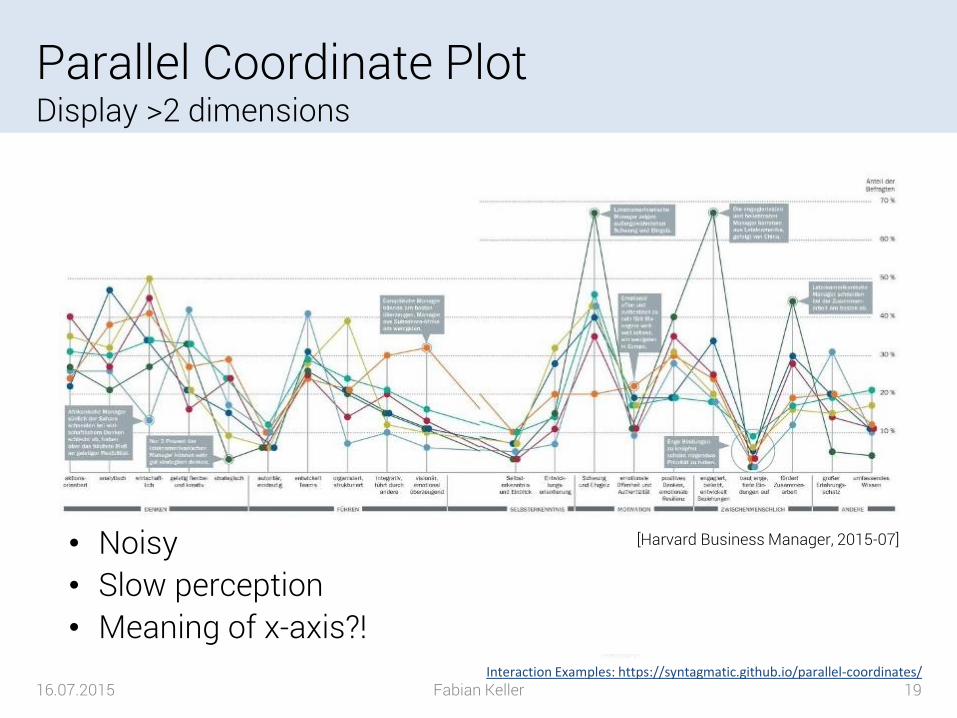
Parallel Coordinate PlotDisplay >2 dimensions
16.07.2015 Fabian Keller 19Interaction Examples: https://syntagmatic.github.io/parallel-coordinates/
• Noisy• Slow perception• Meaning of x-axis?!
[Harvard Business Manager, 2015-07]
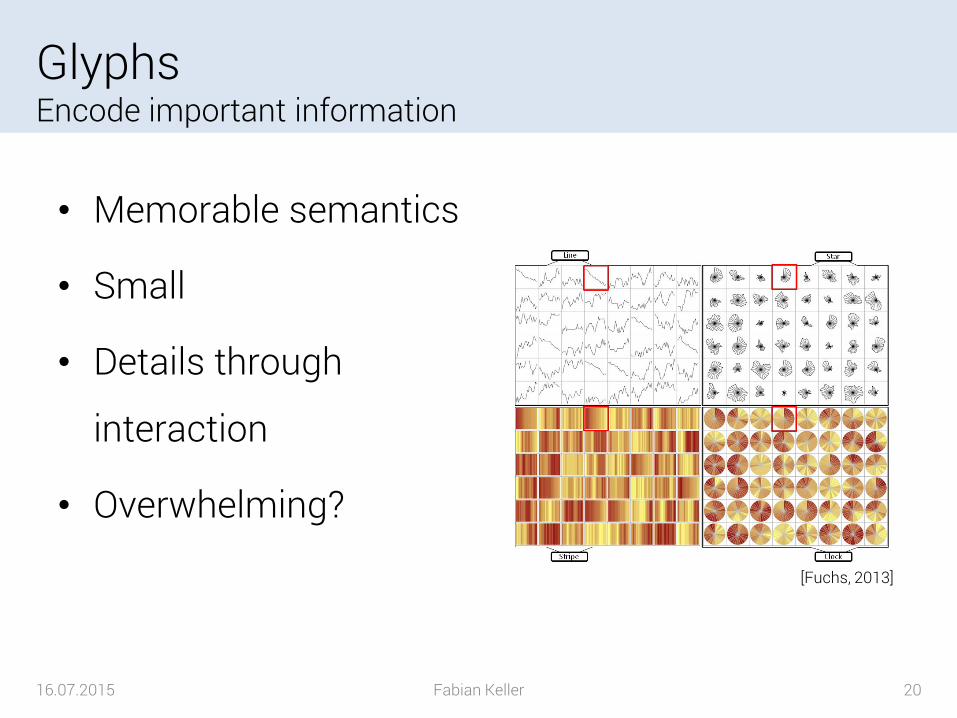
GlyphsEncode important information
• Memorable semantics
• Small
• Details through
interaction
• Overwhelming?
16.07.2015 Fabian Keller 20
[Fuchs, 2013]
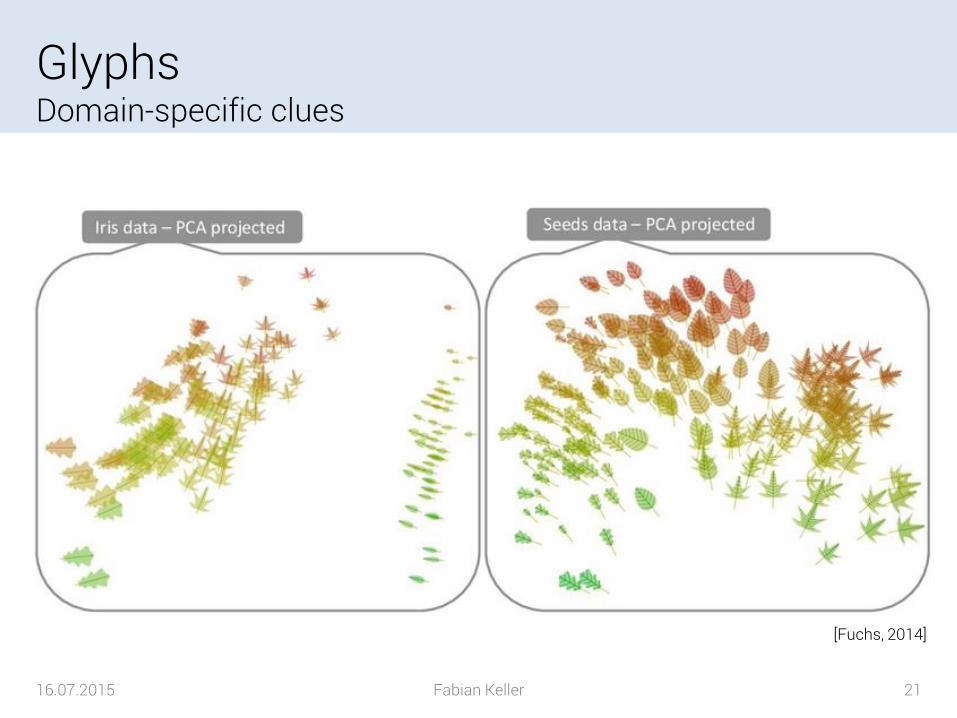
GlyphsDomain-specific clues
16.07.2015 Fabian Keller 21
[Fuchs, 2014]

GlyphsTime series data
16.07.2015 Fabian Keller 22[Kintzel, 2011]
ConclusionHigh Dimensional Data Visualization
• Lots of DR / visualization techniques
• Even more combinations
• Application needs to be tailored to needs
16.07.2015 Fabian Keller 23
“A problem well put is half-solved” – John Dewey

Thank you for your attention!
Questions?
Literature
• Sedlmair, Michael; Munzner, Tamara; Tory, Melanie (2013): Empirical guidance on scatterplot and dimension reduction technique choices.
• Zheng, Yunzhu; Suematsu, Haruka; Itoh, Takayuki; Fujimaki, Ryohei; Morinaga, Satoshi; Kawahara, Yoshinobu (2014): Scatterplot layout for high-dimensional data visualization.
• Card, S. K., Mackinlay, J. D., and Shneiderman, B., editors. Readings in Information Visualization: Using Vision to Think. Morgan Kaufmann, San Francisco. 1999.
• Fuchs, Johannes, et al. "Evaluation of alternative glyph designs for time series data in a small multiple setting." Proceedings of the SIGCHI Conference on Human Factors in Computing Systems. ACM, 2013.
• Christopher Kintzel, Johannes Fuchs, and Florian Mansmann. 2011. Monitoring large IP spaces with ClockView.
• Fuchs, Johaness et al. “Leaf Glyph Visualizing Multi-Dimensional Data with Environmental Cues“. 2014.
• Balasubramanian, Mukund, and Eric L. Schwartz. "The isomap algorithm and topologicalstability." Science 295.5552 (2002): 7-7.
• Roweis, Sam T.; Saul, Lawrence K. (2000): Nonlinear dimensionality reduction by locally linear embedding.
• dos Santos, S. and Brodlie, K. Gaining understanding of multivariate and multidimensional data through visualization. Computers & Graphics, 28(3):311–325. 2004.
• Harvard Business Manager, 2015-07: Andere Länder, anderer Stilhttp://www.harvardbusinessmanager.de/heft/d-135395625.html
• isomorphismes (2014). pca - making sense of principal component analysis, eigenvectors & eigenvalues - cross validated. http://stats.stackexchange.com/a/82427/80011
16.07.2015 Fabian Keller 25
Example Applications
• Biological / Medical (genes, fMRI)
• Finance (time series)
• Geological (climate, spatial, temporal)
• Big Data Analysis (Netflix Movie Rating Data)
16.07.2015 Fabian Keller 26

Other DR techniquesMatlab toolbox for dimensionality reduction
16.07.2015 Fabian Keller 27
• Principal Component Analysis (PCA)
• Probabilistic PCA• Factor Analysis (FA)• Classical multidimensional
scaling (MDS)• Sammon mapping• Linear Discriminant Analysis
(LDA)• Isomap• Landmark Isomap• Local Linear Embedding (LLE)• Laplacian Eigenmaps• Hessian LLE• Local Tangent Space
Alignment (LTSA)• Conformal Eigenmaps
(extension of LLE)
• Maximum Variance Unfolding (extension of LLE)
• Landmark MVU (LandmarkMVU)
• Fast Maximum Variance Unfolding (FastMVU)
• Kernel PCA• Generalized Discriminant
Analysis (GDA)• Diffusion maps• Neighborhood Preserving
Embedding (NPE)• Locality Preserving Projection
(LPP)• Linear Local Tangent Space
Alignment (LLTSA)• Stochastic Proximity
Embedding (SPE)
• Deep autoencoders (using denoising autoencoderpretraining)
• Local Linear Coordination (LLC)• Manifold charting• Coordinated Factor Analysis
(CFA)• Gaussian Process Latent
Variable Model (GPLVM)• Stochastic Neighbor
Embedding (SNE)• Symmetric SNE• t-Distributed Stochastic
Neighbor Embedding (t-SNE)• Neighborhood Components
Analysis (NCA)• Maximally Collapsing Metric
Learning (MCML)• Large-Margin Nearest Neighbor
(LMNN)
See: http://lvdmaaten.github.io/drtoolbox/