Embed Size (px)
Citation preview
Data SnapShot Series 1.1May 2015
DATA SNAPSHOTHarrison County

2
Hometown Collaboration InitiativeThis report has been produced by the Purdue Center for Regional Development as a part of the Indiana Hometown Collaboration Initiative (HCI). HCI is funded, in part, by the Indiana Office of Community and Rural Affairs.

Table of contents
Introduction01Demography02
Economy03Labor Market04

Purpose
About Harrison County
01introductio
n

5
Purpose
This document provides information and data about Harrison County that can be used to guide local decision-making activities.
The Data SnapShot showcases a variety of demographic, economic and labor market information that local leaders, community organizations and others can use to gain a better perspective on current conditions and opportunities in their county.
To strengthen the value and usability of the information, we showcase the data using a variety of visual tools, such as charts, graphs and tables. In addition, we offer key points about the data as a way of assisting the user with the interpretation of the information presented.
Finally, short takeaway messages are offered at the end of each section in order to highlight some of the more salient findings.
Introduction
section 01

6
About Harrison CountyIntroduction
section 01
County Background
Established 1808
CountySeat
Corydon
Area 487 sq. mi.
NeighboringCounties
Crawford, INFloyd, IN
Hardin, KYJefferson, KY
Meade, KYWashington, IN

Population change
Population pyramids
Race
Ethnicity
Educational attainment
Takeaways
02demograp
hy

8
34,325
39,364
39,163
43,254
Population change
Components of Population Change, 2000-2013
Total Change 3,292*
Natural Increase 1,678
International Migration
283
Domestic Migration
1,526
The total population is projected to increase by 10 percent between 2013 and 2020.
Demography
Sources: STATSIndiana, U.S. Census Bureau – 2000 Decennial Census, 2010 Decennial Census, 2013 Estimates, Estimates of the Components of Resident Population Change
section 02
The total population in Harrison County increased by 14 percent between 2000 and 2013. Natural increase (births minus deaths over that span of time) and domestic migration (the difference between the number of people moving into the county versus moving out) were both major contributors to that expansion.
Natural increase showed a net growth of almost 1,700 people, while domestic in-migration outpaced out-migration by more than 1,500 people. International migration also had a net increase of almost 300, indicating that the county experienced an influx of new people from outside the U.S.
Total population projections
2000
2010
2013
2020
*Total change in population differs from the sum of the components due to Census estimation techniques. Residuals (not reported here) make up the difference.

9
0-9
10-19
20-29
30-39
40-49
50-59
60-69
70-79
80+
9 6 3 0 3 6 9
6.3%
6.6%
5.6%
6.1%
7.0%
7.9%
5.9%
3.0%
1.4%
5.8%
6.1%
5.5%
6.1%
6.9%
8.0%
6.0%
3.4%
2.4%
Percent of Total PopulationA
ge C
oh
ort
0-9
10-19
20-29
30-39
40-49
50-59
60-69
70-79
80+
9 6 3 0 3 6 9
6.9%
7.9%
5.9%
7.7%
8.3%
6.3%
3.5%
2.3%
1.0%
6.5%
7.5%
5.7%
7.8%
8.2%
6.0%
3.7%
3.0%
1.8%
Percent of Total Population
Ag
e C
oh
ort
Population pyramidsPopulation pyramids are visual representations of the age distribution of the population by gender.
Approximately 50.2 percent of the population was female in 2000 (17,226) and that percent remained about the same in 2013. What did change is the distribution of people across the various age categories. A larger share of people shifted into the higher age groupings over the 2000 to 2013 time period.
Demography
Source: U.S. Census Bureau – 2000 Decennial Census and 2013 Annual Population Estimates
section 02
In particular, people 60 and over swelled from 6.8% to 10.3% for males and from 8.5% to 11.8% for females between 2000 and 2013. Individuals of prime working age (20-49 years old) took a dip from 21.9% to 18.7% for males, and from 21.7% to 18.5% for females. Also dropping in percentage points were people under 19 years old.
Male
Female
20132000
Male
Female

10
White98%
Black
Asian
Native
Two or More Races
White99%
Black
Asian
Native
Two or More Races
Race
The number of non-White residents in Harrison County increased by one percentage point between 2000 and 2013.
Every race experienced a numerical increase, with Whites gaining the most people. Of the non-White population, Black and Mixed Descent races gained the most people, resulting in the expansion of the population of Other Races from 1 percent to 2 percent of the total population between 2000 and 2013.
Demography
Source: U.S. Census Bureau – 2000 Decennial Census and 2013 Annual Population Estimates
section 02
2000
2013
11
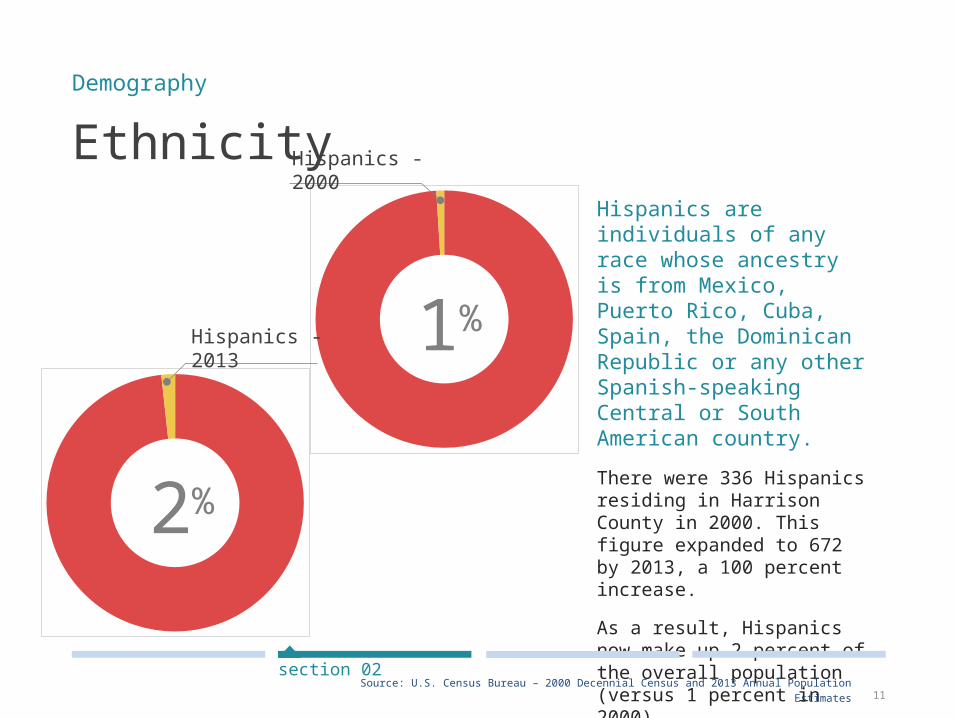
EthnicityHispanics are individuals of any race whose ancestry is from Mexico, Puerto Rico, Cuba, Spain, the Dominican Republic or any other Spanish-speaking Central or South American country.
There were 336 Hispanics residing in Harrison County in 2000. This figure expanded to 672 by 2013, a 100 percent increase.
As a result, Hispanics now make up 2 percent of the overall population (versus 1 percent in 2000).
Demography
Source: U.S. Census Bureau – 2000 Decennial Census and 2013 Annual Population Estimates
section 02
2%
1%
Hispanics - 2000
Hispanics - 2013

12
No High School; 12%
High School;
44%
Some Col-lege; 21%
Asso-ciate's Degree;
7%
Bachelor's Degree or More; 15%
Educational attainment Harrison County witnessed a 3
percent increase in the proportion of adults (25 and older) with an
associate’s, bachelor’s or graduate degree from 2000 to
2013.
The proportion of adults 25 years of age and older with a high school
education or more improved from 80 percent in 2000 to 88 percent in
2013.
Residents with less than a high school education fell by 8
percentage points, and those with some college education rose by 1
percentage point from 2000-2013.
The number of adults with a college degree or more increased from 19
percent in 2000 to 22 percent in 2013. This was due to a small
increase in the percentage with associate’s degrees and persons
with a bachelor's degree and above.
Demography
Source: U.S. Census Bureau – 2000 Decennial Census and 2013 ACS
section 02
2000
2013
No High School;
20%
High School;
41%
Some College;
20%
Asso-ciate's Degree;
6%
Bache-lor's
Degree or More;
13%
13
Takeaways
The population of Harrison County is expected to grow over the next few years, and if past trends hold, that increase will be largely due to both natural increase (more births than deaths) and domestic migration (more people moving into than out of the county).
While Harrison County’s population grew over the 2000-2013 period, it has also been aging. Despite positive growth in its population resulting from domestic migration, the population pyramids show that the county lost several residents in the 20-29 and 30-39 age categories, as well as in the under 20 age grouping.
While the population remains largely white and non-Hispanic, the racial and ethnic diversity has been slowly increasing in Harrison County. As
such, finding ways to address the needs and opportunities of a diversifying population will be important. The chances are quite strong that the diversity of the county is likely to continue.
The educational attainment of adults 25 and over has improved since 2000, but the number with only a high school education continues to be high (at 44 percent). Determining if this could be a barrier to economic growth is a topic worthy of examination.
Harrison County may want to explore the mix of services and amenities that will be vital to retaining and attracting educated young adults, including the availability of good quality jobs.
Demography
section 02

Establishments
Industries
Occupations
Income and poverty
Takeaways
03economy

15
Establishments
Components of Change for Establishments
Total Change (2000-11) 1,337
Natural Change (births minus deaths) 1,269
Net Migration 68
The number of establishments in Harrison County doubled between 2000 and 2011.
The rapid growth of establishments was largely due to natural change. Only a handful were due to gains from net migration. As such, 3,016 establishments were launched in the county between 2000-2011 while 1,679 closed, resulting in a gain of 1,337 establishments.
Economy
Source: National Establishment Time Series (NETS) – 2012 Database
section 03
An establishment is a physical business
location. Branches, standalones and
headquarters are all considered types of
establishments.
Definition of Company Stages
0 12 3
4
Self-employed
2-9 employees
10-99employees
100-499employees
500+employees
Note: The 2011 figures use 2012 data to include all gains and losses over the entire
year. Establishment information was calculated in-house and may differ slightly from publicly available data.

16
Number of establishments by stage/employment category
Economy
Source: National Establishment Time Series (NETS) – 2012 Database
section 03
2000 2011
Stage Establishments Proportion Establishment
s Proportion
Stage 0 470 31% 1,017 36%
Stage 1 836 56% 1,610 57%
Stage 2 174 12% 193 7%
Stage 3 11 1% 9 0%
Stage 4 3 0% 2* 0%
Total 1,494 100% 2,831 100%
Note: The 2011 figures use 2012 data to include all gains and losses over the entire year.
*ReferenceUSA indicates three Stage 4 companies, however, NETS does not have one ofthese companies as a Stage 4 establishment. Additional information is available on the next slide.

17
Top five employers in 2015Economy
Source: ReferenceUSA (Infogroup) and Harrison County Economic Development Corporation
section 03
Establishment Stage
1. Horseshoe Southern Indiana
Stage 4
2. Harrison County Hospital Stage 4
3. Tyson Foods Inc. Stage 4
4. Blue River Services Inc. – Housing
Stage 3
5. ICON Metal Forming Stage 3
The top five employers produce a mix of local, national and global goods and services.
Horseshoe Southern Indiana in Elizabeth is the largest establishment-level employer in Harrison County.
Tyson Foods and ICON Metal Forming are the main producers of national and global goods, while the Harrison County Hospital and Blue River Services provide primarily local and regional goods and services.
Information on the top five establishments by employment comes from ReferenceUSA. ReferenceUSA is a library database service provided by Infogroup, the company that also supplies the list of major employers for Hoosiers by the Numbers. While both NETS and ReferenceUSA contain establishments, differences in data collection processes result in discrepancies between the two sources. We use NETS for a broad picture of establishments in the county, while ReferenceUSA is used for studying individual establishments.
18
Number of jobs by stage/employment category
Economy
Source: National Establishment Time Series (NETS) – 2012 Database
section 03
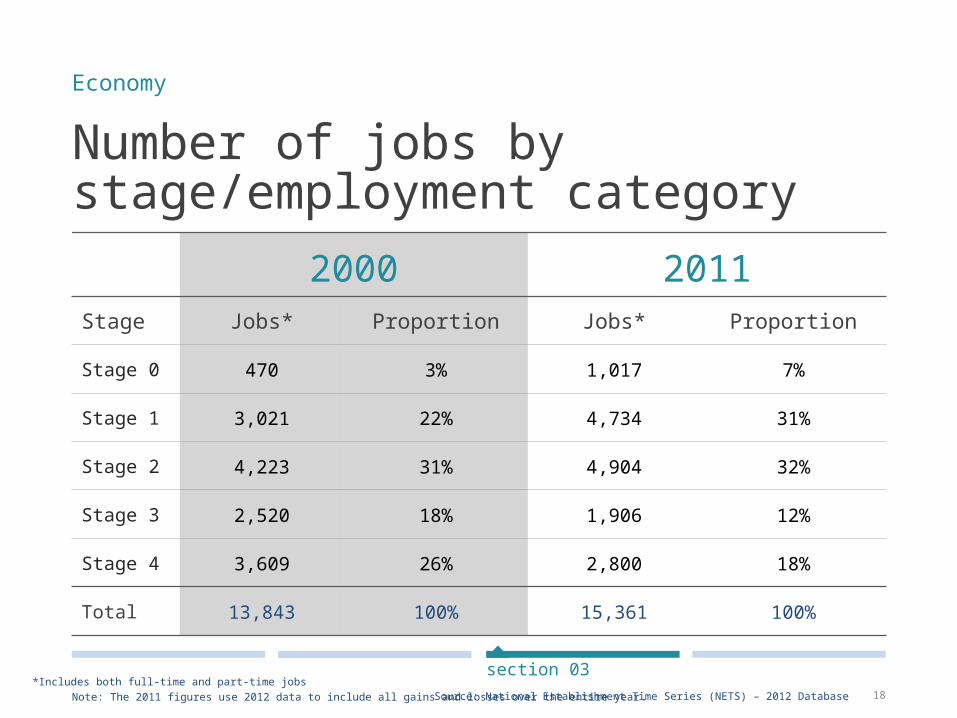
2000 2011Stage Jobs* Proportion Jobs* Proportion
Stage 0 470 3% 1,017 7%
Stage 1 3,021 22% 4,734 31%
Stage 2 4,223 31% 4,904 32%
Stage 3 2,520 18% 1,906 12%
Stage 4 3,609 26% 2,800 18%
Total 13,843 100% 15,361 100%
Note: The 2011 figures use 2012 data to include all gains and losses over the entire year.*Includes both full-time and part-time jobs

19
Amount of sales (2011 dollars) by stage/employment category
Economy
Source: National Establishment Time Series (NETS) – 2012 Database
section 03
2000 2011Stage Sales Proportion Sales Proportion
Stage 0 $53,746,199 3% $67,343,776 4%
Stage 1 $354,621,284 20% $358,383,723 24%
Stage 2 $491,690,562 28% $469,845,695 31%
Stage 3 $356,392,400 21% $211,304,649 14%
Stage 4 $478,120,695 28% $398,942,300 26%
Total $1,734,571,141 100% $1,505,820,143 100%
Note: The 2011 figures use 2012 data to include all gains and losses over the entire year.

20
Government14.6%
Arts, Enter-tainment, & Recreation
11.5%
Retail Trade11.1%
Manufacturing11.1%
Agriculture, Forestry, Fish-ing & Hunting
7.2%
All Other Indus-tries
44.5%
Top five industries in 201355.5 percent of jobs are tied to one of the top five industries in Harrison County.
Government is the largest industry sector (2,187 jobs). Agriculture, Forestry, Fishing and Hunting is the smallest of the top industry sectors with 1,071 jobs.
All of the top five industries in Harrison County, except Government, lost jobs between 2002 and 2013. Of these, Manufacturing lost the most (-42.5 percent), followed by Arts, Entertainment and Recreation (-30.5 percent). Government experienced a 11.5 percent gain in jobs over the time period.
Economy
Source: Economic Modeling Specialists International (EMSI) – 2014.3 – QCEW Employees, Non-QCEW Employees, Self-Employed, and Extended Proprietors
section 03

21
Industry distribution and changeNAICS Code
Description Jobs 2002
Jobs 2013
Change (2002-2013)
% Change (2002-2013)
Average Total
Earnings 2013
11Agriculture, Forestry, Fishing & Hunting 1,246 1,071 -175 -14% $32,558
21Mining, Quarrying, & Oil & Gas Extraction 140 105 -35 -25% $53,503
22 Utilities 112 94 -18 -16% $90,73123 Construction 799 783 -16 -2% $25,60031-33 Manufacturing 2,876 1,654 -1,222 -42% $46,15442 Wholesale Trade 330 413 83 25% $42,72144-45 Retail Trade 2,109 1,663 -446 -21% $23,42548-49 Transportation & Warehousing 477 546 69 14% $45,36551 Information 114 88 -26 -23% $44,51952 Finance & Insurance 430 502 72 17% $51,51153 Real Estate & Rental & Leasing 259 358 99 38% $23,516
54Professional, Scientific & Technical Services 402 379 -23 -6% $30,239
55Management of Companies and Enterprises 41 21 -20 -49% $48,925
56 Administrative & Waste Management 492 396 -96 -20% $19,32561 Educational Services (Private) 146 60 -86 -59% $25,88562 Health Care & Social Assistance 830 911 81 10% $32,69671 Arts, Entertainment & Recreation 2,462 1,712 -750 -30% $36,60172 Accommodation and Food Services 951 994 43 5% $16,983
81Other Services (except Public Administration) 831 1,002 171 21% $15,711
90 Government 1,962 2,187 225 11% $44,84199 Unclassified Industry 0 0 0 0% $0All Total 17,011 14,939 -2,072 -12% $34,202
Economy
Source: Economic Modeling Specialists International (EMSI) – 2014.3 – QCEW Employees, Non-QCEW Employees, Self-Employed, and Extended Proprietors
section 03Note: Average total earnings include wages, salaries, supplements and earnings from investments and proprietorships.

22
Industry distribution and change
The largest percentage gains in employment in Harrison County occurred in: Real Estate and Rental and
Leasing (+38.2 percent) Other Services (+20.6
percent)
The largest percentage losses in employment occurred in: Educational Services, private
(-58.8 percent) Management of Companies
and Enterprises (-50.0 percent)
Economy
Source: Economic Modeling Specialists International (EMSI) – 2014.3 – QCEW Employees, Non-QCEW Employees, Self-Employed, and Extended Proprietors
section 03
Employment Increase
Employment Decrease
Industries with the largest gains and losses in employment numbers between 2002 & 2013:
Government(+225)
Other Services(+171)
Manufacturing(-1,222)
Arts & Recreation
(-750)
Retail Trade(-446)

23
Sales & Related 12.4%
Management10.6%
Office & Admin-istrative Sup-
port 9.4%
Personal Care & Service
8.7%
Food Prepara-tion & Serving
Related 8.7%
All Other Oc-cupations
50.2%
Top five occupations in 2013The top five occupations in Harrison County represent 49.8 percent of all jobs.
Sales & Related (1,846 jobs) and Management (1,584 jobs) are the top two occupations in Harrison County. Food Preparation & Serving Related occupations is the smallest of the top five occupations with 1,295 jobs.
All five top occupations in Harrison County had a decrease in jobs between 2002 and 2013. However, Office & Administrative Support lost the most(-19.0 percent), followed by Personal Care (-12.5 percent).
Economy
Source: Economic Modeling Specialists International (EMSI) – 2014.3 – QCEW Employees, Non-QCEW Employees, Self-Employed, and Extended Proprietors
section 03

24
SOC Description Jobs
2002Jobs 2013
Change (2002-2013)
% Change (2002-2013)
Hourly Earnings
201311 Management 1,752 1,584 -168 -10% $19.8213 Business & Financial Operations 440 406 -34 -8% $25.3115 Computer & Mathematical 113 85 -28 -25% $27.7017 Architecture & Engineering 168 86 -82 -49% $31.0619 Life, Physical & Social Science 52 47 -5 -10% $27.7921 Community & Social Service 154 160 6 4% $19.1323 Legal 49 60 11 22% $27.2325 Education, Training & Library 765 685 -80 -10% $19.98
27Arts, Design, Entertainment, Sports & Media 359 328 -31 -9% $14.92
29 Health Care Practitioners & Technical 498 608 110 22% $32.1031 Health Care Support 238 344 106 45% $13.1133 Protective Service 329 308 -21 -6% $15.5435 Food Preparation & Serving Related 1,371 1,295 -76 -6% $10.48
37Building & Grounds Cleaning Maintenance 570 543 -27 -5% $10.36
39 Personal Care & Service 1,489 1,303 -186 -12% $10.6341 Sales & Related 2,035 1,846 -189 -9% $14.0643 Office & Administrative Support 1,740 1,409 -331 -19% $14.8345 Farming, Fishing & Forestry 101 86 -15 -15% $11.3447 Construction & Extraction 740 713 -27 -4% $14.6349 Installation, Maintenance & Repair 651 580 -71 -11% $18.0351 Production 2,053 1,189 -864 -42% $15.6353 Transportation & Material Moving 1,171 1,075 -96 -8% $16.1555 Military 116 126 10 9% $19.1199 Unclassified 58 74 16 28% $12.01All Total 17,011 14,939 -2,072 -12% $16.14
Occupation distribution and change
Economy
Source: Economic Modeling Specialists International (EMSI) – 2014.3 – QCEW Employees, Non-QCEW Employees, Self-Employed, and Extended Proprietors
section 03

25
Occupation distribution and change
Economy
Source: Economic Modeling Specialists International (EMSI) – 2014.3 – QCEW Employees, Non-QCEW Employees, Self-Employed, and Extended Proprietors
section 03
The largest percentage gains in jobs in Harrison County occurred in: Health Care Support (+44.5
percent) Unclassified (+27.5 percent)
The largest percentage losses in employment occurred in: Architecture and Engineering
(-48.8 percent) Production (-42.1 percent)
Occupations with the largest gains and losses in employment numbers between 2002 & 2013:
Health Care Practitioners
(+110)
Health Care Support(+106)
Production(-864)
Office & Administrative
Support (-331)
Employment Increase
Employment Decrease

26
Income and poverty
2000 2006 2013
Total Population in Poverty 7.2% 8.7% 13.0%
Minors (up to age 17)in Poverty
9.5% 13.0% 17.3%
Real Median Household Income (2013)*
$58,432 $56,182 $50,321
Real Per Capita Income (2013)* $34,182 $33,172 $34,410
The median household income in Harrison County dipped by $8,000 between 2000 and 2013 in real dollars (that is, adjusted for inflation), while average income per person rose by only $200 in real dollars over the same time period.
Both the total population in poverty and the number of minors in poverty nearly doubled between 2000 and 2013, with the population of minors in poverty increasing to 17.3 percent in 2013.
Economy
Source: U.S. Census Bureau – Small Area Income and Poverty Estimates (SAIPE) and U.S. Bureau of Economic Analysis – Regional Personal Income Summary
section 03
*Real median household income is the middle income value in the county. Half of the county’s households fall above this line and half below. Real per capita personal income is the average income per person in the county.

27
2000
2001
2002
2003
2004
2005
2006
2007
2008
2009
2010
2011
2012
2013
30,000
35,000
40,000
45,000
50,000
55,000
60,000
0
3
6
9
12
15
18
Rea
l Inco
me
(2013(d
olla
rs)
Popula
tion
in P
over
ty (
per
cent)Median House-
hold Income
Minors in Poverty
All Ages in Poverty
Per Capita Income
Income and povertyMedian household income in Harrison County has decreased since 2000. However, per capita income has remained about the same over the same time period. Poverty rates for adults and minors have been increasing since 2002 with a sharp increase occurring in 2009. The 2013 rates remain high relative to the early 2000s.
Economy
Source: U.S. Census Bureau – Small Area Income and Poverty Estimates (SAIPE) and U.S. Bureau of Economic Analysis – Regional Personal Income Summary
section 03

28
Takeaways
Growth in the number of establishments in Harrison County occurred in businesses with fewer than 10 employees (the self-employed and Stage 1 enterprises). These are two components of the local economy that are often overlooked but may deserve closer attention by local leaders.
Harrison County might focus on policies and programs that strengthen high-growth Stage 2 firms since they employ several people and capture sizable sales.
Government and health care industries are employment growth areas for Harrison County. But the large declines in manufacturing industry
jobs paying good wages (average of $46,000 a year) and production-related jobs (average wages of $16 per hour) between 2002 and 2013 may have contributed to falling median income levels over that time period.
Because real median income has decreased and poverty has nearly doubled in Harrison County since 2000, services targeted to poverty-stricken individuals and households should be considered. This is especially an issue for the expanding number of children in poverty.
Promoting job growth for occupations requiring educated workers could help retain adults with higher educational attainment and help increase median income.
Economy
section 03

Labor force and unemployment
Commuteshed
Laborshed
Workforceinflow/outflow
Takeaways
04labor
market

30
Labor force and unemployment
2002 2013
Labor Force 18,747 19,731
Unemployment Rate 4.7% 7.0%
The labor force in Harrison County increased by 5.2 percent between 2002 and 2013.
It is likely that some of the new entrants to the labor force were not able to find jobs, leading to the concurrent increase in the unemployment rate.
Labor market
Source: U.S. Bureau of Labor Statistics – Local Area Unemployment Statistics (2013 Annual Data Release)
section 04

31
20002001
20022003
20042005
20062007
20082009
20102011
20122013
0.0
2.0
4.0
6.0
8.0
10.0
3.2%
6.2%
4.5%
9.2%
7.0%
Unem
plo
yment
Rate
(perc
ent)
Unemployment rateUnemployment increased dramatically after 2007, peaking at 9.2 percent in 2009. Since that time, the rate has been on a slow but steady decline, dipping to 7.0 percent by 2013.
Labor market
Source: U.S. Bureau of Labor Statistics – Local Area Unemployment Statistics (2013 Annual Data Release)
section 04

32
Commuteshed
A county’s commuteshed is the geographic area to which its resident work force travels to work.
Seventy-six percent of employed residents in Harrison County commute to jobs located outside of the county. Jefferson County, Kentucky, is the biggest destination for residents who work outside of Harrison County.
Thirty-nine percent of out-commuters work in counties adjacent to Harrison County; however, the fourth largest work destination outside Harrison County is the Indianapolis metropolitan area (Marion County), while the fifth largest is the Evansville metropolitan area (Vanderburgh County).
Labor market
Source: U.S. Census Bureau – Longitudinal Employer-Household Dynamics (LEHD)
section 04
14,102
Out-Commuters
4,393
Same Work/Home
Commuters Proportion
Jefferson, KY 4,131 22.3%
Floyd, IN 2,525 13.7%
Clark, IN 1,910 10.3%
Marion, IN 595 3.2%
Vanderburgh, IN
324 1.8%

33
Commuteshed in 2011Labor market
section 04
Source: U.S. Census Bureau, OTM, LEHD, PCRD
Seventy percent of Harrison County’s working residents are employed either in Harrison, Floyd or Clark Counties in Indiana, or Jefferson County, Kentucky. Another 5 percent commute to Marion or Vanderburgh Counties. An additional 5 percent travel to jobs in Allen, Crawford, Monroe, Tippecanoe or Washington Counties. Collectively, these eleven counties represent 80 percent of the commuteshed for Harrison County.

34
Laborshed
Commuters Proportion
Floyd, IN 953 9.5%
Jefferson, KY 757 7.6%
Clark, IN 714 7.2%
Crawford, IN 457 4.6%
Washington, IN 358 3.6%
Labor market
Source: U.S. Census Bureau – Longitudinal Employer-Household Dynamics (LEHD)
section 04
5,587
In-Commuters
4,393
Same Work/Home
A county’s laborshed is the geographic area from which it draws employees.
Fifty-six percent of individuals working in Harrison County commute from another county.
Forty-eight percent of in-commuters reside in counties adjacent to Harrison County. Floyd County, Indiana, and Jefferson County, Kentucky, are the biggest sources of laborers outside of Harrison County.

35
Laborshed in 2011Labor market
section 04
Source: U.S. Census Bureau, OTM, LEHD, PCRD
The bulk (70 percent) of Harrison County’s workforce
is drawn from Harrison, Floyd and Clark Counties in Indiana or Jefferson County,
Kentucky. Another 5 percent is drawn from Crawford
County in Indiana. An additional 5 percent comes
from Washington and Marion Counties in Indiana and
Meade County in Kentucky. Combined, the eight
counties represent 80 percent of Harrison County’s
laborshed.

36
Workforce inflow and outflow in 2011
Labor market
section 04
Source: U.S. Census Bureau, OTM, LEHD, PCRD
Harrison County has more laborers traveling out of the county for work than into the county for work.
Net commuting is negative, with a loss of 8,515 commuters. The resulting situation is that for every 100 employed residents, Harrison County has 54 jobs.
CountProporti
on
Employed in Harrison County 9,980 100%
Both employed and livingin the county
4,393 44%
Employed in the countybut living outside
5,587 56%
Living in Harrison County 18,495 100%
Both living and employedin the county
4,393 24%
Living in the countybut employed outside 14,102 76%

37
Takeaways
Harrison County’s unemployment rate has increased since 2002, swelling to over 9 percent in 2009. The majority of this increase occurred during the period of the Great Recession (approximately 2008–10). The rate has since been decreasing.
Concurrent with population increases, the county’s labor force has increased since 2002. However, the increased unemployment rate indicates that new entrants to the labor force may be experiencing difficulties finding a job.
Employees that work but do not live in Harrison County tend to commute from surrounding counties. People who commute out of the county for work often travel to other metropolitan areas.
Harrison County should assess if a major workforce development training effort should be targeted to the growing number of working age adults struggling to find jobs. Furthermore, determining the human capital attributes of workers who commute to jobs outside the county might be insightful. It may provide the information needed to determine how best to reduce the leakage of educated and skilled workers to surrounding counties.
The laborshed and commuteshed data offer solid evidence of the value of pursuing economic and workforce development on a regional (multi-county) basis.
Labor market
section 04

38
Notes
LAUS (Local Area Unemployment Statistics):LAUS is a U.S. Bureau of Labor Statistics (BLS) program that provides monthly and annual labor force, employment and unemployment data by place of residence at various geographic levels. LAUS utilizes statistical models to estimate data values based on household surveys and employer reports. These estimates are updated annually. Annual county-level LAUS estimates do not include seasonal adjustments.
LEHD (Longitudinal Employer-Household Dynamics):LEHD is a partnership between U.S. Census Bureau and State Department of Workforce Development (DWD) to provide labor market and journey to work data at various geographic levels. LEHD uses Unemployment Insurance earnings data and Quarterly Census of Employment and Wages from DWDs and census administrative records related to individuals and businesses.
NETS (National Establishment Time Series): NETS is an establishment-level database, not a company-level database. This means that each entry is a different physical location, and company-level information must be created by adding the separate establishment components.
OTM (On the Map):OTM, a product of LEHD program, is used in the county snapshot report to develop commuting patterns for a geography from two perspectives: place of residence and place of work. At the highly detailed level of census blocks, some of the data are synthetic to maintain confidentiality of the worker. However, for larger regions mapped at the county level, the commuteshed and laborshed data are fairly reasonable.
OTM includes jobs for a worker employed in the reference as well as previous quarter. Hence, job counts are based on two consecutive quarters (six months) measured at the “beginning of a quarter.” OTM data can differ from commuting patterns developed from state annual income tax returns, which asks a question about “county of residence” and “county of work” on January 1 of the tax-year. OTM can also differ from American Community Survey data, which is based on a sample survey of the resident population.
SAIPE (Small Area Income and Poverty Estimates):SAIPE is a U.S. Census Bureau program that provides annual data estimates of income and poverty statistics at various geographic levels. The estimates are used in the administration of federal and state assistance programs. SAIPE utilizes statistical models to estimate data from sample surveys, census enumerations and administrative records.

39
Report ContributorsThis report was prepared by the Purdue Center for Regional Development in partnership with Purdue University Extension.
Data AnalysisIndraneel Kumar, Ph.D.Ayoung Kim
Report AuthorsElizabeth DobisBo Beaulieu, Ph.D.
Report DesignTyler Wright

FOR MORE INFORMATION
Purdue Center for Regional Development (PCRD) . . .seeks to pioneer new ideas and strategies that contribute to regional collaboration, innovation and prosperity.
Purdue Extension Community Development (CD) . . . works to strengthen the capacity of local leaders, residents and organizations to work together to develop and sustain strong, vibrant communities.
Please contact
Annette LawlerCounty Extension Community Development [email protected]
PCRDMann Hall, Suite 266Purdue University
OR