Embed Size (px)
Citation preview
Geological Investigation of the Mono Basin using ArcGIS
Written By: Sachin Mehta
University of Nevada, Reno
Abstract
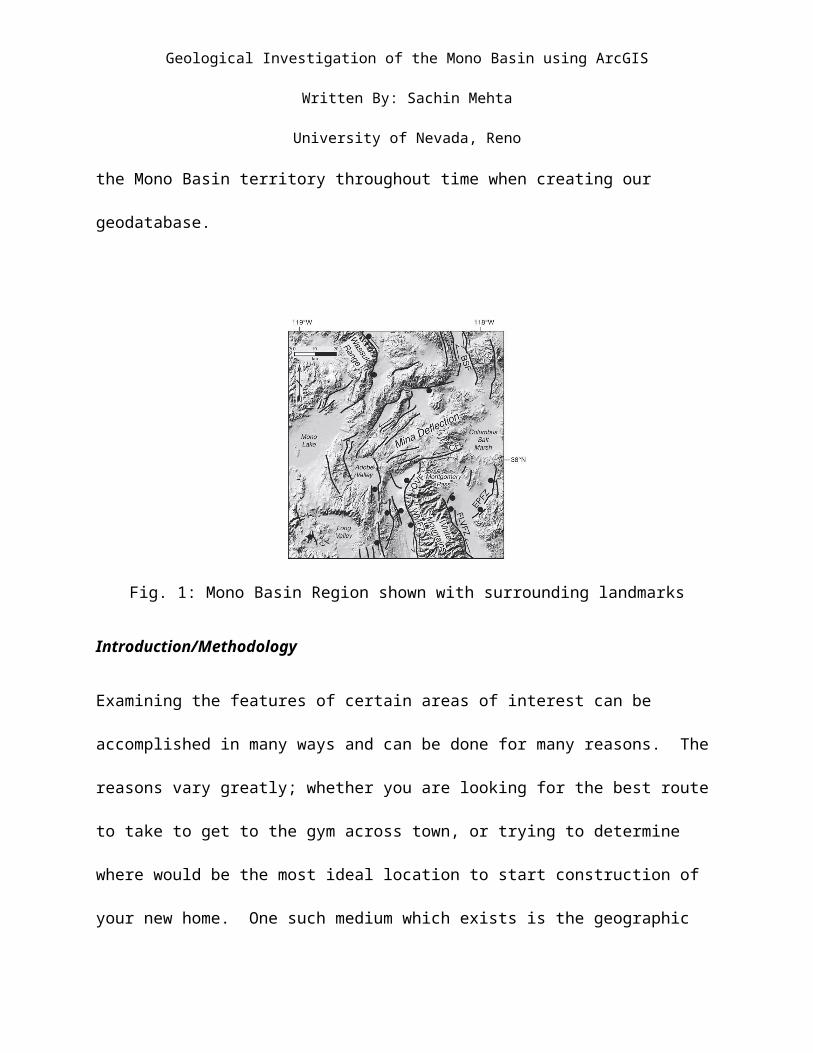
This paper entails the examination of the geological activity of the Mono Basin (Fig. 1) and the
surrounding areas of the region. Investigations performed for this research paper incorporated
the advanced spatial and map analysis software ArcGIS and its many toolsets. Three main
objectives of the research included determining patterns among fault lines and springs, charting
shorelines through time, as well as hyper spectral remote sensing of the craters in the Mono
Basin. Implementing tools provided in ArcGIS allowed us to find that no meaningful
relationship existed between the fault lines of the Mono Basin and the thermal springs located
there. Regarding other matters we focused on, it was discovered that there was a sharp decline
in water level of the Basin from 1940 to 1983 and that the water level currently resides at
1944.4 m (meters). It was important to note down these analyses because then by adding
hyperspectral imaging to the interpretation we were able to gain a better understanding of the
Mono Basin territory throughout time when creating our geodatabase.
Geological Investigation of the Mono Basin using ArcGIS
Written By: Sachin Mehta
University of Nevada, Reno
Fig. 1: Mono Basin Region shown with surrounding landmarks
Introduction/Methodology
Examining the features of certain areas of interest can be accomplished in many ways and can
be done for many reasons. The reasons vary greatly; whether you are looking for the best
route to take to get to the gym across town, or trying to determine where would be the most
ideal location to start construction of your new home. One such medium which exists is the
geographic information system (or GIS). With it not just being a “map-maker,” this software
provides the user with a nearly unlimited amount of resources, variables, and settings to
consider. Every field of study can implement the software known as ArcGIS into their research
and/or day-to-day activities to discover relationships and spatial patterns that permeate the
geographic data that is inputted to the program.
This paper delves into the world of geology and variables’ relationships with one another;
specifically in the Mono Basin. Located near Mammoth Lakes in the Sierras, the Mono Basin
Geological Investigation of the Mono Basin using ArcGIS
Written By: Sachin Mehta
University of Nevada, Reno
holds the oldest lake in North America—that was a product of the tectonic settings of the
region. In order to preserve the integrity of our research, different team members focused on
various portion of our research—giving us more focus on specificity.
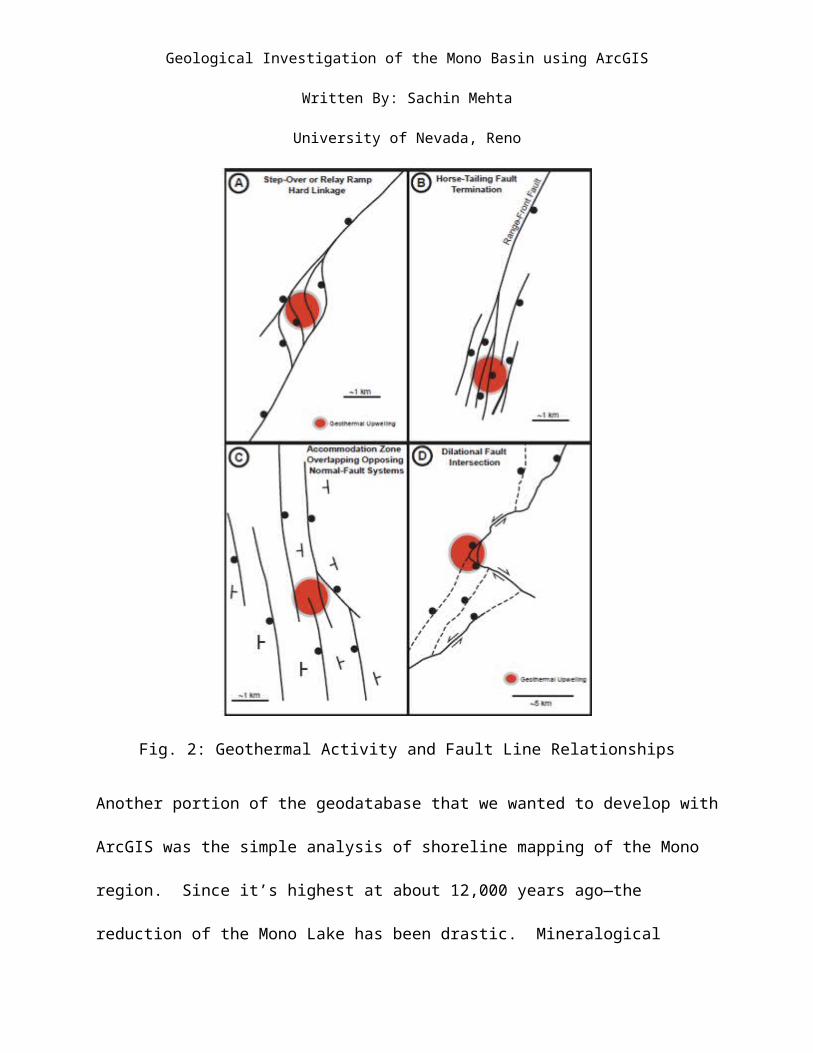
Our main focus in developing the wide geodatabase for the Mono Basin and its surrounding
area was to answer the questions of spatial correlations between fault lines and geothermal
activity. A visual representation of this phenomenon is depicted in Fig. 2 below. This meant we
wanted to determine if thermal springs were always, for the most part, generated near the
faults and craters in the Mono Basin. With the wide array of mitigating factors, it was difficult
to analyze specifically if there was a spatial correlation between such things. Faults are the
major controlling feature to fluid flow within a geothermal region, so therefore there should be
hydrothermal regions near and around the vicinity of the fault lines in the region.
Geological Investigation of the Mono Basin using ArcGIS
Written By: Sachin Mehta
University of Nevada, Reno
Fig. 2: Geothermal Activity and Fault Line Relationships
Another portion of the geodatabase that we wanted to develop with ArcGIS was the simple
analysis of shoreline mapping of the Mono region. Since it’s highest at about 12,000 years ago
—the reduction of the Mono Lake has been drastic. Mineralogical differences were analyzed
with the assistance of AVIRIS, which is an airborne infrared imaging spectroscopy. This data
was taken from the USGS and analyzed with ArcGIS to from the geodatabase layers for the final
Geological Investigation of the Mono Basin using ArcGIS
Written By: Sachin Mehta
University of Nevada, Reno
output result.
The last portion of the geodatabase that we wanted to implement was the Bedrock Mapping of
the Mono-Inyo Craters. The Mono-Inyo Craters are unique in that they are an extremely young
volcanic system with eruptions occurring from approximately 40,000 years ago, to the most
recent 300 years ago. Previous work shows that the craters show a general weathering trend
apparent in AVIRIS data. To take this to the next step in investigating this trend, masks will be
created of each of the craters using high resolution aerial photography. These masks will
outline areas of bedrock, tephra, vegetation, and pumice mines that are active on several of the
craters. These masks can then be used to extract spectra from the AVIRIS imagery and show
spectral variation based on these textural and compositional differences to determine what is
type of rocks are causing the weathering trend.
Results
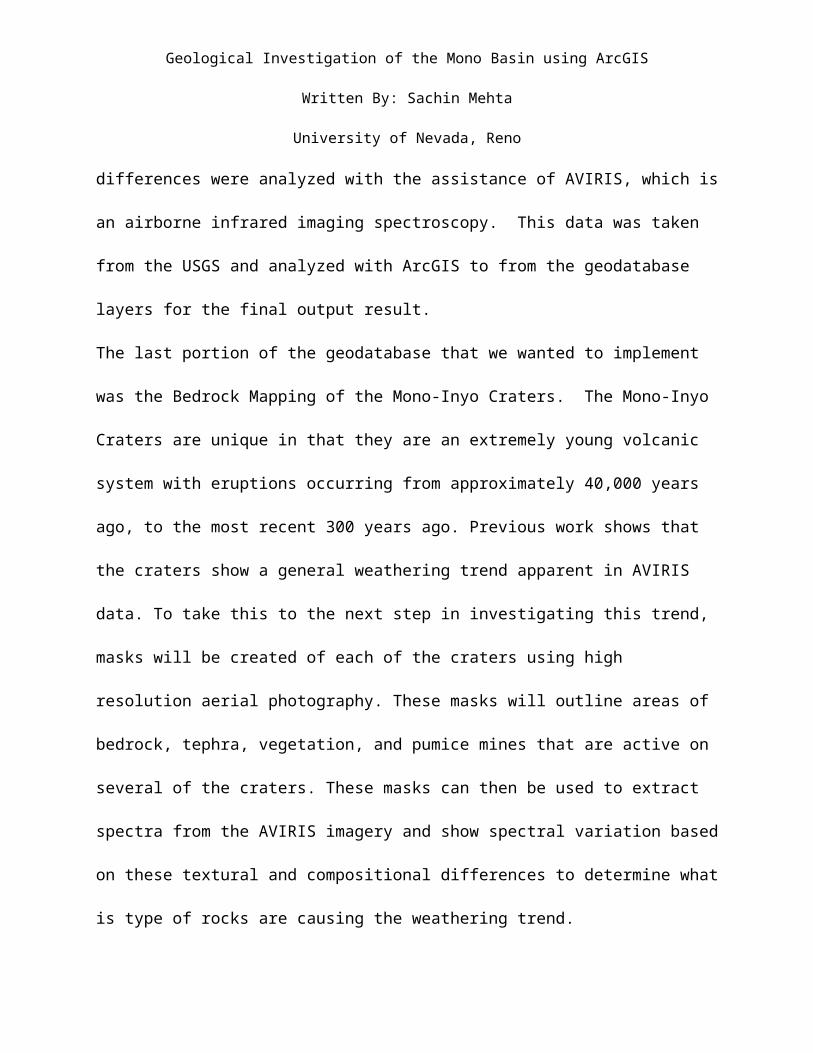
Spatial patterns of the Mono Basin and its surrounding regions have been identified using
ArcGIS software. The geological features of the area include a vast array of geothermal
elements including fumaroles, thermal springs, faults, and even craters. Analyses to determine
the locations of fault lines—both hidden and inferred—was performed with ArcGIS. The map
output in Fig. 3 depicts the region known as the Mono Lake with concealed faults (represented
by dash lines) and normal fault lines (represented with solid lines).
Geological Investigation of the Mono Basin using ArcGIS
Written By: Sachin Mehta
University of Nevada, Reno
Fig 3: Concealed faults (dashed) & normal faults (solid) in the Mono Basin Region
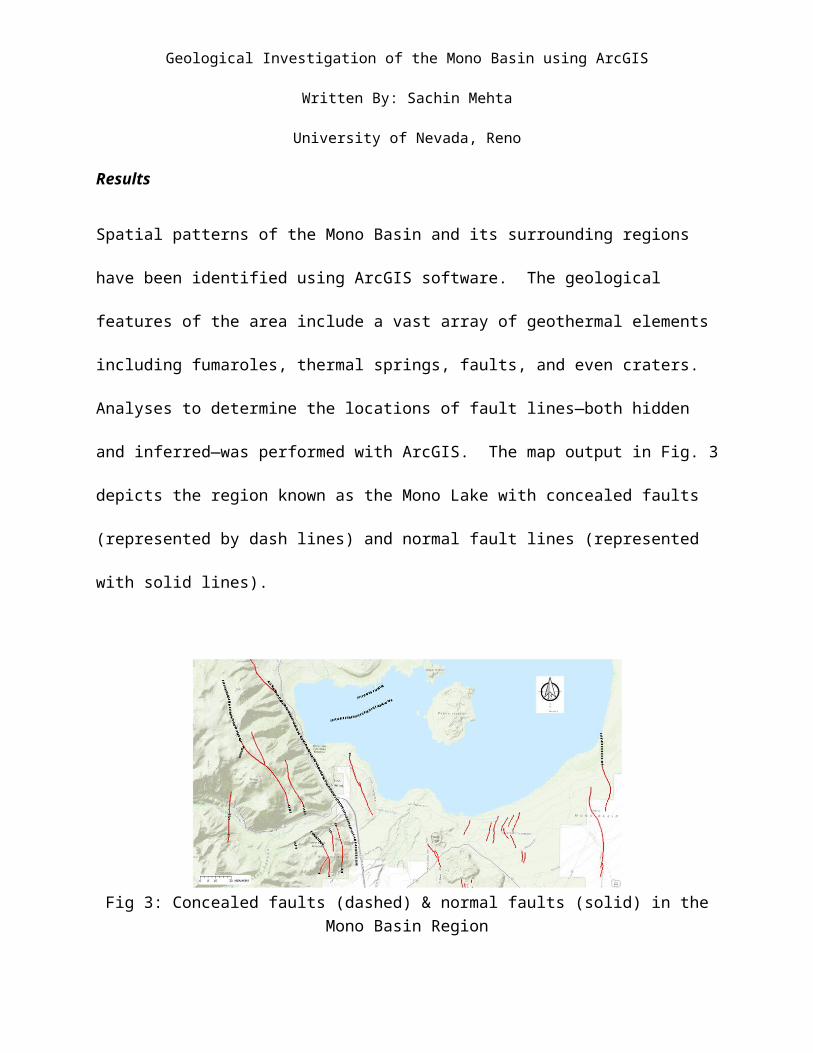
Geothermal activity in the region was addressed using the present topography and data that
we had access to. With such information, we found that the thermal springs in and around the
Basin are controlled by the fractures (faults) and tufa ridges of the area. In addition, the
volcanic vents of the region were identified to be located at an average of 10 km from any
thermal spring. This was done by performing a Generate Near Table Analysis with the ArcMap
software.
Fig. 4: Histogram of number of thermal springs near faults around Mono Basin region
Geological Investigation of the Mono Basin using ArcGIS
Written By: Sachin Mehta
University of Nevada, Reno
In addition, it was important to analyze areas of interest where geothermal activity could be
high and drilling could take place. Determining any correlation among the features of fault lines
and springs—and if there is any spatial pattern between them could assist in exploration studies
and reduce time & effort in answering the question of “Where should we drill?”
Performing our own investigation we attempted to uncover any relationship between the
end/start points of the many normal faults in the region and distance to a thermal spring from
those respective point locations. We developed an analysis identifying that the most amount of
thermal springs in the Mono region (~ 950) lay at a harrowing 11 km from the beginning or end
of any fault line. This insinuated that drilling near the start or end of a fault line in the Mono
Basin region would not guarantee fruitful results of hydrothermal regions.
Fig. 5: Number of thermal springs vs. distance to start/end fault line
Geological Investigation of the Mono Basin using ArcGIS
Written By: Sachin Mehta
University of Nevada, Reno
Discussion
The various geological activity taking place around the Mono Basin Region is extraordinary—
and it being the oldest lake in North America, our analysis in this paper makes it even more
astounding. Determining the relationships among the geologic points in the region and
whether they had effects on one another answered a major question that could help in later
studies, research, and work in the area. The particular toolsets used from ArcGIS, such as the
‘Generate Near Table’ analysis was just one of the many incredible and useful ways to gather
such important data. Finding that the lake levels of Mono Lake fluctuate a great deal was
another important output that occurred from our analyses with ArcGIS. With the Mono-Inyo
and volcanic craters occurring in and around the region, our analysis on these particular
geological features could possibly help future studies take place.
The wide array of possibilities with using ArcGIS in forming our analyses was never ending. It is
not quite possible to really know whether or not the analysis performed and statistics obtained
was truly meaningful because there are other factors that are not accounted for. For example,
if the data from the USGS that we used was accurate and their locations in the correct UTM
zones were precise could have had a major effect on meaningful results for our geodatabase.
In addition, knowing additional data features—such as depths of the faults in the region, with
specific accounted numerical distances could have been applied to obtain a better analysis.
Temperature of the Mono-Inyo craters, and of the Mono Lake water itself would have been
Geological Investigation of the Mono Basin using ArcGIS
Written By: Sachin Mehta
University of Nevada, Reno
variables that could have been applied to better our results also. There exists a wide amount of
additions we could have applied in our ArcGIS analysis to make our geodatabase even more
suitable as an end-result but in the time allotted, this Geological Investigation of the Mono
Basin & Resulting Analysis was performed with great success.


![Python and ArcGIS Enterprise - static.packt-cdn.com€¦ · Python and ArcGIS Enterprise [ 2 ] ArcGIS enterprise Starting with ArcGIS 10.5, ArcGIS Server is now called ArcGIS Enterprise](https://img.pdfslide.us/doc/110x75/5ecf20757db43a10014313b7/python-and-arcgis-enterprise-python-and-arcgis-enterprise-2-arcgis-enterprise.jpg)