Embed Size (px)
Citation preview
2016 SHORT Summary of
Regional and County Topline Results
with Comparisons between Years
where applicable/ available
October, 2016
The Metro Atlanta Speaks (MAS) public opinion survey is in its fourth year.
The 2016 MAS was conducted by A.L. Burruss Institute of Public Service and Research at Kennesaw State
University (KSU). The 2016 survey asked 27 questions of 5,416 residents in a 13-county area, with
results significant down to the county-level, as well as for the City of Atlanta. The 2015 MAS, also done
by KSU, asked 26 questions of 5,200 residents in a 13-county area, with results also significant down to
the county-level. The 2014 MAS was conducted by The Schapiro Group, and asked 25 questions of 4,200
residents in a 10-county area, and was (as well) significant down to the county-level. The first survey—
2013--- was also conducted by KSU, and asked 21 questions of 2,100 voting-age residents. The 2013 MAS
was significant only at the regional (10-county level).
The goal in all years was gather opinions on how the 10 (or 13)-county Atlanta region rates in terms of
key quality-of-life issues like transportation, education, the economy, the arts and aging in the Atlanta
region. In 2014, the survey added questions on water, job training, starting a business, healthcare, and
parks. In 2015, the survey added questions on civic involvement and engagement. In 2016, questions
were added on financial resiliency, food insecurity, and challenges faced in accessing transportation.
While each year’s survey provides a point-in-time understanding of how residents perceive the quality-
of-life in metro Atlanta, the true value of the effort is understanding how perceptions do or don’t
change over time. ARC will seek to, with its community partners, continue this survey annually to build
that “longitudinal” database.
This summary focus on regional results and topline county data. Regional survey margin of error for the
2016 instrument is +_ 1.3% percentage points (from 1.7% in 2015 and 2.1% in 2014) at the 95 percent
confidence level. County significance ranges from +- 4 to _+-7%. Data to come will detail county-level
results by demographics.
Metro Atlanta Speaks-Background
TRANSPORTATION

4%
6%
6%
4%
2%
3%
13%
24%
17%
21%
4%
4%
6%
4%
3%
7%
14%
20%
14%
24%
4%
2%
5%
5%
5%
7%
14%
15%
17%
27%
2%
3%
4%
5%
6%
9%
12%
12%
23%
25%
0% 5% 10% 15% 20% 25% 30%
DK
Other
Taxes
Public Health
Race Relations
Human Services
Public Education
Economy
Crime
Trans
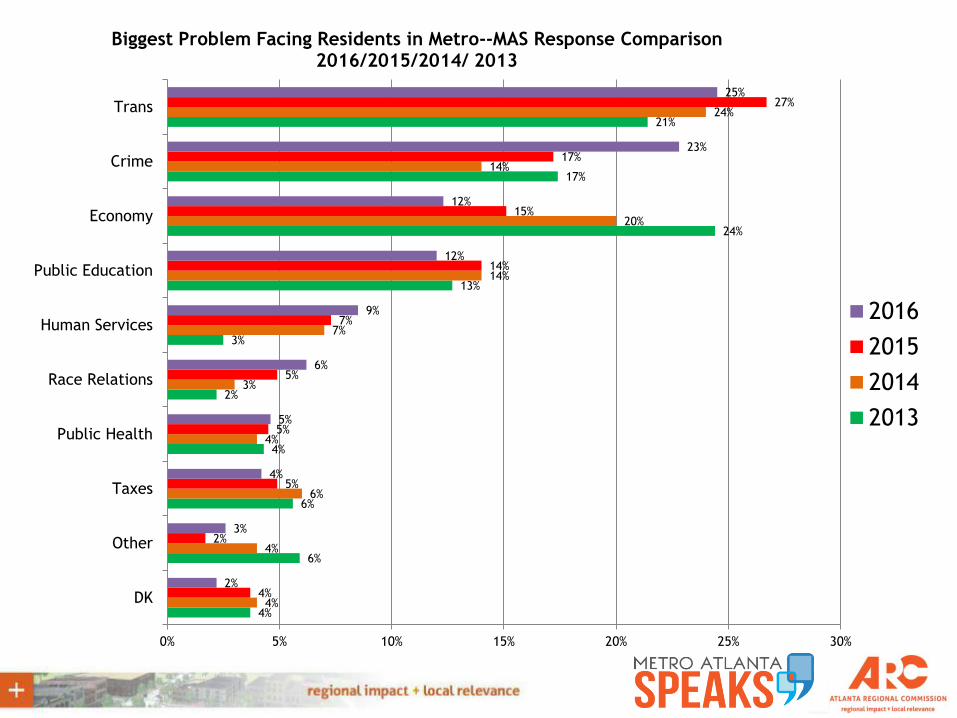
Biggest Problem Facing Residents in Metro--MAS Response Comparison 2016/2015/2014/ 2013
2016
2015
2014
2013
0.0% 20.0% 40.0% 60.0% 80.0% 100.0%
Butts
Rockdale
Clayton
Coweta
City of Atlanta
Henry
Douglas
Paulding
DeKalb
Fayette
Fulton
Gwinnett
Cobb
Cherokee
ARC Region
11.2%
14.3%
17.1%
17.2%
19.1%
19.5%
19.8%
21.4%
22.3%
23.8%
25.2%
27.8%
29.2%
29.8%
24.5%
7.3%
7.8%
10.6%
7.0%
4.5%
6.7%
13.0%
5.0%
3.6%
7.0%
6.2%
6.3%
6.0%
4.8%
6.2%
29.1%
17.0%
10.8%
13.5%
7.1%
14.2%
14.0%
15.0%
13.4%
9.8%
8.3%
12.5%
14.5%
13.5%
12.3%
21.8%
30.8%
27.1%
31.4%
30.6%
28.4%
23.3%
28.7%
23.2%
21.3%
25.2%
19.5%
16.7%
19.8%
22.8%
1.0%
2.5%
4.5%
3.5%
4.7%
2.2%
2.3%
3.0%
6.2%
5.3%
5.5%
5.0%
3.7%
3.3%
4.6%
12.1%
12.8%
11.3%
11.5%
13.8%
12.7%
13.5%
6.7%
15.5%
17.5%
12.8%
10.0%
11.0%
7.8%
12.0%
6.8%
8.5%
13.1%
9.0%
11.3%
8.2%
7.3%
9.2%
9.4%
5.8%
8.0%
5.5%
9.7%
12.0%
8.5%
5.8%
3.0%
1.5%
2.5%
5.2%
4.5%
4.0%
6.0%
3.2%
5.5%
4.5%
5.5%
4.2%
4.3%
4.2%
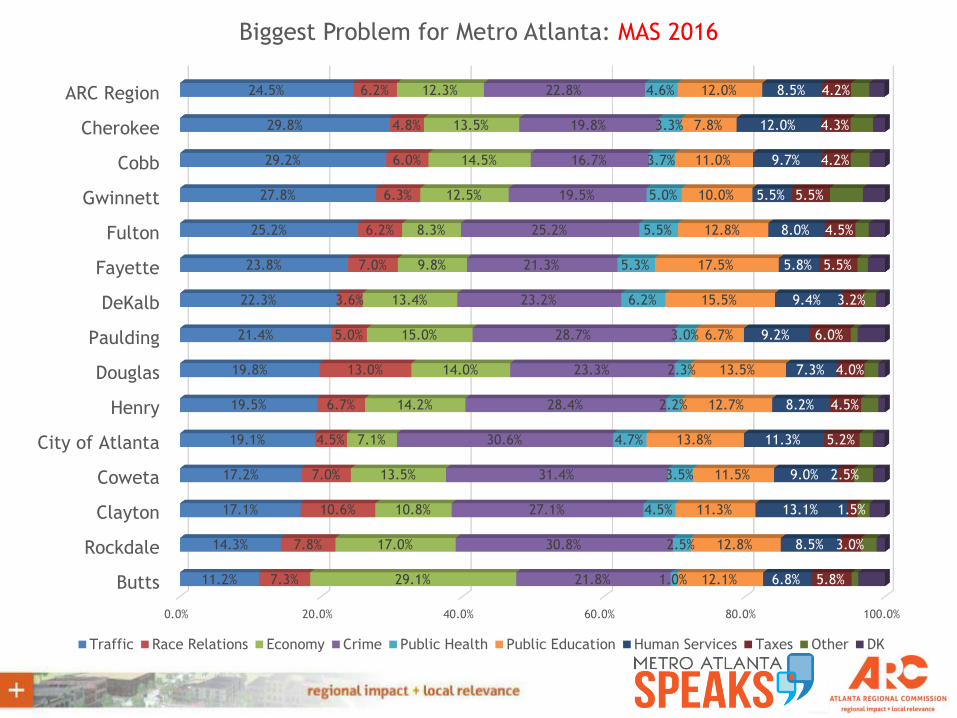
Biggest Problem for Metro Atlanta: MAS 2016
Traffic Race Relations Economy Crime Public Health Public Education Human Services Taxes Other DK
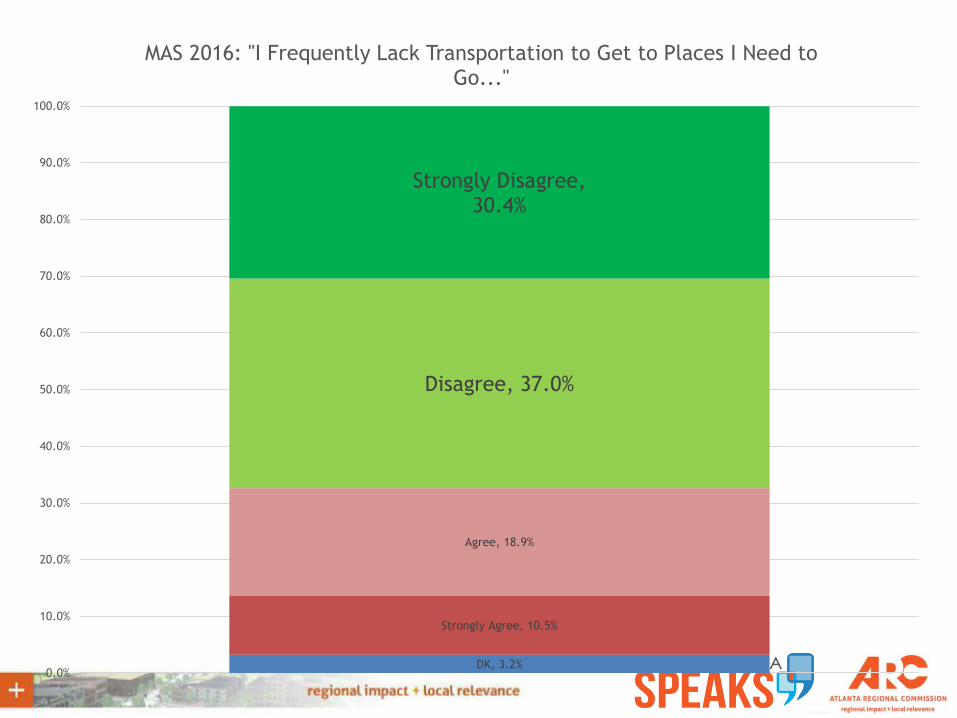
DK, 3.2%
Strongly Agree, 10.5%
Agree, 18.9%
Disagree, 37.0%
Strongly Disagree, 30.4%
0.0%
10.0%
20.0%
30.0%
40.0%
50.0%
60.0%
70.0%
80.0%
90.0%
100.0%
MAS 2016: "I Frequently Lack Transportation to Get to Places I Need to Go..."
0% 10% 20% 30% 40% 50% 60% 70% 80% 90% 100%
ARC Region
Clayton
Rockdale
DeKalb
City of Atlanta
Gwinnett
Coweta
Butts
Fulton
Douglas
Henry
Cherokee
Fayette
Paulding
Cobb
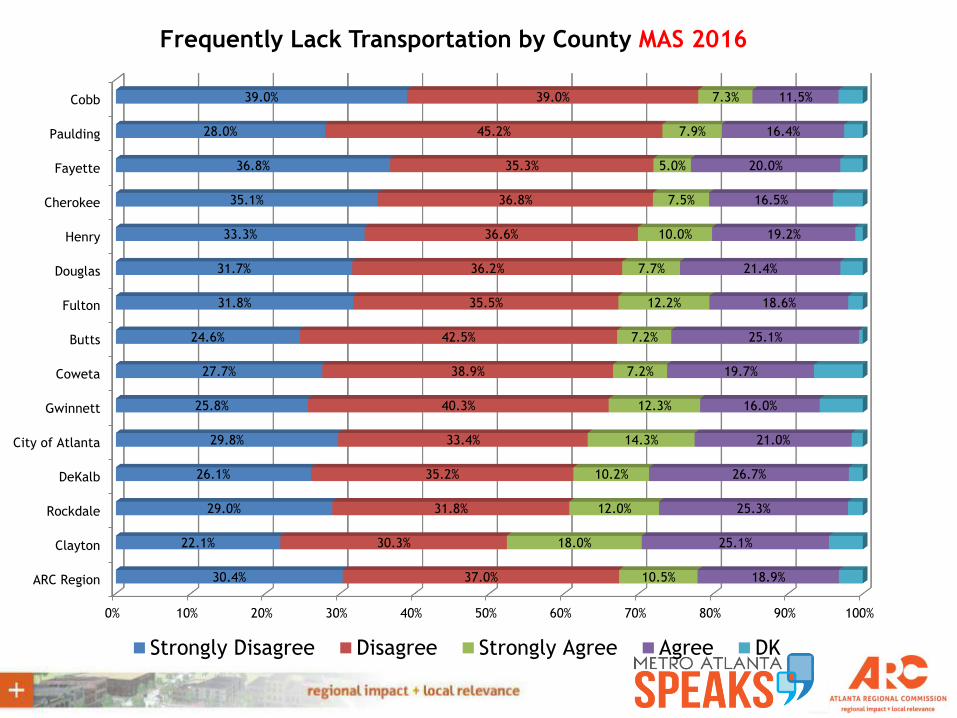
30.4%
22.1%
29.0%
26.1%
29.8%
25.8%
27.7%
24.6%
31.8%
31.7%
33.3%
35.1%
36.8%
28.0%
39.0%
37.0%
30.3%
31.8%
35.2%
33.4%
40.3%
38.9%
42.5%
35.5%
36.2%
36.6%
36.8%
35.3%
45.2%
39.0%
10.5%
18.0%
12.0%
10.2%
14.3%
12.3%
7.2%
7.2%
12.2%
7.7%
10.0%
7.5%
5.0%
7.9%
7.3%
18.9%
25.1%
25.3%
26.7%
21.0%
16.0%
19.7%
25.1%
18.6%
21.4%
19.2%
16.5%
20.0%
16.4%
11.5%
Frequently Lack Transportation by County MAS 2016
Strongly Disagree Disagree Strongly Agree Agree DK
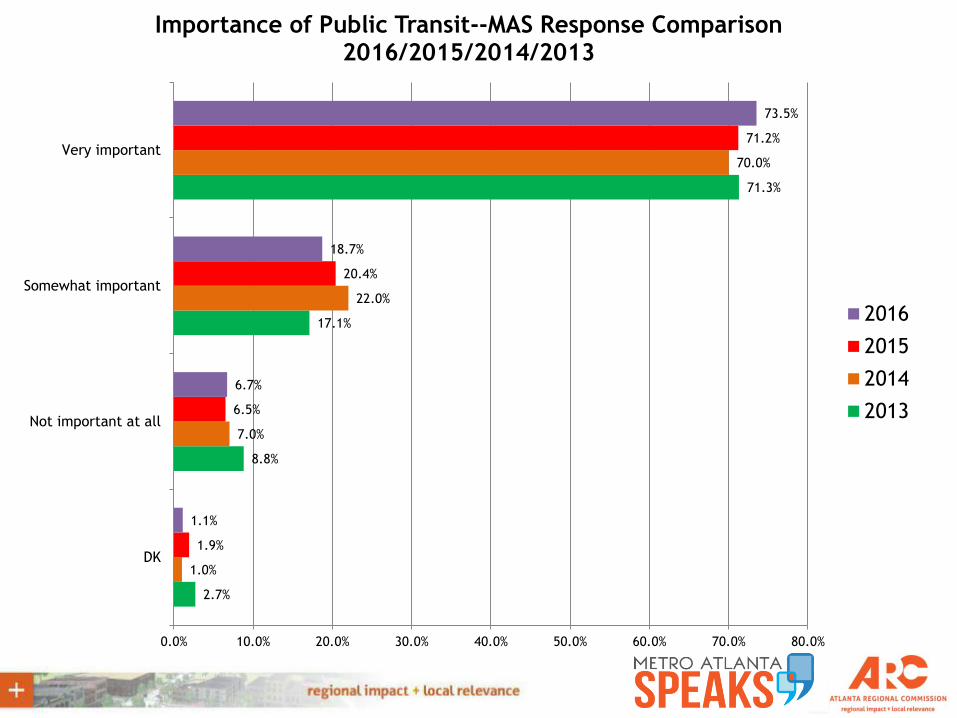
2.7%
8.8%
17.1%
71.3%
1.0%
7.0%
22.0%
70.0%
1.9%
6.5%
20.4%
71.2%
1.1%
6.7%
18.7%
73.5%
0.0% 10.0% 20.0% 30.0% 40.0% 50.0% 60.0% 70.0% 80.0%
DK
Not important at all
Somewhat important
Very important
Importance of Public Transit--MAS Response Comparison 2016/2015/2014/2013
2016
2015
2014
2013
0.0% 10.0% 20.0% 30.0% 40.0% 50.0% 60.0% 70.0% 80.0% 90.0% 100.0%
Butts
Paulding
Cherokee
Fayette
Douglas
Rockdale
Gwinnett
Coweta
Cobb
Henry
Fulton
Clayton
DeKalb
City ofAtlanta
ARCRegion
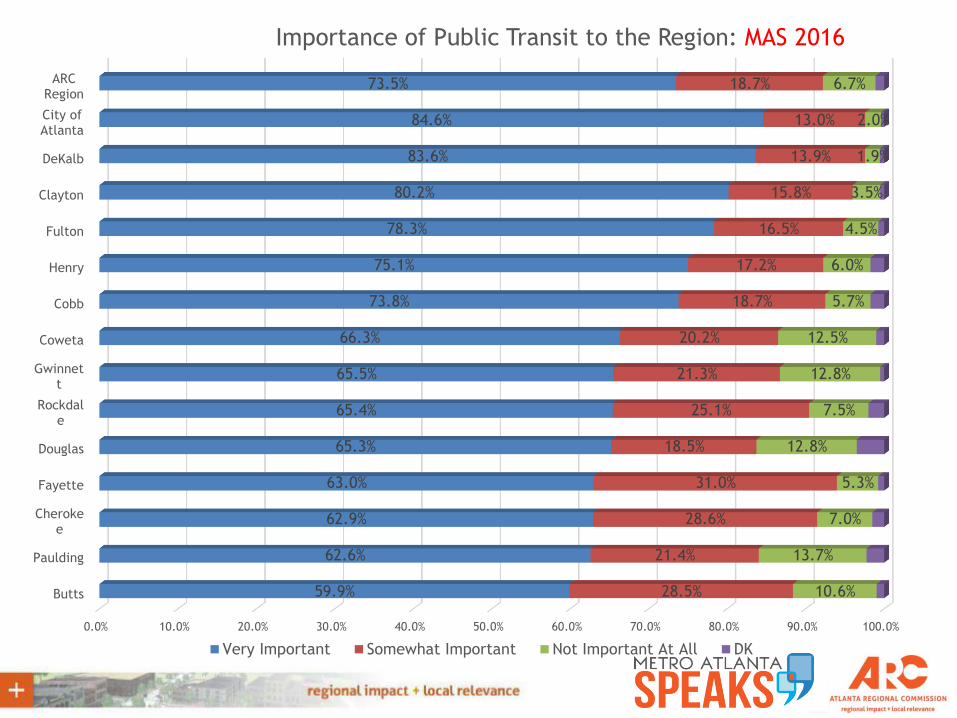
59.9%
62.6%
62.9%
63.0%
65.3%
65.4%
65.5%
66.3%
73.8%
75.1%
78.3%
80.2%
83.6%
84.6%
73.5%
28.5%
21.4%
28.6%
31.0%
18.5%
25.1%
21.3%
20.2%
18.7%
17.2%
16.5%
15.8%
13.9%
13.0%
18.7%
10.6%
13.7%
7.0%
5.3%
12.8%
7.5%
12.8%
12.5%
5.7%
6.0%
4.5%
3.5%
1.9%
2.0%
6.7%
Importance of Public Transit to the Region: MAS 2016
Very Important Somewhat Important Not Important At All DK
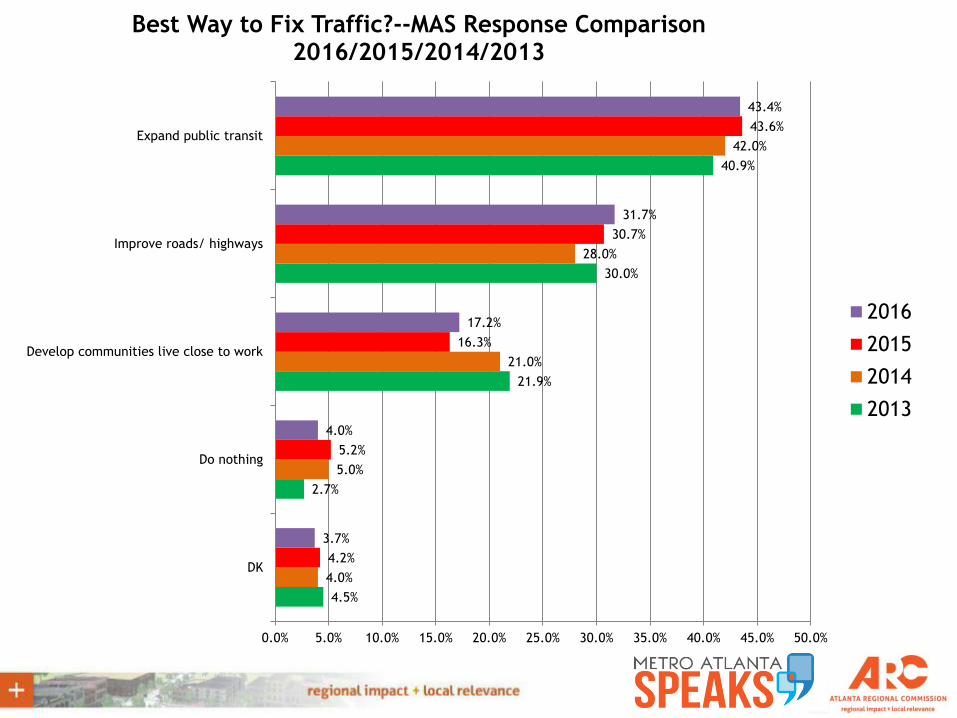
4.5%
2.7%
21.9%
30.0%
40.9%
4.0%
5.0%
21.0%
28.0%
42.0%
4.2%
5.2%
16.3%
30.7%
43.6%
3.7%
4.0%
17.2%
31.7%
43.4%
0.0% 5.0% 10.0% 15.0% 20.0% 25.0% 30.0% 35.0% 40.0% 45.0% 50.0%
DK
Do nothing
Develop communities live close to work
Improve roads/ highways
Expand public transit
Best Way to Fix Traffic?--MAS Response Comparison 2016/2015/2014/2013
2016
2015
2014
2013
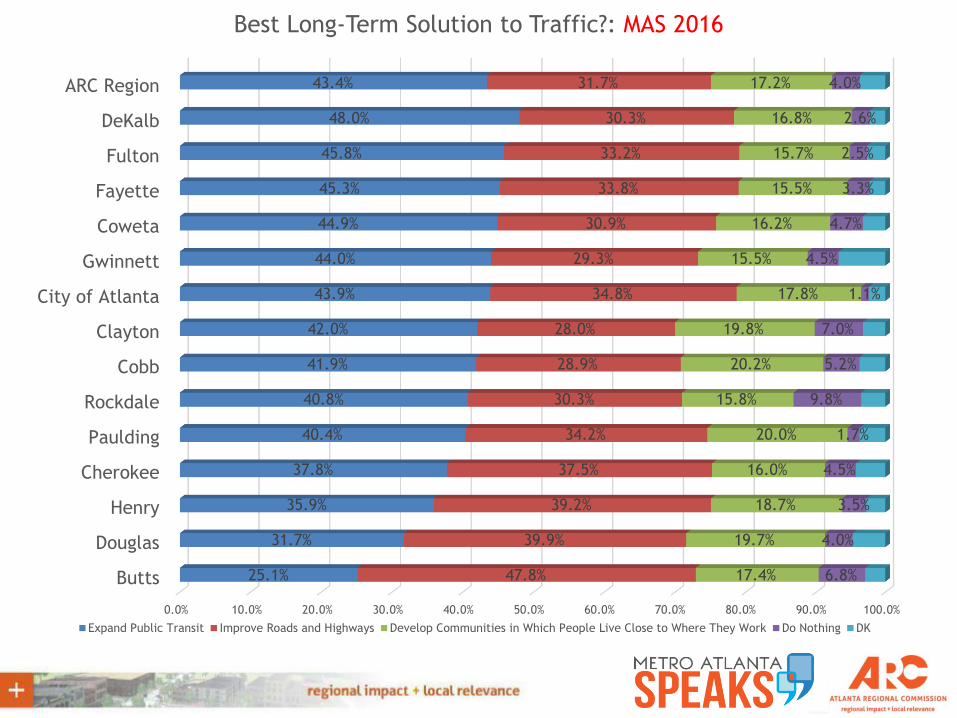
0.0% 10.0% 20.0% 30.0% 40.0% 50.0% 60.0% 70.0% 80.0% 90.0% 100.0%
Butts
Douglas
Henry
Cherokee
Paulding
Rockdale
Cobb
Clayton
City of Atlanta
Gwinnett
Coweta
Fayette
Fulton
DeKalb
ARC Region
25.1%
31.7%
35.9%
37.8%
40.4%
40.8%
41.9%
42.0%
43.9%
44.0%
44.9%
45.3%
45.8%
48.0%
43.4%
47.8%
39.9%
39.2%
37.5%
34.2%
30.3%
28.9%
28.0%
34.8%
29.3%
30.9%
33.8%
33.2%
30.3%
31.7%
17.4%
19.7%
18.7%
16.0%
20.0%
15.8%
20.2%
19.8%
17.8%
15.5%
16.2%
15.5%
15.7%
16.8%
17.2%
6.8%
4.0%
3.5%
4.5%
1.7%
9.8%
5.2%
7.0%
1.1%
4.5%
4.7%
3.3%
2.5%
2.6%
4.0%
Best Long-Term Solution to Traffic?: MAS 2016
Expand Public Transit Improve Roads and Highways Develop Communities in Which People Live Close to Where They Work Do Nothing DK
CRIME

4%
6%
6%
4%
2%
3%
13%
24%
17%
21%
4%
4%
6%
4%
3%
7%
14%
20%
14%
24%
4%
2%
5%
5%
5%
7%
14%
15%
17%
27%
2%
3%
4%
5%
6%
9%
12%
12%
23%
25%
0% 5% 10% 15% 20% 25% 30%
DK
Other
Taxes
Public Health
Race Relations
Human Services
Public Education
Economy
Crime
Trans
Biggest Problem Facing Residents in Metro--MAS Response Comparison 2016/2015/2014/ 2013
2016
2015
2014
2013
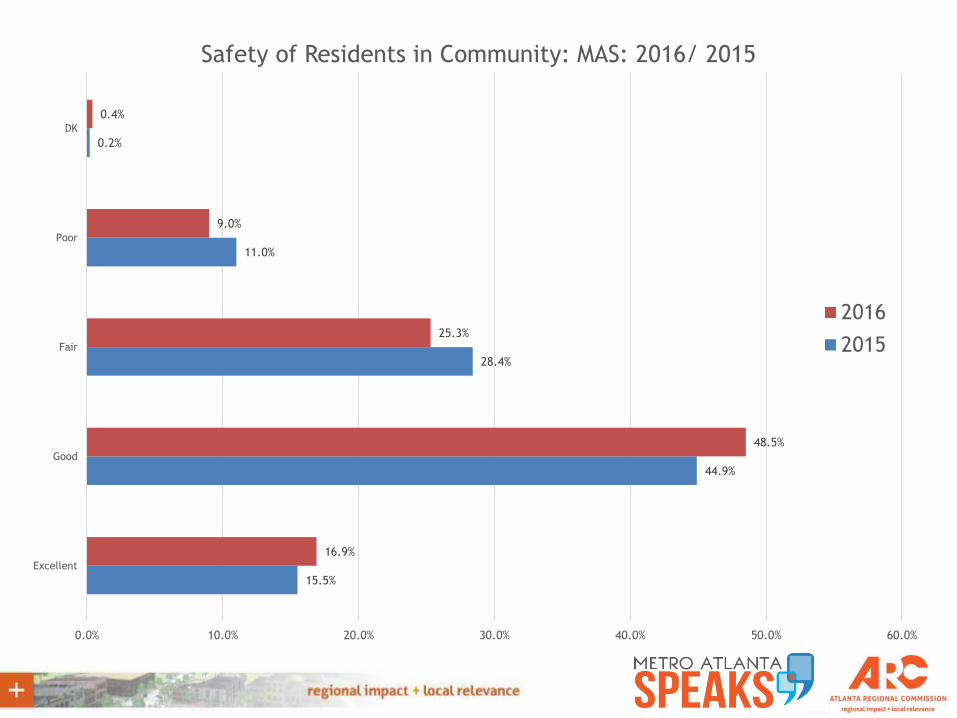
15.5%
44.9%
28.4%
11.0%
0.2%
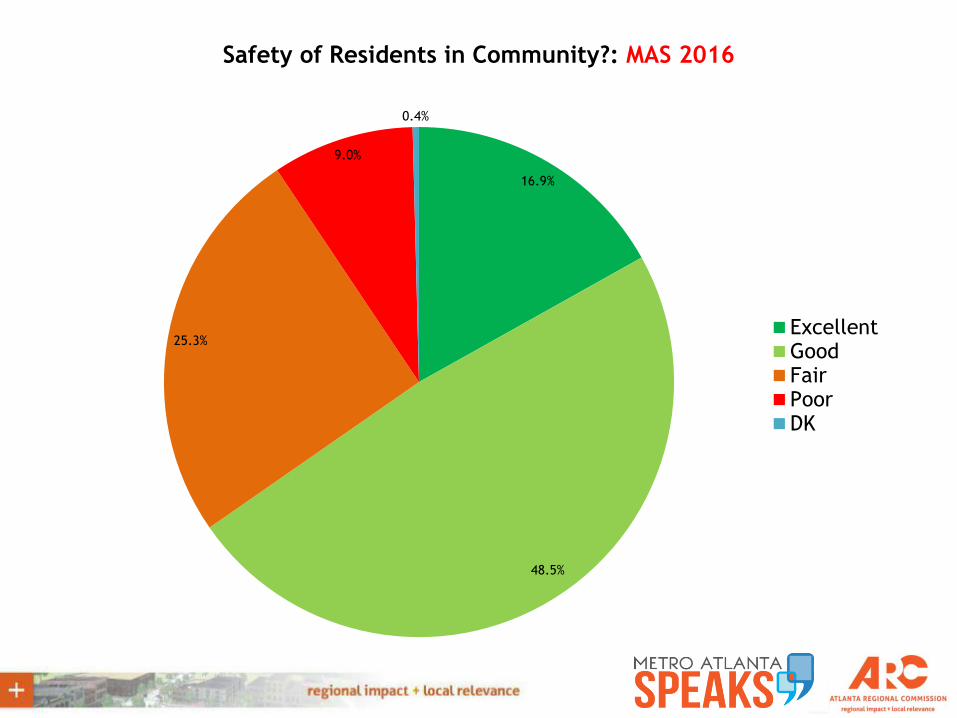
16.9%
48.5%
25.3%
9.0%
0.4%
0.0% 10.0% 20.0% 30.0% 40.0% 50.0% 60.0%
Excellent
Good
Fair
Poor
DK
Safety of Residents in Community: MAS: 2016/ 2015
2016
2015
16.9%
48.5%
25.3%
9.0%
0.4%
Safety of Residents in Community?: MAS 2016
ExcellentGoodFairPoorDK
0.0% 20.0% 40.0% 60.0% 80.0% 100.0% 120.0%
City of Atlanta
DeKalb
Clayton
Fulton
Rockdale
Henry
Douglas
Butts
Gwinnett
Cobb
Coweta
Paulding
Fayette
Cherokee
ARC Region
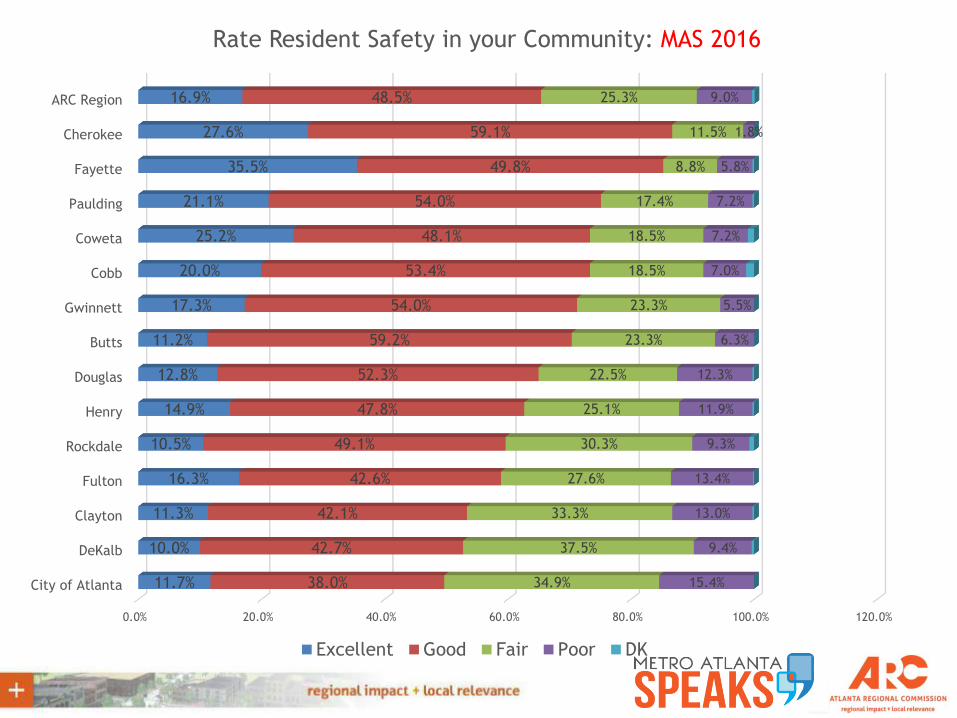
11.7%
10.0%
11.3%
16.3%
10.5%
14.9%
12.8%
11.2%
17.3%
20.0%
25.2%
21.1%
35.5%
27.6%
16.9%
38.0%
42.7%
42.1%
42.6%
49.1%
47.8%
52.3%
59.2%
54.0%
53.4%
48.1%
54.0%
49.8%
59.1%
48.5%
34.9%
37.5%
33.3%
27.6%
30.3%
25.1%
22.5%
23.3%
23.3%
18.5%
18.5%
17.4%
8.8%
11.5%
25.3%
15.4%
9.4%
13.0%
13.4%
9.3%
11.9%
12.3%
6.3%
5.5%
7.0%
7.2%
7.2%
5.8%
1.8%
9.0%
Rate Resident Safety in your Community: MAS 2016
Excellent Good Fair Poor DK
ECONOMY
4%
6%
6%
4%
2%
3%
13%
24%
17%
21%
4%
4%
6%
4%
3%
7%
14%
20%
14%
24%
4%
2%
5%
5%
5%
7%
14%
15%
17%
27%
2%
3%
4%
5%
6%
9%
12%
12%
23%
25%
0% 5% 10% 15% 20% 25% 30%
DK
Other
Taxes
Public Health
Race Relations
Human Services
Public Education
Economy
Crime
Trans
Biggest Problem Facing Residents in Metro--MAS Response Comparison 2016/2015/2014/ 2013
2016
2015
2014
2013
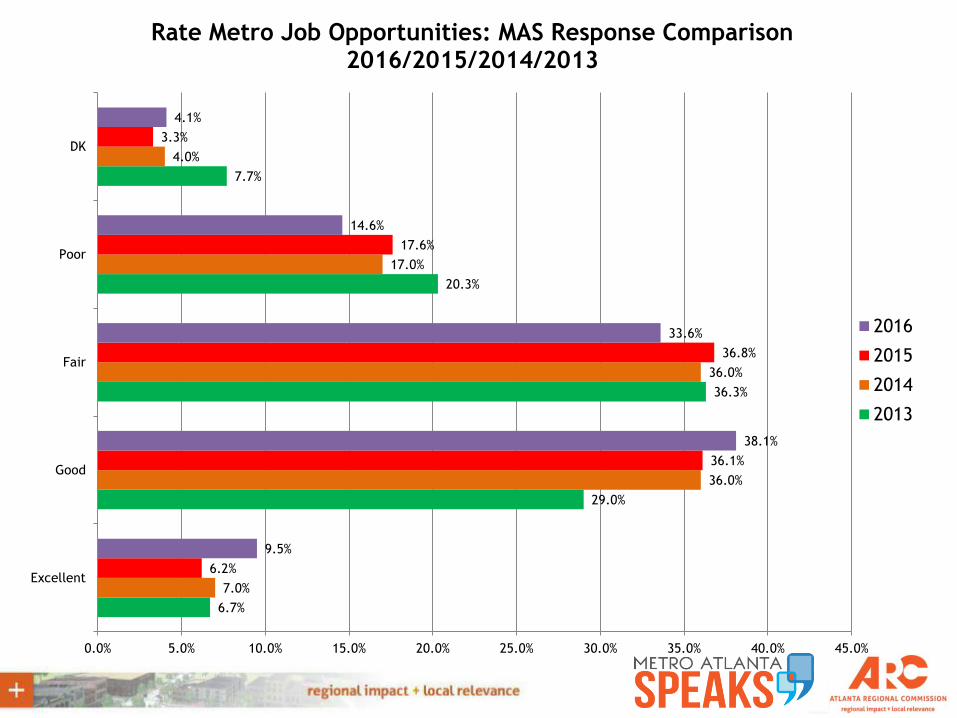
6.7%
29.0%
36.3%
20.3%
7.7%
7.0%
36.0%
36.0%
17.0%
4.0%
6.2%
36.1%
36.8%
17.6%
3.3%
9.5%
38.1%
33.6%
14.6%
4.1%
0.0% 5.0% 10.0% 15.0% 20.0% 25.0% 30.0% 35.0% 40.0% 45.0%
Excellent
Good
Fair
Poor
DK
Rate Metro Job Opportunities: MAS Response Comparison 2016/2015/2014/2013
2016
2015
2014
2013
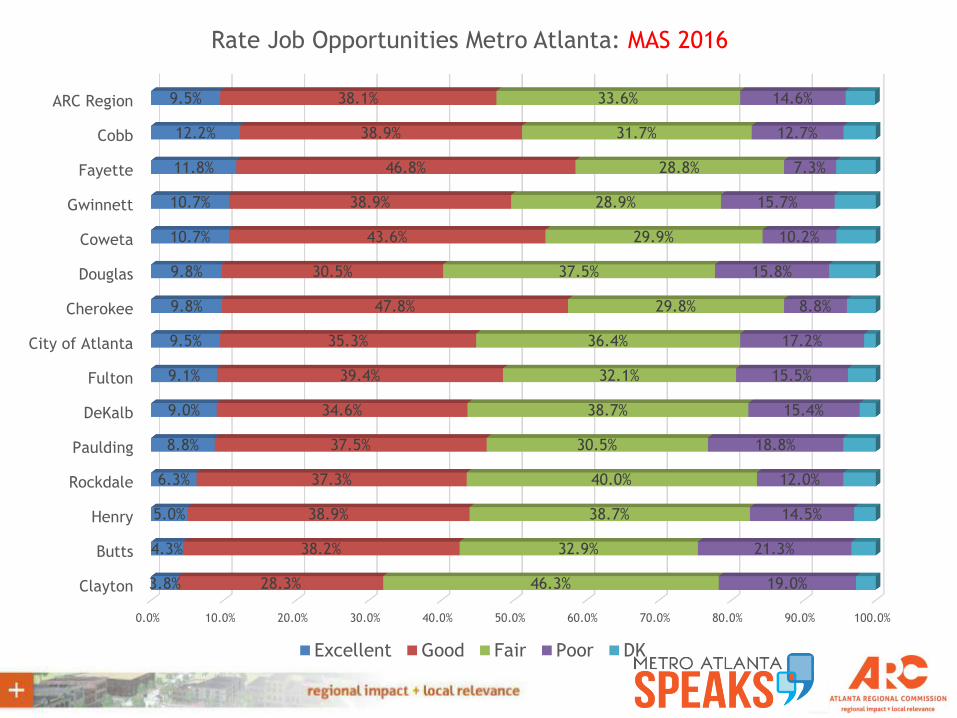
0.0% 10.0% 20.0% 30.0% 40.0% 50.0% 60.0% 70.0% 80.0% 90.0% 100.0%
Clayton
Butts
Henry
Rockdale
Paulding
DeKalb
Fulton
City of Atlanta
Cherokee
Douglas
Coweta
Gwinnett
Fayette
Cobb
ARC Region
3.8%
4.3%
5.0%
6.3%
8.8%
9.0%
9.1%
9.5%
9.8%
9.8%
10.7%
10.7%
11.8%
12.2%
9.5%
28.3%
38.2%
38.9%
37.3%
37.5%
34.6%
39.4%
35.3%
47.8%
30.5%
43.6%
38.9%
46.8%
38.9%
38.1%
46.3%
32.9%
38.7%
40.0%
30.5%
38.7%
32.1%
36.4%
29.8%
37.5%
29.9%
28.9%
28.8%
31.7%
33.6%
19.0%
21.3%
14.5%
12.0%
18.8%
15.4%
15.5%
17.2%
8.8%
15.8%
10.2%
15.7%
7.3%
12.7%
14.6%
Rate Job Opportunities Metro Atlanta: MAS 2016
Excellent Good Fair Poor DK
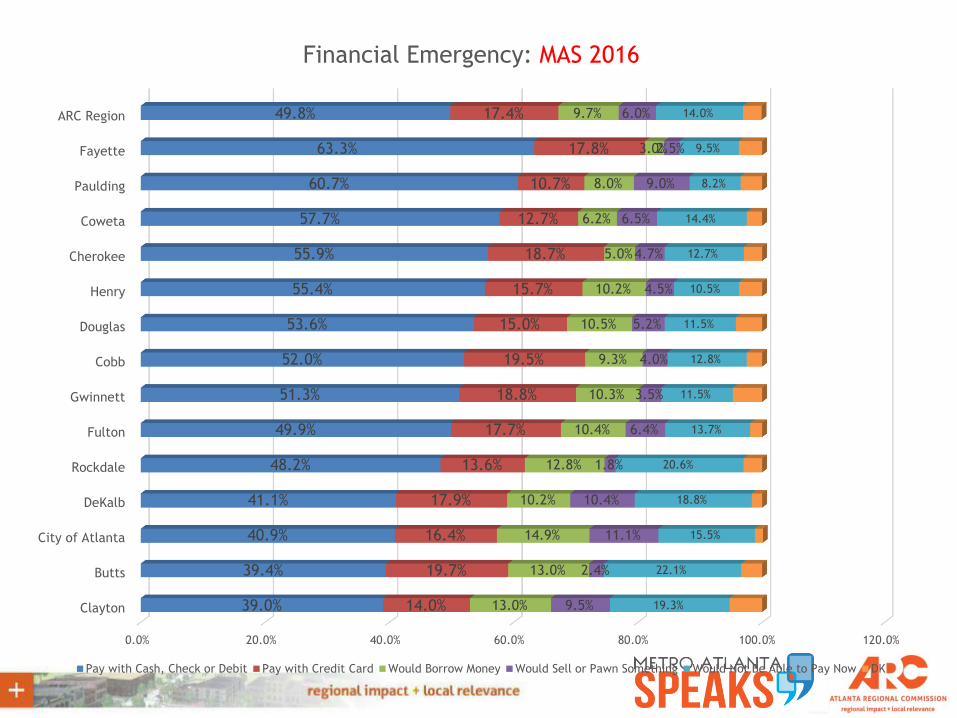
0.0% 20.0% 40.0% 60.0% 80.0% 100.0% 120.0%
Clayton
Butts
City of Atlanta
DeKalb
Rockdale
Fulton
Gwinnett
Cobb
Douglas
Henry
Cherokee
Coweta
Paulding
Fayette
ARC Region
39.0%
39.4%
40.9%
41.1%
48.2%
49.9%
51.3%
52.0%
53.6%
55.4%
55.9%
57.7%
60.7%
63.3%
49.8%
14.0%
19.7%
16.4%
17.9%
13.6%
17.7%
18.8%
19.5%
15.0%
15.7%
18.7%
12.7%
10.7%
17.8%
17.4%
13.0%
13.0%
14.9%
10.2%
12.8%
10.4%
10.3%
9.3%
10.5%
10.2%
5.0%
6.2%
8.0%
3.0%
9.7%
9.5%
2.4%
11.1%
10.4%
1.8%
6.4%
3.5%
4.0%
5.2%
4.5%
4.7%
6.5%
9.0%
2.5%
6.0%
19.3%
22.1%
15.5%
18.8%
20.6%
13.7%
11.5%
12.8%
11.5%
10.5%
12.7%
14.4%
8.2%
9.5%
14.0%
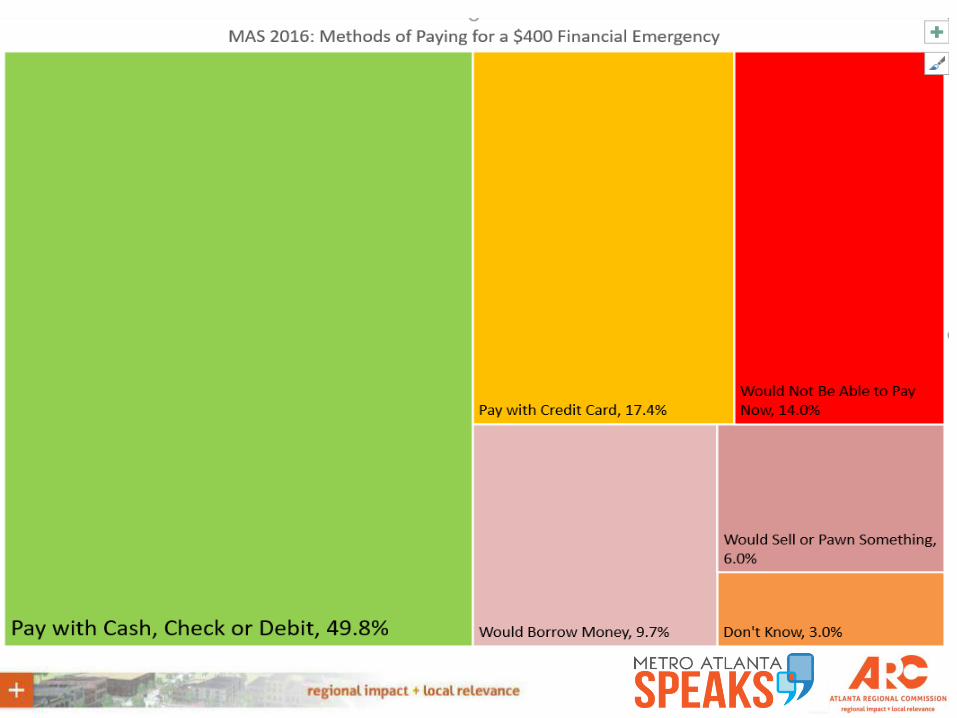
Financial Emergency: MAS 2016
Pay with Cash, Check or Debit Pay with Credit Card Would Borrow Money Would Sell or Pawn Something Would Not Be Able to Pay Now DK
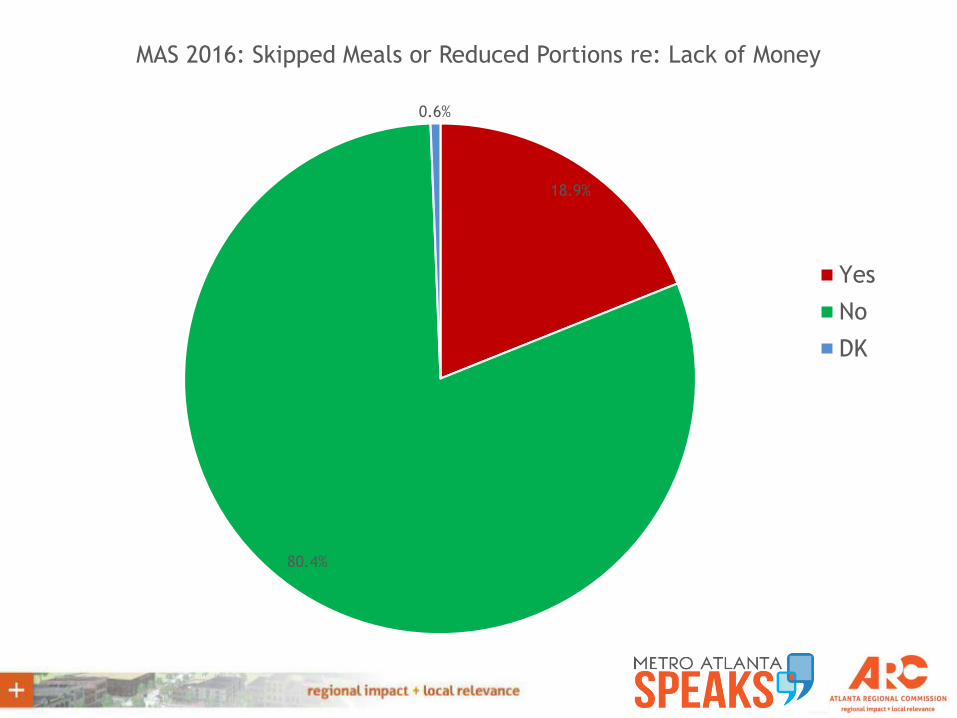
18.9%
80.4%
0.6%
MAS 2016: Skipped Meals or Reduced Portions re: Lack of Money
Yes
No
DK
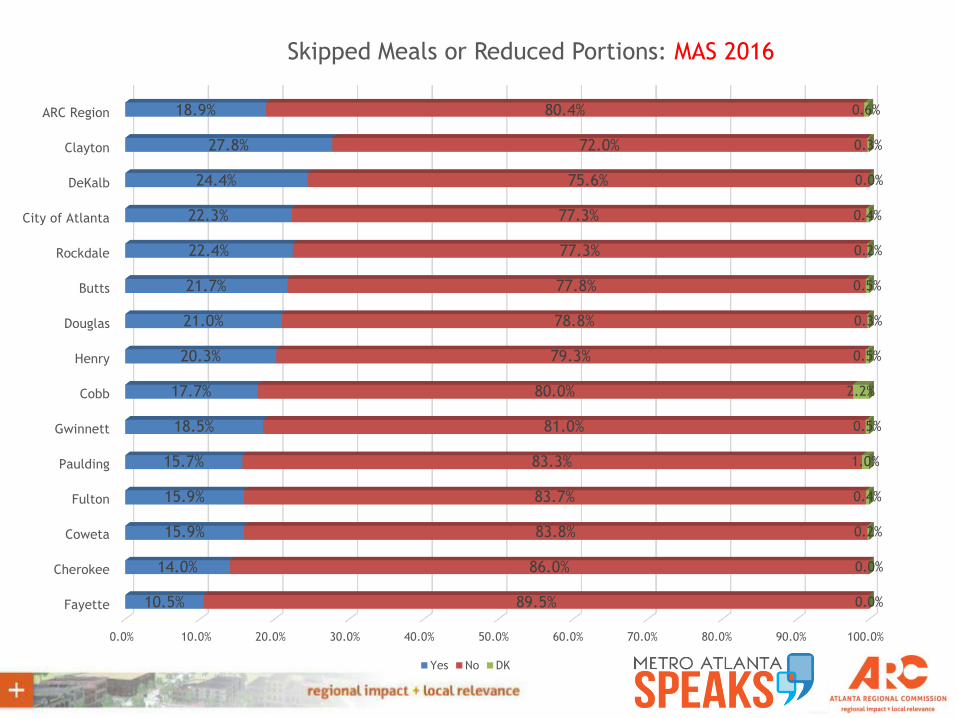
0.0% 10.0% 20.0% 30.0% 40.0% 50.0% 60.0% 70.0% 80.0% 90.0% 100.0%
Fayette
Cherokee
Coweta
Fulton
Paulding
Gwinnett
Cobb
Henry
Douglas
Butts
Rockdale
City of Atlanta
DeKalb
Clayton
ARC Region
10.5%
14.0%
15.9%
15.9%
15.7%
18.5%
17.7%
20.3%
21.0%
21.7%
22.4%
22.3%
24.4%
27.8%
18.9%
89.5%
86.0%
83.8%
83.7%
83.3%
81.0%
80.0%
79.3%
78.8%
77.8%
77.3%
77.3%
75.6%
72.0%
80.4%
0.0%
0.0%
0.2%
0.4%
1.0%
0.5%
2.2%
0.5%
0.3%
0.5%
0.2%
0.4%
0.0%
0.3%
0.6%
Skipped Meals or Reduced Portions: MAS 2016
Yes No DK
QUALITY OF LIFE
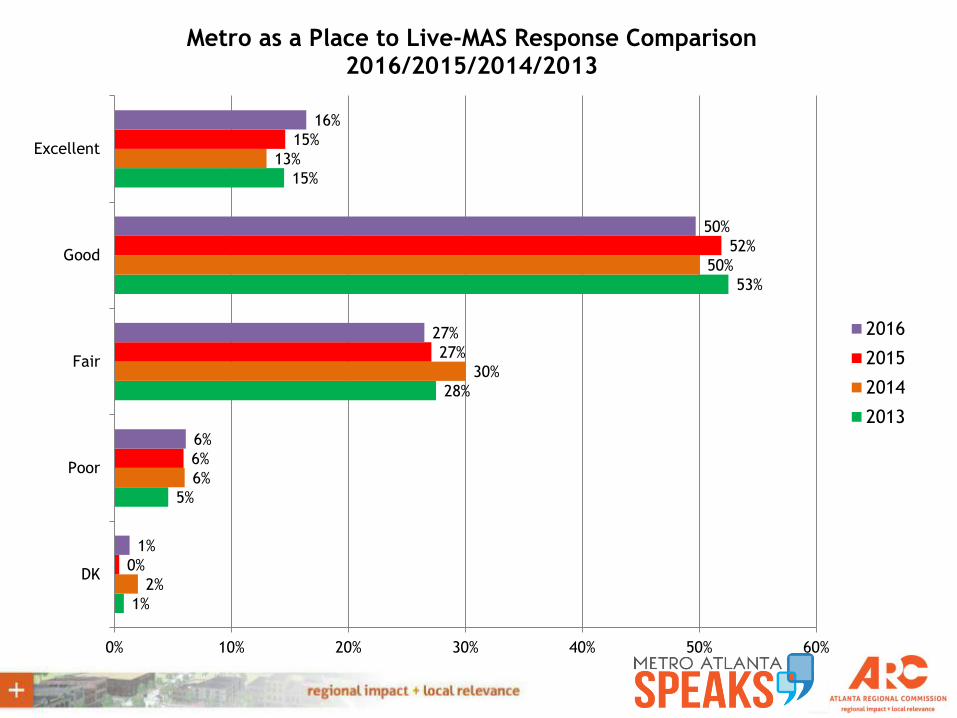
1%
5%
28%
53%
15%
2%
6%
30%
50%
13%
0%
6%
27%
52%
15%
1%
6%
27%
50%
16%
0% 10% 20% 30% 40% 50% 60%
DK
Poor
Fair
Good
Excellent
Metro as a Place to Live-MAS Response Comparison 2016/2015/2014/2013
2016
2015
2014
2013
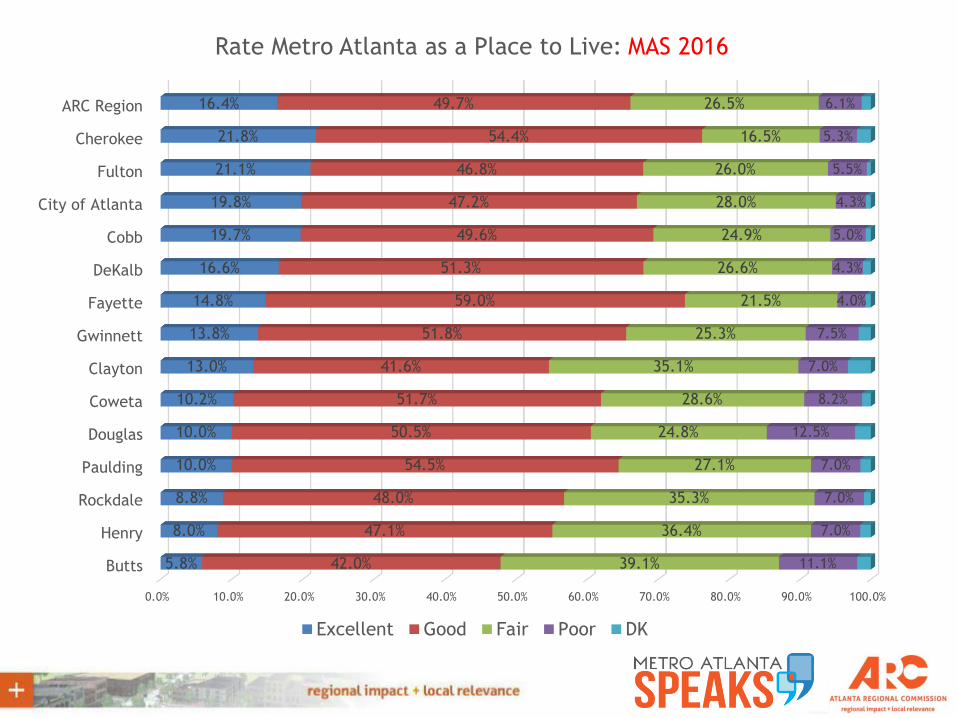
0.0% 10.0% 20.0% 30.0% 40.0% 50.0% 60.0% 70.0% 80.0% 90.0% 100.0%
Butts
Henry
Rockdale
Paulding
Douglas
Coweta
Clayton
Gwinnett
Fayette
DeKalb
Cobb
City of Atlanta
Fulton
Cherokee
ARC Region
5.8%
8.0%
8.8%
10.0%
10.0%
10.2%
13.0%
13.8%
14.8%
16.6%
19.7%
19.8%
21.1%
21.8%
16.4%
42.0%
47.1%
48.0%
54.5%
50.5%
51.7%
41.6%
51.8%
59.0%
51.3%
49.6%
47.2%
46.8%
54.4%
49.7%
39.1%
36.4%
35.3%
27.1%
24.8%
28.6%
35.1%
25.3%
21.5%
26.6%
24.9%
28.0%
26.0%
16.5%
26.5%
11.1%
7.0%
7.0%
7.0%
12.5%
8.2%
7.0%
7.5%
4.0%
4.3%
5.0%
4.3%
5.5%
5.3%
6.1%
Rate Metro Atlanta as a Place to Live: MAS 2016
Excellent Good Fair Poor DK
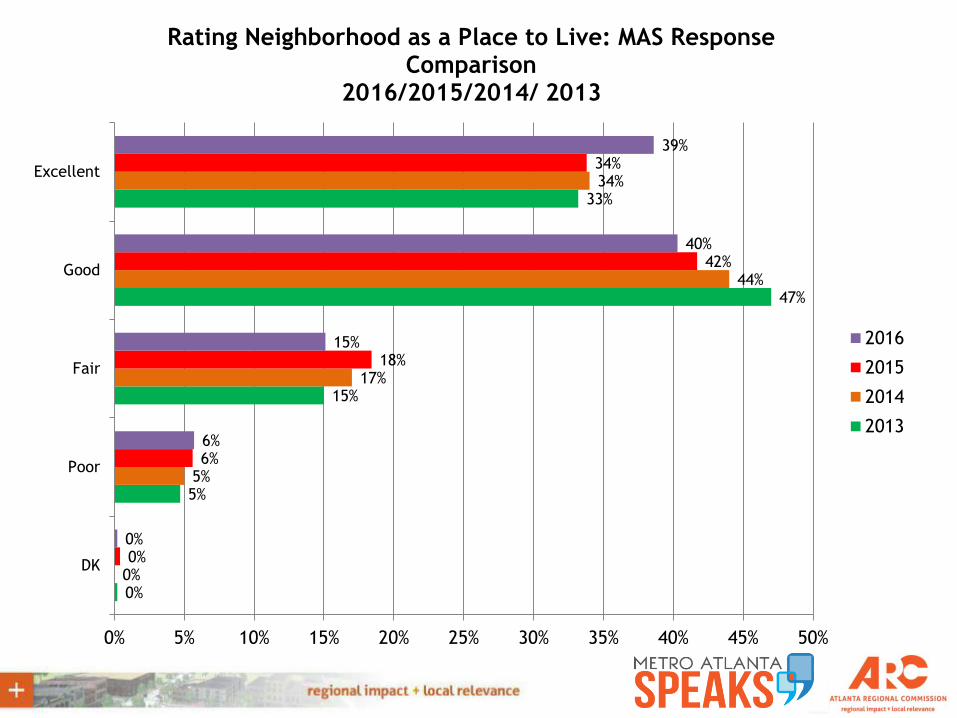
0%
5%
15%
47%
33%
0%
5%
17%
44%
34%
0%
6%
18%
42%
34%
0%
6%
15%
40%
39%
0% 5% 10% 15% 20% 25% 30% 35% 40% 45% 50%
DK
Poor
Fair
Good
Excellent
Rating Neighborhood as a Place to Live: MAS Response Comparison
2016/2015/2014/ 2013
2016
2015
2014
2013
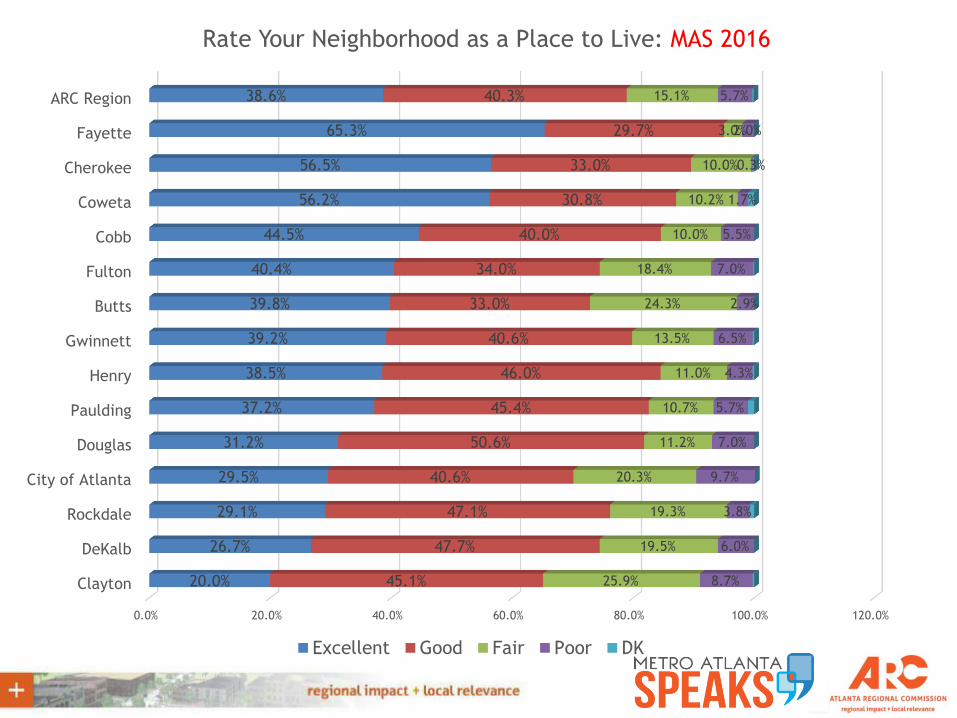
0.0% 20.0% 40.0% 60.0% 80.0% 100.0% 120.0%
Clayton
DeKalb
Rockdale
City of Atlanta
Douglas
Paulding
Henry
Gwinnett
Butts
Fulton
Cobb
Coweta
Cherokee
Fayette
ARC Region
20.0%
26.7%
29.1%
29.5%
31.2%
37.2%
38.5%
39.2%
39.8%
40.4%
44.5%
56.2%
56.5%
65.3%
38.6%
45.1%
47.7%
47.1%
40.6%
50.6%
45.4%
46.0%
40.6%
33.0%
34.0%
40.0%
30.8%
33.0%
29.7%
40.3%
25.9%
19.5%
19.3%
20.3%
11.2%
10.7%
11.0%
13.5%
24.3%
18.4%
10.0%
10.2%
10.0%
3.0%
15.1%
8.7%
6.0%
3.8%
9.7%
7.0%
5.7%
4.3%
6.5%
2.9%
7.0%
5.5%
1.7%
0.3%
2.0%
5.7%
Rate Your Neighborhood as a Place to Live: MAS 2016
Excellent Good Fair Poor DK
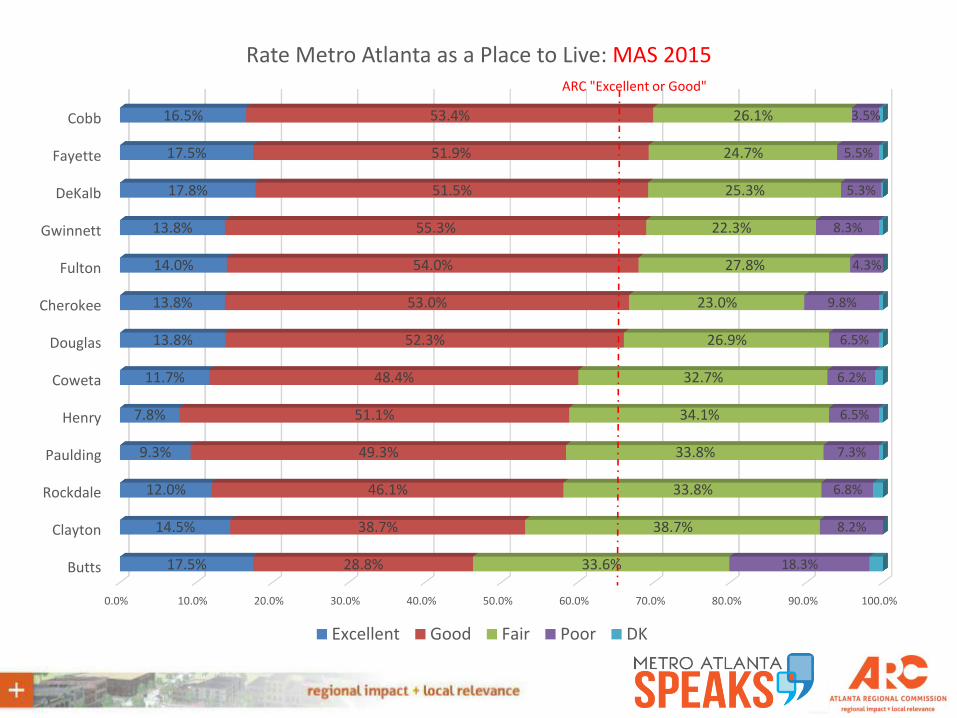
0.0% 10.0% 20.0% 30.0% 40.0% 50.0% 60.0% 70.0% 80.0% 90.0% 100.0%
Butts
Clayton
Rockdale
Paulding
Henry
Coweta
Douglas
Cherokee
Fulton
Gwinnett
DeKalb
Fayette
Cobb
17.5%
14.5%
12.0%
9.3%
7.8%
11.7%
13.8%
13.8%
14.0%
13.8%
17.8%
17.5%
16.5%
28.8%
38.7%
46.1%
49.3%
51.1%
48.4%
52.3%
53.0%
54.0%
55.3%
51.5%
51.9%
53.4%
33.6%
38.7%
33.8%
33.8%
34.1%
32.7%
26.9%
23.0%
27.8%
22.3%
25.3%
24.7%
26.1%
18.3%
8.2%
6.8%
7.3%
6.5%
6.2%
6.5%
9.8%
4.3%
8.3%
5.3%
5.5%
3.5%
Rate Metro Atlanta as a Place to Live: MAS 2015
Excellent Good Fair Poor DK
ARC "Excellent or Good"
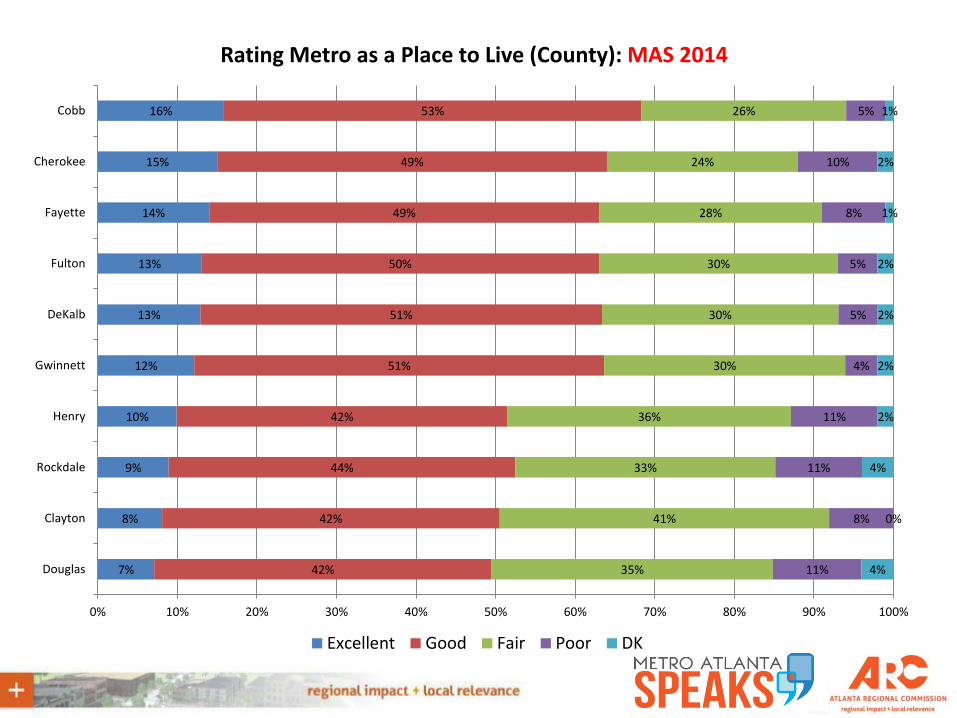
7%
8%
9%
10%
12%
13%
13%
14%
15%
16%
42%
42%
44%
42%
51%
51%
50%
49%
49%
53%
35%
41%
33%
36%
30%
30%
30%
28%
24%
26%
11%
8%
11%
11%
4%
5%
5%
8%
10%
5%
4%
0%
4%
2%
2%
2%
2%
1%
2%
1%
0% 10% 20% 30% 40% 50% 60% 70% 80% 90% 100%
Douglas
Clayton
Rockdale
Henry
Gwinnett
DeKalb
Fulton
Fayette
Cherokee
Cobb
Rating Metro as a Place to Live (County): MAS 2014
Excellent Good Fair Poor DK
THE FUTURE?
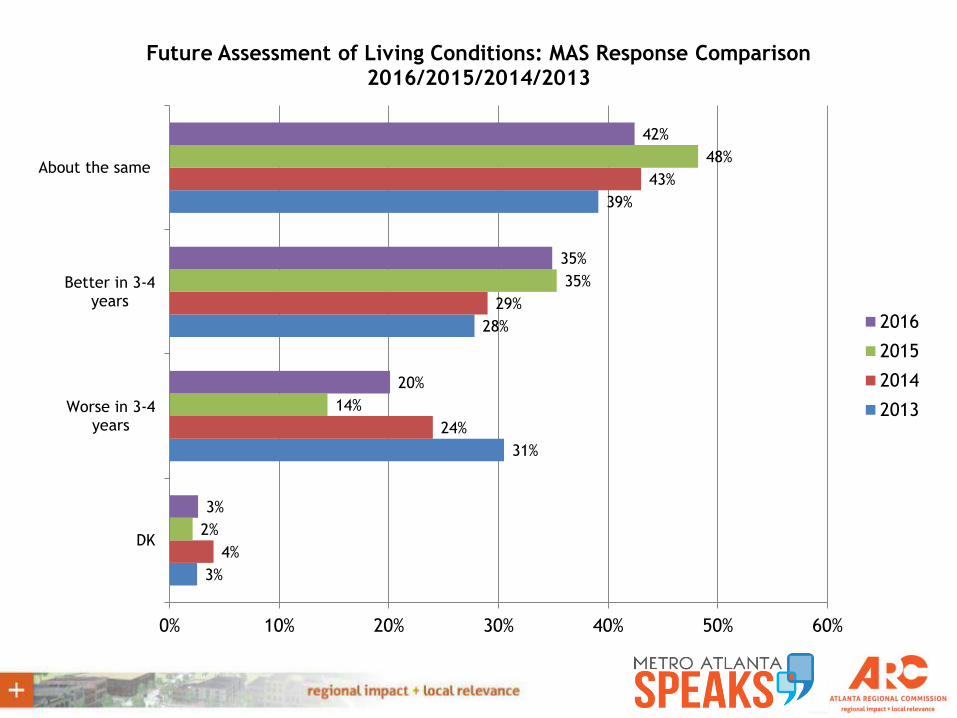
3%
31%
28%
39%
4%
24%
29%
43%
2%
14%
35%
48%
3%
20%
35%
42%
0% 10% 20% 30% 40% 50% 60%
DK
Worse in 3-4years
Better in 3-4years
About the same
Future Assessment of Living Conditions: MAS Response Comparison 2016/2015/2014/2013
2016
2015
2014
2013
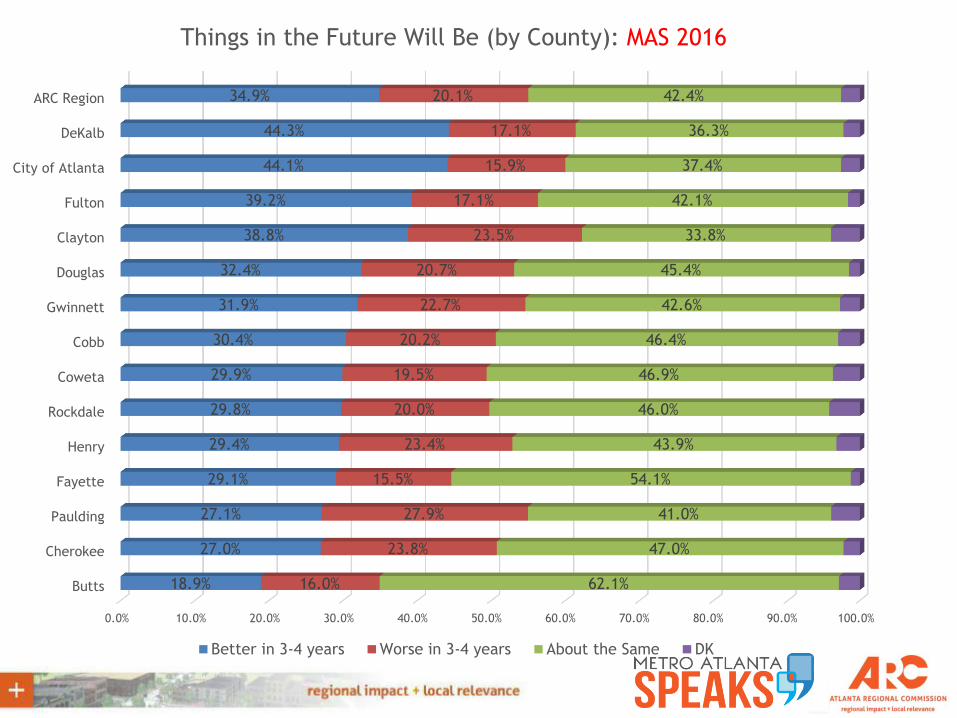
0.0% 10.0% 20.0% 30.0% 40.0% 50.0% 60.0% 70.0% 80.0% 90.0% 100.0%
Butts
Cherokee
Paulding
Fayette
Henry
Rockdale
Coweta
Cobb
Gwinnett
Douglas
Clayton
Fulton
City of Atlanta
DeKalb
ARC Region
18.9%
27.0%
27.1%
29.1%
29.4%
29.8%
29.9%
30.4%
31.9%
32.4%
38.8%
39.2%
44.1%
44.3%
34.9%
16.0%
23.8%
27.9%
15.5%
23.4%
20.0%
19.5%
20.2%
22.7%
20.7%
23.5%
17.1%
15.9%
17.1%
20.1%
62.1%
47.0%
41.0%
54.1%
43.9%
46.0%
46.9%
46.4%
42.6%
45.4%
33.8%
42.1%
37.4%
36.3%
42.4%
Things in the Future Will Be (by County): MAS 2016
Better in 3-4 years Worse in 3-4 years About the Same DK
EDUCATION
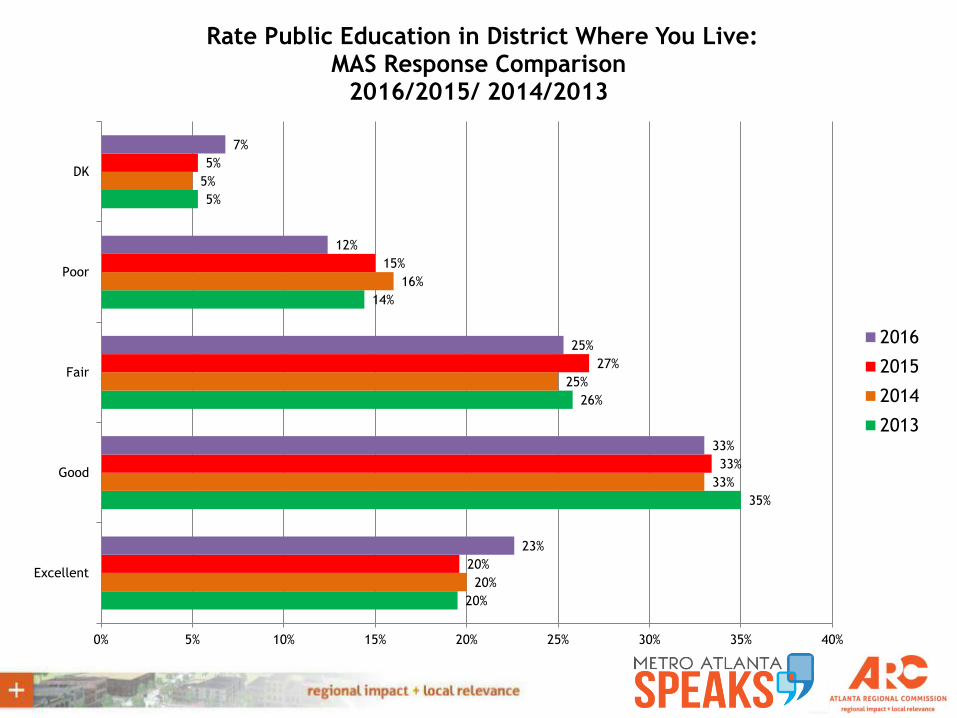
20%
35%
26%
14%
5%
20%
33%
25%
16%
5%
20%
33%
27%
15%
5%
23%
33%
25%
12%
7%
0% 5% 10% 15% 20% 25% 30% 35% 40%
Excellent
Good
Fair
Poor
DK
Rate Public Education in District Where You Live: MAS Response Comparison
2016/2015/ 2014/2013
2016
2015
2014
2013
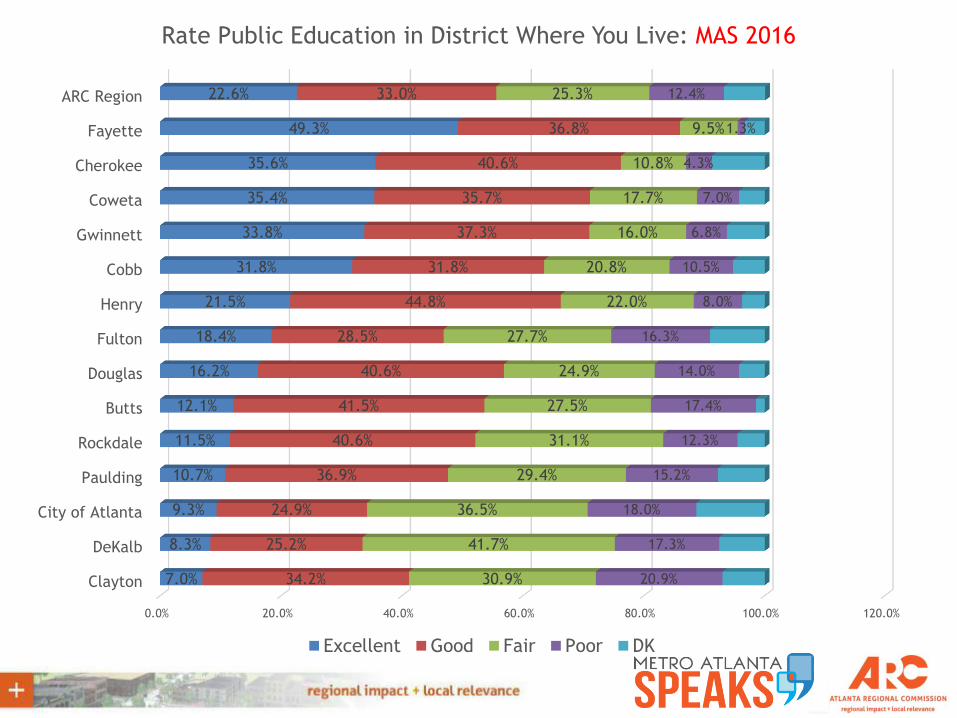
0.0% 20.0% 40.0% 60.0% 80.0% 100.0% 120.0%
Clayton
DeKalb
City of Atlanta
Paulding
Rockdale
Butts
Douglas
Fulton
Henry
Cobb
Gwinnett
Coweta
Cherokee
Fayette
ARC Region
7.0%
8.3%
9.3%
10.7%
11.5%
12.1%
16.2%
18.4%
21.5%
31.8%
33.8%
35.4%
35.6%
49.3%
22.6%
34.2%
25.2%
24.9%
36.9%
40.6%
41.5%
40.6%
28.5%
44.8%
31.8%
37.3%
35.7%
40.6%
36.8%
33.0%
30.9%
41.7%
36.5%
29.4%
31.1%
27.5%
24.9%
27.7%
22.0%
20.8%
16.0%
17.7%
10.8%
9.5%
25.3%
20.9%
17.3%
18.0%
15.2%
12.3%
17.4%
14.0%
16.3%
8.0%
10.5%
6.8%
7.0%
4.3%
1.3%
12.4%
Rate Public Education in District Where You Live: MAS 2016
Excellent Good Fair Poor DK
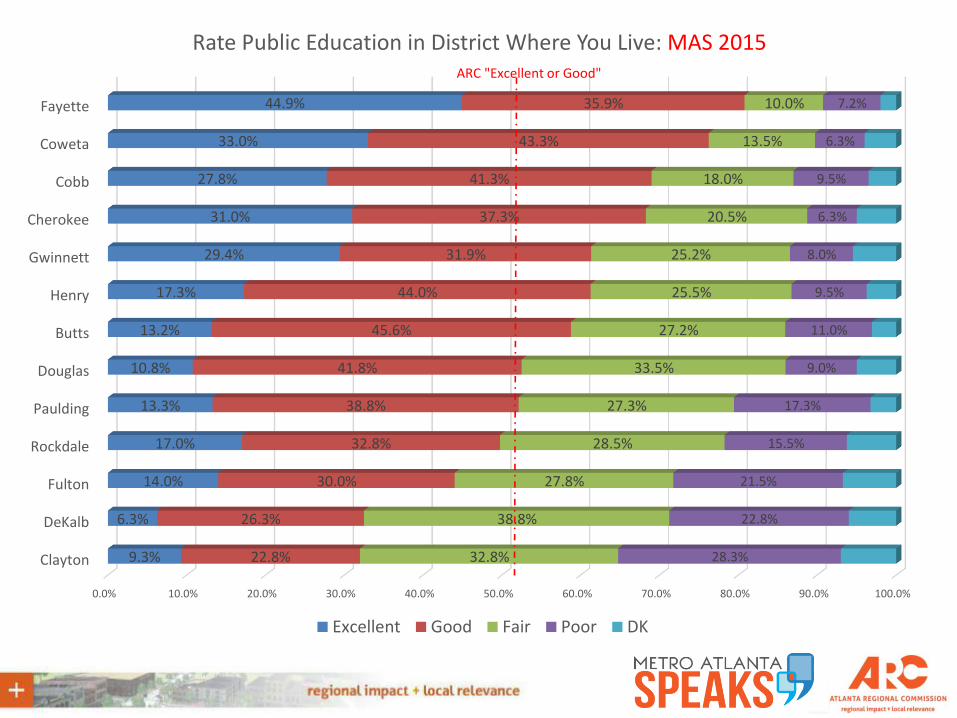
0.0% 10.0% 20.0% 30.0% 40.0% 50.0% 60.0% 70.0% 80.0% 90.0% 100.0%
Clayton
DeKalb
Fulton
Rockdale
Paulding
Douglas
Butts
Henry
Gwinnett
Cherokee
Cobb
Coweta
Fayette
9.3%
6.3%
14.0%
17.0%
13.3%
10.8%
13.2%
17.3%
29.4%
31.0%
27.8%
33.0%
44.9%
22.8%
26.3%
30.0%
32.8%
38.8%
41.8%
45.6%
44.0%
31.9%
37.3%
41.3%
43.3%
35.9%
32.8%
38.8%
27.8%
28.5%
27.3%
33.5%
27.2%
25.5%
25.2%
20.5%
18.0%
13.5%
10.0%
28.3%
22.8%
21.5%
15.5%
17.3%
9.0%
11.0%
9.5%
8.0%
6.3%
9.5%
6.3%
7.2%
Rate Public Education in District Where You Live: MAS 2015
Excellent Good Fair Poor DK
ARC "Excellent or Good"
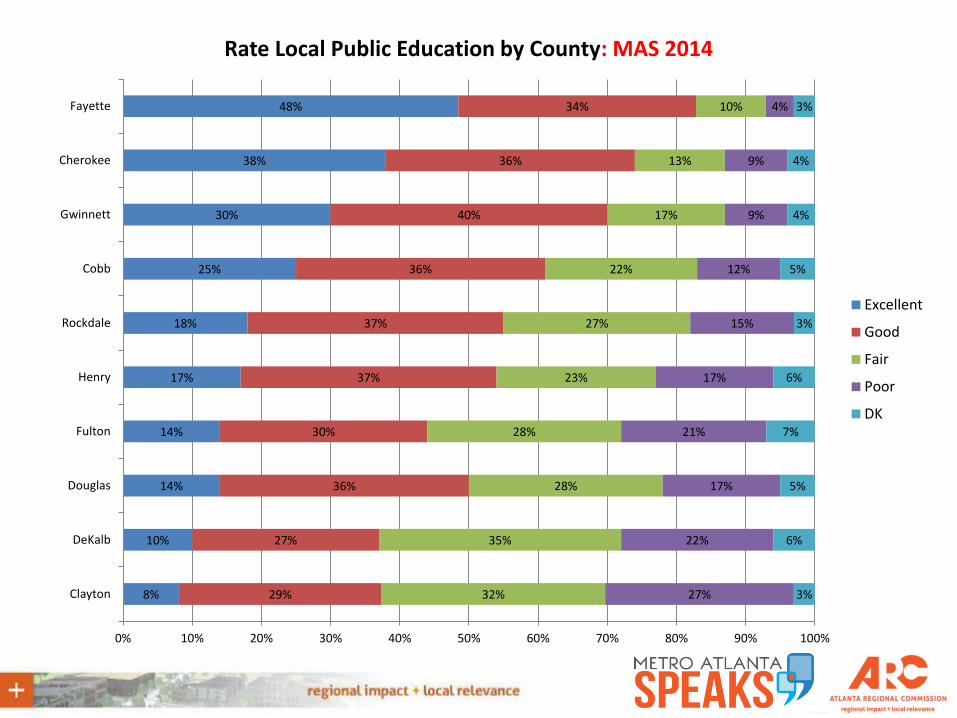
8%
10%
14%
14%
17%
18%
25%
30%
38%
48%
29%
27%
36%
30%
37%
37%
36%
40%
36%
34%
32%
35%
28%
28%
23%
27%
22%
17%
13%
10%
27%
22%
17%
21%
17%
15%
12%
9%
9%
4%
3%
6%
5%
7%
6%
3%
5%
4%
4%
3%
0% 10% 20% 30% 40% 50% 60% 70% 80% 90% 100%
Clayton
DeKalb
Douglas
Fulton
Henry
Rockdale
Cobb
Gwinnett
Cherokee
Fayette
Rate Local Public Education by County: MAS 2014
Excellent
Good
Fair
Poor
DK
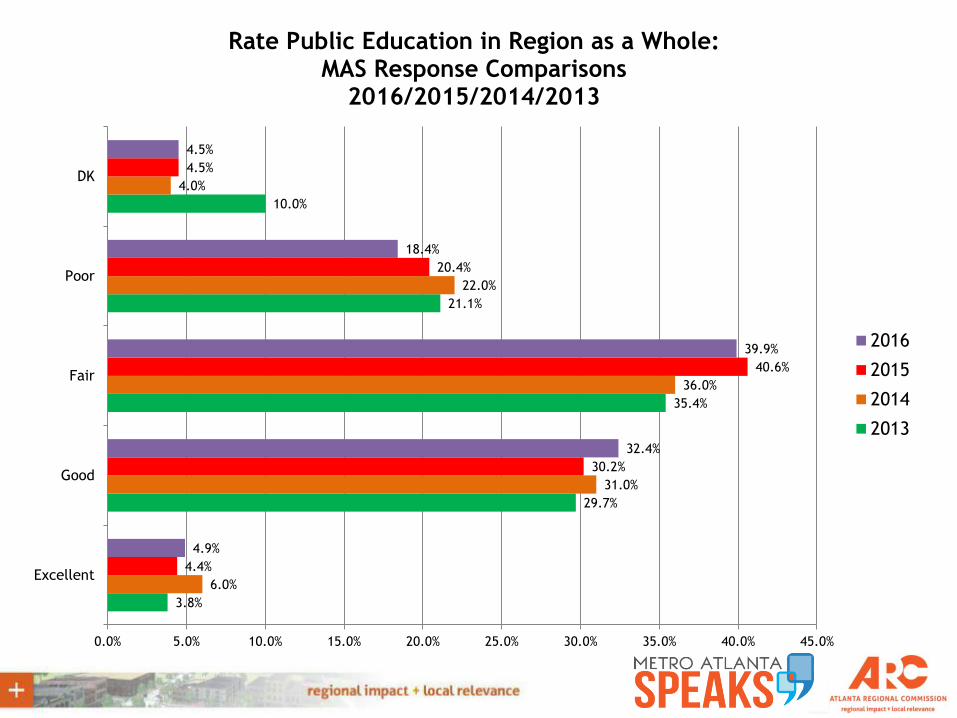
3.8%
29.7%
35.4%
21.1%
10.0%
6.0%
31.0%
36.0%
22.0%
4.0%
4.4%
30.2%
40.6%
20.4%
4.5%
4.9%
32.4%
39.9%
18.4%
4.5%
0.0% 5.0% 10.0% 15.0% 20.0% 25.0% 30.0% 35.0% 40.0% 45.0%
Excellent
Good
Fair
Poor
DK
Rate Public Education in Region as a Whole: MAS Response Comparisons
2016/2015/2014/2013
2016
2015
2014
2013
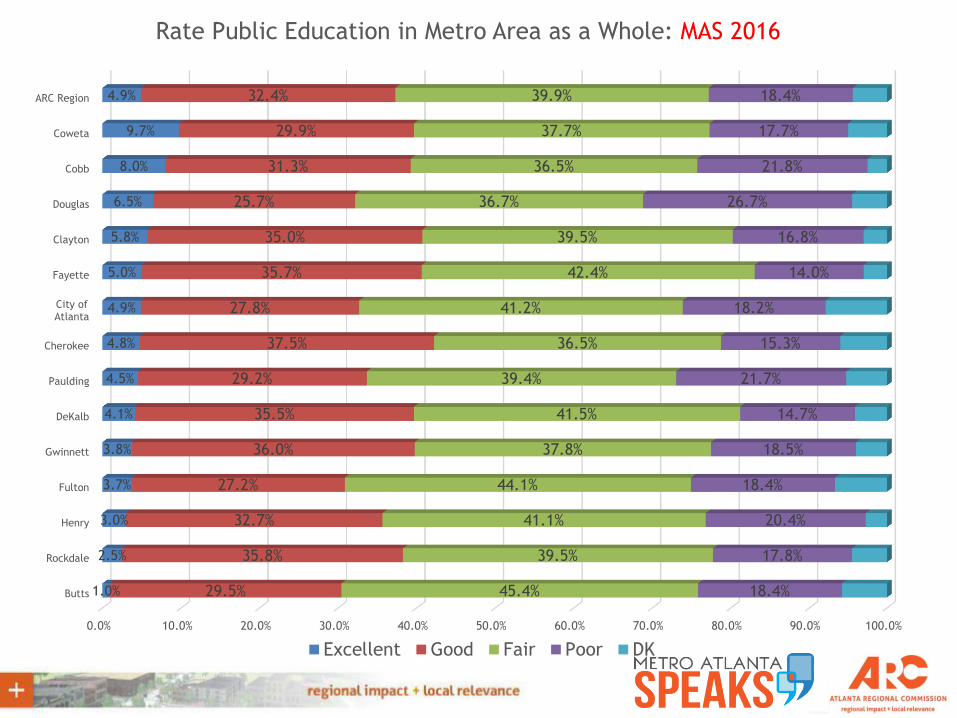
0.0% 10.0% 20.0% 30.0% 40.0% 50.0% 60.0% 70.0% 80.0% 90.0% 100.0%
Butts
Rockdale
Henry
Fulton
Gwinnett
DeKalb
Paulding
Cherokee
City ofAtlanta
Fayette
Clayton
Douglas
Cobb
Coweta
ARC Region
1.0%
2.5%
3.0%
3.7%
3.8%
4.1%
4.5%
4.8%
4.9%
5.0%
5.8%
6.5%
8.0%
9.7%
4.9%
29.5%
35.8%
32.7%
27.2%
36.0%
35.5%
29.2%
37.5%
27.8%
35.7%
35.0%
25.7%
31.3%
29.9%
32.4%
45.4%
39.5%
41.1%
44.1%
37.8%
41.5%
39.4%
36.5%
41.2%
42.4%
39.5%
36.7%
36.5%
37.7%
39.9%
18.4%
17.8%
20.4%
18.4%
18.5%
14.7%
21.7%
15.3%
18.2%
14.0%
16.8%
26.7%
21.8%
17.7%
18.4%
Rate Public Education in Metro Area as a Whole: MAS 2016
Excellent Good Fair Poor DK
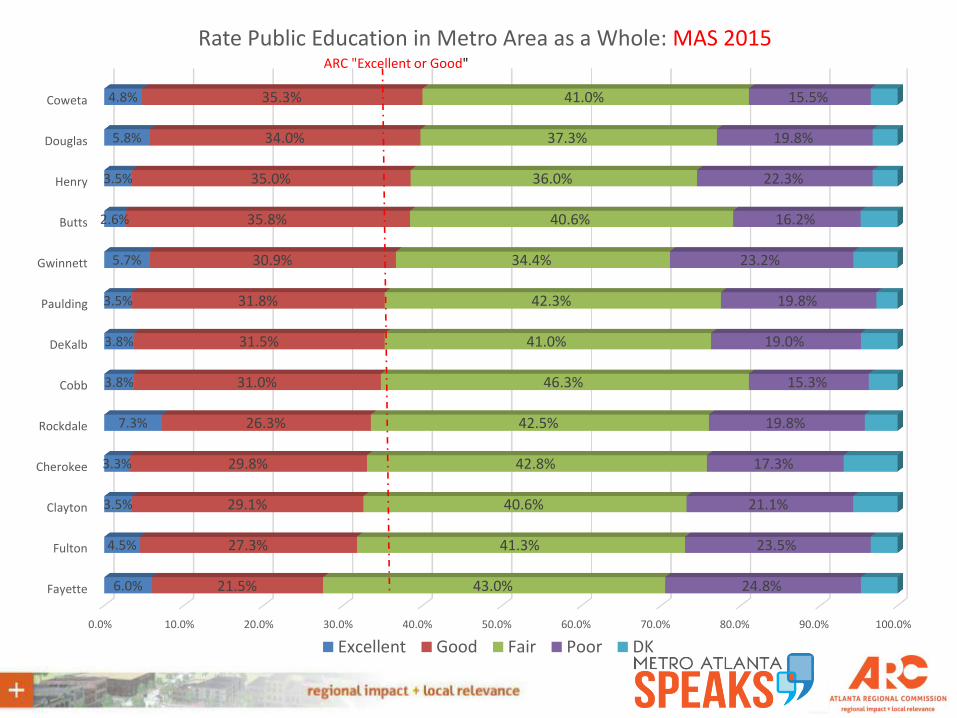
0.0% 10.0% 20.0% 30.0% 40.0% 50.0% 60.0% 70.0% 80.0% 90.0% 100.0%
Fayette
Fulton
Clayton
Cherokee
Rockdale
Cobb
DeKalb
Paulding
Gwinnett
Butts
Henry
Douglas
Coweta
6.0%
4.5%
3.5%
3.3%
7.3%
3.8%
3.8%
3.5%
5.7%
2.6%
3.5%
5.8%
4.8%
21.5%
27.3%
29.1%
29.8%
26.3%
31.0%
31.5%
31.8%
30.9%
35.8%
35.0%
34.0%
35.3%
43.0%
41.3%
40.6%
42.8%
42.5%
46.3%
41.0%
42.3%
34.4%
40.6%
36.0%
37.3%
41.0%
24.8%
23.5%
21.1%
17.3%
19.8%
15.3%
19.0%
19.8%
23.2%
16.2%
22.3%
19.8%
15.5%
Rate Public Education in Metro Area as a Whole: MAS 2015
Excellent Good Fair Poor DK
ARC "Excellent or Good"
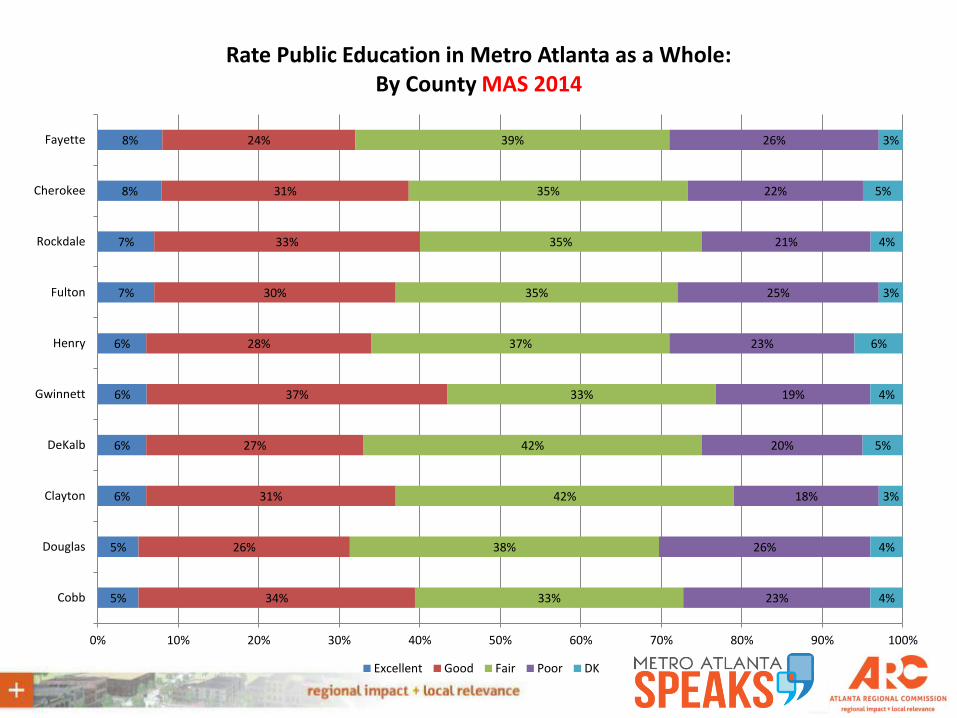
5%
5%
6%
6%
6%
6%
7%
7%
8%
8%
34%
26%
31%
27%
37%
28%
30%
33%
31%
24%
33%
38%
42%
42%
33%
37%
35%
35%
35%
39%
23%
26%
18%
20%
19%
23%
25%
21%
22%
26%
4%
4%
3%
5%
4%
6%
3%
4%
5%
3%
0% 10% 20% 30% 40% 50% 60% 70% 80% 90% 100%
Cobb
Douglas
Clayton
DeKalb
Gwinnett
Henry
Fulton
Rockdale
Cherokee
Fayette
Rate Public Education in Metro Atlanta as a Whole: By County MAS 2014
Excellent Good Fair Poor DK
CIVIC ENGAGEMENT
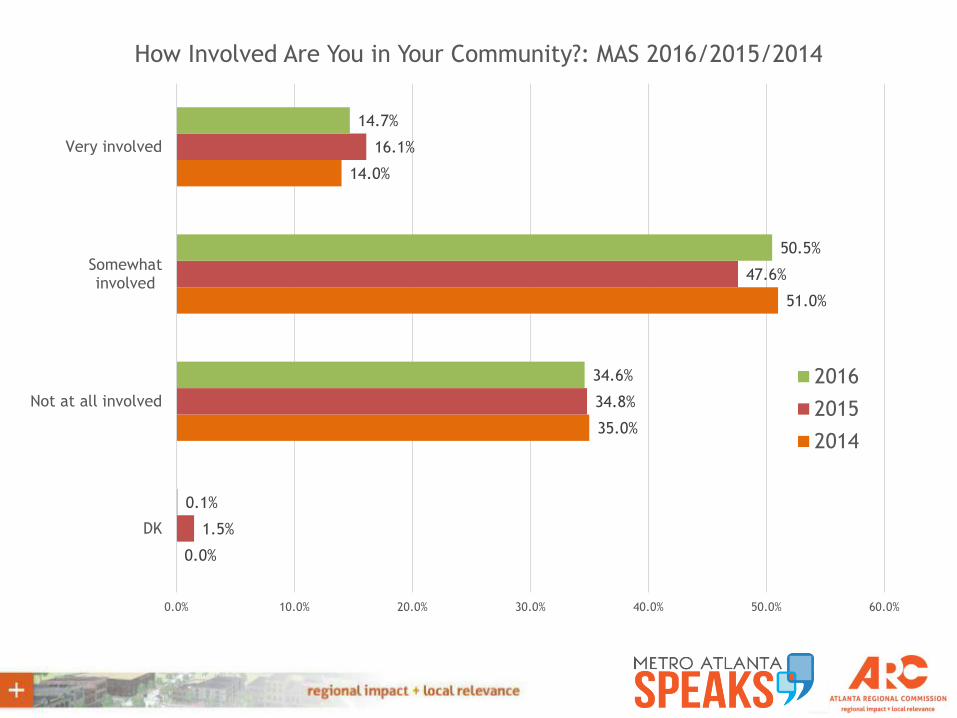
0.0%
35.0%
51.0%
14.0%
1.5%
34.8%
47.6%
16.1%
0.1%
34.6%
50.5%
14.7%
0.0% 10.0% 20.0% 30.0% 40.0% 50.0% 60.0%
DK
Not at all involved
Somewhatinvolved
Very involved
How Involved Are You in Your Community?: MAS 2016/2015/2014
2016
2015
2014
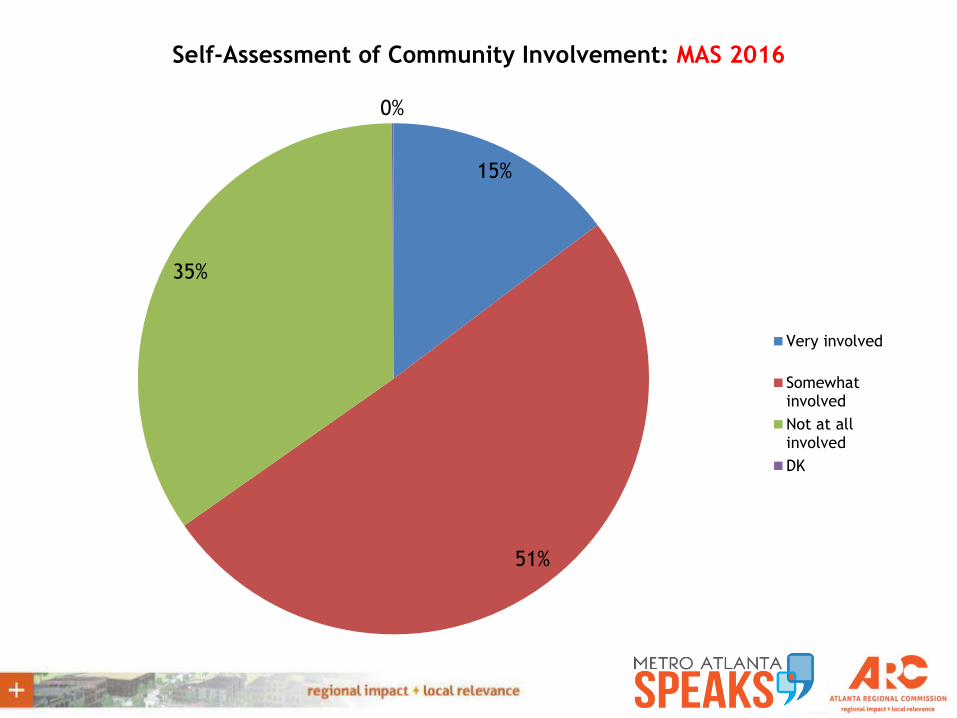
15%
51%
35%
0%
Self-Assessment of Community Involvement: MAS 2016
Very involved
Somewhatinvolved
Not at allinvolved
DK
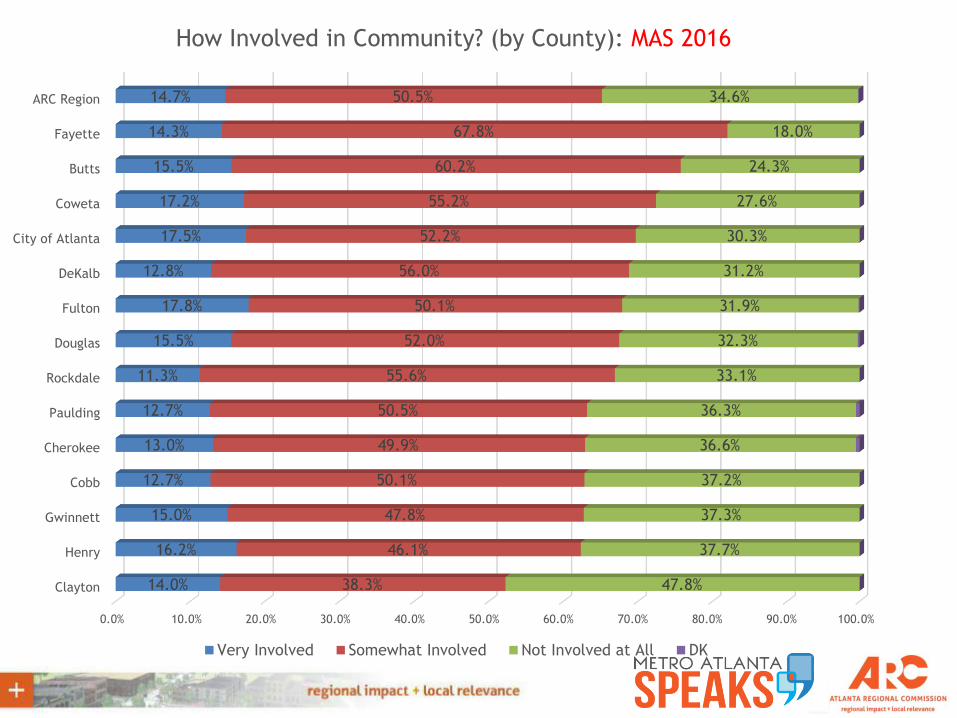
0.0% 10.0% 20.0% 30.0% 40.0% 50.0% 60.0% 70.0% 80.0% 90.0% 100.0%
Clayton
Henry
Gwinnett
Cobb
Cherokee
Paulding
Rockdale
Douglas
Fulton
DeKalb
City of Atlanta
Coweta
Butts
Fayette
ARC Region
14.0%
16.2%
15.0%
12.7%
13.0%
12.7%
11.3%
15.5%
17.8%
12.8%
17.5%
17.2%
15.5%
14.3%
14.7%
38.3%
46.1%
47.8%
50.1%
49.9%
50.5%
55.6%
52.0%
50.1%
56.0%
52.2%
55.2%
60.2%
67.8%
50.5%
47.8%
37.7%
37.3%
37.2%
36.6%
36.3%
33.1%
32.3%
31.9%
31.2%
30.3%
27.6%
24.3%
18.0%
34.6%
How Involved in Community? (by County): MAS 2016
Very Involved Somewhat Involved Not Involved at All DK
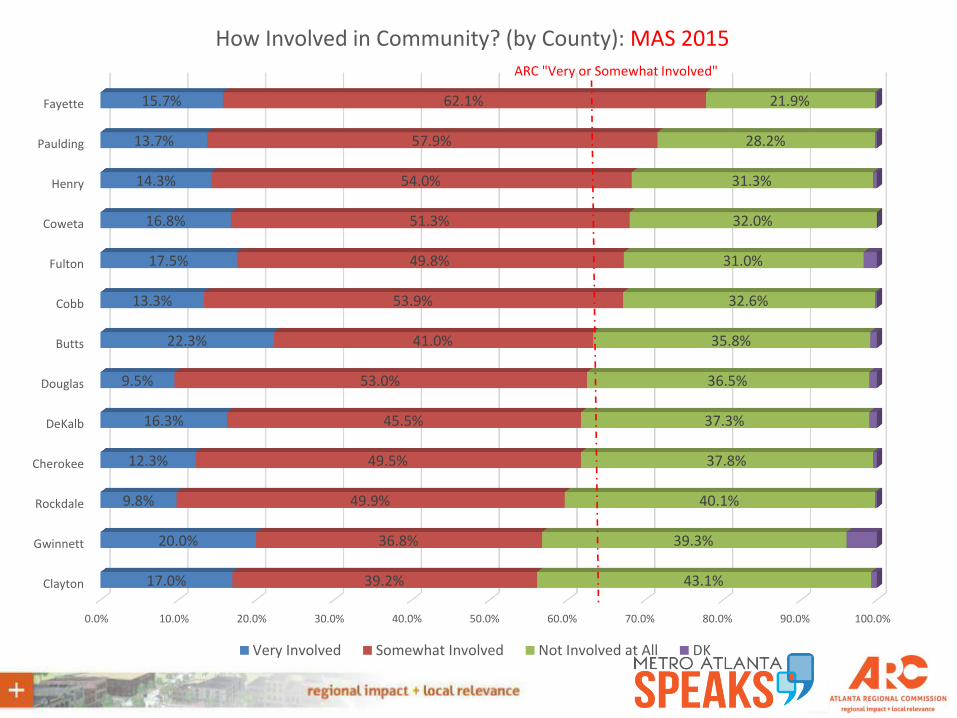
0.0% 10.0% 20.0% 30.0% 40.0% 50.0% 60.0% 70.0% 80.0% 90.0% 100.0%
Clayton
Gwinnett
Rockdale
Cherokee
DeKalb
Douglas
Butts
Cobb
Fulton
Coweta
Henry
Paulding
Fayette
17.0%
20.0%
9.8%
12.3%
16.3%
9.5%
22.3%
13.3%
17.5%
16.8%
14.3%
13.7%
15.7%
39.2%
36.8%
49.9%
49.5%
45.5%
53.0%
41.0%
53.9%
49.8%
51.3%
54.0%
57.9%
62.1%
43.1%
39.3%
40.1%
37.8%
37.3%
36.5%
35.8%
32.6%
31.0%
32.0%
31.3%
28.2%
21.9%
How Involved in Community? (by County): MAS 2015
Very Involved Somewhat Involved Not Involved at All DK
ARC "Very or Somewhat Involved"
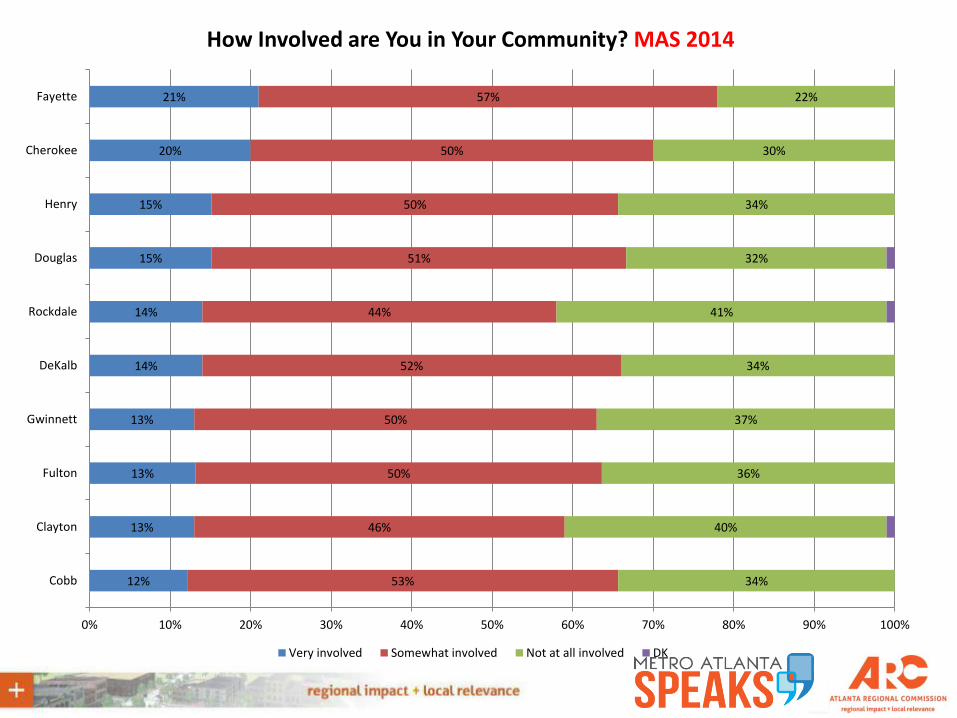
12%
13%
13%
13%
14%
14%
15%
15%
20%
21%
53%
46%
50%
50%
52%
44%
51%
50%
50%
57%
34%
40%
36%
37%
34%
41%
32%
34%
30%
22%
0% 10% 20% 30% 40% 50% 60% 70% 80% 90% 100%
Cobb
Clayton
Fulton
Gwinnett
DeKalb
Rockdale
Douglas
Henry
Cherokee
Fayette
How Involved are You in Your Community? MAS 2014
Very involved Somewhat involved Not at all involved DK
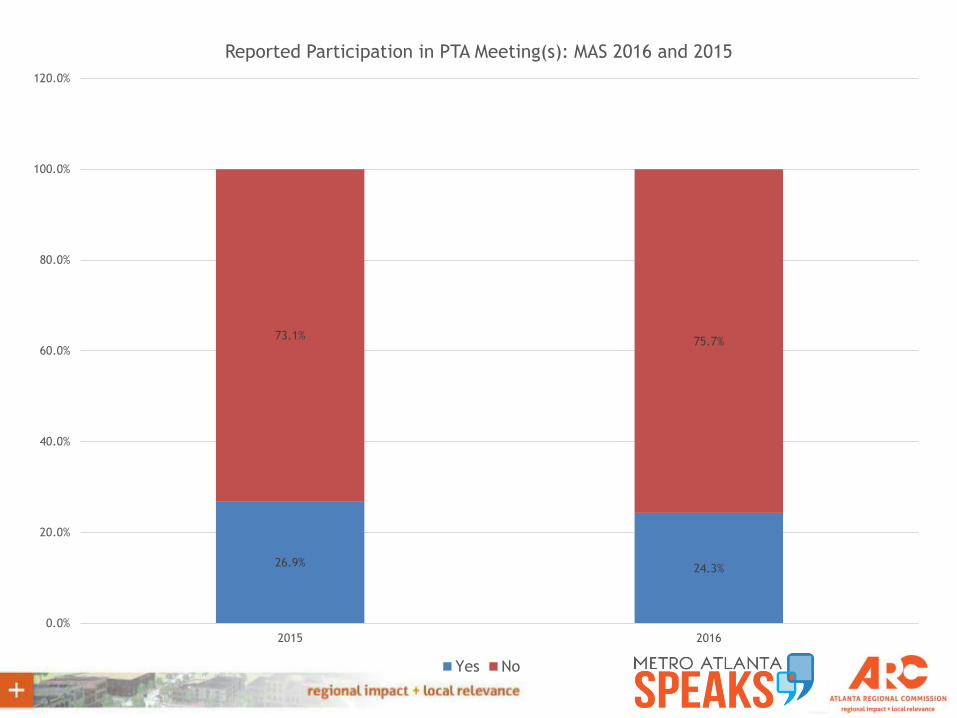
26.9%24.3%
73.1%75.7%
0.0%
20.0%
40.0%
60.0%
80.0%
100.0%
120.0%
2015 2016
Reported Participation in PTA Meeting(s): MAS 2016 and 2015
Yes No
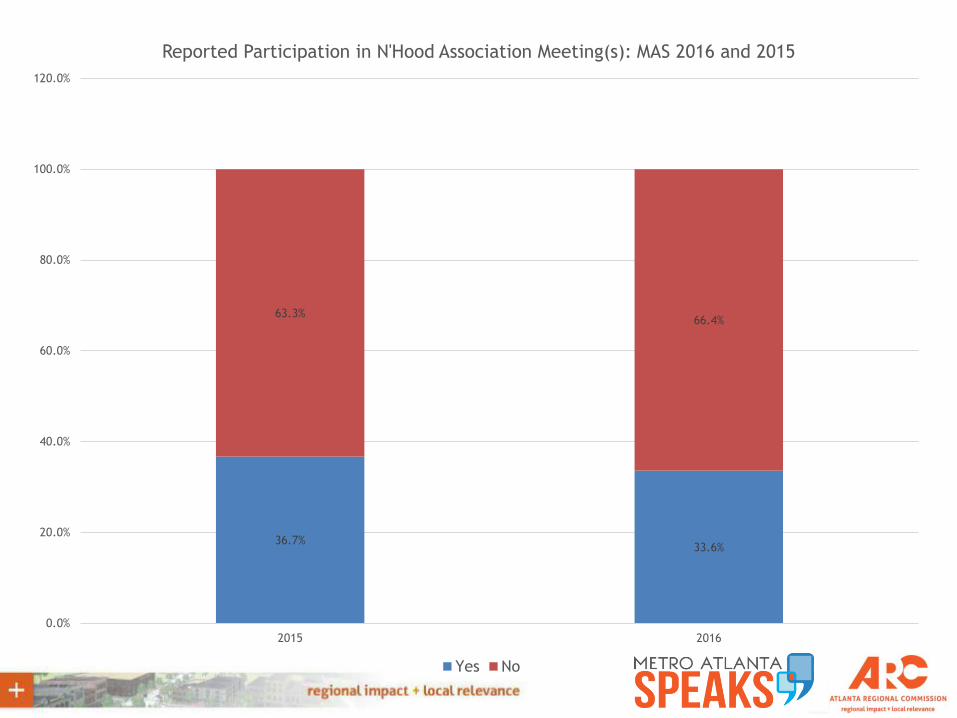
36.7%33.6%
63.3%66.4%
0.0%
20.0%
40.0%
60.0%
80.0%
100.0%
120.0%
2015 2016
Reported Participation in N'Hood Association Meeting(s): MAS 2016 and 2015
Yes No
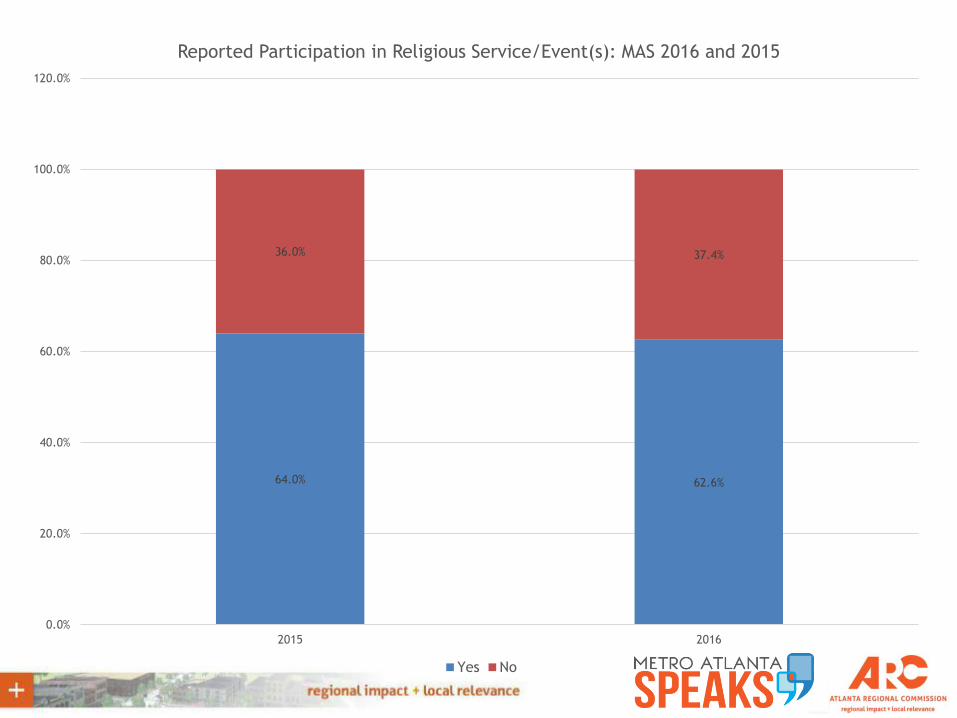
64.0% 62.6%
36.0% 37.4%
0.0%
20.0%
40.0%
60.0%
80.0%
100.0%
120.0%
2015 2016
Reported Participation in Religious Service/Event(s): MAS 2016 and 2015
Yes No
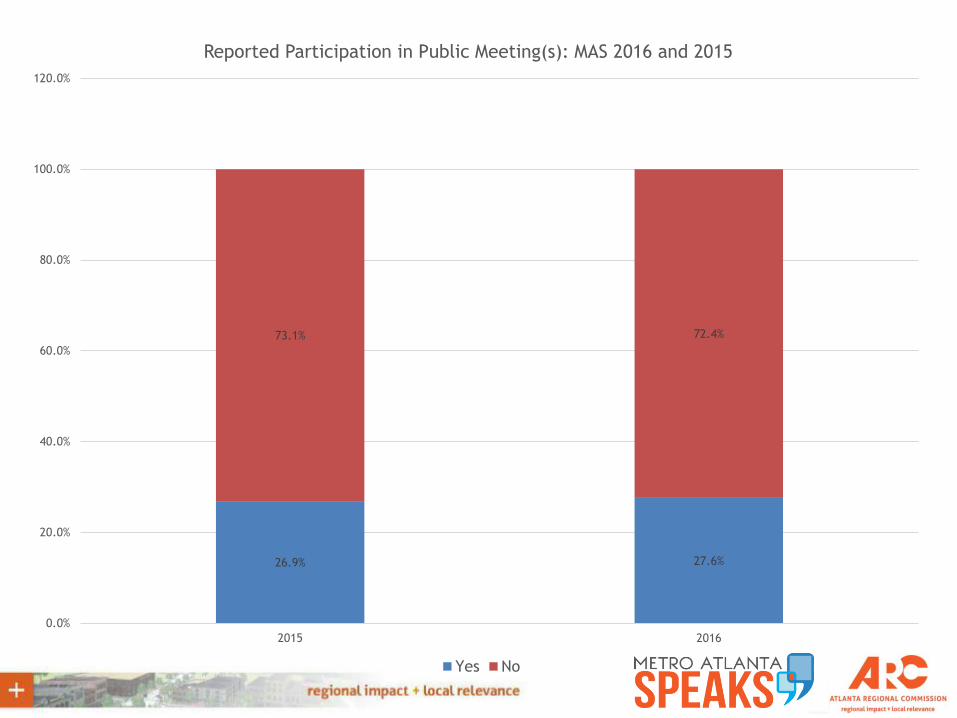
26.9% 27.6%
73.1% 72.4%
0.0%
20.0%
40.0%
60.0%
80.0%
100.0%
120.0%
2015 2016
Reported Participation in Public Meeting(s): MAS 2016 and 2015
Yes No
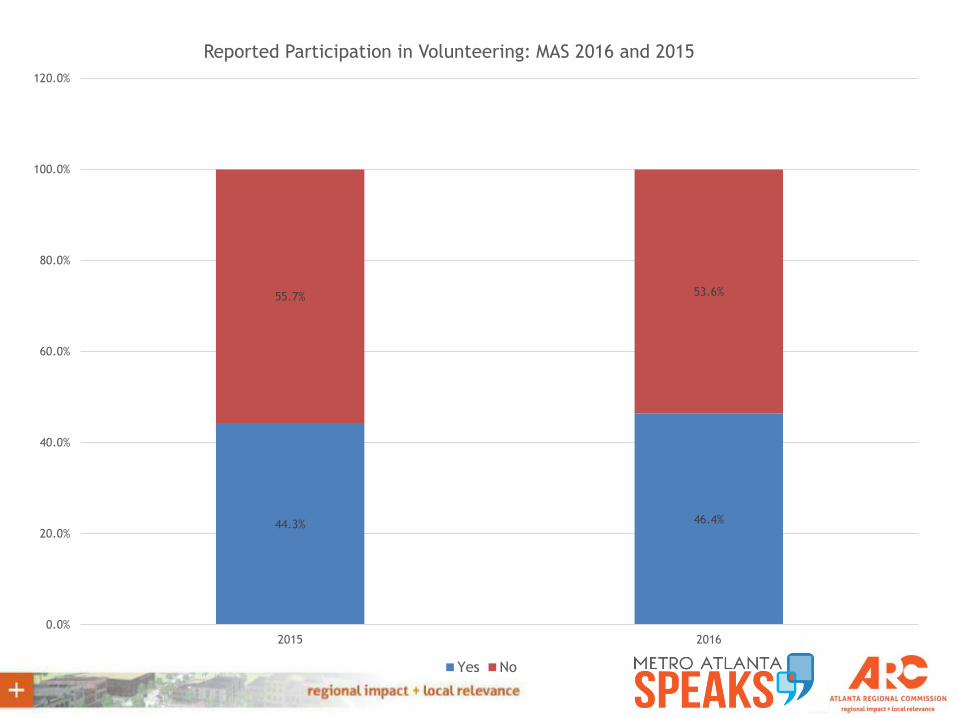
44.3% 46.4%
55.7% 53.6%
0.0%
20.0%
40.0%
60.0%
80.0%
100.0%
120.0%
2015 2016
Reported Participation in Volunteering: MAS 2016 and 2015
Yes No
QUALITY OF LIFE (OTHER)
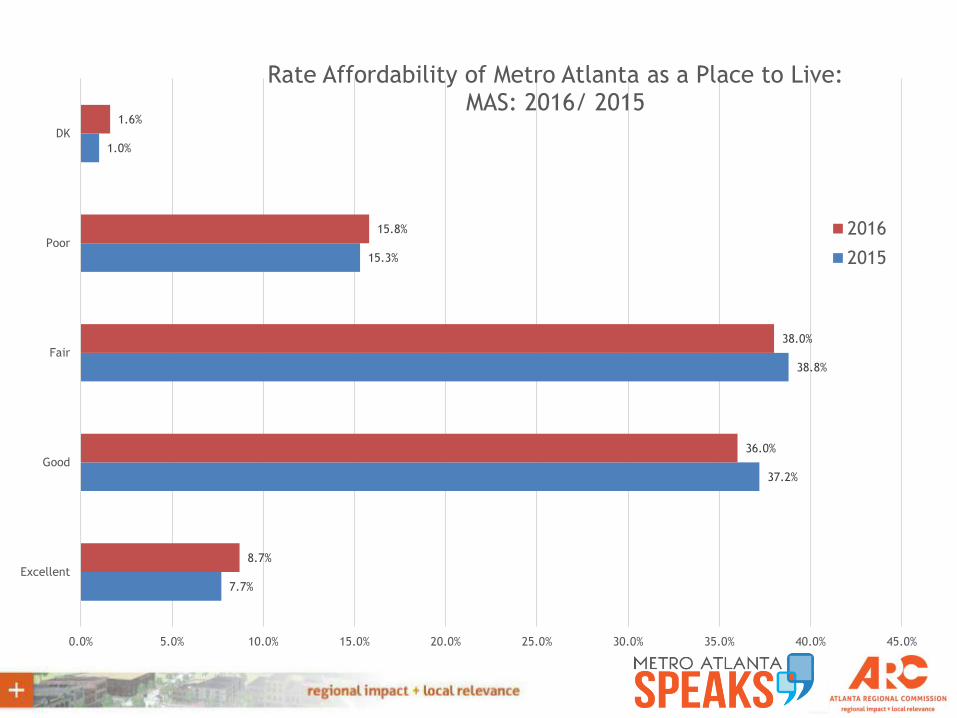
7.7%
37.2%
38.8%
15.3%
1.0%
8.7%
36.0%
38.0%
15.8%
1.6%
0.0% 5.0% 10.0% 15.0% 20.0% 25.0% 30.0% 35.0% 40.0% 45.0%
Excellent
Good
Fair
Poor
DK
Rate Affordability of Metro Atlanta as a Place to Live: MAS: 2016/ 2015
2016
2015
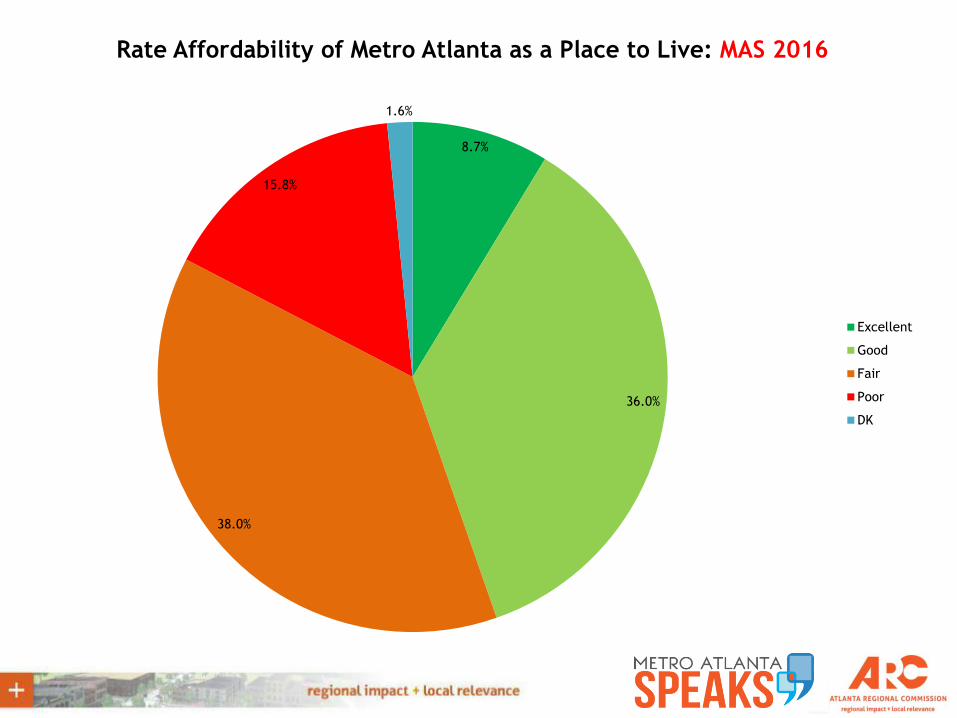
8.7%
36.0%
38.0%
15.8%
1.6%
Rate Affordability of Metro Atlanta as a Place to Live: MAS 2016
Excellent
Good
Fair
Poor
DK
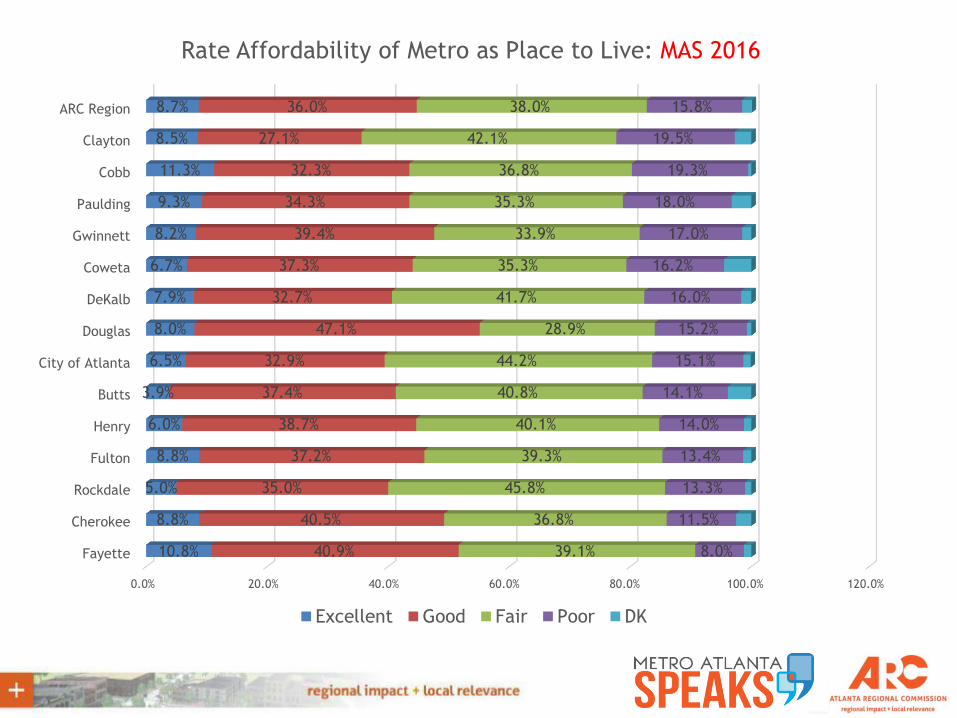
0.0% 20.0% 40.0% 60.0% 80.0% 100.0% 120.0%
Fayette
Cherokee
Rockdale
Fulton
Henry
Butts
City of Atlanta
Douglas
DeKalb
Coweta
Gwinnett
Paulding
Cobb
Clayton
ARC Region
10.8%
8.8%
5.0%
8.8%
6.0%
3.9%
6.5%
8.0%
7.9%
6.7%
8.2%
9.3%
11.3%
8.5%
8.7%
40.9%
40.5%
35.0%
37.2%
38.7%
37.4%
32.9%
47.1%
32.7%
37.3%
39.4%
34.3%
32.3%
27.1%
36.0%
39.1%
36.8%
45.8%
39.3%
40.1%
40.8%
44.2%
28.9%
41.7%
35.3%
33.9%
35.3%
36.8%
42.1%
38.0%
8.0%
11.5%
13.3%
13.4%
14.0%
14.1%
15.1%
15.2%
16.0%
16.2%
17.0%
18.0%
19.3%
19.5%
15.8%
Rate Affordability of Metro as Place to Live: MAS 2016
Excellent Good Fair Poor DK
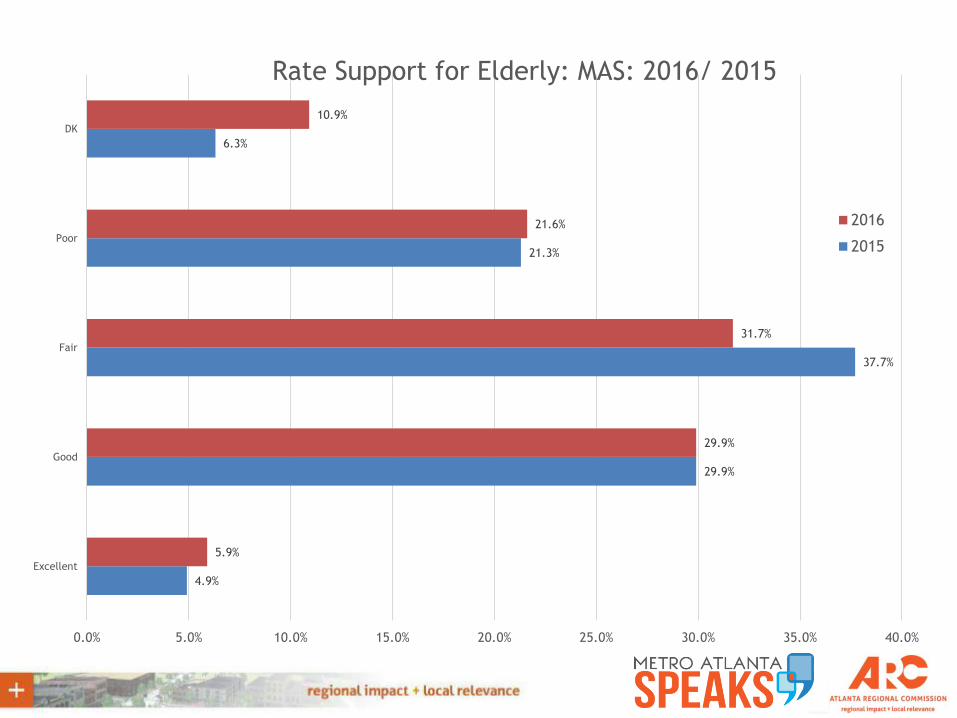
4.9%
29.9%
37.7%
21.3%
6.3%
5.9%
29.9%
31.7%
21.6%
10.9%
0.0% 5.0% 10.0% 15.0% 20.0% 25.0% 30.0% 35.0% 40.0%
Excellent
Good
Fair
Poor
DK
Rate Support for Elderly: MAS: 2016/ 2015
2016
2015
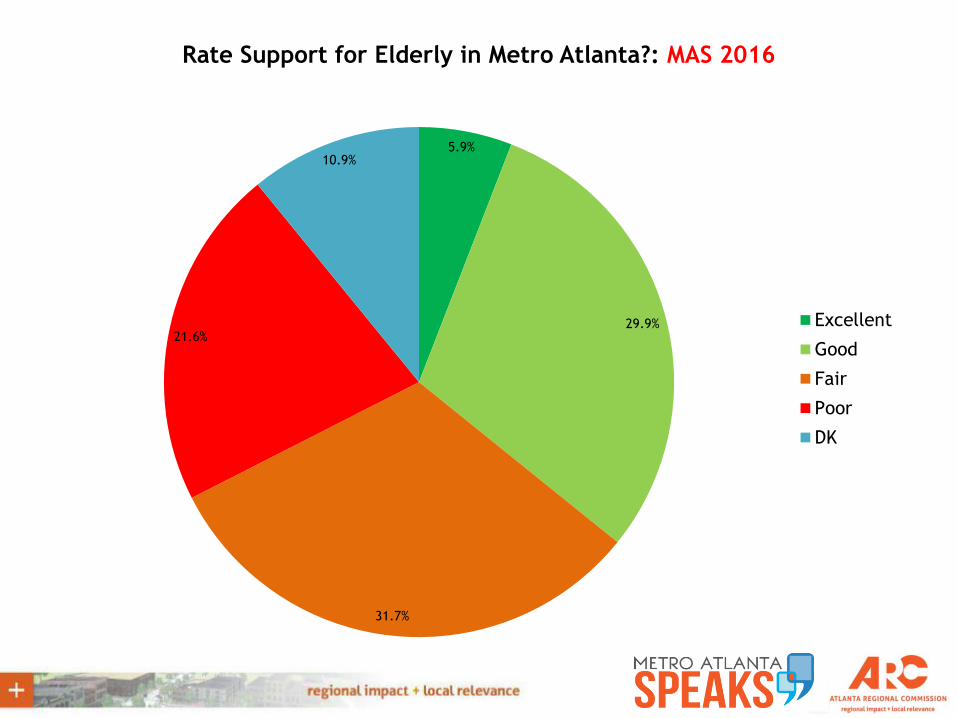
5.9%
29.9%
31.7%
21.6%
10.9%
Rate Support for Elderly in Metro Atlanta?: MAS 2016
Excellent
Good
Fair
Poor
DK
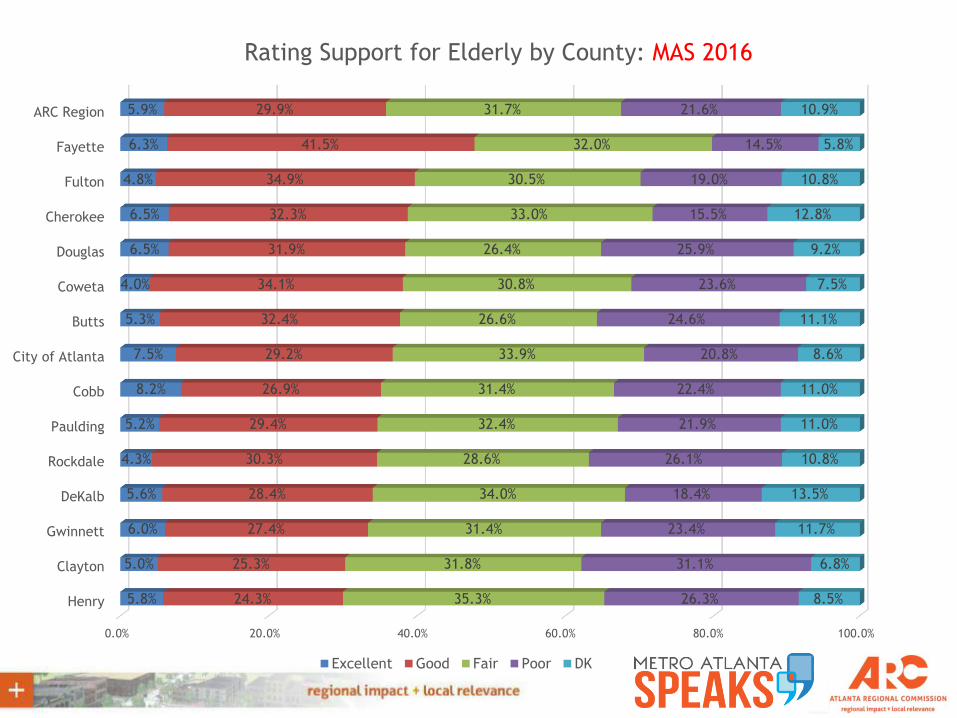
0.0% 20.0% 40.0% 60.0% 80.0% 100.0%
Henry
Clayton
Gwinnett
DeKalb
Rockdale
Paulding
Cobb
City of Atlanta
Butts
Coweta
Douglas
Cherokee
Fulton
Fayette
ARC Region
5.8%
5.0%
6.0%
5.6%
4.3%
5.2%
8.2%
7.5%
5.3%
4.0%
6.5%
6.5%
4.8%
6.3%
5.9%
24.3%
25.3%
27.4%
28.4%
30.3%
29.4%
26.9%
29.2%
32.4%
34.1%
31.9%
32.3%
34.9%
41.5%
29.9%
35.3%
31.8%
31.4%
34.0%
28.6%
32.4%
31.4%
33.9%
26.6%
30.8%
26.4%
33.0%
30.5%
32.0%
31.7%
26.3%
31.1%
23.4%
18.4%
26.1%
21.9%
22.4%
20.8%
24.6%
23.6%
25.9%
15.5%
19.0%
14.5%
21.6%
8.5%
6.8%
11.7%
13.5%
10.8%
11.0%
11.0%
8.6%
11.1%
7.5%
9.2%
12.8%
10.8%
5.8%
10.9%
Rating Support for Elderly by County: MAS 2016
Excellent Good Fair Poor DK
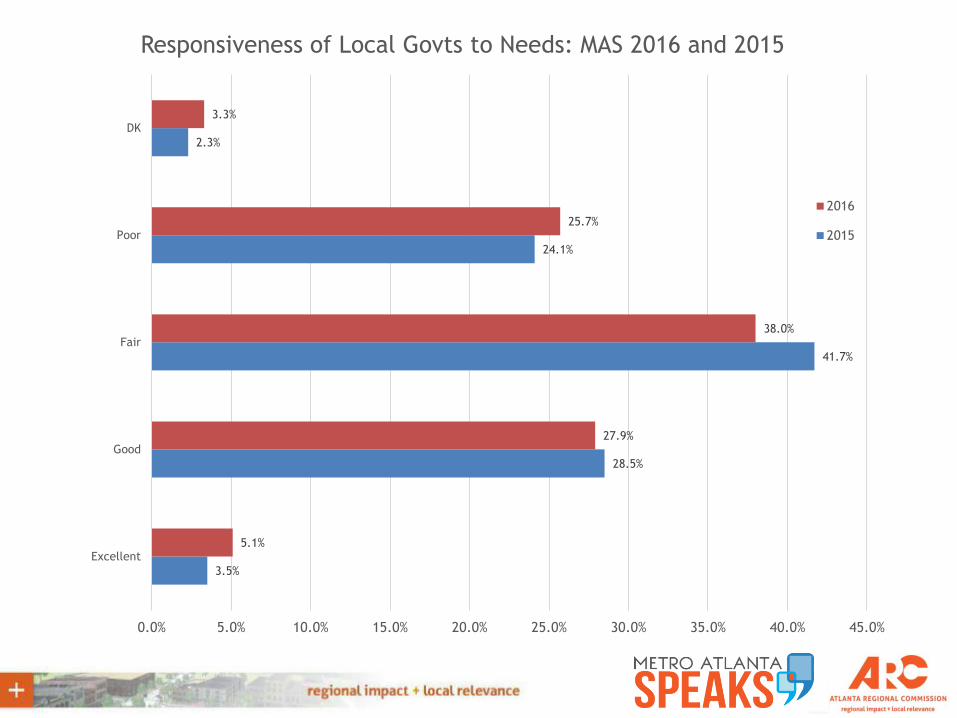
3.5%
28.5%
41.7%
24.1%
2.3%
5.1%
27.9%
38.0%
25.7%
3.3%
0.0% 5.0% 10.0% 15.0% 20.0% 25.0% 30.0% 35.0% 40.0% 45.0%
Excellent
Good
Fair
Poor
DK
Responsiveness of Local Govts to Needs: MAS 2016 and 2015
2016
2015
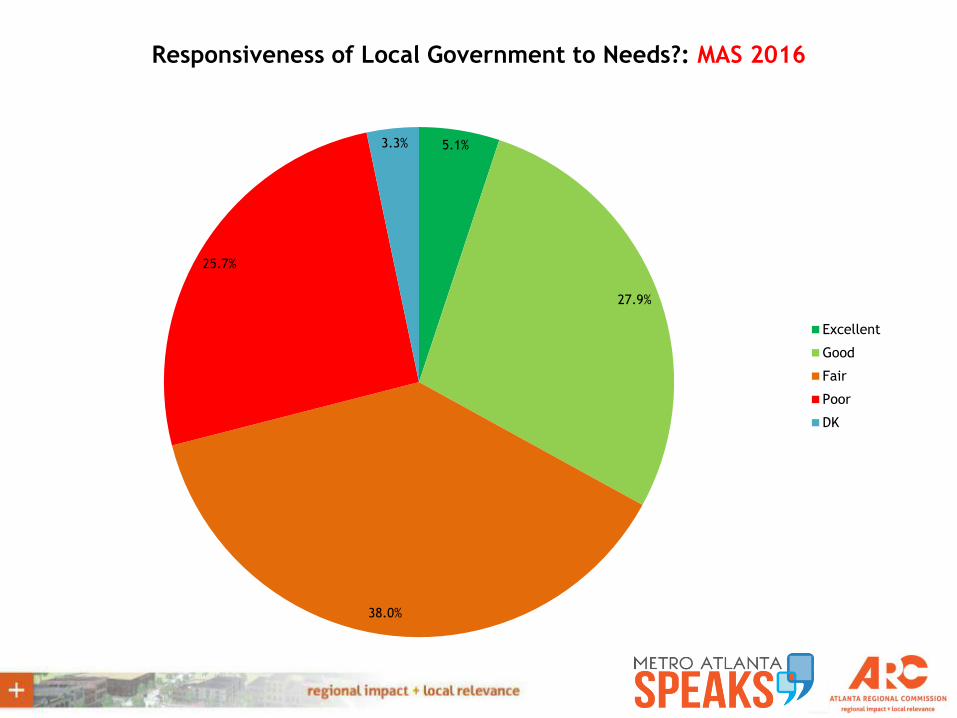
5.1%
27.9%
38.0%
25.7%
3.3%
Responsiveness of Local Government to Needs?: MAS 2016
Excellent
Good
Fair
Poor
DK
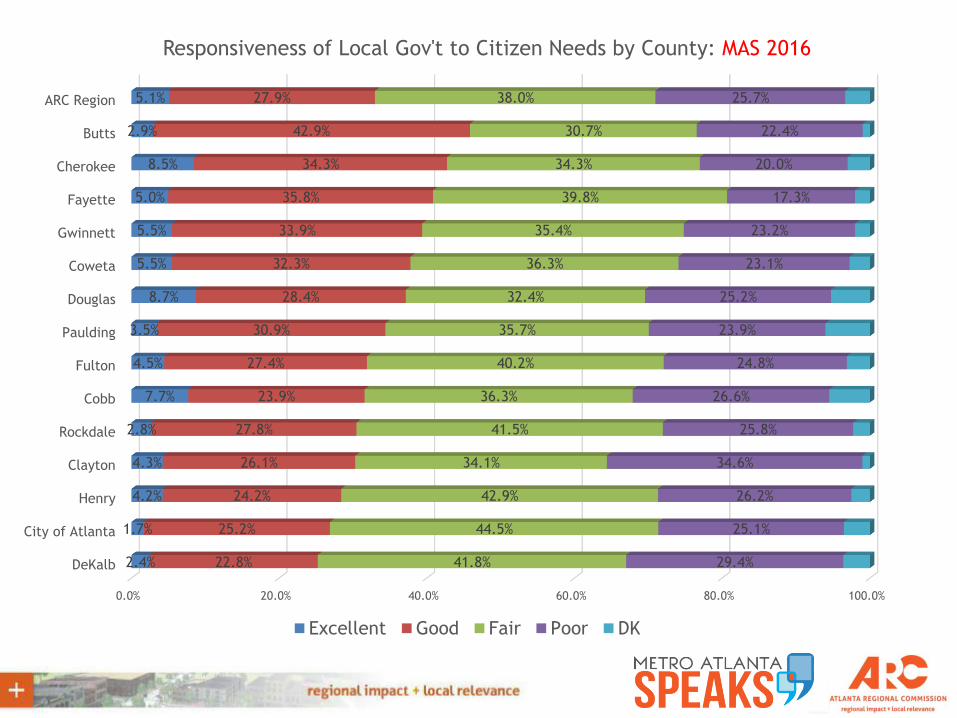
0.0% 20.0% 40.0% 60.0% 80.0% 100.0%
DeKalb
City of Atlanta
Henry
Clayton
Rockdale
Cobb
Fulton
Paulding
Douglas
Coweta
Gwinnett
Fayette
Cherokee
Butts
ARC Region
2.4%
1.7%
4.2%
4.3%
2.8%
7.7%
4.5%
3.5%
8.7%
5.5%
5.5%
5.0%
8.5%
2.9%
5.1%
22.8%
25.2%
24.2%
26.1%
27.8%
23.9%
27.4%
30.9%
28.4%
32.3%
33.9%
35.8%
34.3%
42.9%
27.9%
41.8%
44.5%
42.9%
34.1%
41.5%
36.3%
40.2%
35.7%
32.4%
36.3%
35.4%
39.8%
34.3%
30.7%
38.0%
29.4%
25.1%
26.2%
34.6%
25.8%
26.6%
24.8%
23.9%
25.2%
23.1%
23.2%
17.3%
20.0%
22.4%
25.7%
Responsiveness of Local Gov't to Citizen Needs by County: MAS 2016
Excellent Good Fair Poor DK
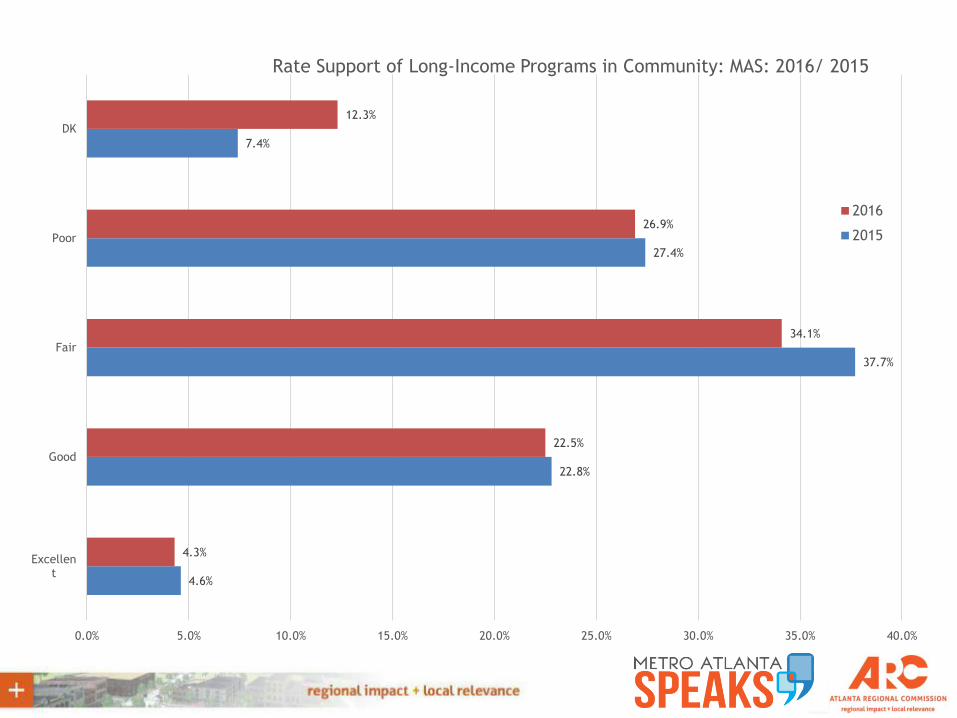
4.6%
22.8%
37.7%
27.4%
7.4%
4.3%
22.5%
34.1%
26.9%
12.3%
0.0% 5.0% 10.0% 15.0% 20.0% 25.0% 30.0% 35.0% 40.0%
Excellent
Good
Fair
Poor
DK
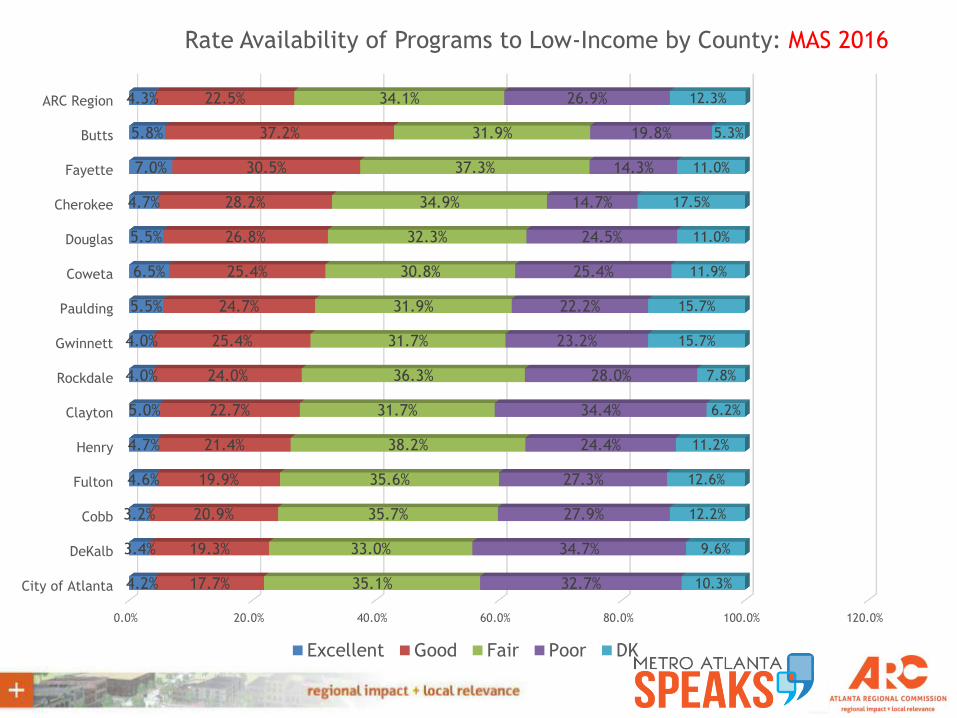
Rate Support of Long-Income Programs in Community: MAS: 2016/ 2015
2016
2015
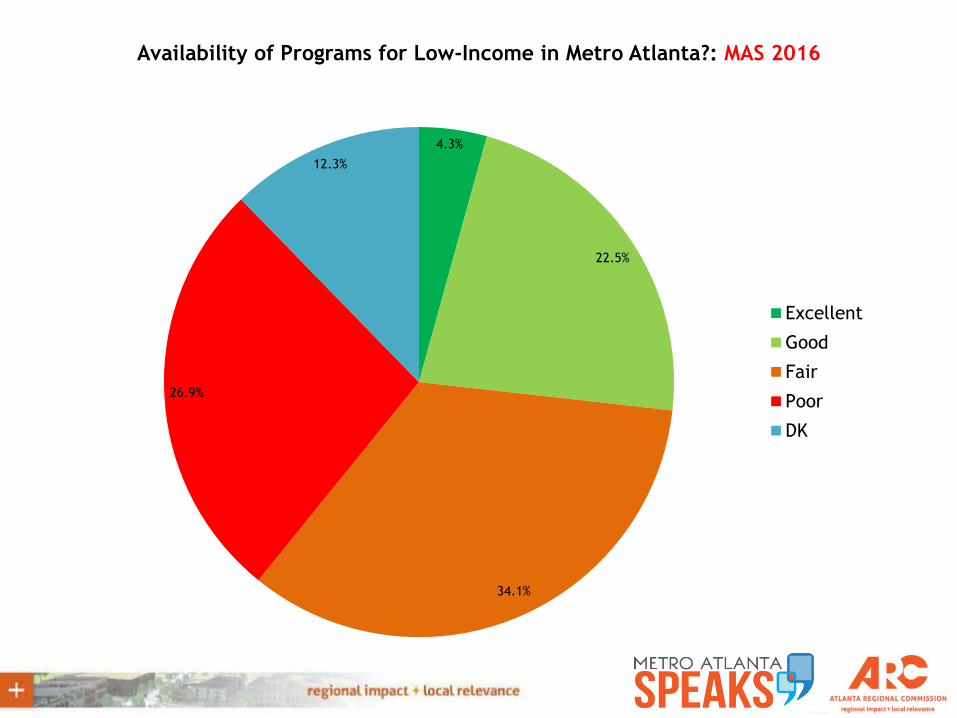
4.3%
22.5%
34.1%
26.9%
12.3%
Availability of Programs for Low-Income in Metro Atlanta?: MAS 2016
Excellent
Good
Fair
Poor
DK
0.0% 20.0% 40.0% 60.0% 80.0% 100.0% 120.0%
City of Atlanta
DeKalb
Cobb
Fulton
Henry
Clayton
Rockdale
Gwinnett
Paulding
Coweta
Douglas
Cherokee
Fayette
Butts
ARC Region
4.2%
3.4%
3.2%
4.6%
4.7%
5.0%
4.0%
4.0%
5.5%
6.5%
5.5%
4.7%
7.0%
5.8%
4.3%
17.7%
19.3%
20.9%
19.9%
21.4%
22.7%
24.0%
25.4%
24.7%
25.4%
26.8%
28.2%
30.5%
37.2%
22.5%
35.1%
33.0%
35.7%
35.6%
38.2%
31.7%
36.3%
31.7%
31.9%
30.8%
32.3%
34.9%
37.3%
31.9%
34.1%
32.7%
34.7%
27.9%
27.3%
24.4%
34.4%
28.0%
23.2%
22.2%
25.4%
24.5%
14.7%
14.3%
19.8%
26.9%
10.3%
9.6%
12.2%
12.6%
11.2%
6.2%
7.8%
15.7%
15.7%
11.9%
11.0%
17.5%
11.0%
5.3%
12.3%
Rate Availability of Programs to Low-Income by County: MAS 2016
Excellent Good Fair Poor DK
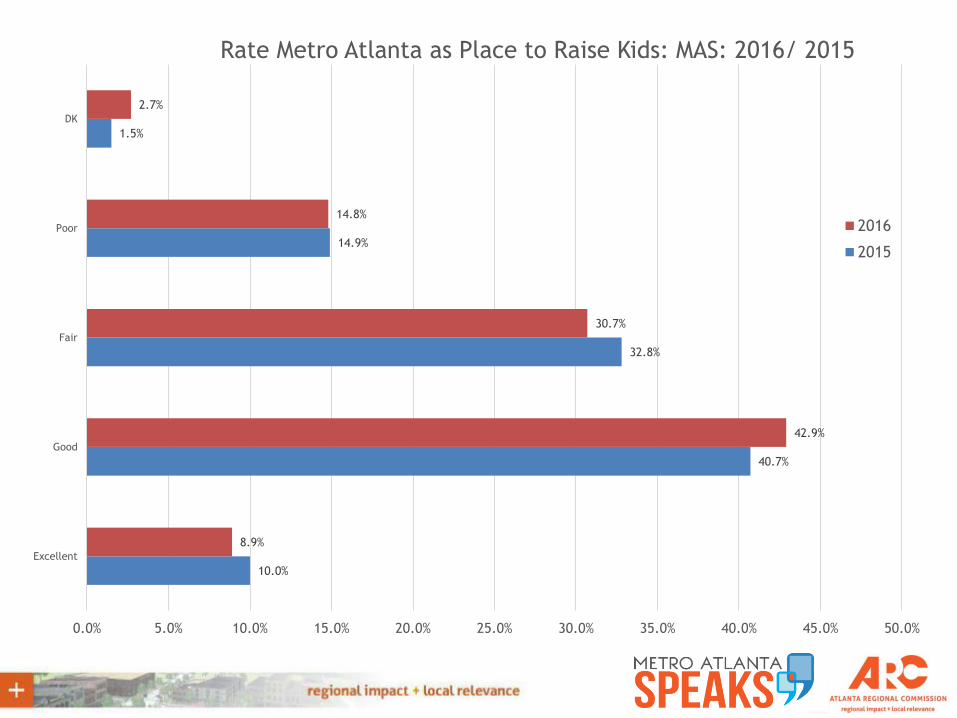
10.0%
40.7%
32.8%
14.9%
1.5%
8.9%
42.9%
30.7%
14.8%
2.7%
0.0% 5.0% 10.0% 15.0% 20.0% 25.0% 30.0% 35.0% 40.0% 45.0% 50.0%
Excellent
Good
Fair
Poor
DK
Rate Metro Atlanta as Place to Raise Kids: MAS: 2016/ 2015
2016
2015
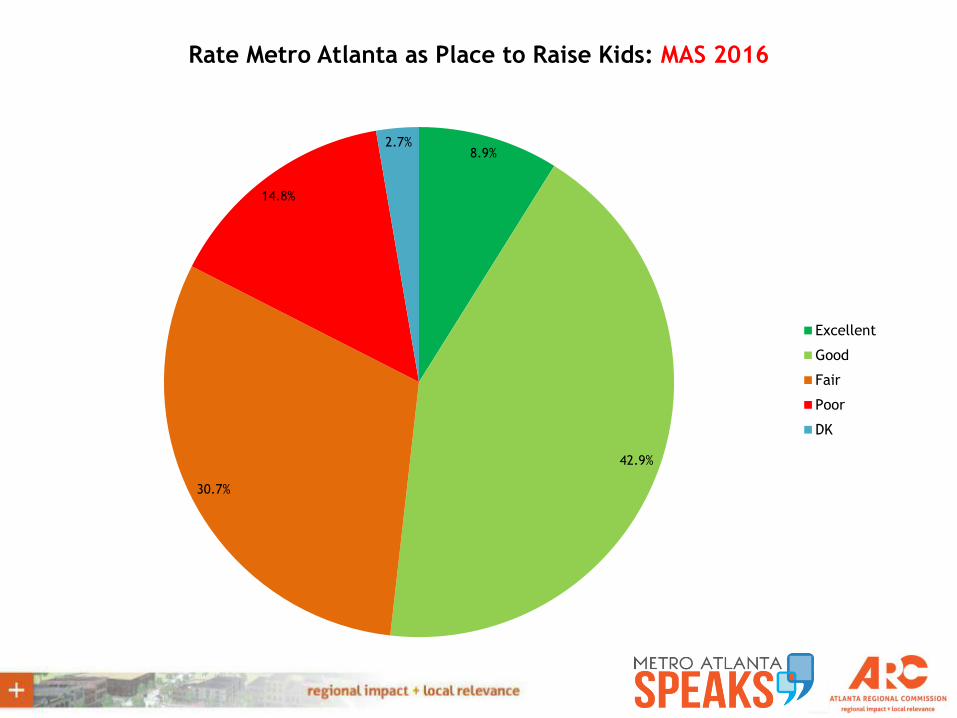
8.9%
42.9%
30.7%
14.8%
2.7%
Rate Metro Atlanta as Place to Raise Kids: MAS 2016
Excellent
Good
Fair
Poor
DK
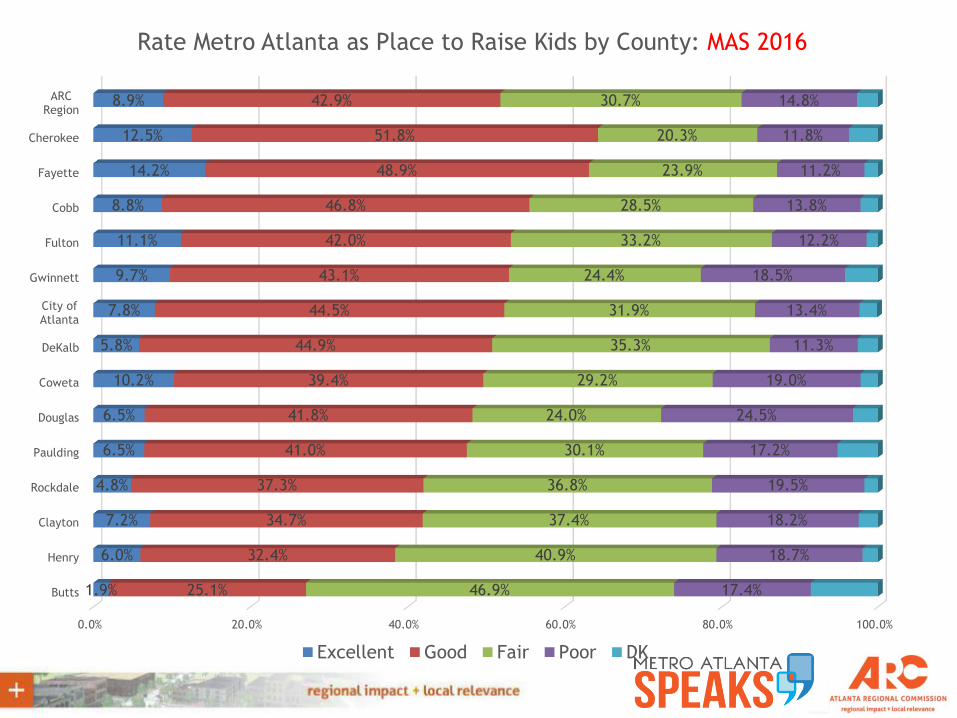
0.0% 20.0% 40.0% 60.0% 80.0% 100.0%
Butts
Henry
Clayton
Rockdale
Paulding
Douglas
Coweta
DeKalb
City ofAtlanta
Gwinnett
Fulton
Cobb
Fayette
Cherokee
ARCRegion
1.9%
6.0%
7.2%
4.8%
6.5%
6.5%
10.2%
5.8%
7.8%
9.7%
11.1%
8.8%
14.2%
12.5%
8.9%
25.1%
32.4%
34.7%
37.3%
41.0%
41.8%
39.4%
44.9%
44.5%
43.1%
42.0%
46.8%
48.9%
51.8%
42.9%
46.9%
40.9%
37.4%
36.8%
30.1%
24.0%
29.2%
35.3%
31.9%
24.4%
33.2%
28.5%
23.9%
20.3%
30.7%
17.4%
18.7%
18.2%
19.5%
17.2%
24.5%
19.0%
11.3%
13.4%
18.5%
12.2%
13.8%
11.2%
11.8%
14.8%
Rate Metro Atlanta as Place to Raise Kids by County: MAS 2016
Excellent Good Fair Poor DK
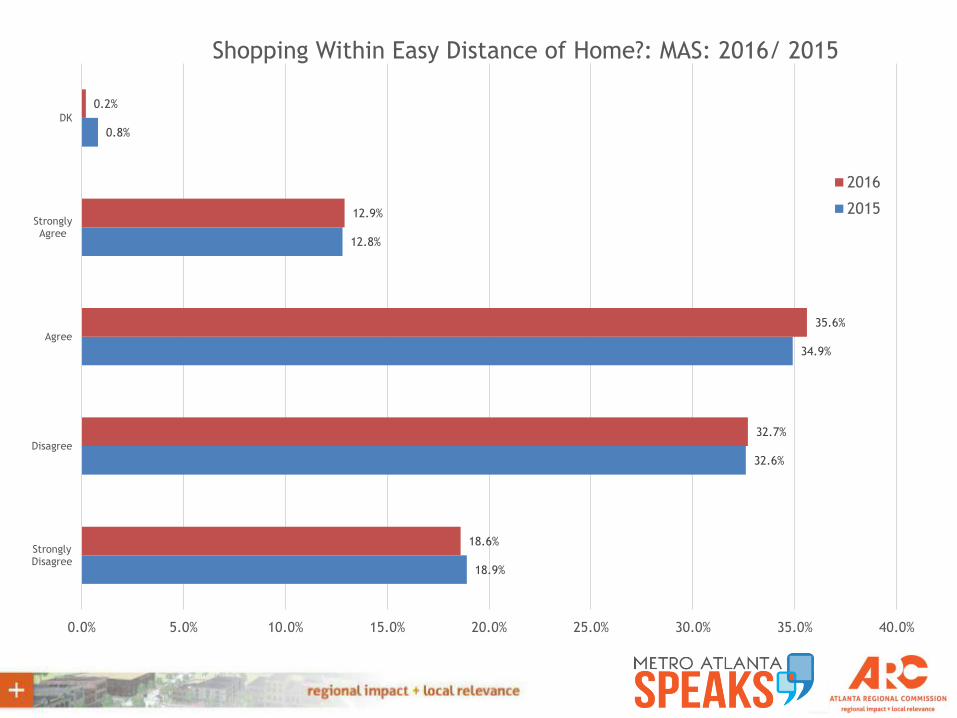
18.9%
32.6%
34.9%
12.8%
0.8%
18.6%
32.7%
35.6%
12.9%
0.2%
0.0% 5.0% 10.0% 15.0% 20.0% 25.0% 30.0% 35.0% 40.0%
StronglyDisagree
Disagree
Agree
StronglyAgree
DK
Shopping Within Easy Distance of Home?: MAS: 2016/ 2015
2016
2015
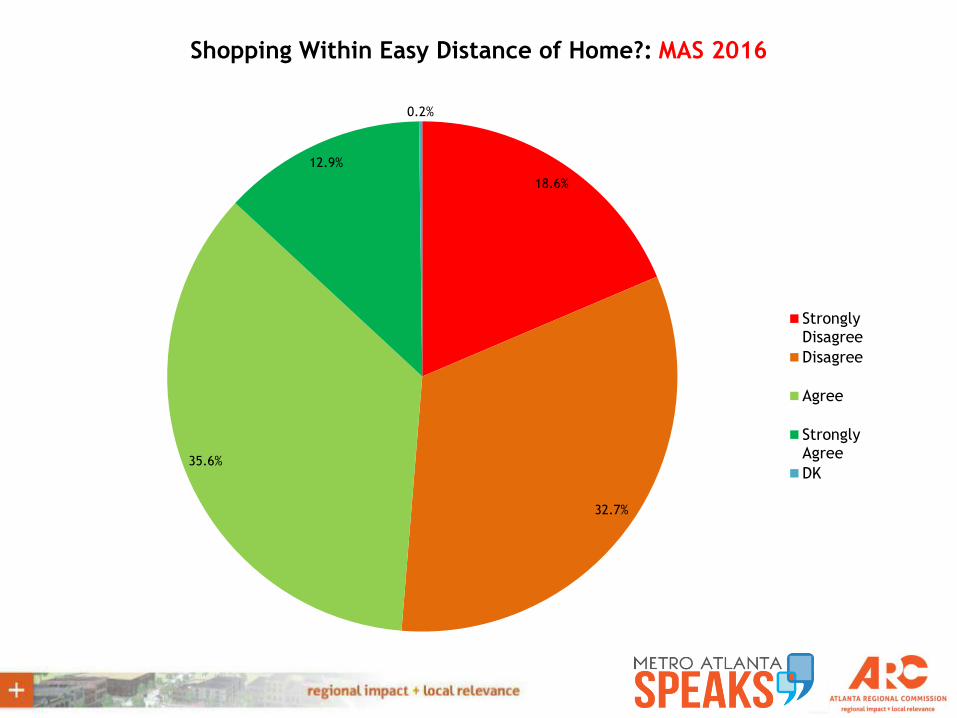
18.6%
32.7%
35.6%
12.9%
0.2%
Shopping Within Easy Distance of Home?: MAS 2016
StronglyDisagree
Disagree
Agree
StronglyAgree
DK
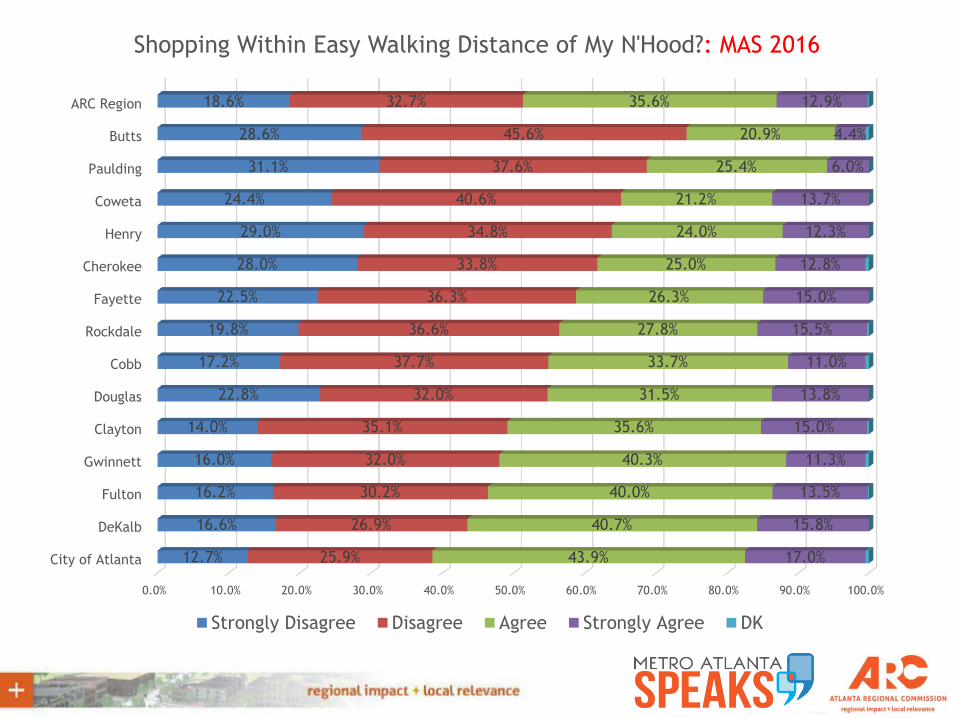
0.0% 10.0% 20.0% 30.0% 40.0% 50.0% 60.0% 70.0% 80.0% 90.0% 100.0%
City of Atlanta
DeKalb
Fulton
Gwinnett
Clayton
Douglas
Cobb
Rockdale
Fayette
Cherokee
Henry
Coweta
Paulding
Butts
ARC Region
12.7%
16.6%
16.2%
16.0%
14.0%
22.8%
17.2%
19.8%
22.5%
28.0%
29.0%
24.4%
31.1%
28.6%
18.6%
25.9%
26.9%
30.2%
32.0%
35.1%
32.0%
37.7%
36.6%
36.3%
33.8%
34.8%
40.6%
37.6%
45.6%
32.7%
43.9%
40.7%
40.0%
40.3%
35.6%
31.5%
33.7%
27.8%
26.3%
25.0%
24.0%
21.2%
25.4%
20.9%
35.6%
17.0%
15.8%
13.5%
11.3%
15.0%
13.8%
11.0%
15.5%
15.0%
12.8%
12.3%
13.7%
6.0%
4.4%
12.9%
Shopping Within Easy Walking Distance of My N'Hood?: MAS 2016
Strongly Disagree Disagree Agree Strongly Agree DK
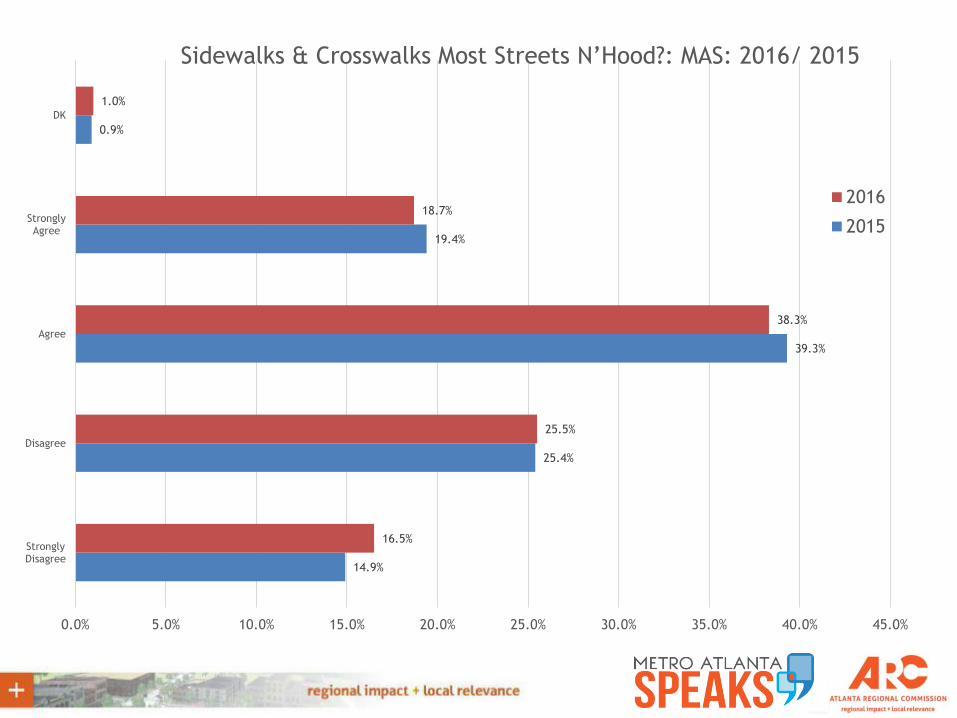
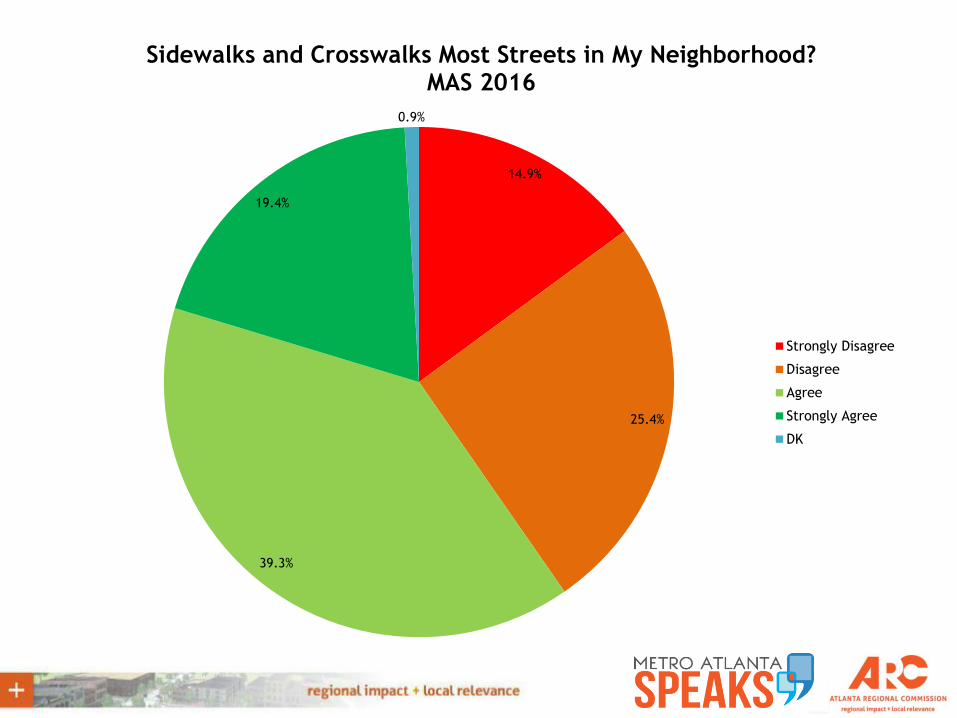
14.9%
25.4%
39.3%
19.4%
0.9%
16.5%
25.5%
38.3%
18.7%
1.0%
0.0% 5.0% 10.0% 15.0% 20.0% 25.0% 30.0% 35.0% 40.0% 45.0%
StronglyDisagree
Disagree
Agree
StronglyAgree
DK
Sidewalks & Crosswalks Most Streets N’Hood?: MAS: 2016/ 2015
2016
2015
14.9%
25.4%
39.3%
19.4%
0.9%
Sidewalks and Crosswalks Most Streets in My Neighborhood? MAS 2016
Strongly Disagree
Disagree
Agree
Strongly Agree
DK
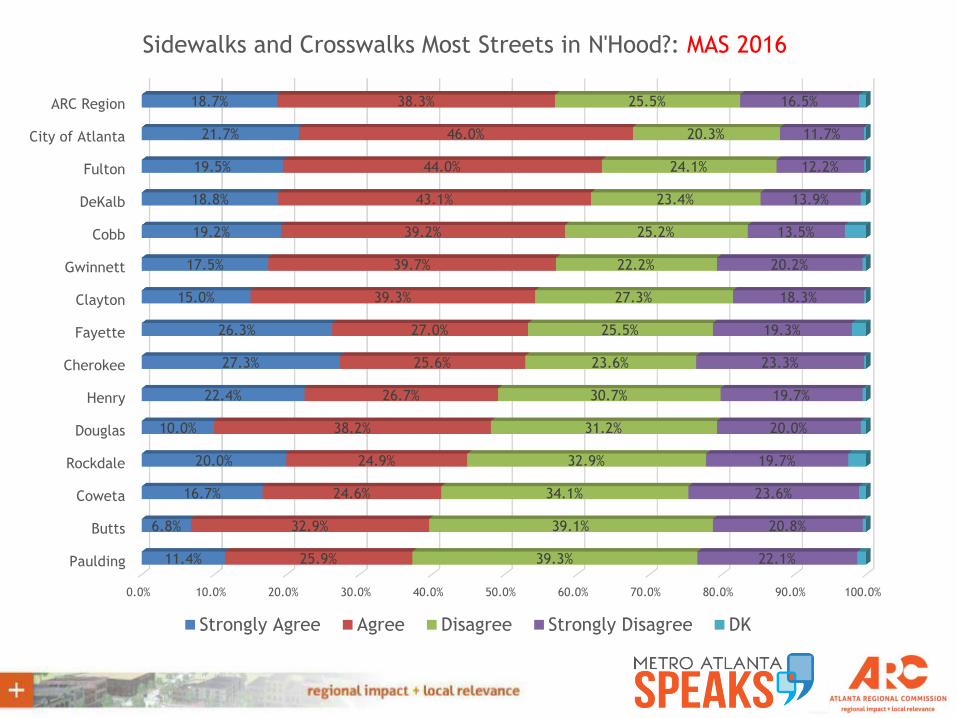
0.0% 10.0% 20.0% 30.0% 40.0% 50.0% 60.0% 70.0% 80.0% 90.0% 100.0%
Paulding
Butts
Coweta
Rockdale
Douglas
Henry
Cherokee
Fayette
Clayton
Gwinnett
Cobb
DeKalb
Fulton
City of Atlanta
ARC Region
11.4%
6.8%
16.7%
20.0%
10.0%
22.4%
27.3%
26.3%
15.0%
17.5%
19.2%
18.8%
19.5%
21.7%
18.7%
25.9%
32.9%
24.6%
24.9%
38.2%
26.7%
25.6%
27.0%
39.3%
39.7%
39.2%
43.1%
44.0%
46.0%
38.3%
39.3%
39.1%
34.1%
32.9%
31.2%
30.7%
23.6%
25.5%
27.3%
22.2%
25.2%
23.4%
24.1%
20.3%
25.5%
22.1%
20.8%
23.6%
19.7%
20.0%
19.7%
23.3%
19.3%
18.3%
20.2%
13.5%
13.9%
12.2%
11.7%
16.5%
Sidewalks and Crosswalks Most Streets in N'Hood?: MAS 2016
Strongly Agree Agree Disagree Strongly Disagree DK
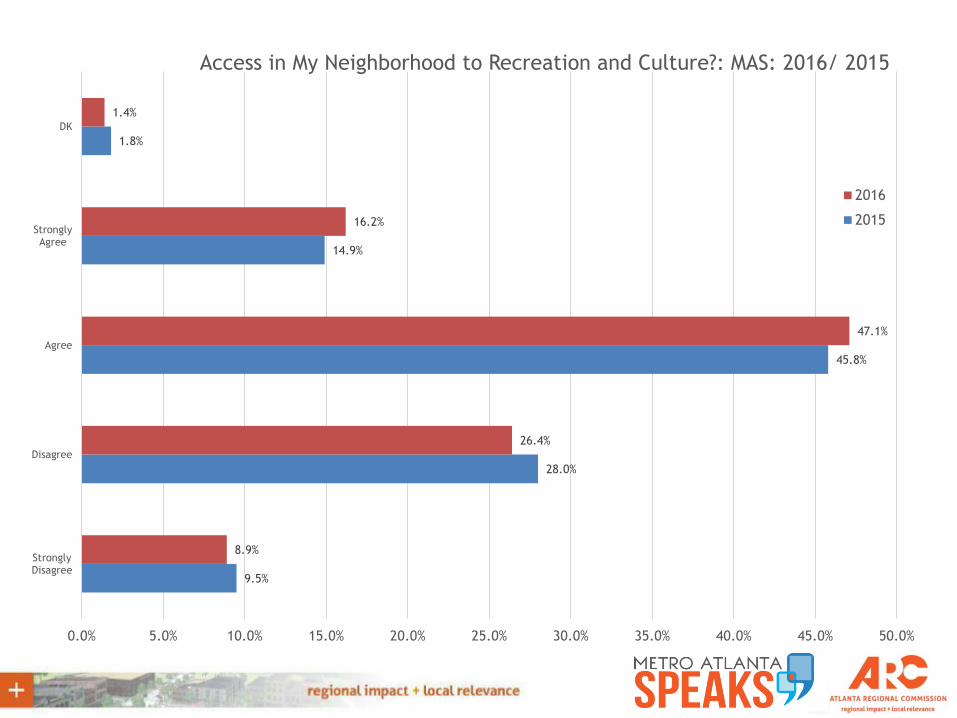
9.5%
28.0%
45.8%
14.9%
1.8%
8.9%
26.4%
47.1%
16.2%
1.4%
0.0% 5.0% 10.0% 15.0% 20.0% 25.0% 30.0% 35.0% 40.0% 45.0% 50.0%
StronglyDisagree
Disagree
Agree
StronglyAgree
DK
Access in My Neighborhood to Recreation and Culture?: MAS: 2016/ 2015
2016
2015
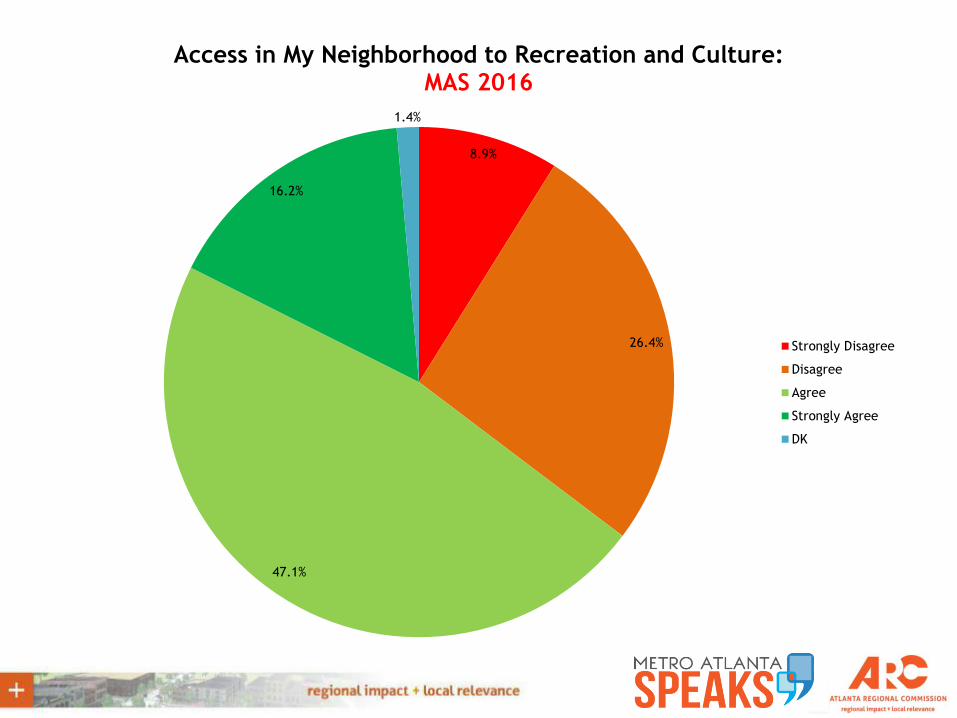
8.9%
26.4%
47.1%
16.2%
1.4%
Access in My Neighborhood to Recreation and Culture: MAS 2016
Strongly Disagree
Disagree
Agree
Strongly Agree
DK
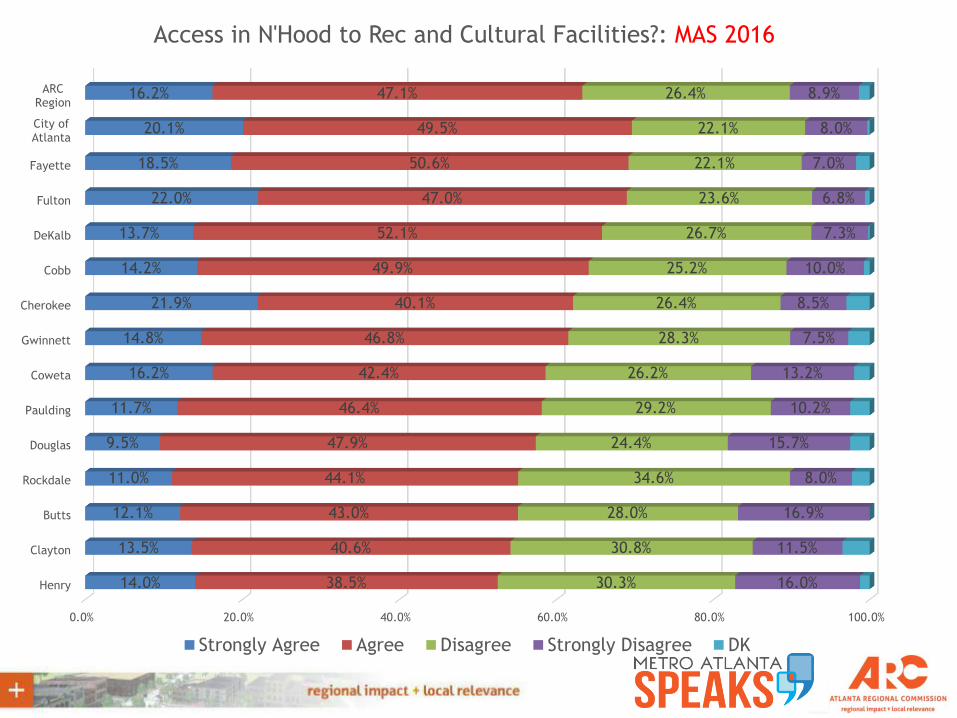
0.0% 20.0% 40.0% 60.0% 80.0% 100.0%
Henry
Clayton
Butts
Rockdale
Douglas
Paulding
Coweta
Gwinnett
Cherokee
Cobb
DeKalb
Fulton
Fayette
City ofAtlanta
ARCRegion
14.0%
13.5%
12.1%
11.0%
9.5%
11.7%
16.2%
14.8%
21.9%
14.2%
13.7%
22.0%
18.5%
20.1%
16.2%
38.5%
40.6%
43.0%
44.1%
47.9%
46.4%
42.4%
46.8%
40.1%
49.9%
52.1%
47.0%
50.6%
49.5%
47.1%
30.3%
30.8%
28.0%
34.6%
24.4%
29.2%
26.2%
28.3%
26.4%
25.2%
26.7%
23.6%
22.1%
22.1%
26.4%
16.0%
11.5%
16.9%
8.0%
15.7%
10.2%
13.2%
7.5%
8.5%
10.0%
7.3%
6.8%
7.0%
8.0%
8.9%
Access in N'Hood to Rec and Cultural Facilities?: MAS 2016
Strongly Agree Agree Disagree Strongly Disagree DK
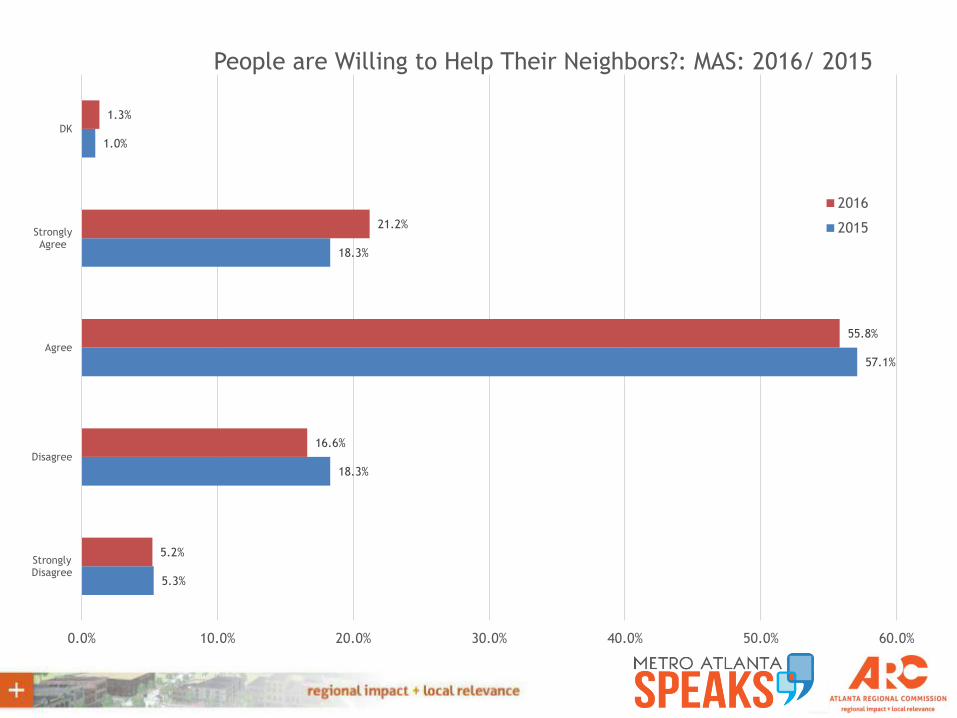
5.3%
18.3%
57.1%
18.3%
1.0%
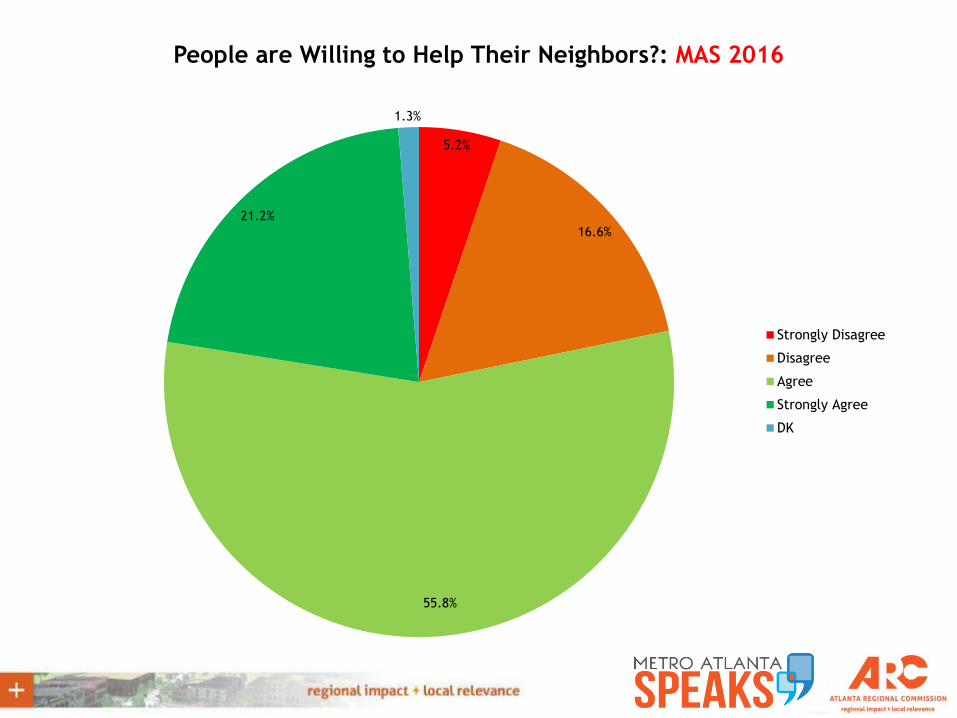
5.2%
16.6%
55.8%
21.2%
1.3%
0.0% 10.0% 20.0% 30.0% 40.0% 50.0% 60.0%
StronglyDisagree
Disagree
Agree
StronglyAgree
DK
People are Willing to Help Their Neighbors?: MAS: 2016/ 2015
2016
2015
5.2%
16.6%
55.8%
21.2%
1.3%
People are Willing to Help Their Neighbors?: MAS 2016
Strongly Disagree
Disagree
Agree
Strongly Agree
DK
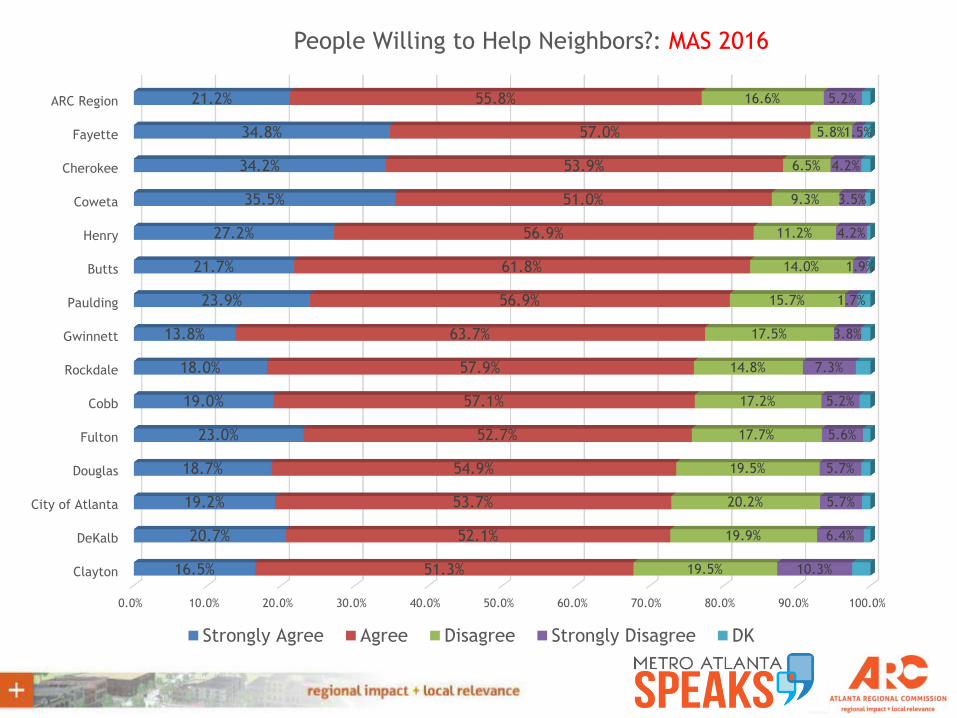
0.0% 10.0% 20.0% 30.0% 40.0% 50.0% 60.0% 70.0% 80.0% 90.0% 100.0%
Clayton
DeKalb
City of Atlanta
Douglas
Fulton
Cobb
Rockdale
Gwinnett
Paulding
Butts
Henry
Coweta
Cherokee
Fayette
ARC Region
16.5%
20.7%
19.2%
18.7%
23.0%
19.0%
18.0%
13.8%
23.9%
21.7%
27.2%
35.5%
34.2%
34.8%
21.2%
51.3%
52.1%
53.7%
54.9%
52.7%
57.1%
57.9%
63.7%
56.9%
61.8%
56.9%
51.0%
53.9%
57.0%
55.8%
19.5%
19.9%
20.2%
19.5%
17.7%
17.2%
14.8%
17.5%
15.7%
14.0%
11.2%
9.3%
6.5%
5.8%
16.6%
10.3%
6.4%
5.7%
5.7%
5.6%
5.2%
7.3%
3.8%
1.7%
1.9%
4.2%
3.5%
4.2%
1.5%
5.2%
People Willing to Help Neighbors?: MAS 2016
Strongly Agree Agree Disagree Strongly Disagree DK
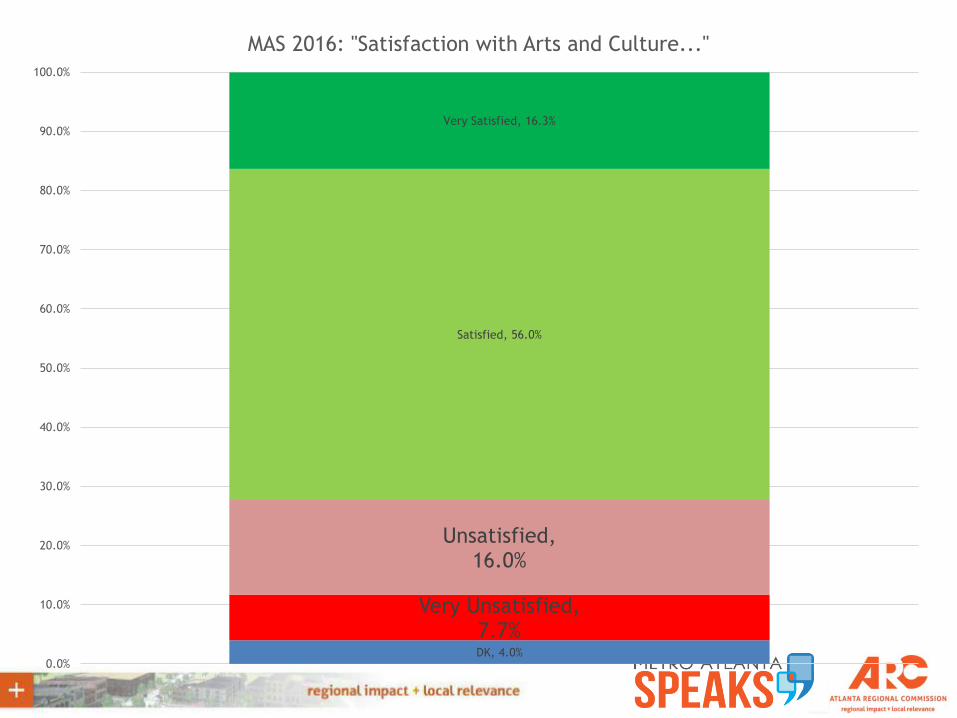
DK, 4.0%
Very Unsatisfied, 7.7%
Unsatisfied, 16.0%
Satisfied, 56.0%
Very Satisfied, 16.3%
0.0%
10.0%
20.0%
30.0%
40.0%
50.0%
60.0%
70.0%
80.0%
90.0%
100.0%
MAS 2016: "Satisfaction with Arts and Culture..."
0% 10% 20% 30% 40% 50% 60% 70% 80% 90% 100%
ARC Region
Clayton
Rockdale
Douglas
Gwinnett
Paulding
Henry
Fulton
City of Atlanta
Butts
Cobb
DeKalb
Coweta
Fayette
Cherokee
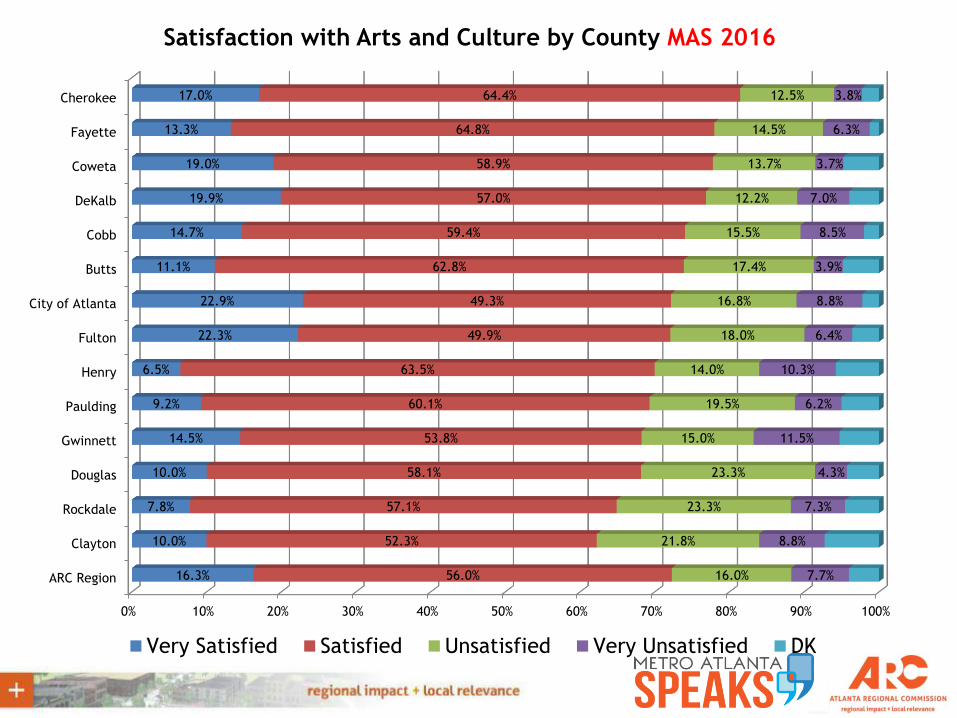
16.3%
10.0%
7.8%
10.0%
14.5%
9.2%
6.5%
22.3%
22.9%
11.1%
14.7%
19.9%
19.0%
13.3%
17.0%
56.0%
52.3%
57.1%
58.1%
53.8%
60.1%
63.5%
49.9%
49.3%
62.8%
59.4%
57.0%
58.9%
64.8%
64.4%
16.0%
21.8%
23.3%
23.3%
15.0%
19.5%
14.0%
18.0%
16.8%
17.4%
15.5%
12.2%
13.7%
14.5%
12.5%
7.7%
8.8%
7.3%
4.3%
11.5%
6.2%
10.3%
6.4%
8.8%
3.9%
8.5%
7.0%
3.7%
6.3%
3.8%
Satisfaction with Arts and Culture by County MAS 2016
Very Satisfied Satisfied Unsatisfied Very Unsatisfied DK
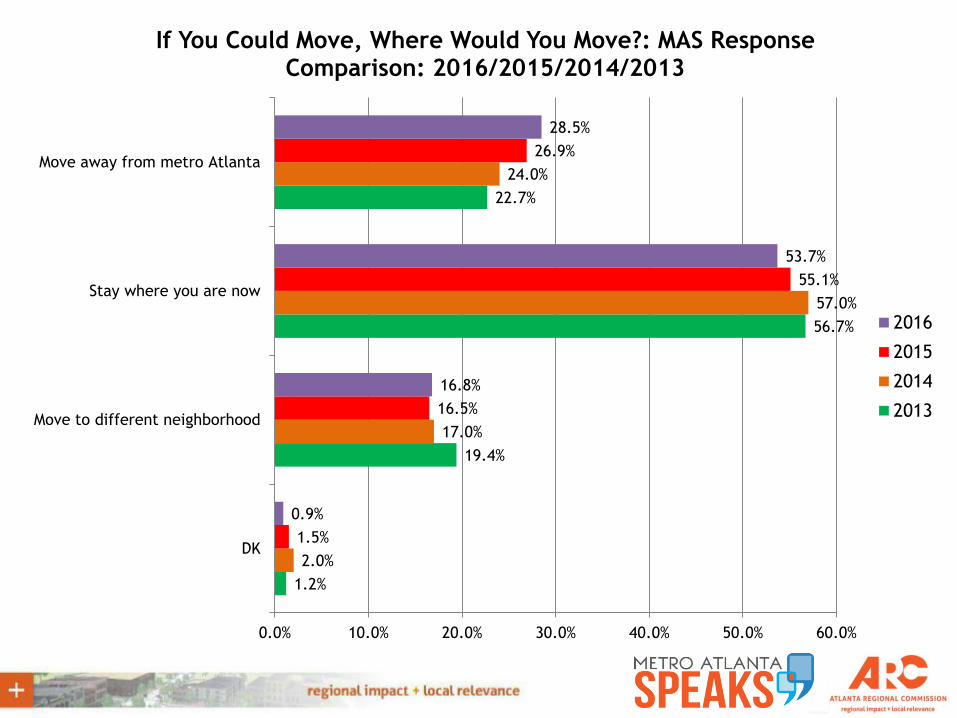
1.2%
19.4%
56.7%
22.7%
2.0%
17.0%
57.0%
24.0%
1.5%
16.5%
55.1%
26.9%
0.9%
16.8%
53.7%
28.5%
0.0% 10.0% 20.0% 30.0% 40.0% 50.0% 60.0%
DK
Move to different neighborhood
Stay where you are now
Move away from metro Atlanta
If You Could Move, Where Would You Move?: MAS Response Comparison: 2016/2015/2014/2013
2016
2015
2014
2013
0.0% 20.0% 40.0% 60.0% 80.0% 100.0% 120.0%
Clayton
DeKalb
City of Atlanta
Henry
Gwinnett
Paulding
Fulton
Rockdale
Douglas
Cherokee
Cobb
Coweta
Fayette
Butts
ARC Region
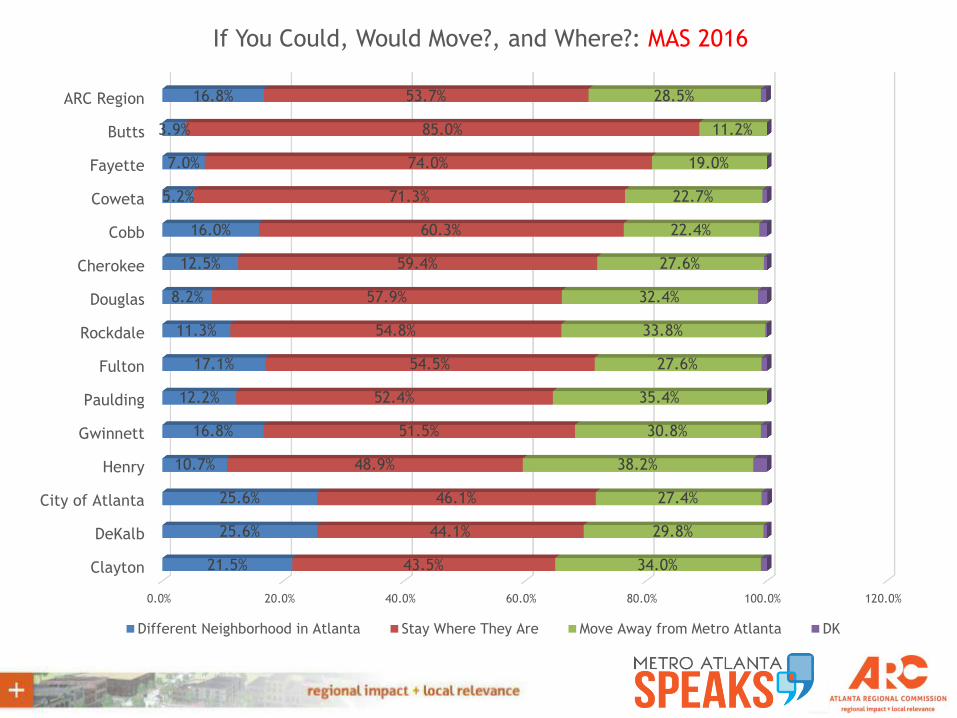
21.5%
25.6%
25.6%
10.7%
16.8%
12.2%
17.1%
11.3%
8.2%
12.5%
16.0%
5.2%
7.0%
3.9%
16.8%
43.5%
44.1%
46.1%
48.9%
51.5%
52.4%
54.5%
54.8%
57.9%
59.4%
60.3%
71.3%
74.0%
85.0%
53.7%
34.0%
29.8%
27.4%
38.2%
30.8%
35.4%
27.6%
33.8%
32.4%
27.6%
22.4%
22.7%
19.0%
11.2%
28.5%
If You Could, Would Move?, and Where?: MAS 2016
Different Neighborhood in Atlanta Stay Where They Are Move Away from Metro Atlanta DK