Embed Size (px)
Citation preview

A member of CGIAR consortium www.iita.org
Farming system opportunities and
limitations in Rwanda: Exploring scenarios
to improve welfare and sustainable land use
JH Ainembabazi, PMN Dontsop, G Nziguheba, M van
Wijk, L Klapwijk, L Jassogne, B Vanlauwe, P van Asten,
V. Manyong

A member of CGIAR consortium www.iita.org
• Farming systems are diverse:
– Small farm size <2 ha
– Low yields <30% of attainable yield levels
– Subsistence orientation
– Low adoption of technologies
• Sustainability of these systems is uncertain
– Level of intensification
– Resource use & management
– Spatial and temporal scales
– Market orientation
• A holistic analytical strategy is required
Motivation

A member of CGIAR consortium www.iita.org
• Aim:
– Assessment of sustainability of cropping systems
– Link sustainability and welfare indicators
• Methodology:
– Framework for assessing sustainability of NRM
systems (MESMIS)
• Productivity, stability, reliability, resilience,
adaptability and self-reliance
– Cluster analysis used to generate cropping systems
• Predominant crops grown and land allocation
Aim and methodology

A member of CGIAR consortium www.iita.org
Data: Humidtropics field sites

A member of CGIAR consortium www.iita.org
0.0 10.0 20.0 30.0 40.0 50.0 60.0 70.0
Maize
Sorghum
Rice
Millet
Wheat
Cassava
Sweet potatoes
Irish potatoes
Yam
Beans
Groundnuts
Soyabean
Pigeon peas
Banana
Sweet banana
Kale
Tomatoes
carrots
Leafy vegetables
Chilies
Pineapple
Coffee
Cotton
Timber
Fodder
others
Frequency (%)
Frequency of crops per season
Long rain season
Short rain season

A member of CGIAR consortium www.iita.org
0.2
.4.6
.81
Are
a sh
are
of
farm
siz
e
Cluster 1 Cluster 2 Cluster 3
Cereals Legumes
Roots & Tubers Bananas
Clustering based on land allocation

A member of CGIAR consortium www.iita.org
Productivity indicators 0
1,0
00
2,0
00
3,0
00
Pro
duct
ivity
($/h
a)
Legumesystems
Bananasystems
Cerealsystems
Land productivity ($/ha)
010
20
30
Valu
e (
$/T
LU
)Legumesystems
Bananasystems
Cerealsystems
Value of livestock products ($/TLU)
020
40
60
80
Inco
me (
$/c
apita
)
Legumesystems
Bananasystems
Cerealsystems
Net cash income/capita/year ($)
0.1
.2.3
Input/outp
ut ra
tio
Legumesystems
Bananasystems
Cerealsystems
Economic inefficiency

A member of CGIAR consortium www.iita.org
Stability indicators 0
.1.2
.3
land s
ize (
ha)
Legumesystems
Bananasystems
Cerealsystems
Land owned/capita (ha)
0.5
11.5
Liv
est
ock
(ha)
Legumesystems
Bananasystems
Cerealsystems
Livestock onwnership (TLU)
020
40
60
80
Farm
ass
ets
(%
)
Legumesystems
Bananasystems
Cerealsystems
Value of farm assets share (%)
020
40
60
80
Ow
n la
bor
input (%
)
Legumesystems
Bananasystems
Cerealsystems
HH members work on own farm (%)

A member of CGIAR consortium www.iita.org
01
23
4
Num
ber
of m
onth
s
Legumesystems
Bananasystems
Cerealsystems
# of months of inadequate food supplies
0
100
200
300
FS
R/F
SS
R
Legumesystems
Bananasystems
Cerealsystems
Food security/ self-sufficiency ratios (FSR/FSSR)
FSR FSSR
Self-reliance indicators
Food consumption
• Food security
• Food self sufficiency
• Food amount in bad months
• # months of inadequate food
01
02
03
04
05
0
Ina
de
qu
ate
fo
od
su
pp
lies (
%)
Legumesystems
Bananasystems
Cerealsystems
Share of a meal consumed in months of inadequate food (%)

A member of CGIAR consortium www.iita.org
Self-reliance indicators … 0
24
6
Share
rente
d in
(%
)
Legumesystems
Bananasystems
Cerealsystems
Only 12% of sample rented in land
Share of operated area rented in (%)
05
10
15
% o
f in
org
anic
fert
Legumesystems
Bananasystems
Cerealsystems
Share of inorganic fertilizer use[% of total use (inorganic and organic)]
02
46
Cre
dit/
ass
et va
lue r
atio
Legumesystems
Bananasystems
Cerealsystems
Total debt to assets ratio (indebtedness)
05
10
15
Share
off farm
(%
)
Legumesystems
Bananasystems
Cerealsystems
HH members in off farm employment (%)

A member of CGIAR consortium www.iita.org
Adaptability indicators 0
12
3
Num
ber
of cr
ops
gro
wn
Legumesystems
Bananasystems
Cerealsystems
Seasonal crop diversity
Long rain Short rain
01
23
4
# p
arc
els
and p
lots
opera
ted
Legumesystems
Bananasystems
Cerealsystems
# of different parcels/plots operated
Parcels Plots
020
40
60
80
Share
plo
ts p
rote
cted (
%)
Legumesystems
Bananasystems
Cerealsystems
Share of plot area protected by SCP (%)
05
10
15
20
25
# o
f tr
ees
Legumesystems
Bananasystems
Cerealsystems
Average # of trees per plot

A member of CGIAR consortium www.iita.org
05
10
15
20
25
Share
of plo
ts (
%)
Legumesystems
Bananasystems
Cerealsystems
Application of inorganic fertilizer
020
40
60
Share
of plo
ts (
%)
Legumesystems
Bananasystems
Cerealsystems
Application of organic manure
02
46
8
Share
of plo
ts (
%)
Legumesystems
Bananasystems
Cerealsystems
Application of pesticides & herbicides
020
40
60
80
Share
of plo
ts (
%)
Legumesystems
Bananasystems
Cerealsystems
Incorporation of crop resides
Adaptability indicators …

A member of CGIAR consortium www.iita.org
05
10
15
20
Share
of to
tal i
nco
me (
%)
Legumesystems
Bananasystems
Cerealsystems
Off-farm income (%)
0.5
1
# e
xtensi
on v
isits
Legumesystems
Bananasystems
Cerealsystems
Extension visits in 2 years
Adaptability indicators …

A member of CGIAR consortium www.iita.org
Productivity
Stability
Self-reliance
Adaptability
10
20
30
Sustainability scores in 25th quartileProductivity
Stability
Self-reliance
Adaptability
10
20
30
40
Median scores for sustainability
Productivity
Stability
Self-reliance
Adaptability
10
20
30
40
Sustainability scores in 75th quartile
Productivity
Stability
Self-reliance
Adaptability
10
20
30
Legume sytems
Banana systems
Cereal systems
Average scores for sustainability
Scores for sustainability attributes

A member of CGIAR consortium www.iita.org
10
20
30
40
50
Ove
rall
sust
ain
abili
ty in
dex
0 2 4 6 8log of FSR/FSSR
FSR FSSR
FSR FSSR
FS and FSS ratios
Legume based systems
10
20
30
40
Ove
rall
sust
ain
abili
ty in
dex
0 2 4 6 8log of FSR/FSSR
FSR FSSR
FSR FSSR
FS and FSS ratios
Banana based systems
10
20
30
40
Ove
rall
sust
ain
abili
ty in
dex
0 2 4 6 8log of FSR/FSSR
FSR FSSR
FSR FSSR
FS and FSS ratios
Cereal based systems
10
20
30
40
50
Ove
rall
sust
ain
abili
ty in
dex
0 2 4 6 8 10log of total consumable income/capita
Annual income per capita
Legume based systems
10
20
30
40
Ove
rall
sust
ain
abili
ty in
dex
0 2 4 6 8 10log of total consumable income/capita
Annual income per capita
Banana based systems
10
20
30
40
Ove
rall
sust
ain
abili
ty in
dex
0 2 4 6 8 10log of total consumable income/capita
Annual income per capita
Cereal based systems
Relationship between food security and
income
A member of CGIAR consortium www.iita.org
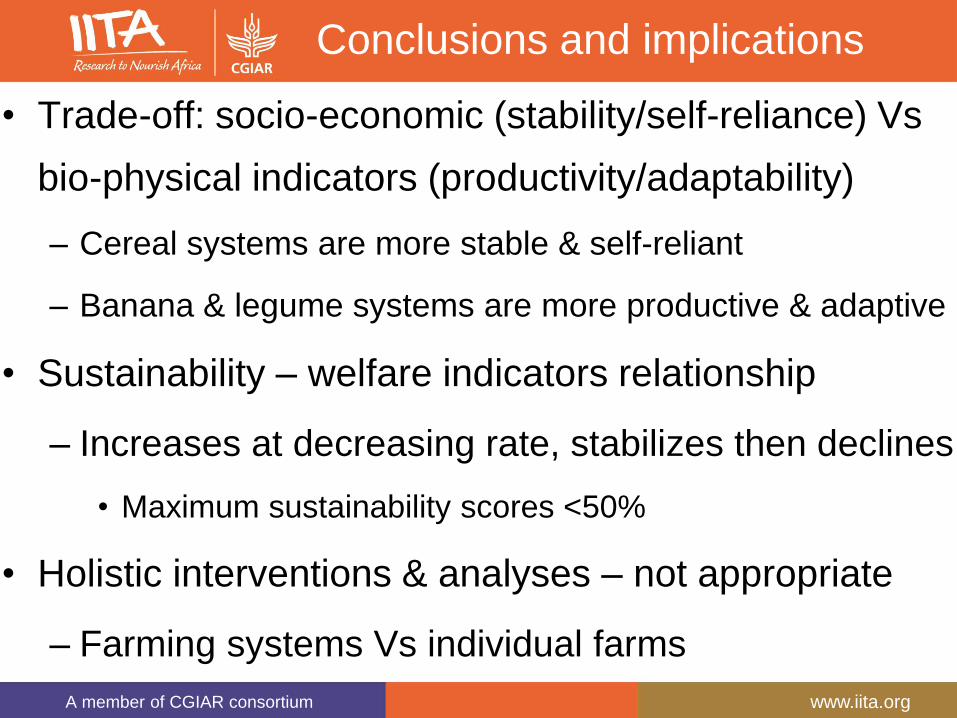
• Trade-off: socio-economic (stability/self-reliance) Vs
bio-physical indicators (productivity/adaptability)
– Cereal systems are more stable & self-reliant
– Banana & legume systems are more productive & adaptive
• Sustainability – welfare indicators relationship
– Increases at decreasing rate, stabilizes then declines
• Maximum sustainability scores <50%
• Holistic interventions & analyses – not appropriate
– Farming systems Vs individual farms
Conclusions and implications

A member of CGIAR consortium www.iita.org
THANK YOU