Embed Size (px)
Citation preview

FALL DETECTION PATTERN AND CLASSIFICATIONS IN ELDERLY PEOPLEUSING WIRELESS BODY AREA SENSORS NETWORK
A Thesis by: Moiz Ahmed AnsariBSCS-University of Karachi
Submitted to:Dr. Nadeem Mahmood

PROBLEM DEFINITION
Fall is a major problem which could lead to deaths in elderly people. It has become a major challenge in the public health care domain especially for the elderly people to tackle the falling events.
Therefore, number of researches include fall detection and classification for elderly people to decrease the rate of falls in elderly.
Majority of researches include wireless sensor platform for analyzing cases of falls in elderly people.

ABSTRACT
Fall is considered as one of the most common and prominent problem in elderly which has a massive impact on the lives of elderly. The number of systems aimed at detecting the falls has increased dramatically over recent years.
The purpose of this research was to use a body area sensor network to analyze falls in elderly. Real time data from Shimmer device could be the analysis for detection of certain activities of daily livings as well as certain cases of falls.
Feature selection is done in such a way that accelerometer and gyro meter data could be gathered from Shimmer device. Our dataset consist of the involvement of 118 subjects including 20 elder persons, which performs different activities.
Furthermore, a comparative study is made by analyzing data using different classification method such as SVM, KNN and Neural Network. A fuzzy classification is used to classify different responses on given activity based on fall detection. Regression and Correlation analysis are made to determine the relationship between different variables.

CONTENTS
INTRODUCTION
LITERATURE REVIEW
RESEARCH METHODOLOGY
DATA COLLECTION
ANALYSIS AND EVALUATIONS
RESULTS
CONCLUSION
REFERENCES

INTRODUCTION
BASIC DEFINITION OF FALL: Fall, according to (Pannurat et al. 2014) is defined as “an event which results in a person coming to repose unintentionally on the ground or any other lower surface”.
This definition has been adopted by many fall aversion and fall-risk assessment studies, and covers most types of falls targeted by fall detection research.
FALLS IN ELDERLY: The risks of fall related problem rises with respect to age. As old age people become physically weak, the risk of fall is more likely happen to them anytime.
A study at World Health Organization (Yoshida 2007) shows that more than 30-50% of older age people fall each year of which 10-20% of falls may lead to serious injuries and hospitalization which can also cause death (Rubenstein 2006).
Being in static position after fall can lead to pressure sores, muscle damage, dehydration, hypothermia and pneumonia (Lord et al. 2001).

INTRODUCTION
RISK FACTORS:
There are many situation which led to falls, we call them risk factors.
Risk factors are categorized in two types Intrinsic and Extrinsic.
Intrinsic factors are basically specific to particular patient which may put them in
increased risk factor, e.g. old age, muscle weakness, poor sight, fear of fall, chronic
problems etc..
Extrinsic factors depends on certain environmental conditions and deformities in
environment of elderly, e.g. poor stair design, dim lightning, slippery surfaces or
obstacles on the way, improper medication, improper use of assistive device, lack of
support in bathroom bars and stairways etc.

LITERATURE REVIEW
Publication Methodologies Devices Used Members Placement Parameters Type of Device
(Sposaro & Tyson,
2009)
Threshold Based Android phone N/A anywhere Accelerometer SINGLE
(Tacconi, et al.,
2011)
Threshold Based Smartphone 3 (young healthy;24-
26)
waist Tri-axial
accelerometer
SINGLE
(Dai, et al., 2010) Threshold Based
, Shape Context and
Hausdorff Distance
Smartphone Dummy + 15 (young
student; 20-30)
Chest, waist, thigh,
legs, pant/shirt
pockets
Accelerometer,
magnetometer
SINGLE
(Yavuz, et al., 2010) Discrete Wavelet
Transformation,
Threshold Based
Smartphone 5 healthy Pocket Accelerometer SINGLE
(Brezmes, et al.,
2010)
Pattern Recognition,
SVM
Smartphone Not mentioned anywhere Accelerometer,
magnetometer, light
sensor
SINGLE
(Kwolek & Kepski,
2015)
Threshold Based
, Image Recognition,
Extraction Based, KNN,
SVM
Kinect Sensors,
Smartphone
5 persons (over 26
yrs.)
pelvis Accelerometer,
depth sensors
MULTIPLE

LITERATURE REVIEW
Publication Methodologies Devices Used Members Placement Parameters Type of Device
(Ojetola, et al., 2015) Decision Tree Based Shimmer Sensor 42 volunteers Chest and thigh Accelerometer,
gyroscope
MULTIPLE
(Dau, et al., 2014) Genetic Programming,
Threshold Based
Smartphone 1(teen male) Tight/ Loose Pant
pockets
Accelerometer,
magnetometer,
gyroscope
SINGLE
(Rakhman, et al.,
2014)
Ubiquitous Based Smartphone N/A Left chest pocket Accelerometer,
gyroscope
SINGLE
(Feldwieser, et al.,
2014)
Falls Protocol Based Shimmer and
Kinect Sensor
28(66-89 yrs. elders) Front pelvis, other
fixed regions
Accelerometer, optic
and acoustic sensors
MULTIPLE
(Kansiz, et al., 2013) Decision Tree Based,
Naïve Bayes
smartphone 8 subjects pocket accelerometer SINGLE
(Soto-mendoza, et
al., 2015)
Decision Tree Based Smartphone,
fixed sensors for
acquiring images
19(non participation
interview based )
anywhere Accelerometer,
location sensors,
proximity, pressure
sensors
MULTIPLE
(Neggazi, et al.,
2014)
Compressive Sensing Intel Shimmer 5 (different ages; 22-
58)
Not mentioned Accelerometer, ECG,
gyroscope
MULTIPLE
33%
5%
5%5%9%
5%
5%5%
5%
14%
9%
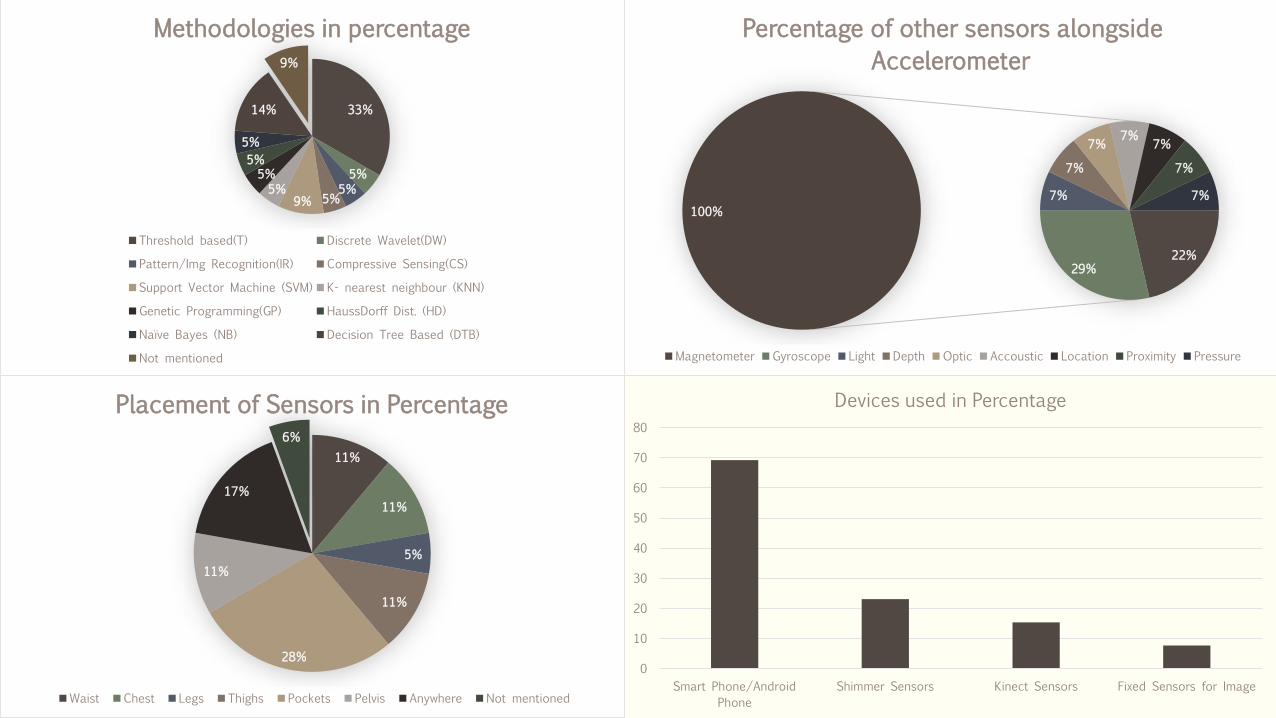
Methodologies in percentage
Threshold based(T) Discrete Wavelet(DW)
Pattern/Img Recognition(IR) Compressive Sensing(CS)
Support Vector Machine (SVM) K- nearest neighbour (KNN)
Genetic Programming(GP) HaussDorff Dist. (HD)
Naïve Bayes (NB) Decision Tree Based (DTB)
Not mentioned
22%29%
7%
7%
7%7%
7%
7%
7%
100%
Percentage of other sensors alongside
Accelerometer
Magnetometer Gyroscope Light Depth Optic Accoustic Location Proximity Pressure
11%
11%
5%
11%
28%
11%
17%
6%
Placement of Sensors in Percentage
Waist Chest Legs Thighs Pockets Pelvis Anywhere Not mentioned
0
10
20
30
40
50
60
70
80
Smart Phone/Android
Phone
Shimmer Sensors Kinect Sensors Fixed Sensors for Image
Devices used in Percentage

RESEARCH METHODOLOGY
In order to collect data for the analysis and detection of falls, we need some
hardware resources. Keeping in view the recent advancement and assessments in
Body Area Network (BAN) from our Literature Review Section, we aim to use a
Wireless Body Area Network (WBAN) platform to be used for our data collection. The
Wireless Sensor networks have been extensively studied in the last decade in the
context of environmental monitoring and target detection applications. Body area
networks represent a recent evolution of this technology for the development of an
emerging generation of human-computer interactions (HCIs) to provide natural and
context-vigilant access to personalized accommodations.

RESEARCH METHODOLOGY
SHIMMER DEVICE
Shimmer3 is very tiny, slim and most robust wearable wireless
sensor produced by Shimmer to date. It is a strong and well-
designed wearable wireless sensor which will provide superior
data quality, integrating value to your data accumulation
process. Shimmer is an open flexible platform intended for
qualified personal conducting research in wearable sensor
applications. Consequently, although great care was taken in
the design of this device, there is some inherent risk both with
the design and manufacturing that you assume when the
device is in close proximity to your body or the body of your
test subjects.

RESEARCH METHODOLOGY
APPLICATION OF SHIMMER DEVICE
Shimmer is reflected for wearable and remote sensing applications. The Shimmer unit is intended to be highly elastic and adjustable, simply fit in into prevailing systems and technologies. Due to its adjustability, the Shimmer platform is normally application agnostic. Shimmer is currently practiced in the following parts:
• Human Health Care
• Activities of Daily Living
• Associated health solutions
• Sport sciences
• Structural observing
• Environment and habitat monitoring

RESEARCH METHODOLOGY
A number of software are required for the data processing after being collected by
the Shimmer Device. These software ranges from collecting data to making analysis
and calculations on data.
In our research, we have used Microsoft Excel to visualize research literature
content. We have also used excel to import data collected from Shimmer device.
Since, shimmer itself generate data to csv format, therefore it is easier to display
data in grid of cells using spreadsheet program like excel.

RESEARCH METHODOLOGY
We have used MATLAB to visualize data by scatter plots and mesh plots and
analyze the data using different classifiers such as SVM, KNN and Neural Network.
We have also determined the accuracy of those classifiers using built-in MATLAB
functions. Also we have applied fuzzy logic in MATLAB to generate responses for
given activity.
R is a programming language used for statistical computation. For our research, we
have used R to compute many statistical operations including regression and
correlation analysis. We have also plot regression and correlation of elderly data to
evaluate relationship between variables.

DATA COLLECTION
• We performed several activities to collect data using shimmer device. Keeping in
view that our activities contain such activities which are performed by elderly on
regular basis. Also making data simple, we include merged activities as well as
single activity. Here’s the list of several activities performed by us.
• We considered different locations for collecting data. It includes Federal Urdu
University of Arts Science and Technology (Karachi), Sheikh Zayed Special
Education Centre (University of Karachi) and Old home Dar-ul-sukoon for elder
people.

DATA COLLECTION
• In standing posture, we took sample of shimmer data in standing position. The person is to stand straight for 5-6 seconds without any movement. In our data set, 115 samples of standing posture are collected.
• In sitting posture, a person first stand and then eventually sit. This process is repeated 3-4 times for a person. In our dataset, 120 samples of sitting posture are collected.

DATA COLLECTION
• In walking posture, a person walks from one corner of the wall to another corner in horizontal direction. The distance between both of the corners is approximately 5-6 meters. In our dataset, 115 samples of walking posture are collected.
• In falling posture, we took sample of 4 persons. In our dataset, a total of 5 falls are collected.

DATA COLLECTION
WEIGHT GROUPS:
Here’s a quick summary about weight groups of our dataset:
From 30-39 kg: 2 persons involved, all females.
From 40-49 kg: 22 persons involved including 17 females.
From 50-59 kg: 21 persons involved including 11 females.
From 60-69 kg: 32 persons involved including 8 females.
From 70-79 kg: 18 persons involved including 5 females.
From 80-89 kg: 13 persons involved including 3 females.
From 90-99 kg: 6 persons involved including 1 female.

DATA COLLECTION
AGE GROUPS:
Here’s a quick summary about age groups of our dataset:
From 11-20 years: 6 persons involved, 3 males and 3 females.
From 21-30 years: 63 persons involved including 34 males and 29 females.
From 31-40 years: 16 persons involved including 3 females.
From 41-50 years: 10 persons involved including 5 females.
Greater than 50 years (seniors-main group): 19 persons involved including 6
females and out of them 1 female is over 70 years of age.

DATA COLLECTION
SYSTEM ARCHITECTURE:

DATA COLLECTION
DATA FLOW DIAGRAM:

DATA COLLECTION
USE CASE DIAGRAM:

ANALYSIS AND EVALUATIONS
In analysis phase, we have used several algorithm to classify our dataset and then
predict the result on the basis of that algorithm.
In our classifiers, we have used KNN, SVM and Neural Network for supervised
learning approach in which each observation from the dataset is assigned a label or
response. It is then the job of classification model to learn to predict a label or
response when given a predictor data.
The application of supervised learnings include spam detection, speech recognition,
stock price forecasting, advertisement recommendations, pattern recognitions and
others.

ANALYSIS AND EVALUATIONS
STEPS IN SUPERVISED LEARNING:
Step 1
Train Data
Prepare a data from given data set.
Prepare responses for each observation.
Prepare a model for that data, based on classifier.
Step 2
Classify Data
By using model from training data, find a separator.
This separator should classify from all the response classes
for given data set.
Classify data using new data points and find the region
where they lie.
Step 3
Validate Data
Find the accuracy of the model by using different
validation method for a given model.
Examine the cross-validation error by using different
validation method for a given model.

ANALYSIS AND EVALUATIONS
Support Vector machine (SVM):
An SVM classifies data by finding the hyperplane on the basis of best fit margin and separates data point of one class from the other.
The mathematical definition for SVM is given as:
Given a training dataset of k points, 𝑦𝑖 , 𝑥𝑖 𝑖=1𝑘 , where xi is the ith input pattern and yi is the
ith output pattern, then the support vector machine approach tends to use the following classifier form:
𝑦 𝑥 = 𝑠𝑖𝑔𝑛
𝑖=1
𝑘
𝛼𝑖 𝑦𝑖𝜓 𝑥, 𝑥𝑖 + 𝑏
This classifier is constructed from the following assumption:𝑤𝑡𝜑 𝑥𝑖 + 𝑏 ≥ 1, 𝑖𝑓 𝑦𝑖 = 𝑃𝑤𝑡𝜑 𝑥𝑖 + 𝑏 ≤ −1, 𝑖𝑓 𝑦𝑖 = 𝑁
which is equivalent to 𝑦𝑖 𝑤𝑡𝜑 𝑥𝑖 + 𝑏 ≥ 1,𝑤ℎ𝑒𝑟𝑒 𝑖 = 1,… , 𝑘 (Suykens & Vandewalle 1999).

ANALYSIS AND EVALUATIONS
Support Vector Machine (SVM):
In our dataset, there are a number of multiple classes therefore it is quite difficult to use binary SVM classifier. In order to attain our objective, we have used multi class SVM classifiers and made classification regions.
ANALYSIS AND EVALUATIONS
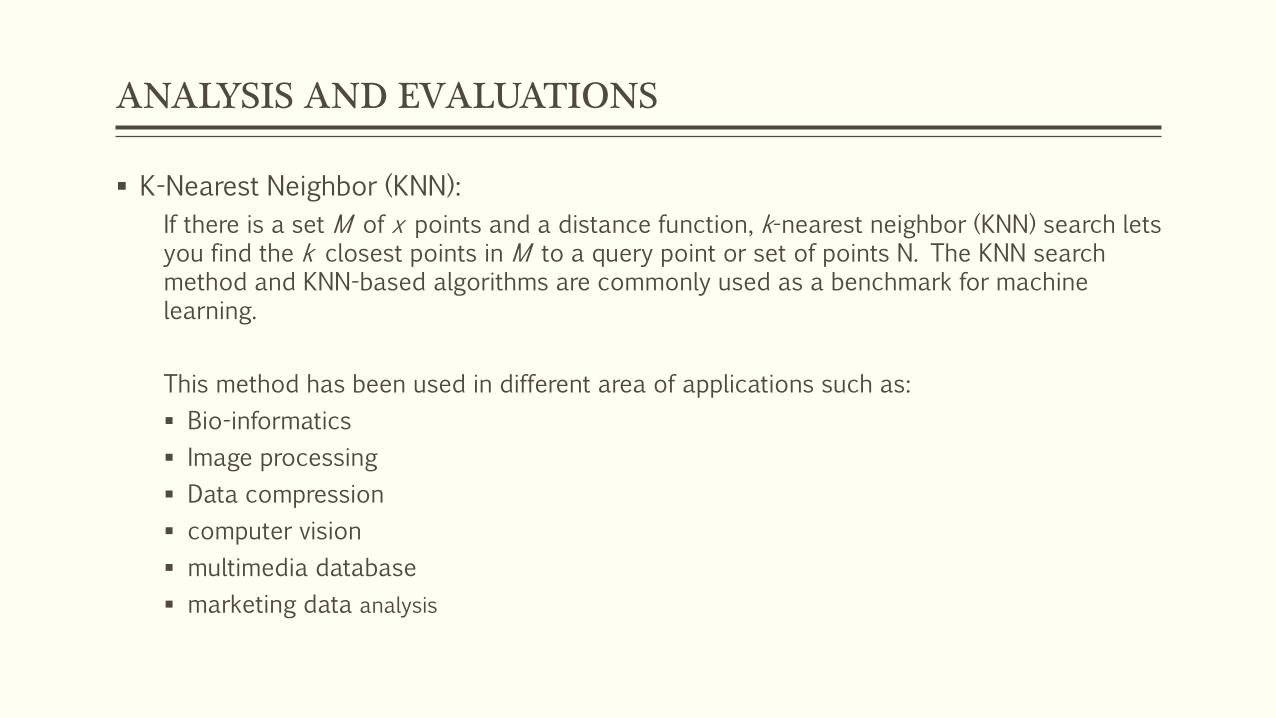
K-Nearest Neighbor (KNN):
If there is a set M of x points and a distance function, k-nearest neighbor (KNN) search lets you find the k closest points in M to a query point or set of points N. The KNN search method and KNN-based algorithms are commonly used as a benchmark for machine learning.
This method has been used in different area of applications such as:
Bio-informatics
Image processing
Data compression
computer vision
multimedia database
marketing data analysis

ANALYSIS AND EVALUATIONS
K-Nearest Neighbor (KNN):
In our dataset, we have used KNN to find the n-nearest neighbor (the n must be specified by user). The steps for KNN algorithm are given below:
1. Find the points in the train set X that are closest to Xnew.
2. Find the response values for those closest point.
3. Assign the classification label Ynewthat has the highest posterior probability amongst responses Y.

ANALYSIS AND EVALUATIONS
Neural Network:
Neural networks consist of simple elements functioning in parallel. These elements are motivated by biological nervous systems.
Normally, neural networks are accommodated, or trained, so that a specific input leads to exact target output, irrespective of the number of input and outputs.
A hidden layer can act as a connector between input/output pairs.

ANALYSIS AND EVALUATIONS
Neural Network:
In our dataset, we have used neural network for classifying the different activities
Input Vectors are arranged in 6 columns i.e. accelerometer in x-axis, y-axis and z-axis respectively, similarly gyroscope in x, y, z axis respectively.
Target Output include the 3 ADL (sit, stand, walk) used.

ANALYSIS AND EVALUATIONS
We have analyzed our various classifiers and then tabulated the result on the basis of these analysis.
We have used SVM, KNN and Neural Networks and calculate their accuracy based on different validation functions.
We have classified the data of these classifiers into Weight and Age group as specified in our Data collection section.
Accuracy based
on
SVM
Linear
SVM
Gaussian
KNN Neural
Network
Age 11-20 53.1% 88.3% 88.2% 76.9%
Age 21-30 36.2% 69.4% 74.1% 42.4%
Age 31-40 46.4% 88.2% 91.4% 52.6%
Age 41-50 44.1% 86.7% 87.9% 63.6%
Age above 51 47.8% 86.1% 90.3% 48.2%
Accuracy based
on
SVM
Linear
SVM
Gaussian
KNN Neural
Network
Weight 30-39 67% 88.7% 86.7% 79.5%
Weight 40-49 38.9% 68.5% 72.8% 46.9%
Weight 50-59 43.7% 82.9% 84.8% 45.6%
Weight 60-69 41.5% 72.6% 80.9% 48%
Weight 70-79 48.2% 89.0% 92.5% 50.7%
Weight 80-89 40.3% 70.6% 80.9% 47.4%
Weight 90-99 49.3% 90.6% 93.2% 76.3%

ANALYSIS AND EVALUATIONS
FUZZY LOGIC:
Till now, we have classified our data based on different classifiers and different activities are performed based on our data set.
As we have different sets of data available in our datasets we are eager to find the response after correctly predicting the class from the classifiers. To achieve this task, we have used fuzzy logic theory.
Fuzzy Logic is an extension of multi-valued logic (Zadeh 1988), a logic in which there exist more than one truth values for any variable. Usually, the values may range between 0 and 1 for a variable.
It is a method of reasoning which ensembles human reasoning.
The fuzzy logic mechanism works on the periods of chances of input to attain a definite output.

ANALYSIS AND EVALUATIONS
FUZZY LOGIC:
Fuzzy Logic is based on four main parts:
Fuzzification
Membership Functions
Fuzzy Inference Engine
Defuzzification

ANALYSIS AND EVALUATIONS
FUZZY LOGIC
FUZZIFICATION:
Fuzzy logic start with the theory of a fuzzy set (Zadeh 1965). A fuzzy set is a set without any crisp that is having a clearly defined boundary, for example tall, medium, small. It can cover components with only a limited degree of membership.
To know what a fuzzy set is, first study the meaning of a classical set. A classical set is believed to be a container that completely includes or completely excludes any given component. Therefore, fuzzy theory also says that ‘for any subject, one thing must either be taken or ignored’.
Now in our dataset, we have included different responses for the activities in fuzzy sets. For example, for different activities such as sit, stand, walk and fall, there are different responses from a fuzzy set such as fine, ok and urgent.

ANALYSIS AND EVALUATIONS
FUZZY LOGIC
MEMBERSHIP FUNCTIONS:
A curve that defines how clear is an element of fuzzy set from other elements of the same fuzzy set. In other words, membership function allows to quantify graphically the elements from a fuzzy set.
The input space from which these elements are mapped is mentioned as universe of discourse.
There can be any number of membership function, usually more than one, to distinguish between other fuzzy elements. The membership function area must be in the range from 0-1, an element that mapped between these values is called a degree of membership.

ANALYSIS AND EVALUATIONS
FUZZY LOGIC
MEMBERSHIP FUNCTIONS:
From the given definition of membership function, we have set the membership function for our 4 activities and 3 responses as shown:

ANALYSIS AND EVALUATIONS
FUZZY LOGIC
FUZZY INFERENCE ENGINE:
From the above fuzzy inputs and membership functions, now we have to define Logics to achieve fuzzy outputs.
This process is done using fuzzy inference engine in which Logical building using simple If-Then rules is done, sometimes for more input functions And-Or logic is also used.
In our case, we have used 8 rules to accommodate our responses for each activity as shown

ANALYSIS AND EVALUATIONS
FUZZY LOGIC
DEFUZZIFICATION:
After the fuzzy inference of fuzzy inputs, the fuzzy output comes in range as defined by membership function.
To overcome this, defuzzificationprocess assign each output a value so that it can be easy to understand.
In the given figure, it clearly indicate as our Rule 4 is true, i.e. a fall occurs then the fuzzy output value for response clearly indicated that the response lies in urgent region.

ANALYSIS AND EVALUATIONS
REGRESSION AND CORRELATION:
In order to obtain the relationship between our dataset, we have also performed correlation and regression analysis using R programming language.
Correlation illustrates a quantitative measure of some type of dependence between two variables.
For correlation analysis, we have used Pearson’s Product Moment Correlation Coefficient (PPMCC) which is strength of linear relationship between two variables.
Following commands are used to generate correlation plot on R:
library(corrgram)
corrgram(seniorsData,lower.panel=NULL, upper.panel=panel.conf)

ANALYSIS AND EVALUATIONS
REGRESSION AND CORRELATION:
Following command in R is used to generate correlation matrix and P-values for the Sensors Data in R:
library(Hmisc)
rcorr(as.matrix(seniorsData[,2:7]))

ANALYSIS AND EVALUATIONS
REGRESSION AND CORRELATION:
Regression is used to estimate the
relationship between two variables by
fitting linear equation to observed
data.
For the regression analysis, we have
used linear model. Following
commands in R is used to obtain
regression plot:
regmodel<-lm(formula=seniorsData)
par(mfrow=c(2,2))
plot(regmodel)

RESULTS
This research has evaluated classification of data using supervised learning approach. Classifications of SVM, KNN and Neural Network are visualized. It is seen through the comparison evaluated after analysis phase that KNN has slightly higher accuracy as compared to other classifiers based on age and weight groups.
0.00%
20.00%
40.00%
60.00%
80.00%
100.00%
Age 11-20 Age 21-30 Age 31-40 Age 41-50 Age above 51
Comparison Of Classifiers based on Age
Groups
SVM Linear SVM Gaussian KNN Neural Network
0%
20%
40%
60%
80%
100%
Weight 30-
39
Weight 40-
49
Weight 50-
59
Weight 60-
69
Weight 70-
79
Weight 80-
89
Weight 90-
99
Comparison Of Classifiers based on Weight
Groups
SVM Linear SVM Gaussian KNN Neural Network
RESULTS
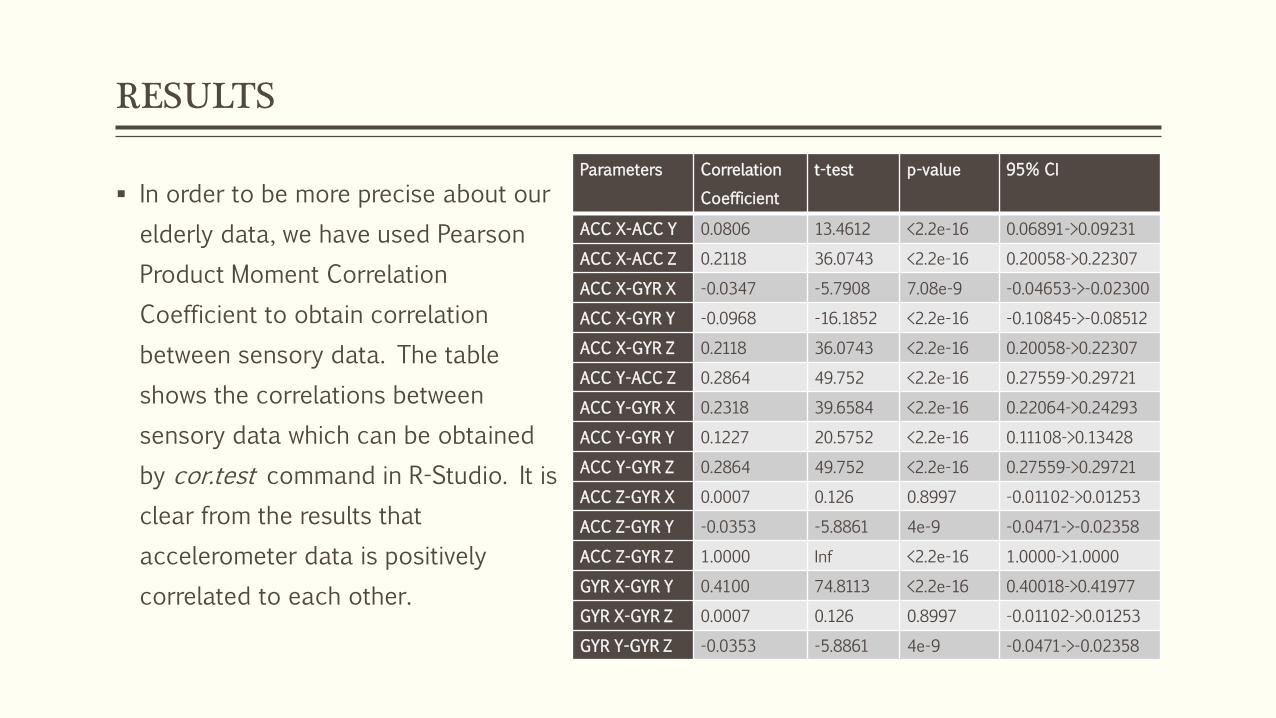
In order to be more precise about our
elderly data, we have used Pearson
Product Moment Correlation
Coefficient to obtain correlation
between sensory data. The table
shows the correlations between
sensory data which can be obtained
by cor.test command in R-Studio. It is
clear from the results that
accelerometer data is positively
correlated to each other.
Parameters Correlation
Coefficient
t-test p-value 95% CI
ACC X-ACC Y 0.0806 13.4612 <2.2e-16 0.06891->0.09231
ACC X-ACC Z 0.2118 36.0743 <2.2e-16 0.20058->0.22307
ACC X-GYR X -0.0347 -5.7908 7.08e-9 -0.04653->-0.02300
ACC X-GYR Y -0.0968 -16.1852 <2.2e-16 -0.10845->-0.08512
ACC X-GYR Z 0.2118 36.0743 <2.2e-16 0.20058->0.22307
ACC Y-ACC Z 0.2864 49.752 <2.2e-16 0.27559->0.29721
ACC Y-GYR X 0.2318 39.6584 <2.2e-16 0.22064->0.24293
ACC Y-GYR Y 0.1227 20.5752 <2.2e-16 0.11108->0.13428
ACC Y-GYR Z 0.2864 49.752 <2.2e-16 0.27559->0.29721
ACC Z-GYR X 0.0007 0.126 0.8997 -0.01102->0.01253
ACC Z-GYR Y -0.0353 -5.8861 4e-9 -0.0471->-0.02358
ACC Z-GYR Z 1.0000 Inf <2.2e-16 1.0000->1.0000
GYR X-GYR Y 0.4100 74.8113 <2.2e-16 0.40018->0.41977
GYR X-GYR Z 0.0007 0.126 0.8997 -0.01102->0.01253
GYR Y-GYR Z -0.0353 -5.8861 4e-9 -0.0471->-0.02358

RESULTS
We have also performed performance evaluation based metrics on the basis of sensitivity and
specificity. Sensitivity is the capability of identifying all the true positives can be measured
as:
𝑠𝑒𝑛𝑠𝑖𝑡𝑖𝑣𝑖𝑡𝑦 =𝑇𝑟𝑢𝑒 𝑃𝑜𝑠𝑖𝑡𝑖𝑣𝑒𝑠
𝑇𝑟𝑢𝑒 𝑃𝑜𝑠𝑖𝑡𝑖𝑣𝑒𝑠 + 𝐹𝑎𝑙𝑠𝑒 𝑁𝑒𝑔𝑎𝑡𝑖𝑣𝑒𝑠
Whereas, specificity is the capability of identifying all the true negatives can be measured as:
𝑠𝑝𝑒𝑐𝑖𝑓𝑖𝑐𝑖𝑡𝑦 =𝑇𝑟𝑢𝑒 𝑁𝑒𝑔𝑎𝑡𝑖𝑣𝑒𝑠
𝑇𝑟𝑢𝑒 𝑁𝑒𝑔𝑎𝑡𝑖𝑣𝑒𝑠 + 𝐹𝑎𝑙𝑠𝑒 𝑃𝑜𝑠𝑖𝑡𝑖𝑣𝑒𝑠
The sensitivity of elderly data came out to be 91.6% and specificity is 88.67%.

CONCLUSION
The present research study identified fall detection patterns in elderly people using wireless body area sensors network. In this study a total of 118 person involved in collecting data. The data is classified in weights and age group. This research study evaluated different procedures for fall detection in elderly. In this study, supervised learning approach is used to classify data in which SVM, KNN and Neural Network classification are used. The data is visualized using SVM and KNN classification. The results of this study identified KNN as the most accurate classifier with an accuracy of 86.8% for age groups and 84.54% for weight groups.
This study also evaluated fuzzy logic approach to obtain response values for correctly classified activity. It is identified after giving the membership functions and fuzzy inference rule the correct response for the activities performed in this study. Correlation and regression based analysis in this research are used to find the relationship of different sensor parameters used by Shimmer. From the results, it is shown that the sensory data of accelerometer is highly correlated. Also, this study presented a performance evaluation study for KNN classifiers and it comes out as 91.6% sensitivity and 88.6% specificity of elderly data.

CONCLUSION
However, there are certain limitations for this study, the most prominent is the use of few
activities in ADLs. Also this research doesn’t majorly focus on falling data, i.e., only 5 falling
events from healthy subjects are collected which does affect the sensitivity and specificity of
the data. Furthermore, after feature extraction only accelerometer and gyro meter data is
extracted for feature selection.
In the future, we are aiming to extend this research for more ADLs which can include a
detailed events for falling data. Also, we can add more sensor parameters to identify data
with more efficiency.

REFERENCES
1. Pannurat, N., Thiemjarus, S. & Nantajeewarawat, E., 2014. Automatic fall monitoring: a review. Sensors (Basel, Switzerland), 14(7), pp.12900–12936.
2. Gillespie, L.D. et al., 2009. Interventions for preventing falls in older people living in the community. The Cochrane database of systematic reviews, (2), p.CD007146. Available at: http://www.ncbi.nlm.nih.gov/pubmed/19370674.
3. “Shimmer-Discovery in motions”, available at: http://www.shimmersensing.com.
4. Lord, S.R., Sherrington, C. & Menz, H.B., 2001. Falls in older people: epidemiology, risk factors and strategies for prevention. Age and ageing, 35 Suppl 2, pp.3–107. Available at: http://www.ncbi.nlm.nih.gov/pubmed/16926202.
5. Menz, H. & Lord, S., 1999. Foot problems, functional impairment, and falls in older people. Journal of the American Podiatric Medical Association, 89(9), pp.458–467. Available at: http://www.japmaonline.org/doi/abs/10.7547/87507315-89-9-458.

REFERENCES
6. Mitty, E. & Flores, S., 2007. Fall Prevention in Assisted Living: Assessment and Strategies. Geriatric Nursing, 28(6), pp.349–357. Available at: http://www.gnjournal.com/article/S0197457207003060/fulltext.
7. Rubenstein, L.Z., 2006. Falls in older people: Epidemiology, risk factors and strategies for prevention. Age and Ageing, 35(SUPPL.2), pp.37–41.
8. Suykens, J.A.K. & Vandewalle, J., 1999. Least Squares Support Vector Machine Classifiers. Neural Processing Letters, 9(3), pp.293–300. Available at: http://link.springer.com/article/10.1023/A%3A1018628609742.
9. Kotsiantis, S.B., 2007. Supervised machine learning: A review of classification techniques. Informatica, 31, pp.249–268. Available at: http://books.google.com/books?hl=en&lr=&id=vLiTXDHr_sYC&oi=fnd&pg=PA3&dq=survey+machine+learning&ots=CVsyuwYHjo&sig=A6wYWvywU8XTc7Dzp8ZdKJaW7rc\npapers://5e3e5e59-48a2-47c1-b6b1-a778137d3ec1/Paper/p800\nhttp://www.informatica.si/PDF/31-3/11_Kotsiantis - S.
10. Tinetti, M.E. et al., 1994. Fear of Falling and Fall-Related Efficacy in Relationship to Functioning Among Community-Living Elders. Journal of Gerontology, 49(3), pp.M140–M147. Available at: http://geronj.oxfordjournals.org/content/49/3/M140.short.

REFERENCES
11. Who, 2007. WHO Global Report on Falls Prevention in Older Age. Community Health, p.53. Available at: http://www.who.int/ageing/publications/Falls_prevention7March.pdf.
12. Yoshida, S., 2007. A Global Report on Falls Prevention Epidemiology of Falls. WHO report, pp.1–40.
13. Zadeh, L.A., 1988. Fuzzy logic. IEEE Computer Society, pp.83–93. Available at: http://www.geocities.ws/hhvillav/00000053.pdf.
14. Zadeh, L.A., 1965. Fuzzy sets. Information and Control, 8(3), pp.338–353. Available at: http://www.sciencedirect.com/science/article/pii/S001999586590241X.
15. “Matlab Mathworks Documentation for Supervised Learning workflow and algorithms”, http://www.mathworks.com/help/stats/supervised-learning-machine-learning-workflow-and-algorithms.html
16. ‘” Matlab Mathworks Documentation for Neural Networks overview”, http://www.mathworks.com/help/nnet/gs/neural-networks-overview.html
17. Bourke, A. K., O'Brien, J. V. & Lyons, G. M., 2007. Evaluation of a threshold-based tri-axial accelerometer fall detection algorithm. Gait and Posture, pp. 194-199.

REFERENCES
18. Brezmes, T., Rersa, M., Gorricho, J. L. & Cotrina, J., 2010. Surveillance with alert management system using conventional cell phones. Proceedings - 5th International Multi-Conference on Computing in the Global Information Technology, ICCGI 2010, pp. 121-125.
19. Dai, J. et al., 2010. Mobile phone-based pervasive fall detection. Personal and Ubiquitous Computing, pp. 633-643.
20. Dau, H. A. et al., 2014. Phone based Fall Detection by Genetic Programming. Newyork, ACM, pp. 256-257.
21. Feldwieser, F. et al., 2014. Multimodal sensor-based fall detection within the domestic environment of elderly people. Zeitschrift für Gerontologie und Geriatrie-Springer, pp. 661-665.
22. Kansiz, a. O., Guvensan, M. A. & Turkmen, H. I., 2013. Selection of Time-Domain Features for Fall Detection Based on Supervised Learning. Science, pp. 23-25.
23. Kwolek, B. & Kepski, M., 2015. Improving fall detection by the use of depth sensor and accelerometer. Neurocomputing, pp. 637-645.
24. Neggazi, M., Hamami, L. & Amira, A., 2014. Efficient Compressive Sensing on the Shimmer Platform for Fall Detection. Melbourne VIC, IEEE, pp. 2401-2404

REFERENCES
25. Ojetola, O., Gaura, E. & Brusey, J., 2015. Data Set for Fall Events and Daily Activities from Inertial Sensors. Newyork, ACM, pp. 243-248.
26. Rakhman, A. Z., Kurnianingsihi, Nugrohoi, L. E. & Widyawan, 2014. u-FASt : Ubiquitous Fall Detection and Alert System for Elderly People in Smart Home Environment u-F ASt : Ubiquitous Fall Detection and Alert System for Elderly People in Smart Home Environment. Makassar, IEEE, pp. 136-140.
27. Soto-mendoza, V. et al., 2015. Design of a Predictive Scheduling System to Improve Assisted Living. ACM Transactions on Intelligent Systems and Technology (TIST) - Regular Papers and Special Section on Intelligent Healthcare Informatics, pp. 1-31.
28. Sposaro, F. & Tyson, G., 2009. iFall: An android application for fall monitoring and response. Minneapolis, MN, IEEE, pp. 6119-6122.
29. Tacconi, C., Mellone, S. & Chiari, L., 2011. Smartphone-based applications for investigating falls and mobility. Dublin, IEEE, pp. 258-261.
30. Yavuz, G. R. et al., 2010. A Smartphone Based Fall Detector with Online Location Support. International Workshop on Sensing for App Phones, pp. 31-35.