Embed Size (px)
Citation preview

Exploring more exotic patterns in data
1

It’s all about me…
Prof. Mark Whitehorn Emeritus Professor of Analytics
School of Computing
University of Dundee
Consultant
Writer (author)
2

It’s all about me… School of Computing Teach Masters in: Data Science Part time - aimed at existing data professionals
Data Engineering
3
Agenda
• Monte Carlo Simulations
• R
• Benford’s distribution
4

Agenda
Patterns in data should not be seen as individual,
disconnected techniques/approaches
Rather they are synergistic
5

Probabilities can tell us a great deal
Sales people talking to customer
Analytical rules say, not product A, but product B or C
B Net value £90 – Probability of acceptance 0.54
C Net value £200 – Probability of acceptance 0.32
Which is the best option (from our point of view) to offer
the customer?
6

Probabilities can tell us a great deal
Probabilities tell us:
B 90 * 0.54 = £48.6
C 200 * 0.32 = £64.0
The best option is C
7
We can use probabilities to deal with certain levels of complexity
However, there are times when these will fail to answer our
questions.
8

Web sites
People visit our website
They land on a page
From there they can:
• Disappear to another site (or close the browser)
• Follow a link to another of our pages
• Click on an advertisement
Web sites
Advertisements on web pages annoy some (most) people
The more advertisements, the more people are more
inclined to disappear
On the other hand, if they see one that appeals, they will
click on it and we make money

Web sites
We can classify our users into many groups, but let’s focus
on Senior Citizens and Bright Young Things (SCs and BYTs).
They visit our different web pages with differing frequency.
Web sites
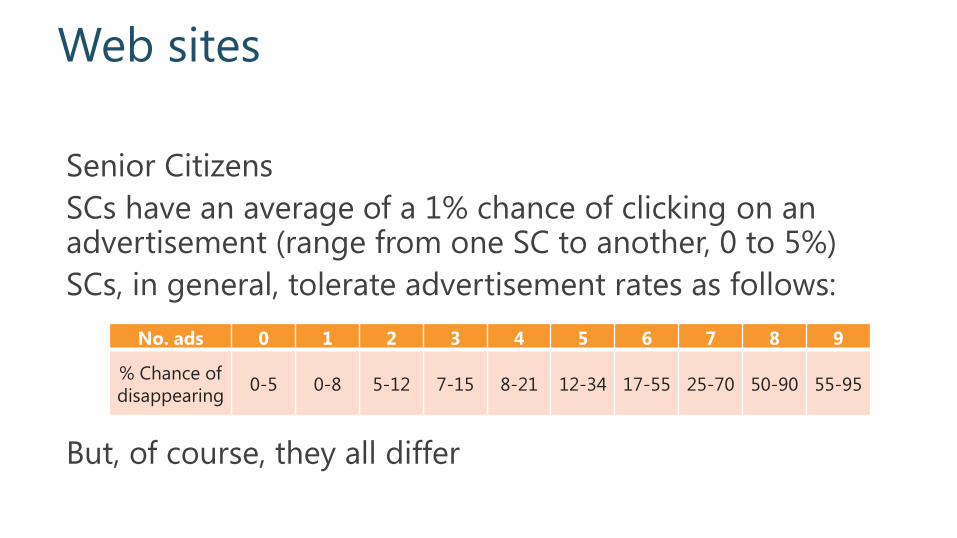
Senior Citizens
SCs have an average of a 1% chance of clicking on an advertisement (range from one SC to another, 0 to 5%)
SCs, in general, tolerate advertisement rates as follows:
But, of course, they all differ
No. ads 0 1 2 3 4 5 6 7 8 9
% Chance of
disappearing 0-5 0-8 5-12 7-15 8-21 12-34 17-55 25-70 50-90 55-95

Web sites
Bright Young Things
BYT follow 3% of adverts on average (range 0 to 10)
BYTs, in general, tolerate advertisement rates as follows:
But, of course, they all differ as well
No. ads 0 1 2 3 4 5 6 7 8 9
% Chance of
disappearing 0-3 0-4 0-11 3-13 5-15 7-23 11-30 15-34 17-39 21-55
Web sites
We have around 70% SCs and 30% BYTs at any one time.
And, in practice, there are several other factors we have to
consider: Time of day
Type of advertisement
Prior history of the people
What is the best number of adverts per page?

Web sites
I don’t think I can write an equation to solve this nor solve
it with a probability calculation (you may be able to).
But that is OK, we have another trick up our collective
sleeves – the Monte Carlo method.
Monte Carlo simulations
Think of a Monte Carlo simulation as a way to mimic
some aspect of real life in a computer model. These
models typically make use of random numbers.
16 16
Monte Carlo simulations
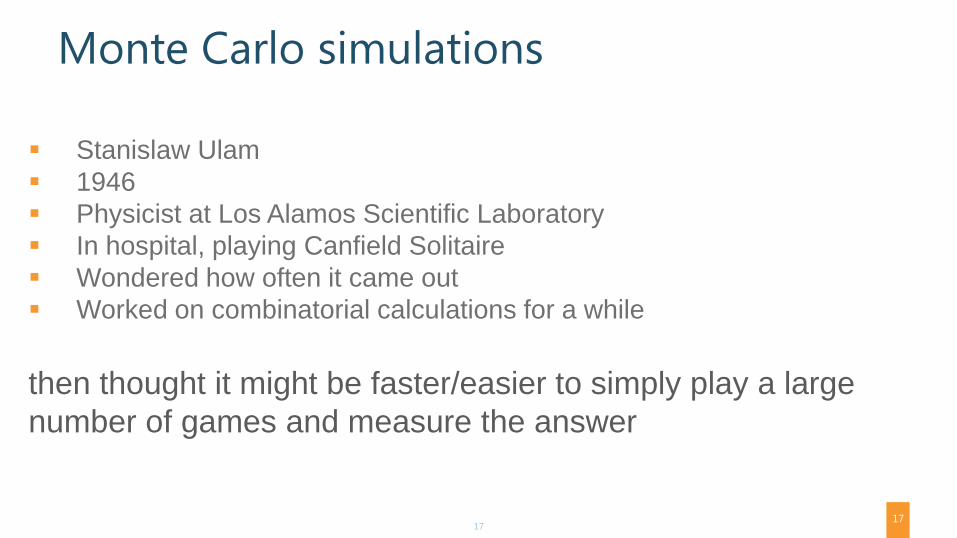
Stanislaw Ulam
1946
Physicist at Los Alamos Scientific Laboratory
In hospital, playing Canfield Solitaire
Wondered how often it came out
Worked on combinatorial calculations for a while
then thought it might be faster/easier to simply play a large
number of games and measure the answer
17 17
Monte Carlo simulations
18

“The question was what are the chances that a Canfield solitaire
laid out with 52 cards will come out successfully? After spending
a lot of time trying to estimate them by pure combinatorial
calculations, I wondered whether a more practical method than
‘abstract thinking’ might not be to lay it out say one hundred times
and simply observe and count the number of successful plays.”
Monte Carlo Quotes
19 19

Monte Carlo Quotes
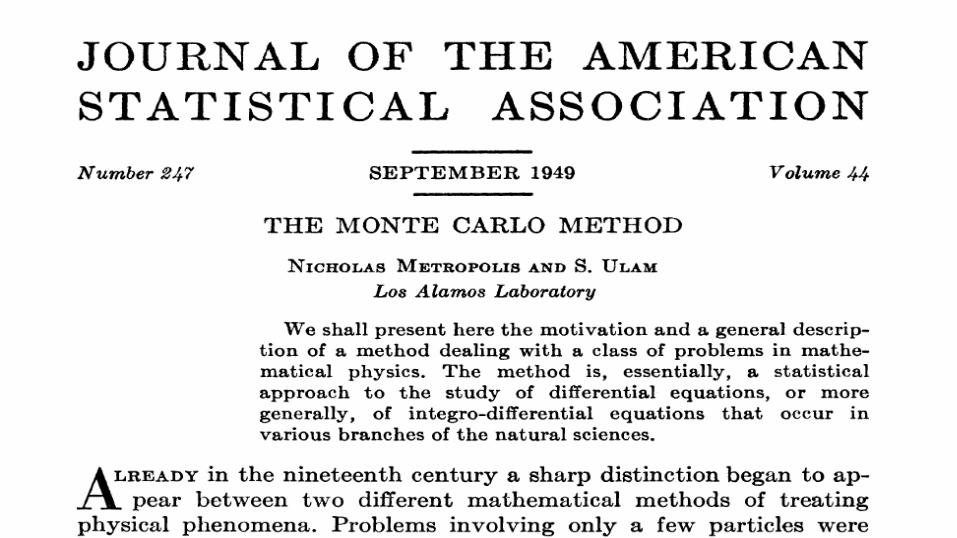
This was already possible to envisage with the beginning of the
new era of fast computers, and I immediately thought of problems
of neutron diffusion and other questions of mathematical physics,
and more generally how to change processes described by
certain differential equations into an equivalent form interpretable
as a succession of random operations. Later [in 1946], I
described the idea to John von Neumann, and we began to plan
actual calculations.”
20 20
Monte Carlo – where I first came across it
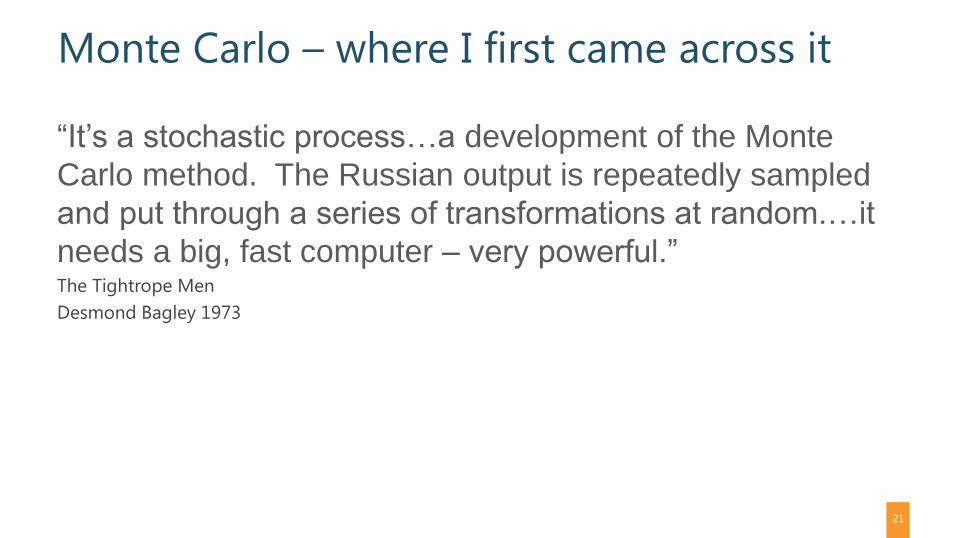
“It’s a stochastic process…a development of the Monte
Carlo method. The Russian output is repeatedly sampled
and put through a series of transformations at random.…it
needs a big, fast computer – very powerful.” The Tightrope Men
Desmond Bagley 1973
21

Deterministic systems/processes have a
known (and repeatable) outcome from a
given starting point.
Probabilities tell us:
B 90 * 0.54 = $48.6
C 200 * 0.32 = $64.0
The best option is
always C
A = B + C
If B = 6 and C=4 then
A=10
every single time
Deterministic
22

Stochastic systems/processes display a
level of indeterminacy. From the same
starting point it is possible to reach a
number (possibly infinite) of outcomes.
It is to provide that level of indeterminacy
in practice that we use random numbers.
Stochastic (as opposed to deterministic)
23

Monte Carlo method
As a general rule you need to:
Define a domain of possible inputs
Generate a set of inputs
These should be randomly chosen correctly from the domain
(more later)
Perform some computation on the inputs
Aggregate the results
Draw a conclusion
Perform reality check
24
24

Random walks
The web-based problem is perfectly soluble with a MCS
but let’s solve another which is far more visual.

Monte Carlo – random walks
Some people, including Einstein, were/are fascinated by
‘random walks’
What is a random walk?
Why are they so fascinating?
Random walks are very easy
to investigate using a
Monte Carlo model.
26
26
You don’t have to be Einstein to answer this one
But first, an apparent non-sequitur:
“Why is a gas-powered fridge like a random walk?”

28
REFRIGERATION Filed Dec. 16 1927
Patented Nov. 11, 1930 UNITED STATES
PATENT OFFICE ALBERT EINSTEIN, OF
BERLIN, AND LEO SZILARD, OF BERLIN-
WILMERSDORF, GERMANY

Back to our general outline.
How far, on average, will a random walk take you after n
steps? What is the domain?
How will you draw values from the domain?
What calculation will you perform?
How will you aggregate?
What is your conclusion?
Does it sound reasonable?
29

Back to our general outline.
How far, on average, will a random walk take you after n
steps? What is the domain? (N,E,S,W)
How will you draw values from the domain? (0.25 for each at random)
What calculation will you perform? (measure distance from origin)
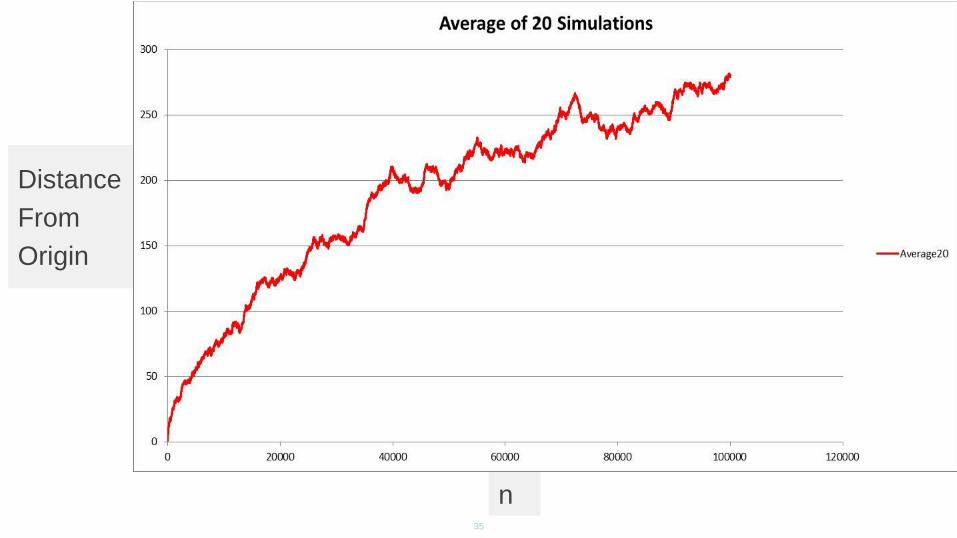
How will you aggregate? (Perform multiple simulations)
What is your conclusion? (Let’s see)
Does it sound reasonable?
30

Time for a demo
31

32
Distance
From
Origin
n
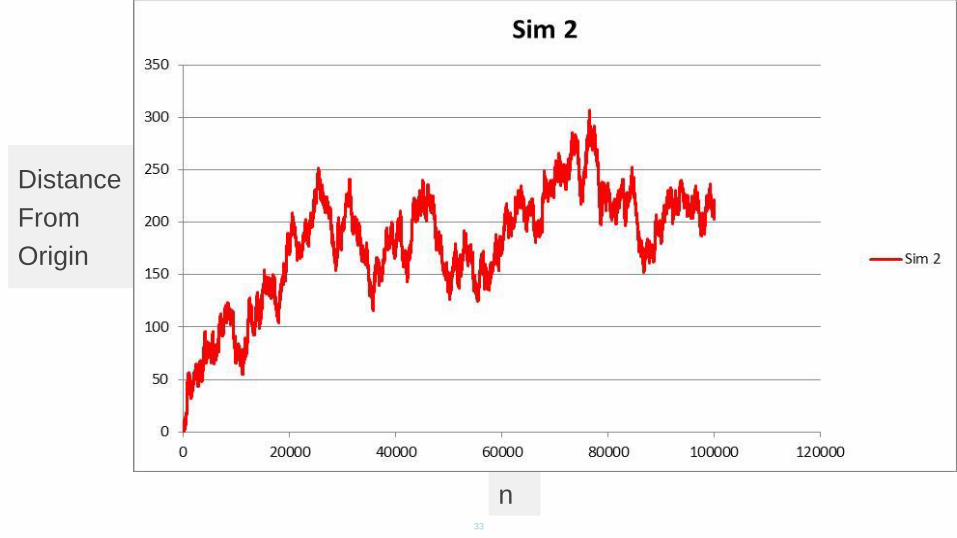
33
Distance
From
Origin
n

34
Distance
From
Origin
n
5 Sims
35
Distance
From
Origin
n

36
Distance
From
Origin
n
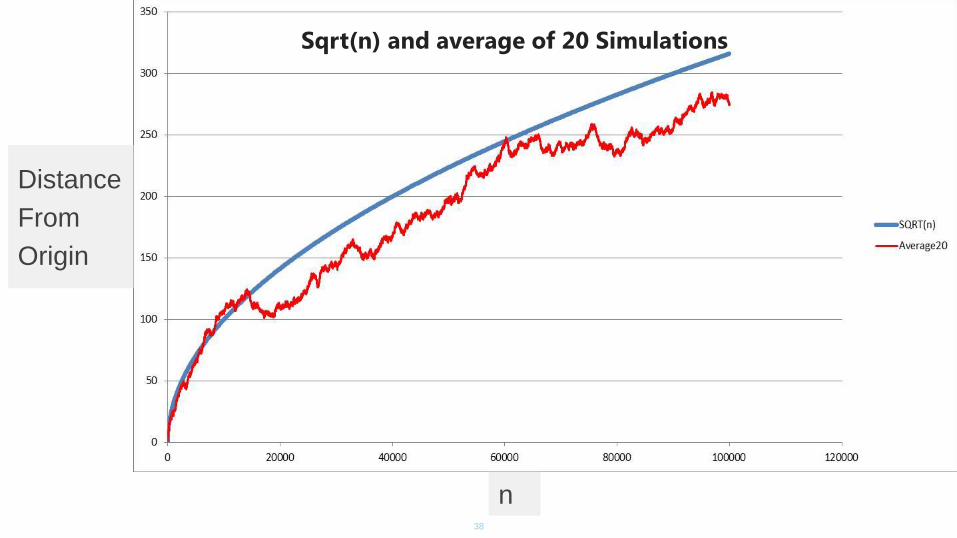
Sqrt(n) and average of 20 Simulations

37
Distance
From
Origin
n
Sqrt(n) and average of 20 Simulations
38
Distance
From
Origin
n
Sqrt(n) and average of 20 Simulations

39
Distance
From
Origin
n
Sqrt(n) and average of 20 Simulations

40
Distance
From
Origin
n
Sqrt(n) and average of 50,000 Simulations
Monte Carlo – random walks
How far, on average, will a random walk take you after n
steps? Does it sound reasonable?
It looks convincing to me but: It is NOT a proof
It is empirical (based on experience not pure logic)
It might be a better match to SQRT(n-1) or any other variant
But it may be close enough for our purposes
41
For Web site problem:
Define a domain of possible inputs (SCs, BYTs, Web Pages,
Advertisments)
42
Monte Carlo method

SCs (perhaps 300 of these)
Likelihood of clicking on a given advertisement (0 - 5)
Tolerance of advertisement number (a range that averages
around these numbers)
43
No. ads 0 1 2 3 4 5 6 7 8 9
% Chance of
disappearing 0-5 0-8 5-12 7-15 8-21 12-34 17-55 25-70 50-90 55-95
Monte Carlo method

SC 1 of 300
Likelihood of clicking on a given advertisement (3%)
Tolerance of advertisement number
44
No. ads 0 1 2 3 4 5 6 7 8 9
% Chance of
disappearing
0 0 7 7 9 13 18 27 50 60
Monte Carlo method
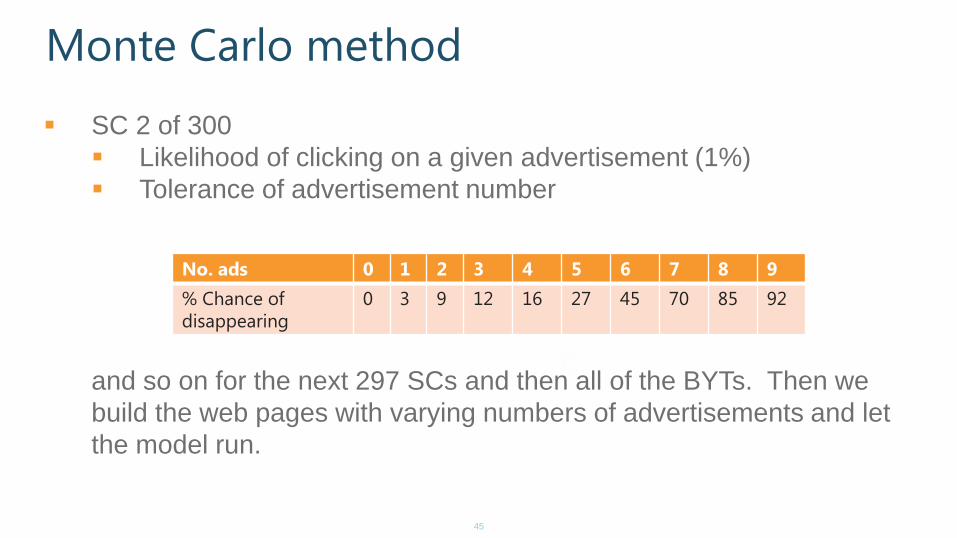
SC 2 of 300
Likelihood of clicking on a given advertisement (1%)
Tolerance of advertisement number
and so on for the next 297 SCs and then all of the BYTs. Then we
build the web pages with varying numbers of advertisements and let
the model run.
45
No. ads 0 1 2 3 4 5 6 7 8 9
% Chance of
disappearing
0 3 9 12 16 27 45 70 85 92
Monte Carlo method

Define a domain of possible inputs (SCs, BYTs, Web Pages)
Generate a set of inputs (create a specific set of SCs, BYTs etc) These should be randomly chosen correctly from the domain (Not equal
numbers of SCs with a click rate of 0, 3 and 5)
Perform some computation on the inputs (Let the users interact with
the pages)
Repeat (using each user multiple times)
Repeat (changing the number of advertisements)
Aggregate the results (count the number of advertisements clicked)
Draw a conclusion (Find the optimal solution)
Perform reality check (does that agree with observation?)
Monte Carlo method
46

Extending Monte Carlo
Can we combine Monte Carlo simulations and analytical
systems?
47

Andy Hogg
SQL Server specialist, MCSE,
MCDBA, MCITP, ITIL v.3 certified.
MSc.(with distinction) in Business
Intelligence from the University Of
Dundee.
http://www.linkedin.com/in/andyhogg
48
Extending Monte Carlo

Extending Monte Carlo

Predator prey
Create a model
Repeat:
Run with a set of parameters for x runs
Alter parameter
Until huge quantities of data collected
Put the data into the Microsoft BI stack
Extending Monte Carlo


Figure 21 - Visualisation of Simulation 85 showing an arm-chair pattern of prey numbers, coupled with a very steady predator
population

Reverse Engineering with MCS
This is a really important facet of MCS that is often not
appreciated (imho).
53

Street Numbers
Practical.
Choose a street length.
Now (tricky) choose a random street number on that
street.
54

Benford’s law
If you take some numbers collected from the wild (take every number that appears in an edition of Reader’s Digest, or the length of the rivers in the World) and plot the distribution of those that begin with:
1, 143, 1, 104, 132232 ~ 1
2435, 2, 212, 25433443, 23 ~ 2
3, 3212, 323122, 34, 32 ~ 3
and so on,
you get the same distribution
55

Benford’s law
Well, let’s take the height above sea level for the largest
120,000 towns/cities in the World.
56

Benford’s law
http://www.datagenetics.com/blog/march52012/
Weird, right? But it must be an artefact of
the unit chosen, so let’s change it.
57

Benford’s law
http://www.datagenetics.com/blog/march52012/
58

Benford’s law
59
Plot is of data from 1950-2010
Yearly Populations of World
Cities as published
https://pwt.sas.upenn.edu/ph
p_site/pwt_index.php
Courtesy of Ian Brown
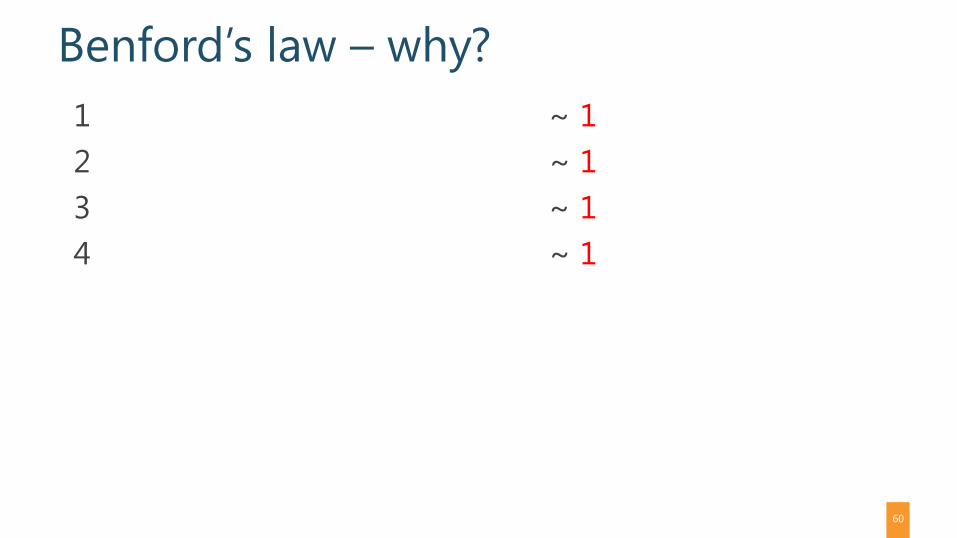
Benford’s law – why?
1 ~ 1
2 ~ 1
3 ~ 1
4 ~ 1
60
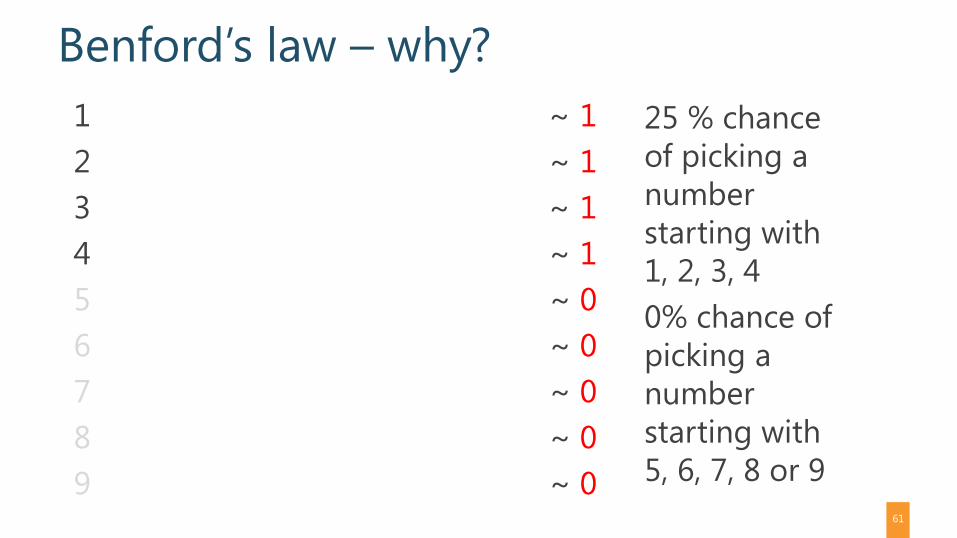
Benford’s law – why?
1 ~ 1
2 ~ 1
3 ~ 1
4 ~ 1
5 ~ 0
6 ~ 0
7 ~ 0
8 ~ 0
9 ~ 0
61
25 % chance
of picking a
number
starting with
1, 2, 3, 4
0% chance of
picking a
number
starting with
5, 6, 7, 8 or 9

Benford’s law – why?
1 ~ 1
2 ~ 1
3 ~ 1
4 ~ 1
5 ~ 1
6 ~ 1
7 ~ 1
8 ~ 1
9 ~ 1
62
All equally
likely
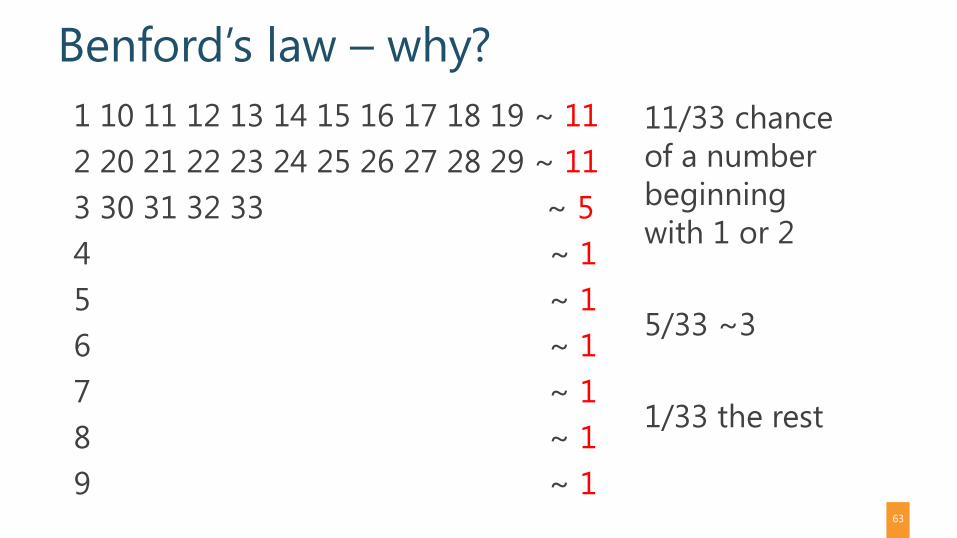
Benford’s law – why?
1 10 11 12 13 14 15 16 17 18 19 ~ 11
2 20 21 22 23 24 25 26 27 28 29 ~ 11
3 30 31 32 33 ~ 5
4 ~ 1
5 ~ 1
6 ~ 1
7 ~ 1
8 ~ 1
9 ~ 1
63
11/33 chance
of a number
beginning
with 1 or 2
5/33 ~3
1/33 the rest

Benford’s law – why?
1 10 11 12 13 14 15 16 17 18 19 ~ 11
2 20 21 22 23 24 25 26 27 28 29 ~ 11
3 30 31 32 33 34 35 36 37 38 39 ~ 11
4 40 41 42 43 44 45 46 47 48 49 ~ 11
5 50 51 52 53 54 55 56 57 58 ~ 10
6 ~ 1
7 ~ 1
8 ~ 1
9 ~ 1
64
11/58 chance
of a number
beginning
with 1 to 4
10/58 ~5
1/58 the rest

Benford’s law – why?
1 10 11 12 13 14 15 16 17 18 19 ~ 11
2 20 21 22 23 24 25 26 27 28 29 ~ 11
3 30 31 32 33 34 35 36 37 38 39 ~ 11
4 40 41 42 43 44 45 46 47 48 49 ~ 11
5 50 51 52 53 54 55 56 57 58 59 ~ 11
6 60 61 62 63 64 65 66 67 68 69 ~ 11
7 70 71 72 73 74 75 76 77 78 79 ~ 11
8 80 81 82 83 84 85 86 87 88 89 ~ 11
9 90 91 92 93 94 95 96 97 98 99 ~ 11
65
All identical at
11/99 or 1/9

Benford’s law
col title 1 2 3 4 5 6 7 8 9 samples
A Rivers, Area 31.0 16.4 10.7 11.3 7.2 8.6 5.5 4.2 5.1 335
B Population 33.9 20.4 14.2 8.1 7.2 6.2 4.1 3.7 2.2 3259
C Constants 41.3 14.4 4.8 8.6 10.6 5.8 1.0 2.9 10.6 104
D Newspapers 30.0 18.0 12.0 10.0 8.0 6.0 6.0 5.0 5.0 100
E Specific Heat 24.0 18.4 16.2 14.6 10.6 4.1 3.2 4.8 4.1 1389
F Pressure 29.6 18.3 12.8 9.8 8.3 6.4 5.7 4.4 4.7 703
G H.P. Lost 30.0 18.4 11.9 10.8 8.1 7.0 5.1 5.1 3.6 690
H Mol. Wgt. 26.7 25.2 15.4 10.8 6.7 5.1 4.1 2.8 3.2 1800
I Drainage 27.1 23.9 13.8 12.6 8.2 5.0 5.0 2.5 1.9 159
J Atomic Wgt. 47.2 18.7 5.5 4.4 6.6 4.4 3.3 4.4 5.5 91
Benford, F. "The Law of Anomalous
Numbers." Proc. Amer. Phil. Soc. 78, 551-
572, 1938
66

Benford’s law
col title 1 2 3 4 5 6 7 8 9 samples
T Death Rate 27.0 18.6 15.7 9.4 6.7 6.5 7.2 4.8 4.1 418
Average 30.6 18.5 12.4 9.4 8.0 6.4 5.1 4.9 4.7 1011
67

Benford’s law
How can we use this?
What about fraud detection?
68

Benford’s law
http://www.datagenetics.com/blog/march52012/
69

Benford’s law
But it may also simply highlight something worthy of
further attention.
70

Benford’s law
From a former student - direct debit/catalogue payments
71

Exploring exotic patterns in data I was asked about additional reading material. You can, of
course, simply Google “Monte Carlo” and “Benfords”. But
the original papers are worth reading (referenced in the
talk). In addition the paper called "Stan Ulam, John von
Neumann, and the Monte Carlo method” by Roger
Eckhardt (which is a Los Alamos publication - Los Alamos
Science Special Issue 1987) is also well worth downloading
and reading. You can find it by Googling the title.
72