Embed Size (px)
Citation preview
Property of Answers – Proprietary & ConfidentialProperty of Answers – Proprietary & Confidential
Econsultancy Pre/Post Redesign Review and InsightKatherine Stroud, Analyst
Pre: 1st Jul 2014 – 22nd Nov 2014, n=338
Post: 23rd Nov 2014 – 31st May 2015, n=336
1
Property of Answers – Proprietary & Confidential 2
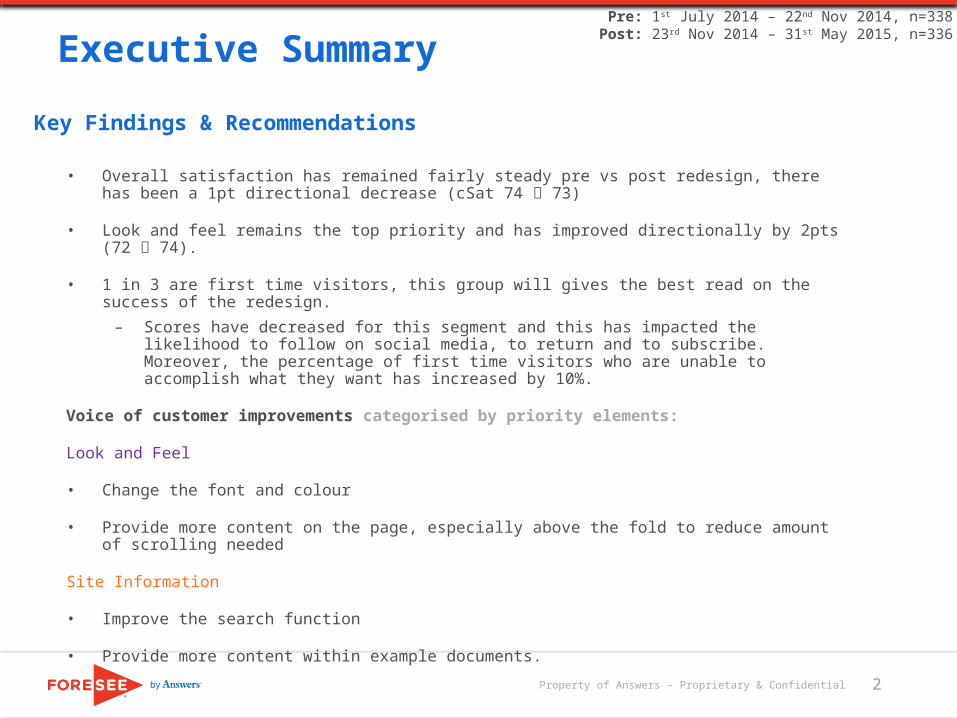
• Overall satisfaction has remained fairly steady pre vs post redesign, there has been a 1pt directional decrease (cSat 74 73)
• Look and feel remains the top priority and has improved directionally by 2pts (72 74).
• 1 in 3 are first time visitors, this group will gives the best read on the success of the redesign.
– Scores have decreased for this segment and this has impacted the likelihood to follow on social media, to return and to subscribe. Moreover, the percentage of first time visitors who are unable to accomplish what they want has increased by 10%.
Voice of customer improvements categorised by priority elements:
Look and Feel
• Change the font and colour
• Provide more content on the page, especially above the fold to reduce amount of scrolling needed
Site Information
• Improve the search function
• Provide more content within example documents.
Executive Summary
Key Findings & Recommendations
Pre: 1st July 2014 – 22nd Nov 2014, n=338Post: 23rd Nov 2014 – 31st May 2015, n=336
Property of Answers – Proprietary & Confidential
PRE VS POSTWEBSITE OVERVIEW
Pre: 1st July 2014 – 22nd Nov 2014, n=338Post: 23rd Nov 2014 – 31st May 2015, n=336
Property of Answers – Proprietary & Confidential 4
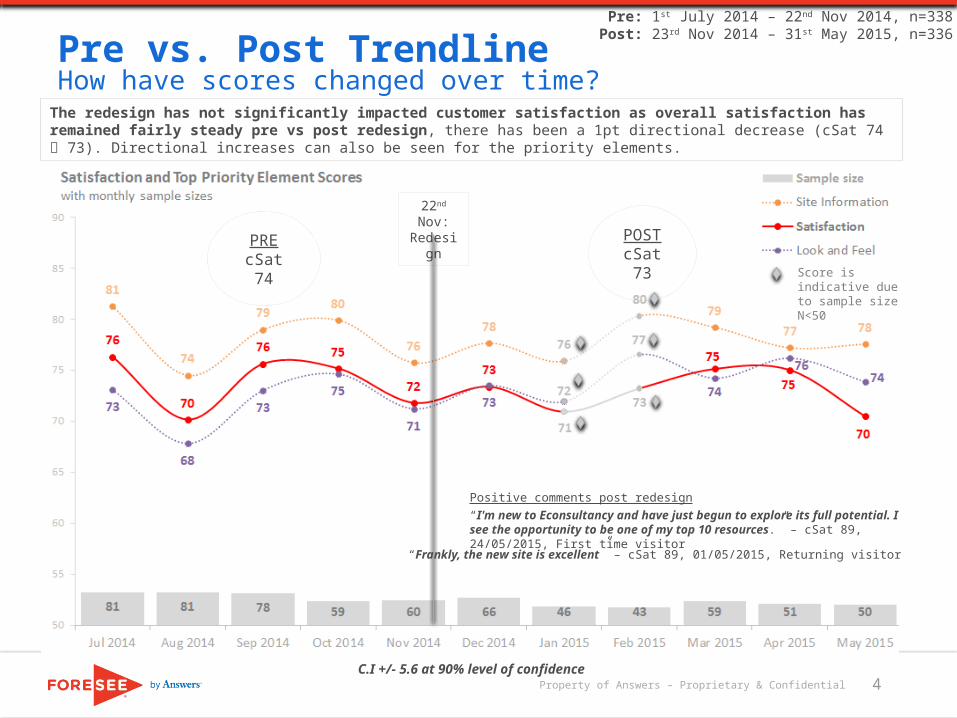
Pre vs. Post TrendlineHow have scores changed over time?
Score is indicative due to sample size N<50
C.I +/- 5.6 at 90% level of confidence
22nd Nov: Redesign
The redesign has not significantly impacted customer satisfaction as overall satisfaction has remained fairly steady pre vs post redesign, there has been a 1pt directional decrease (cSat 74 73). Directional increases can also be seen for the priority elements.
POSTcSat 73
PREcSat 74
Positive comments post redesign“I'm new to Econsultancy and have just begun to explore its full potential. I see the opportunity to be one of my top 10 resources.” – cSat 89, 24/05/2015, First time visitor
“Frankly, the new site is excellent” – cSat 89, 01/05/2015, Returning visitor
Pre: 1st July 2014 – 22nd Nov 2014, n=338Post: 23rd Nov 2014 – 31st May 2015, n=336
Property of Answers – Proprietary & Confidential 5
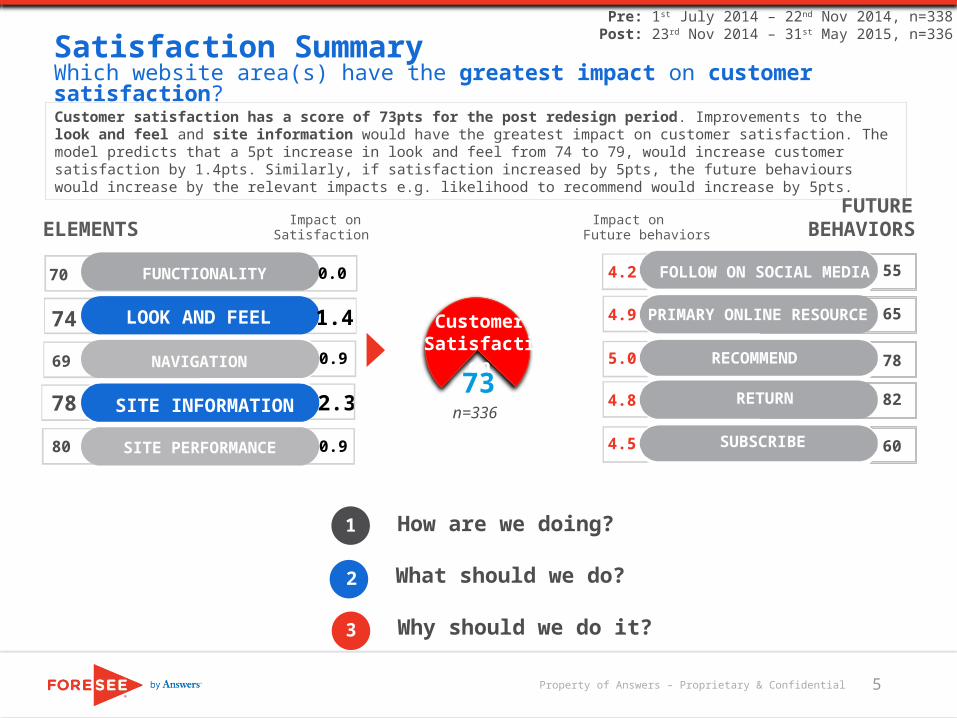
Satisfaction SummaryWhich website area(s) have the greatest impact on customer satisfaction?
Impact onSatisfactionELEMENTS
FUNCTIONALITY
LOOK AND FEEL
NAVIGATION
SITE INFORMATION
SITE PERFORMANCE
FUTUREBEHAVIORSImpact on
Future behaviors
PRIMARY ONLINE RESOURCE
RECOMMEND
FOLLOW ON SOCIAL MEDIA
73
70
74
69
78
80
65
78
55
How are we doing?1
0.0
1.4
0.9
2.3
0.9
What should we do?2
4.9
5.0
4.2
Why should we do it?3
n=336
Customer satisfaction has a score of 73pts for the post redesign period. Improvements to the look and feel and site information would have the greatest impact on customer satisfaction. The model predicts that a 5pt increase in look and feel from 74 to 79, would increase customer satisfaction by 1.4pts. Similarly, if satisfaction increased by 5pts, the future behaviours would increase by the relevant impacts e.g. likelihood to recommend would increase by 5pts.
RETURN
SUBSCRIBE
82
60
4.8
4.5
CustomerSatisfaction
Pre: 1st July 2014 – 22nd Nov 2014, n=338Post: 23rd Nov 2014 – 31st May 2015, n=336
Property of Answers – Proprietary & Confidential 6
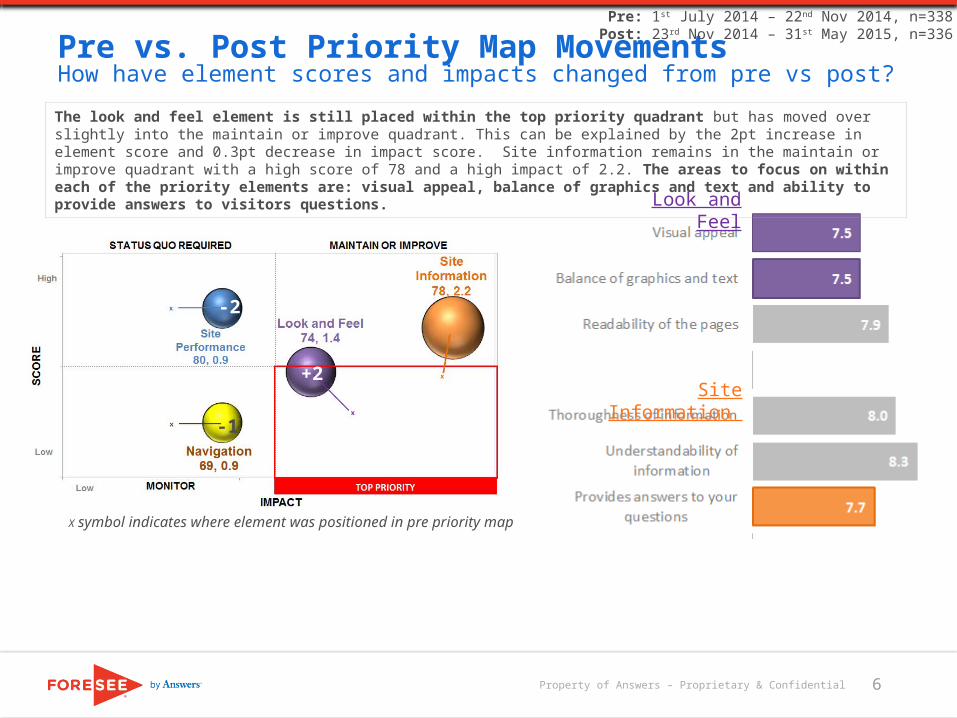
Pre vs. Post Priority Map MovementsHow have element scores and impacts changed from pre vs post?
+2
-2
-1
Look and Feel
Site Information
The look and feel element is still placed within the top priority quadrant but has moved over slightly into the maintain or improve quadrant. This can be explained by the 2pt increase in element score and 0.3pt decrease in impact score. Site information remains in the maintain or improve quadrant with a high score of 78 and a high impact of 2.2. The areas to focus on within each of the priority elements are: visual appeal, balance of graphics and text and ability to provide answers to visitors questions.
X symbol indicates where element was positioned in pre priority map
Pre: 1st July 2014 – 22nd Nov 2014, n=338Post: 23rd Nov 2014 – 31st May 2015, n=336
Property of Answers – Proprietary & Confidential 7
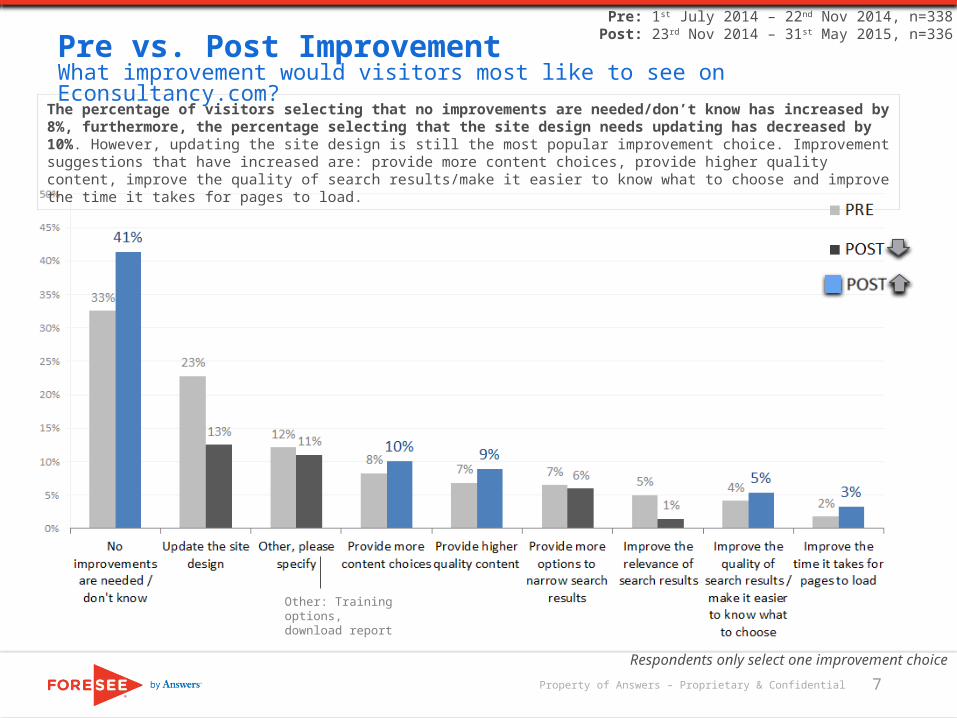
Pre vs. Post ImprovementWhat improvement would visitors most like to see on Econsultancy.com?
Pre: 1st July 2014 – 22nd Nov 2014, n=338Post: 23rd Nov 2014 – 31st May 2015, n=336
The percentage of visitors selecting that no improvements are needed/don’t know has increased by 8%, furthermore, the percentage selecting that the site design needs updating has decreased by 10%. However, updating the site design is still the most popular improvement choice. Improvement suggestions that have increased are: provide more content choices, provide higher quality content, improve the quality of search results/make it easier to know what to choose and improve the time it takes for pages to load.
Respondents only select one improvement choice
Other: Training options, download report
Property of Answers – Proprietary & Confidential
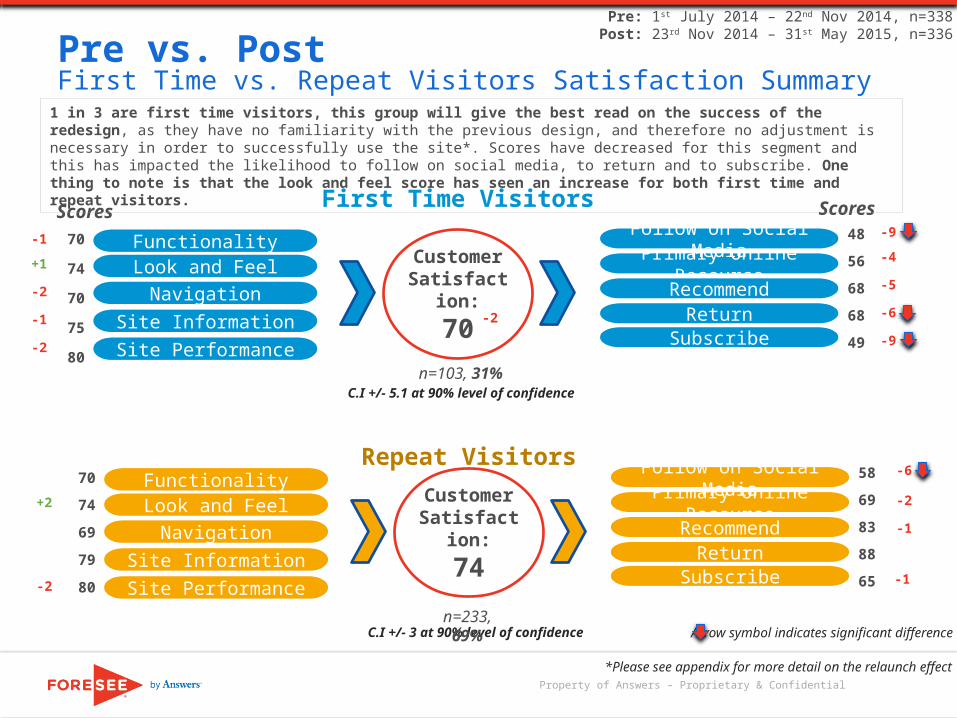
Pre vs. Post First Time vs. Repeat Visitors Satisfaction Summary
Look and FeelFunctionality
NavigationSite InformationSite Performance
Customer Satisfaction:
70
Primary Online ResourceFollow on Social Media
RecommendReturn
Subscribe
70
74
70
75
80
n=103, 31%
Scores48
56
68
68
49
ScoresFirst Time Visitors
C.I +/- 3 at 90% level of confidence
Look and FeelFunctionality
NavigationSite InformationSite Performance
Customer Satisfaction:
74
Primary Online ResourceFollow on Social Media
RecommendReturn
Subscribe
70
74
69
79
80
n=233, 69%
58
69
83
88
65
Repeat Visitors
-1
+1
-2
-1
-2
-2
-9
-4
-5
-6
-9
+2
-2
-6
-2
-1
-1
C.I +/- 5.1 at 90% level of confidence
Arrow symbol indicates significant difference
1 in 3 are first time visitors, this group will give the best read on the success of the redesign, as they have no familiarity with the previous design, and therefore no adjustment is necessary in order to successfully use the site*. Scores have decreased for this segment and this has impacted the likelihood to follow on social media, to return and to subscribe. One thing to note is that the look and feel score has seen an increase for both first time and repeat visitors.
*Please see appendix for more detail on the relaunch effect
Pre: 1st July 2014 – 22nd Nov 2014, n=338Post: 23rd Nov 2014 – 31st May 2015, n=336
Property of Answers – Proprietary & Confidential 9
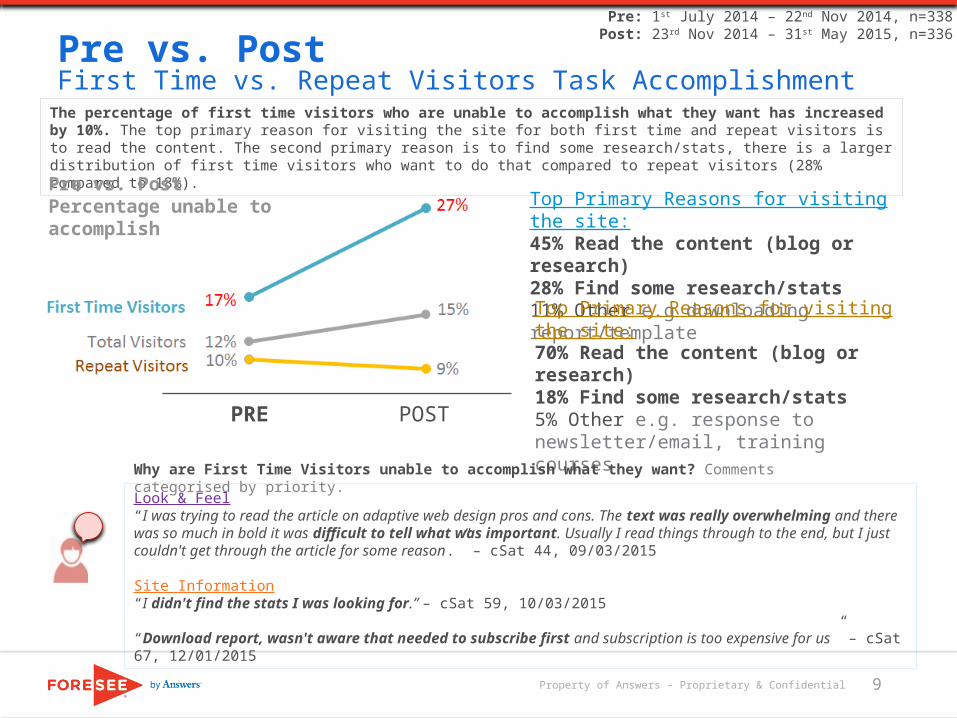
Pre vs. PostFirst Time vs. Repeat Visitors Task Accomplishment
PRE POST
Top Primary Reasons for visiting the site:45% Read the content (blog or research)28% Find some research/stats11% Other e.g downloading report/template
Top Primary Reasons for visiting the site:70% Read the content (blog or research)18% Find some research/stats5% Other e.g. response to newsletter/email, training courses
Look & Feel“I was trying to read the article on adaptive web design pros and cons. The text was really overwhelming and there was so much in bold it was difficult to tell what was important. Usually I read things through to the end, but I just couldn't get through the article for some reason.” – cSat 44, 09/03/2015
Site Information“I didn't find the stats I was looking for.” – cSat 59, 10/03/2015
“Download report, wasn't aware that needed to subscribe first and subscription is too expensive for us” – cSat 67, 12/01/2015
Why are First Time Visitors unable to accomplish what they want? Comments categorised by priority.
The percentage of first time visitors who are unable to accomplish what they want has increased by 10%. The top primary reason for visiting the site for both first time and repeat visitors is to read the content. The second primary reason is to find some research/stats, there is a larger distribution of first time visitors who want to do that compared to repeat visitors (28% compared to 18%).
Pre vs. Post Percentage unable to accomplish
Pre: 1st July 2014 – 22nd Nov 2014, n=338Post: 23rd Nov 2014 – 31st May 2015, n=336
Property of Answers – Proprietary & Confidential
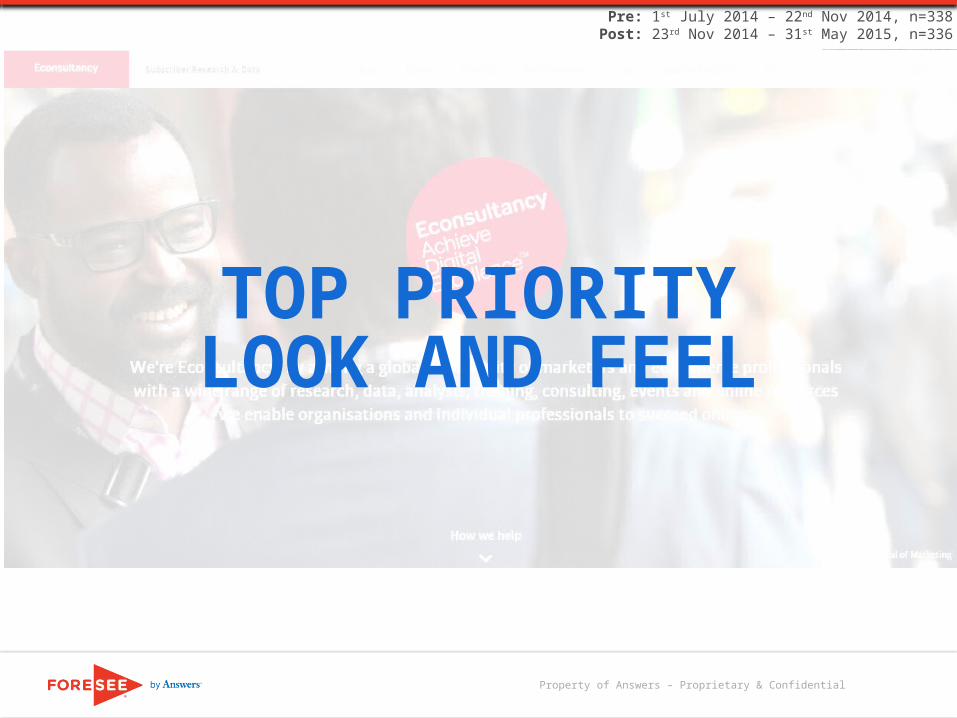
TOP PRIORITYLOOK AND FEEL
Pre: 1st July 2014 – 22nd Nov 2014, n=338Post: 23rd Nov 2014 – 31st May 2015, n=336
Property of Answers – Proprietary & Confidential 11
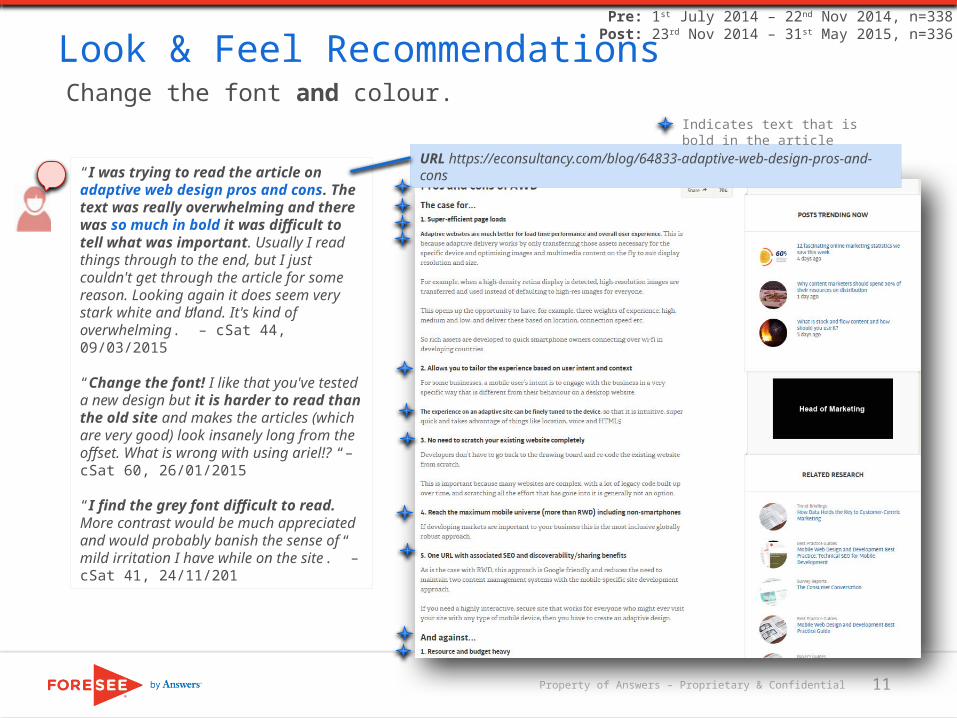
Look & Feel RecommendationsChange the font and colour.
“I was trying to read the article on adaptive web design pros and cons. The text was really overwhelming and there was so much in bold it was difficult to tell what was important. Usually I read things through to the end, but I just couldn't get through the article for some reason. Looking again it does seem very stark white and bland. It's kind of overwhelming.” – cSat 44, 09/03/2015
“Change the font! I like that you've tested a new design but it is harder to read than the old site and makes the articles (which are very good) look insanely long from the offset. What is wrong with using ariel!? “– cSat 60, 26/01/2015
“I find the grey font difficult to read. More contrast would be much appreciated and would probably banish the sense of mild irritation I have while on the site.” – cSat 41, 24/11/201
URL https://econsultancy.com/blog/64833-adaptive-web-design-pros-and-cons
Indicates text that is bold in the article
Pre: 1st July 2014 – 22nd Nov 2014, n=338Post: 23rd Nov 2014 – 31st May 2015, n=336
Property of Answers – Proprietary & Confidential 12
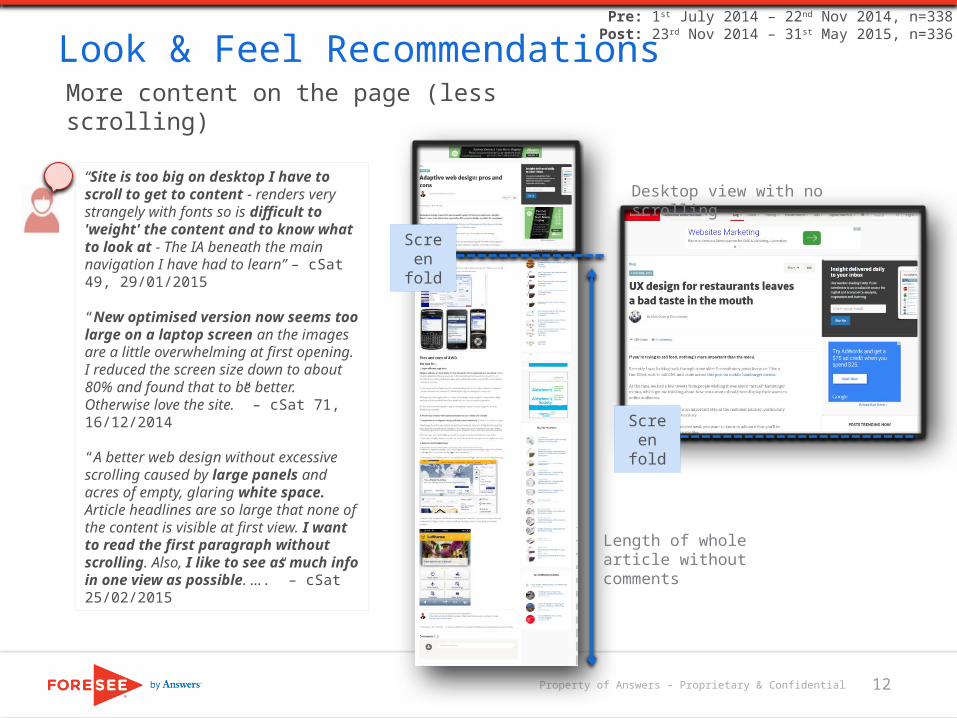
Look & Feel RecommendationsMore content on the page (less scrolling)
“Site is too big on desktop I have to scroll to get to content - renders very strangely with fonts so is difficult to 'weight' the content and to know what to look at - The IA beneath the main navigation I have had to learn” – cSat 49, 29/01/2015
“New optimised version now seems too large on a laptop screen an the images are a little overwhelming at first opening. I reduced the screen size down to about 80% and found that to be better. Otherwise love the site.” – cSat 71, 16/12/2014
“A better web design without excessive scrolling caused by large panels and acres of empty, glaring white space. Article headlines are so large that none of the content is visible at first view. I want to read the first paragraph without scrolling. Also, I like to see as much info in one view as possible. ….” – cSat 25/02/2015
Screen fold
Screen fold
Length of whole article without comments
Desktop view with no scrolling
Pre: 1st July 2014 – 22nd Nov 2014, n=338Post: 23rd Nov 2014 – 31st May 2015, n=336
Property of Answers – Proprietary & Confidential
IMPROVE & MONITORSITE INFORMATION
Pre: 1st July 2014 – 22nd Nov 2014, n=338Post: 23rd Nov 2014 – 31st May 2015, n=336
Property of Answers – Proprietary & Confidential 14
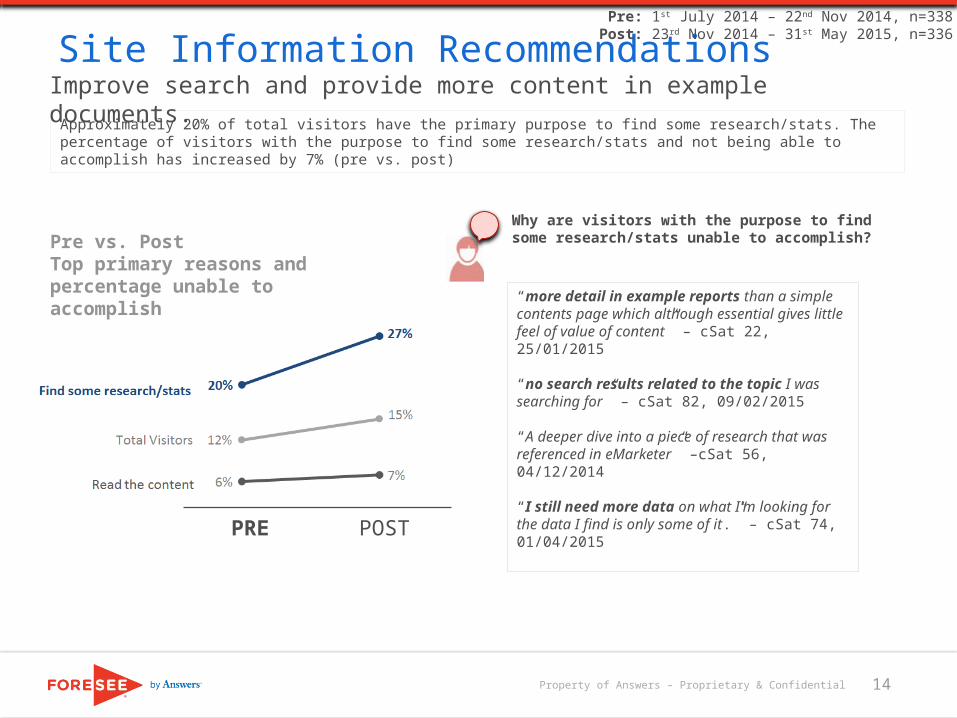
Site Information Recommendations
Pre vs. Post Top primary reasons and percentage unable to accomplish “more detail in example reports than a simple contents
page which although essential gives little feel of value of content” – cSat 22, 25/01/2015
“no search results related to the topic I was searching for” – cSat 82, 09/02/2015
“A deeper dive into a piece of research that was referenced in eMarketer” –cSat 56, 04/12/2014
“I still need more data on what I'm looking for the data I find is only some of it.” – cSat 74, 01/04/2015
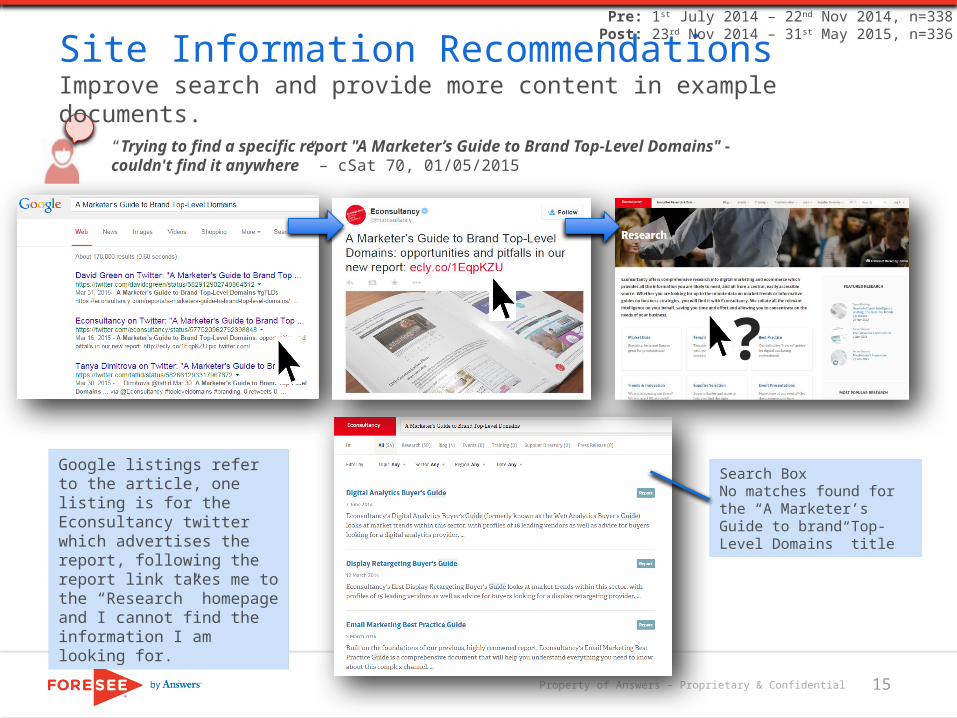
Improve search and provide more content in example documents.
Why are visitors with the purpose to find some research/stats unable to accomplish?
Approximately 20% of total visitors have the primary purpose to find some research/stats. The percentage of visitors with the purpose to find some research/stats and not being able to accomplish has increased by 7% (pre vs. post)
PRE POST
Pre: 1st July 2014 – 22nd Nov 2014, n=338Post: 23rd Nov 2014 – 31st May 2015, n=336
Property of Answers – Proprietary & Confidential 15
Search BoxNo matches found for the “A Marketer’s Guide to brand Top-Level Domains” title
?
“Trying to find a specific report "A Marketer’s Guide to Brand Top-Level Domains" - couldn't find it anywhere” – cSat 70, 01/05/2015
Google listings refer to the article, one listing is for the Econsultancy twitter which advertises the report, following the report link takes me to the “Research” homepage and I cannot find the information I am looking for.
Site Information RecommendationsImprove search and provide more content in example documents.
Pre: 1st July 2014 – 22nd Nov 2014, n=338Post: 23rd Nov 2014 – 31st May 2015, n=336
Property of Answers – Proprietary & Confidential 16
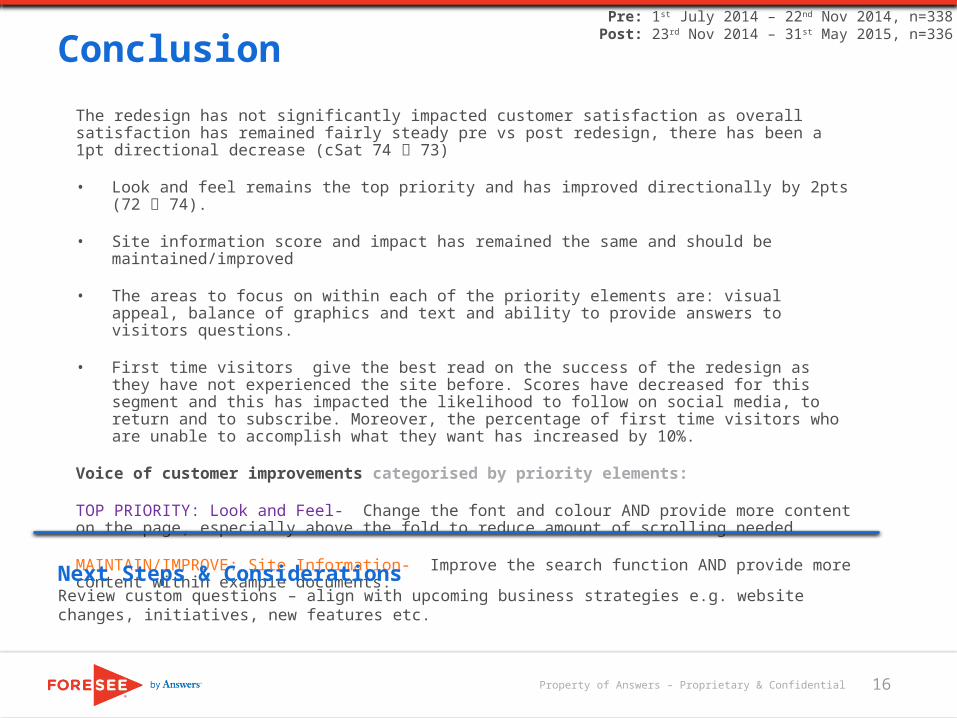
The redesign has not significantly impacted customer satisfaction as overall satisfaction has remained fairly steady pre vs post redesign, there has been a 1pt directional decrease (cSat 74 73)
• Look and feel remains the top priority and has improved directionally by 2pts (72 74).
• Site information score and impact has remained the same and should be maintained/improved
• The areas to focus on within each of the priority elements are: visual appeal, balance of graphics and text and ability to provide answers to visitors questions.
• First time visitors give the best read on the success of the redesign as they have not experienced the site before. Scores have decreased for this segment and this has impacted the likelihood to follow on social media, to return and to subscribe. Moreover, the percentage of first time visitors who are unable to accomplish what they want has increased by 10%.
Voice of customer improvements categorised by priority elements:
TOP PRIORITY: Look and Feel- Change the font and colour AND provide more content on the page, especially above the fold to reduce amount of scrolling needed
MAINTAIN/IMPROVE: Site Information- Improve the search function AND provide more content within example documents.
Conclusion
Next Steps & ConsiderationsReview custom questions – align with upcoming business strategies e.g. website changes, initiatives, new features etc.
Pre: 1st July 2014 – 22nd Nov 2014, n=338Post: 23rd Nov 2014 – 31st May 2015, n=336

Property of Answers – Proprietary & Confidential
APPENDIX
Property of Answers – Proprietary & Confidential
What is the Relaunch Effect?When a website’s Satisfaction scores, and often some of the Element scores, drop for a period of time after a site is relaunched.
Repeat visitors may be experiencing initial frustration with the site changes.
Items may not be where they used to be, visitors cannot find them in ways they are used to and/or visitors may not find them at all.
As repeat visitors familiarise themselves with the site and possibly begin to benefit from the changes, scores then recover or surpass pre-redesign levels.
The Relaunch EffectDefinition
18
Property of Answers – Proprietary & Confidential
If aggregate scores decline immediately after relaunch, first time visitor scores can be an early indicator of success. These respondents have no preconceived ideas about what the site is “supposed” to be like, so the Relaunch Effect does not occur among first time visitors.
If scores for the first time visitors increase immediately:
The relaunch has at least been successful for this segment, and it is likely that repeat visitors’ lower scores are the result of the Relaunch Effect and will eventually recover.
If scores for the first time visitors do not change post launch:
It is likely that the relaunch may not have made a real difference in site visitor satisfaction.
There is a chance that scores may increase for repeat visitors, if the site changes affect their experiences on the site more than first-timers.
If scores for the first time visitors decline immediately:
This situation can be an early sign of an unsuccessful relaunch, and possible short-term solutions should be explored quickly.
There is a chance that the relaunch resulted in a site that is harder for first-timers to use, but will not negatively impact repeat visitors, once they become adjusted to the changes.
The Relaunch EffectEarly Indicator: First Time Visitors
19
Property of Answers – Proprietary & Confidential
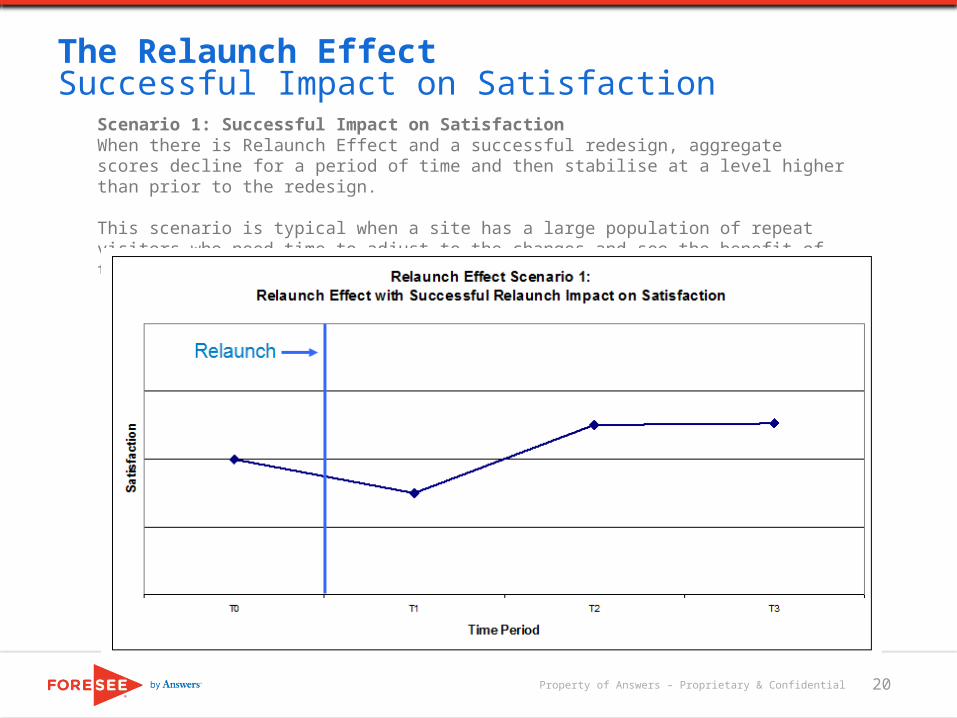
Scenario 1: Successful Impact on SatisfactionWhen there is Relaunch Effect and a successful redesign, aggregate scores decline for a period of time and then stabilise at a level higher than prior to the redesign.
This scenario is typical when a site has a large population of repeat visitors who need time to adjust to the changes and see the benefit of the redesign.
The Relaunch EffectSuccessful Impact on Satisfaction
20
Property of Answers – Proprietary & Confidential
Scenario 2: The Relaunch Effect could be a notable increase in Satisfaction that is not identified.
If changes were targeted at a small section of the site, affected only a subset of the audience, do not help visitors to accomplish tasks faster or better than before, or were perceived as superficial, satisfaction scores may not increase significantly.
Scenario 3: A site relaunch can be immediately successful with no Relaunch Effect.
This occurs when the previous version of the site was severely disappointing its audience (nowhere to go but up), if the site has primarily one-time visitors who have no preconceived ideas about it, or if increased functionality or content is clearly seen as superior by repeat visitors upon first exposure.
Scenario 4: What appears to be a major site change may not drive increased visitor Satisfaction. Similar to scenario 2, no real ground has been gained.
Site visitors may perceive the scope of the changes as small, or perhaps the changes affected only a small portion of the site audience.
Scenario 5: Sites can experience an initial score decline but rather than recovering after a short time, scores remain low. This is the sign of an unsuccessful redesign.
Perhaps the look and feel of the site has improved, but at the cost of site performance, or perhaps the site was streamlined and now information that visitors care about is harder to find, or no longer available.
The Relaunch EffectAdditional Relaunch Effect Scenarios
21