Embed Size (px)
Citation preview

Information Technology Program
Aalto University, 2015
Dr. Joni Salminen
[email protected], tel. +358 44 06 36 468
DIGITAL ANALYTICS
1
PROBLEMS OF ANALYTICS
1
I’ve waited for
this all my life…
The philosophy
• In a given field, there are x problems that prevent you
from reaching outcome y.
• Solve x, then y follows.
• (In my dissertation, the point was though that solving
x{0} might lead to x{1} problems.)
2
10 interesting analytics problems…
1. aggregation problem
2. last click fallacy
3. vanity metrics
4. analysis paralysis
5. multichannel problem
6. bounce problem
7. data discrepancy problem
8. optimization goal dilemma
9. zero value problem
10. churn problem
3
OMG. It’s so
good I’m going
to faint!
1. aggregation problem = seeing the
general trend, but not understanding
why it took place
4
segmentating data (e.g.
channel, campaign,
geography, time (cohorts))
Solution:
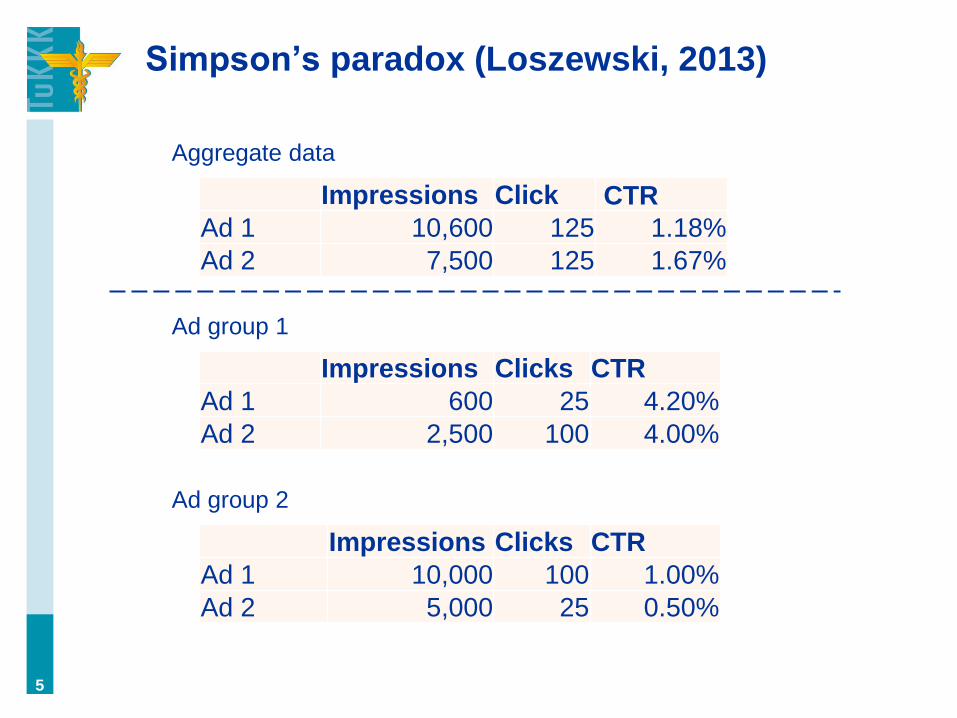
Simpson’s paradox (Loszewski, 2013)
5
Impressions Click CTR Ad 1 10,600 125 1.18%
Ad 2 7,500 125 1.67%
Aggregate data
Impressions Clicks CTR
Ad 1 600 25 4.20%
Ad 2 2,500 100 4.00%
Ad group 1
Impressions Clicks CTR
Ad 1 10,000 100 1.00%
Ad 2 5,000 25 0.50%
Ad group 2
Solution:
2. last click fallacy = taking only the last
interaction into account
6
attribution modelling
3. vanity metrics = reporting ”show off”
metrics as oppose to relevant ones
7
choosing relevant KPIs Solution:
4. analysis paralysis = the inability to
know which data to analyze or where
to start from
8
choosing actionable
metrics
Solution:
5. multichannel problem = losing track
of users when they move between
online and offline
9
Universal Analytics Solution:
6. bounce problem = deducting based
on a poor bounce rate that the
usability of a website is bad, even
though in reality it is not
10
correcting for bounce
measurement
Solution:
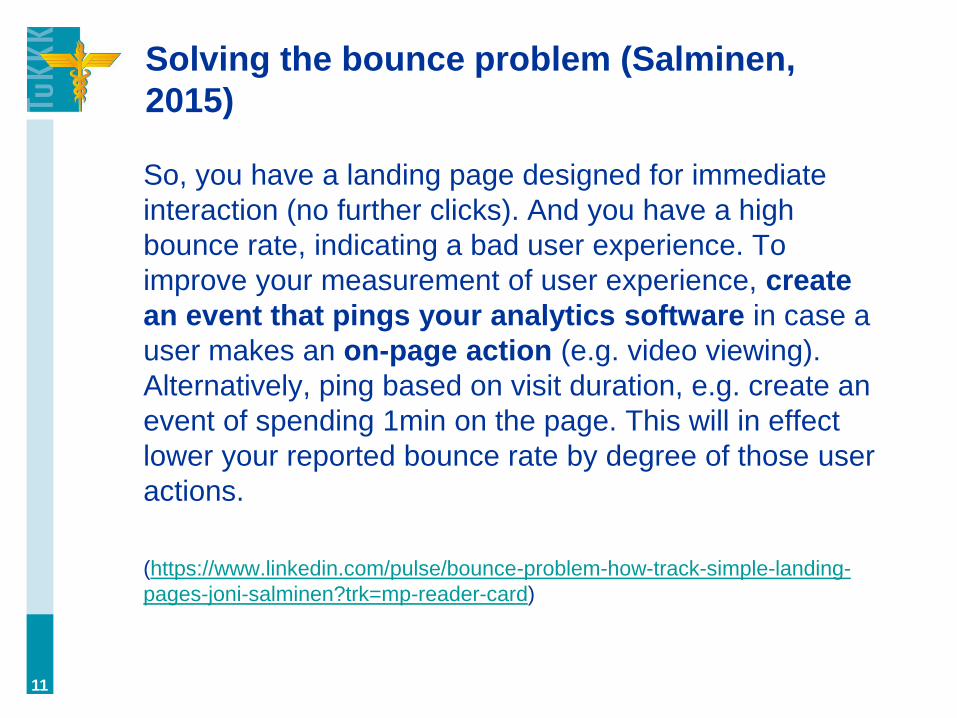
Solving the bounce problem (Salminen,
2015)
So, you have a landing page designed for immediate
interaction (no further clicks). And you have a high
bounce rate, indicating a bad user experience. To
improve your measurement of user experience, create
an event that pings your analytics software in case a
user makes an on-page action (e.g. video viewing).
Alternatively, ping based on visit duration, e.g. create an
event of spending 1min on the page. This will in effect
lower your reported bounce rate by degree of those user
actions.
(https://www.linkedin.com/pulse/bounce-problem-how-track-simple-landing-
pages-joni-salminen?trk=mp-reader-card)
11
7. data discrepancy problem = getting
different numbers from different
platforms
12
understanding definitions
& limitations, using UTM
parameters
Solution:
Interpreting metrics: CPC
• Avg. CPC (FB): 0,10€
• Avg. CPC (AdW): 0,20€
• Which one is better?
• There is no way to know with this information. Why?
13
Definitions
• Google: a click takes place when a user clicks the
link on an ad.
• Facebook: a click takes place when a user clicks the
link on an ad, or likes it, or comments it, or shares it.
• So, what is interepreted by an advertiser asa”click”
is in fact a”website click”inFacebook’s system.
14
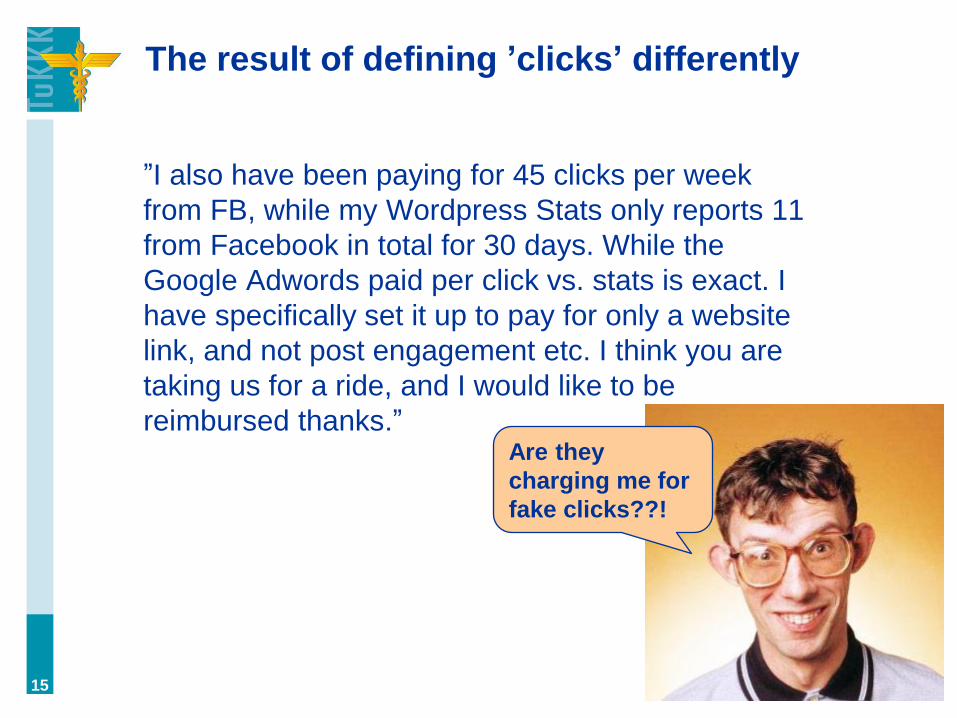
The result of defining ’clicks’ differently
”I also have been paying for 45 clicks per week
from FB, while my Wordpress Stats only reports 11
from Facebook in total for 30 days. While the
Google Adwords paid per click vs. stats is exact. I
have specifically set it up to pay for only a website
link, and not post engagement etc. I think you are
taking us for a ride, and I would like to be
reimbursed thanks.”
15
Are they
charging me for
fake clicks??!
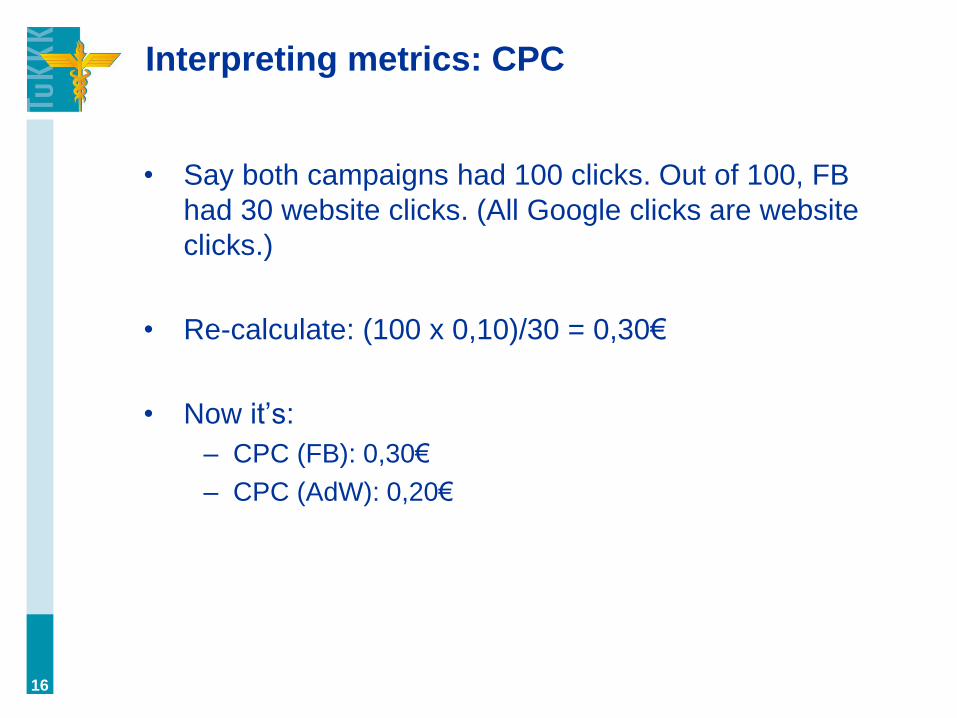
Interpreting metrics: CPC
• Say both campaigns had 100 clicks. Out of 100, FB
had 30 website clicks. (All Google clicks are website
clicks.)
• Re-calculate: (100 x 0,10)/30 = 0,30€
• Now it’s:
– CPC (FB): 0,30€
– CPC (AdW): 0,20€
16
Interpreting metrics: CPC
(Facebook has recently re-defined its CPC definition to
match that of Google. Still, it makes sense to always
verify what is being measured by a given metric, and
acknowledge different platforms may use different
calculations.)
17
It makes a good
bedtime
reading.
Conversion tracking in Facebook: particular
shit
“Aswith actions, Facebook tracks conversions that
happen within 1 day, 7 days, and 28 days after a person
clicks on an ad, and 1 day, 7 days, and 28 days after
viewing an ad.”
• The result: over-reporting conversions! (similar to
iSales in many affiliate networks)
• The solution: change lookback window in reports to
1 day.
• What do you think is the correct lookback window?
18
The problem of short lookback windows
(Goldberg, 2013)
“Whileour natural tendency is to generally use short
lookback periods (say, 7 days or a month, for example),
on an attributed basis, it’s important to lengthen this
out.Thereasonissimple…Ifcustomerslagabitbefore
squeezingthetrigger,it’sgoingtotaketimefor
introducer and influencer counts and values to appear. I
like to use 60-90 days as a lookback period on
keywords/ad groups that I know have a tendency to
introduce or influence a conversion as opposed to
closing, so that I can capture as much information as
possible into my bid rule.”
19
How long lookback window should you
choose?
• Regularly, I’d say all historical data
• However, what’s the problem with this approach?
• It can hide a current trend.
20
Hmm… a related issue of different reported
metrics is information asymmetry. Who
knows what that means?
• One party has more information than the other.
– Party A: The advertiser
– Party B: The advertising platform
• Which one has information advantage?
21
Hmm… a related issue of different reported
metrics is information asymmetry. Who
knows what that means?
• Party A: The advertiser
• Party B: The advertising platform
• Because of this information asymmetry, there arises
what we call moral hazard (criteria of delegation and
lack of monitoring also fulfilled).
• In other words, they can report whatever the hell they
want! How would you know?
22
Solutions to moral hazard?
A major solution to moral hazard is transparency. For
example, in digital marketing frequent audits are helpful.
The mere knowledge of being audited regularly will
increase the incentive of an agency (as in: advertising
agency) to stay honest. Obviously, the auditor needs to
be an independent 3rd party with adequate skills to
evaluate the account.
Thankfully,theriskof“gettingcaught”andthe
consecutive loss of trust are likely to keep the big
platformsincheck.Theywanttoavoidthelemon’s
market problem at any cost.
23
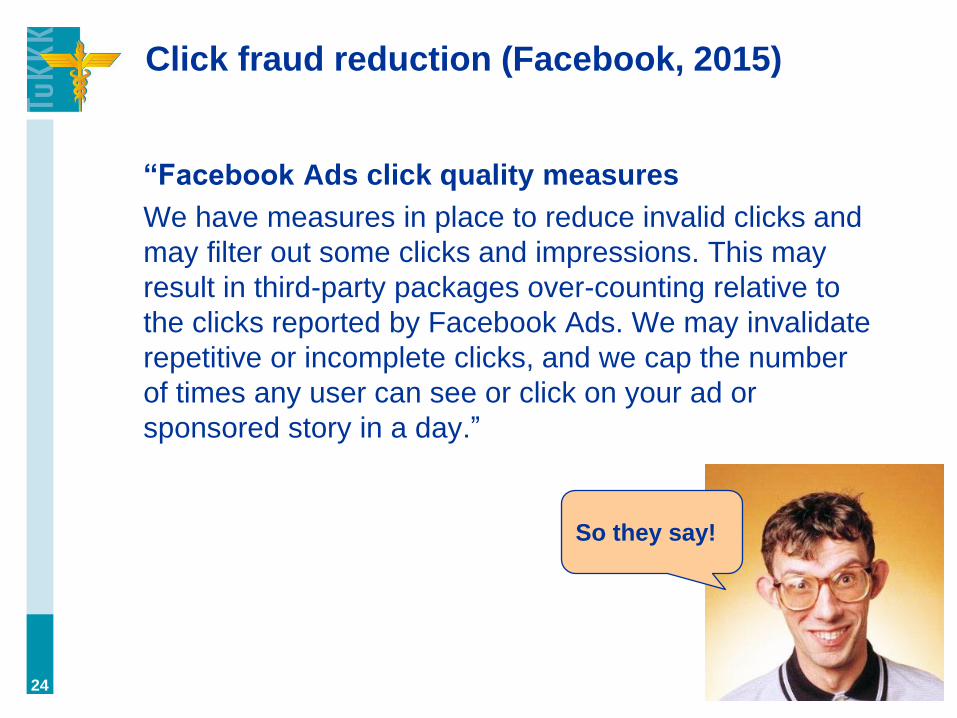
Click fraud reduction (Facebook, 2015)
“Facebook Ads click quality measures
We have measures in place to reduce invalid clicks and
may filter out some clicks and impressions. This may
result in third-party packages over-counting relative to
the clicks reported by Facebook Ads. We may invalidate
repetitive or incomplete clicks, and we cap the number
of times any user can see or click on your ad or
sponsored story in a day.”
24
So they say!
…but still, they may passively approve
some bot traffic
• e.g., bounce rate in GDN +80%!
• e.g., Facebook botgate (which, by the way, died
surprisingly fast)
25
8. optimization goal dilemma =
optimizing for platform-specific
metrics leads to un-optimal business
results, and vice versa.
26
Solution: making a
judgment call
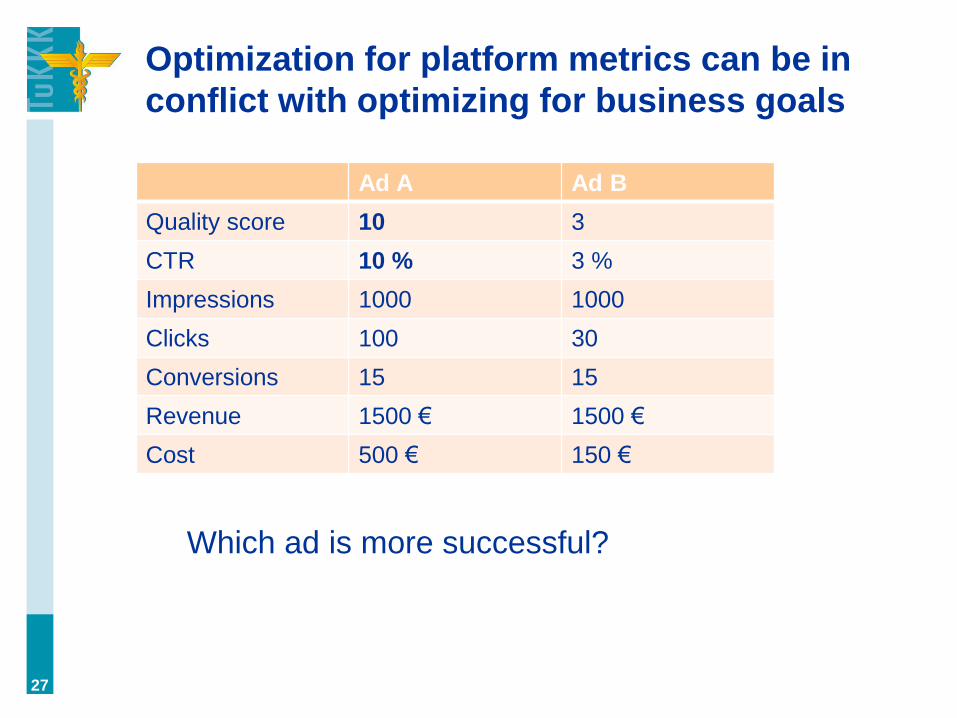
Optimization for platform metrics can be in
conflict with optimizing for business goals
27
Which ad is more successful?
Ad A Ad B
Quality score 10 3
CTR 10 % 3 %
Impressions 1000 1000
Clicks 100 30
Conversions 15 15
Revenue 1500 € 1500 €
Cost 500 € 150 €
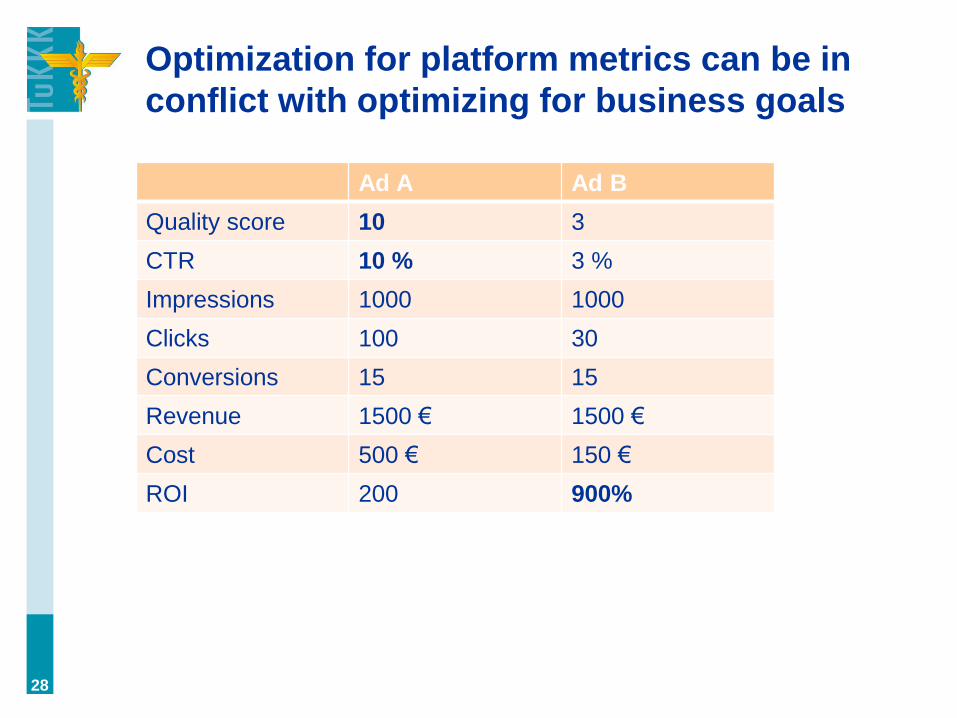
Optimization for platform metrics can be in
conflict with optimizing for business goals
28
Ad A Ad B
Quality score 10 3
CTR 10 % 3 %
Impressions 1000 1000
Clicks 100 30
Conversions 15 15
Revenue 1500 € 1500 €
Cost 500 € 150 €
ROI 200 900%
The metric conflict can be seen as an issue
of local vs. global maximum
• This is a common computer science problem
– Platform-specific metrics: local maximum
– Business goals: global maximum
• It can be very very hard to achieve a global
maximum, but metrics should be chosen to support
the path towards it…
29
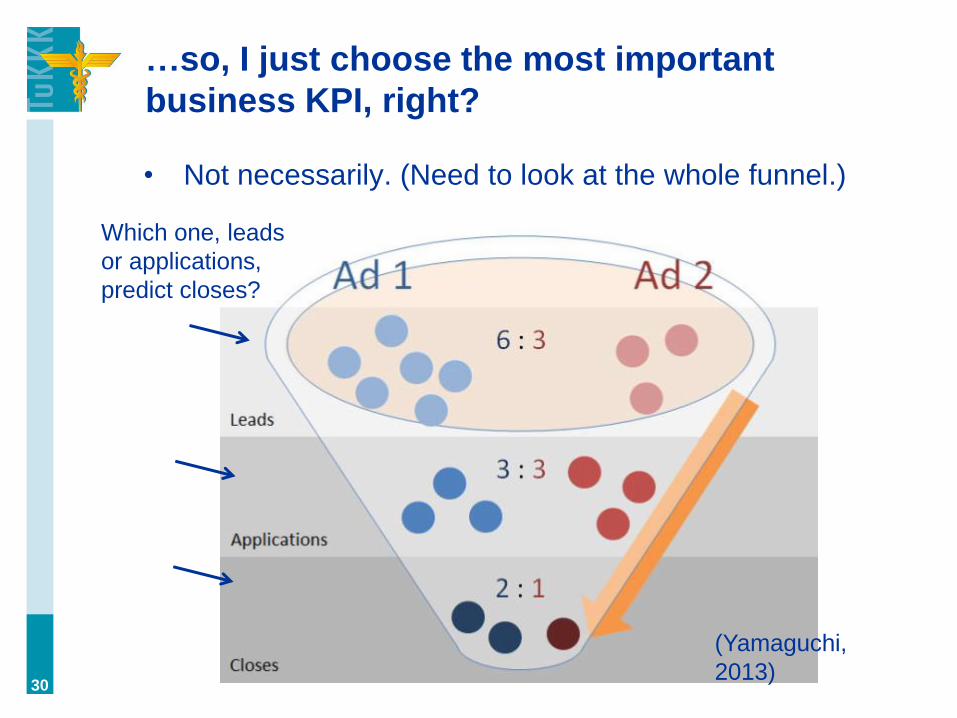
…so, I just choose the most important
business KPI, right?
• Not necessarily. (Need to look at the whole funnel.)
30
Which one, leads
or applications,
predict closes?
(Yamaguchi,
2013)
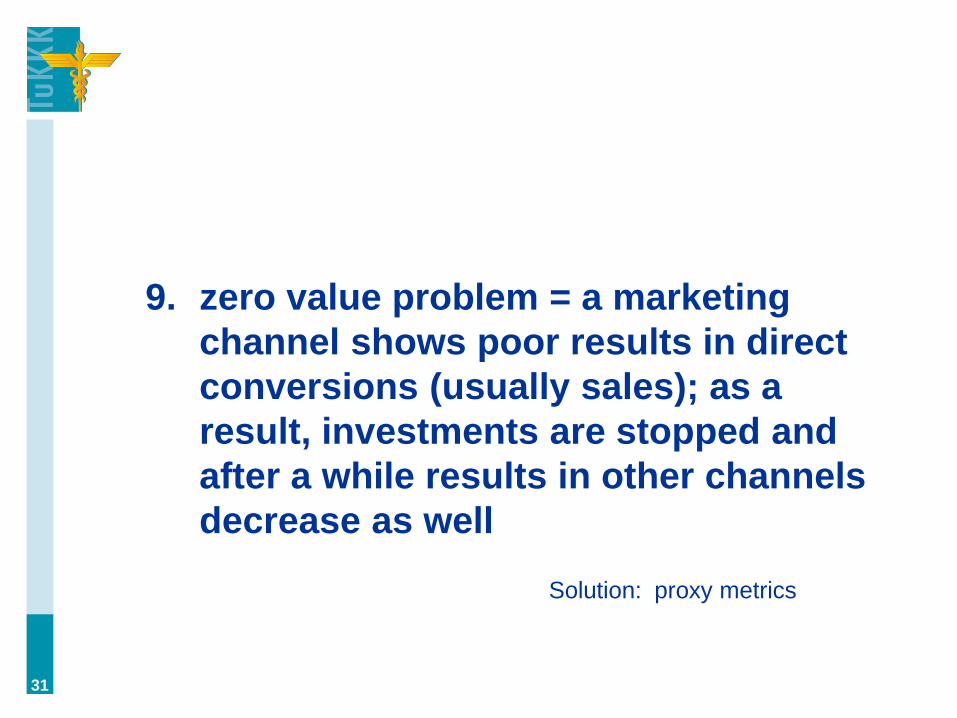
9. zero value problem = a marketing
channel shows poor results in direct
conversions (usually sales); as a
result, investments are stopped and
after a while results in other channels
decrease as well
31
proxy metrics Solution:
Why does the problem take place?
because channels are not isolated, but there are
spillover effects
a. horizontal spillover effects = between channels (e.g.,
Facebook creates interest, Google captures it)
b. vertical spillover effects = between funnel steps (e.g.,
conversion optimization and traffic generation; the
more you improve the bottom funnel metrics, the
more higher funnel metrics improve as well (but not
vice versa))
32
When & Why To Use Proxy Metrics
(Yamaguchi, 2013)
1. “Short-Term Goals: There are cases where a proportion of the
marketing budget is allocated […]towardincreasing higher-funnel
metrics such as leads or registrations under the assumption that
these efforts will eventually lead to a greater revenue base.
2. Trackability: For offline, or when there is a long conversion funnel
that involves non-digital steps such as call centers, lower-funnel
metrics may be difficult to link back to marketing touchpoint(s).
3. Attribution Bias: Different channels, or even individual campaigns
within a channel, are located at different points in the conversion
funnel. As a result, assessing performance only using final
conversion results in attribution […]notreflective of actual impact.
4. Conversion Delay: If the conversion funnel is long, there may be a
significant delay between top-of-funnel conversion to final conversion
in the order of weeks or even months. For these cases, proxy metrics
are useful for getting more timely feedback of campaign
performance.”
33
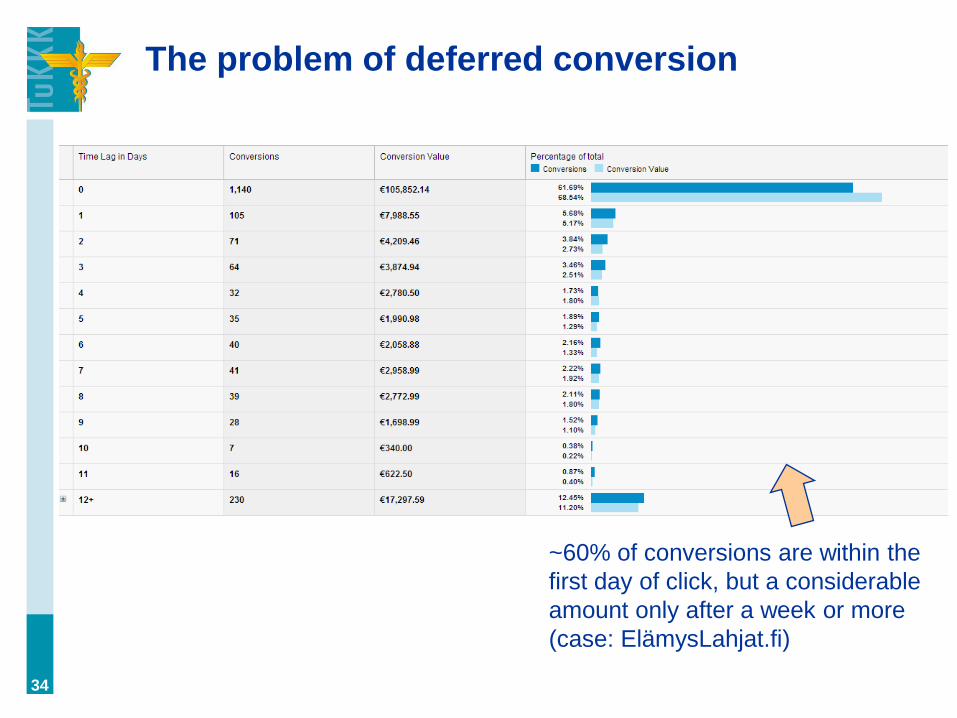
The problem of deferred conversion
34
~60% of conversions are within the
first day of click, but a considerable
amount only after a week or more
(case: ElämysLahjat.fi)
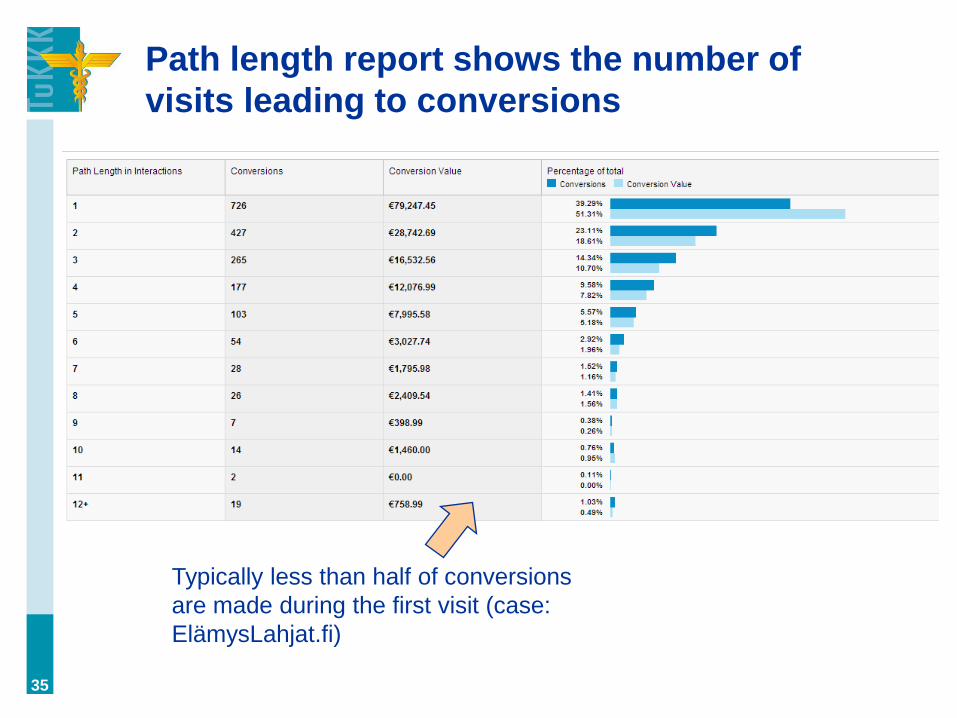
Path length report shows the number of
visits leading to conversions
35
Typically less than half of conversions
are made during the first visit (case:
ElämysLahjat.fi)
10.churn problem = a special case of
aggregation problem; the aggregate
numbers show growth whereas in
reality we are losing customers
36
cohort analysis Solution:
The basics of churn (WikiHow, 2015)
“Monitoringcustomerchurnisveryimportant,sinceitis
normally easier to retain customers than it is to
secure new ones. By calculating the churn rate
regularly, and investigating the reasons for that rate, it
may be possible to make changes in the way customers
are managed and reduce that rate in future.”
37
Makes sense.
You marketers
are so fine!
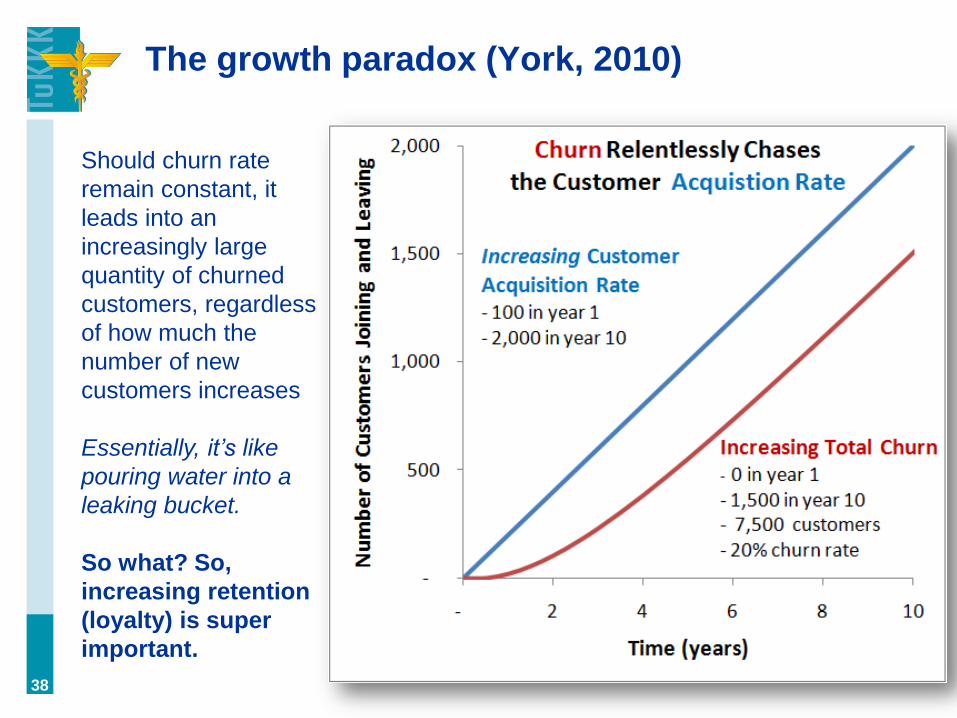
The growth paradox (York, 2010)
38
Should churn rate
remain constant, it
leads into an
increasingly large
quantity of churned
customers, regardless
of how much the
number of new
customers increases
Essentially, it’s like
pouring water into a
leaking bucket.
So what? So,
increasing retention
(loyalty) is super
important.
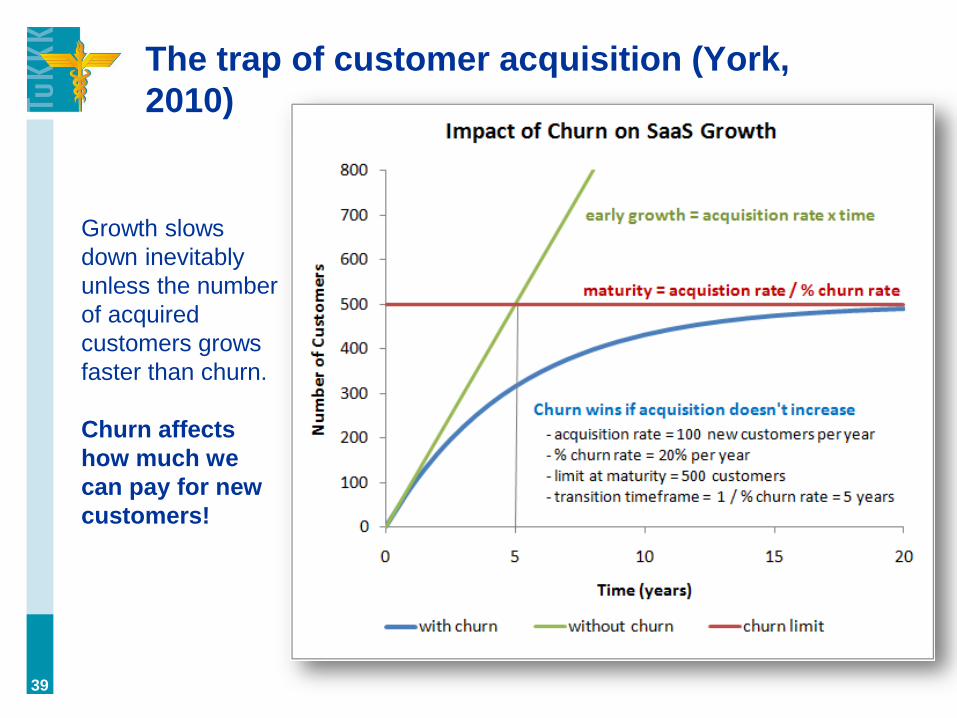
The trap of customer acquisition (York,
2010)
39
Growth slows
down inevitably
unless the number
of acquired
customers grows
faster than churn.
Churn affects
how much we
can pay for new
customers!
Essentially, churn problem is another
variant of the good ’ol aggregation problem
“Whenyou compare to the week 1 to week 2 cohort, you can
tell that 1) there was a 25% increase in new users (100k to
125k), and that the retention rate DECREASED to 40%
(50k/100k versus 50k/125k). This would be a red flag that your
site was sucking, even if your aggregate stats looked good:
In either case, this might hint at a bad systematic condition
within the site, but ultimately the aggregate numbers hide
the problem. In either case, not being able to acquire and retain
brand new users is a problem, and without measuring the
groups separately, it seems impossible to assess the true
situation.”(Chen, 2007)
40
How to calculate churn? (WikiHow, 2015)
“Customerchurn is normally presented as a percentage.
For example, if a company with 100 customers should
lose 10 clients but gain 7, this amounts to a net loss of
3 clients, and a customer churn of 3 percent. If the
same company lost 10 clients but gained 15, this would
constitute a net gain of 5 clients and result in a negative
churn rate.”
41
Customers both
come and go.
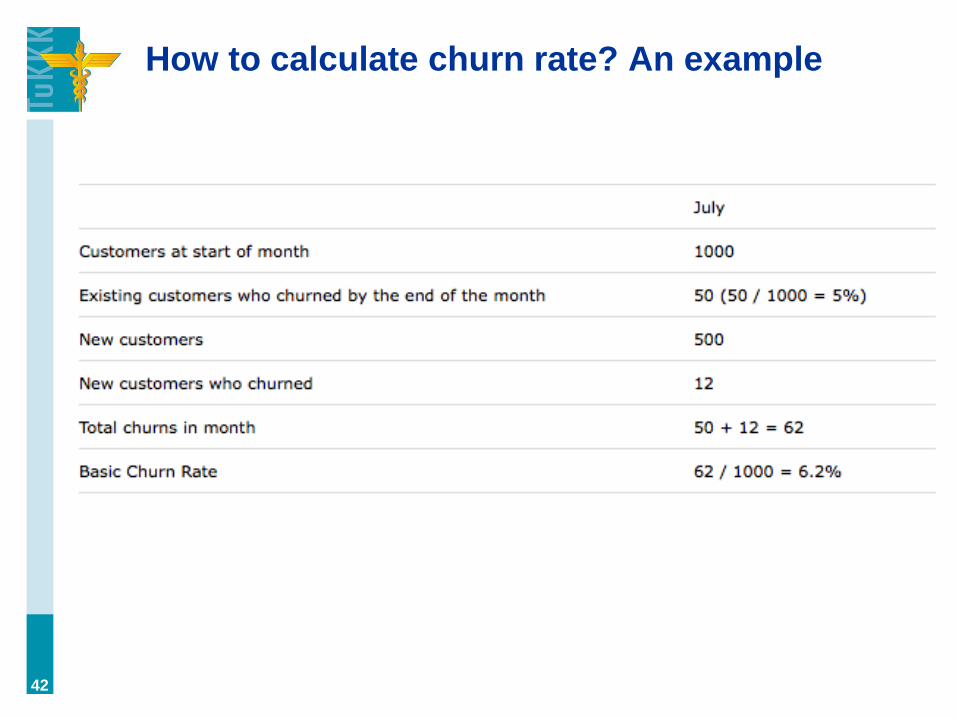
How to calculate churn rate? An example
42
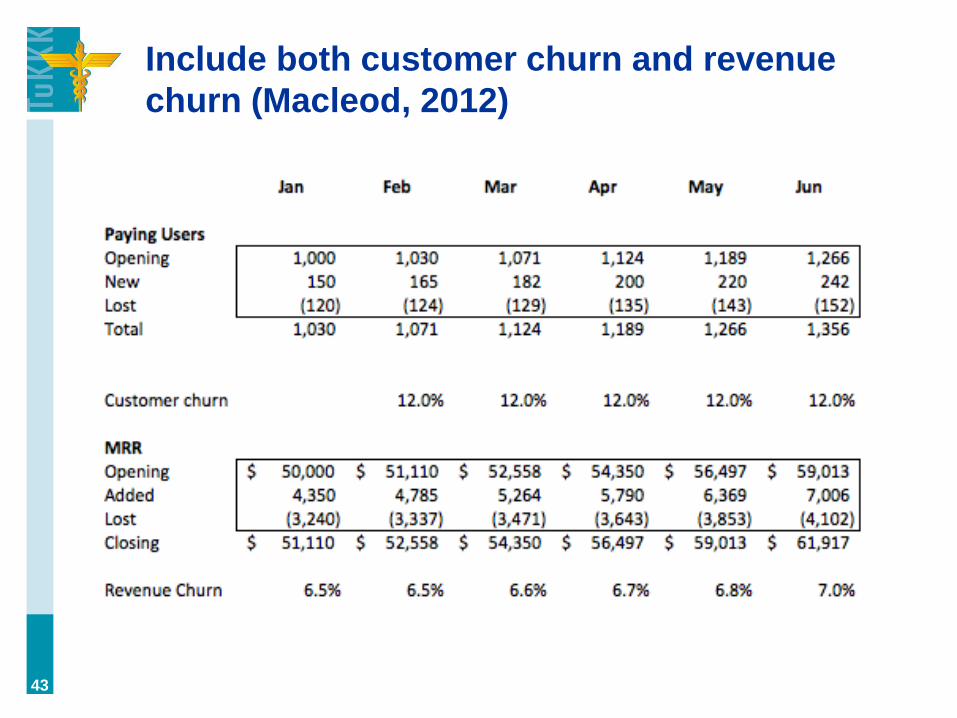
Include both customer churn and revenue
churn (Macleod, 2012)
43
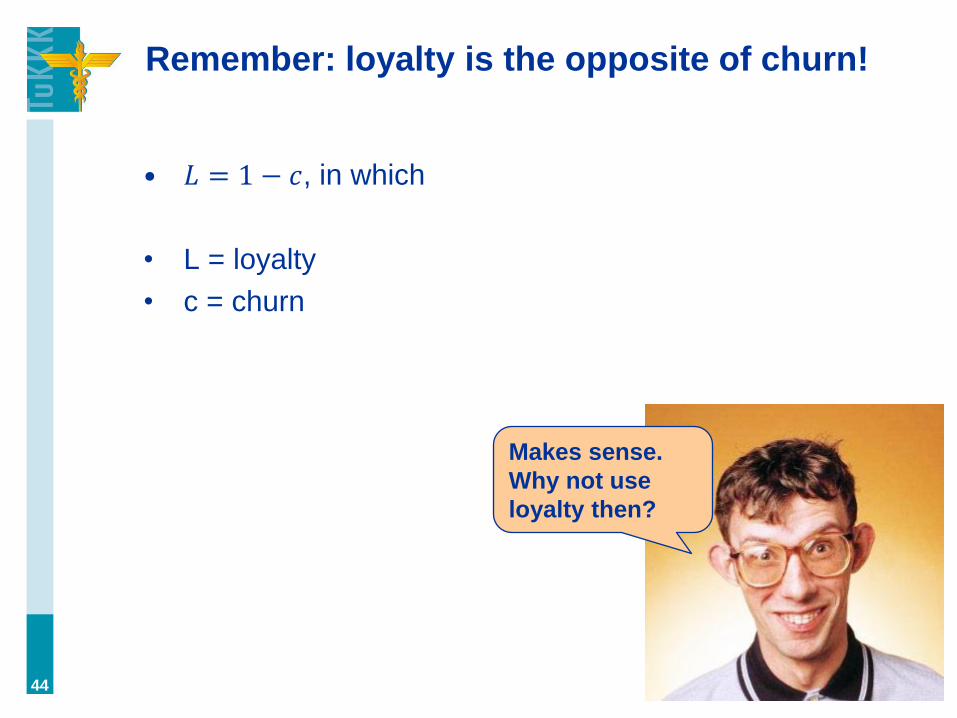
Remember: loyalty is the opposite of churn!
• 𝐿 = 1 − 𝑐, in which
• L = loyalty
• c = churn
44
Makes sense.
Why not use
loyalty then?
What is a cohort?
“Acohort is a group of people who share a
common characteristic or experience within a
defined period (e.g., are born, are exposed to a
drug or vaccine or pollutant, or undergo a certain
medical procedure). Thus a group of people who
were born on a day or in a particular period, say
1948, form a birth cohort.”(Wikipedia,2015)
45
I’m in the cohort of
1985. Compared to my
cohort average, I must
say I rock. Thug for
life, baby!
Cohort: an example (Cutroni, 2012)
“Here’san ecommerce example. If I was an ecommerce
business owner I would want to create a cohort of
customers who make their first purchase on Black
Friday. This cohort is important because they made
their first purchase during a very important time, the
holiday buying season.”
For example, comparing loyalty or lifetime value of
people buying/joining in a given day/week/month.
46
How is cohort segmentation different from
user segmentation?
• Well, it is a form of user segmentation
• But, segmentation criteria in cohort analysis needs to
include TIME (other criteria can be behavior, source,
etc.)
• For example,
– bought on December 2013
– visited the site January 2014
– came from Facebook in 2012
47
Cohort analysis: an example (Cutroni, 2012)
“Froman analysis perspective we want to segment this
group to observe their behavior over a longer period of
time.
• Do these customer behave differently?
• How do they differ from customers that buy at
other times of the year?
• Do they buy multiple times? Do they spend the
same amount?”
48
Why use cohorts?
• Well, as said, there are several ways why time of first
interaction would affect people’s behavior. Also our
actions differ:
– Monthly marketing campaigns differ
– Changes to product
– Gives a view to the change, not the aggregate picture
• Ultimately, cohorts segment by time and can
therefore uncover time-related aggregation issues.
• Free to choose criteria: demographics, source,
month, week…(but always tied to time)
49
Let’s practice!
1. Open the files (Exercise 4.xlsx, churn_instructions.txt)
2. Insert the data
3. Answer the questions
50
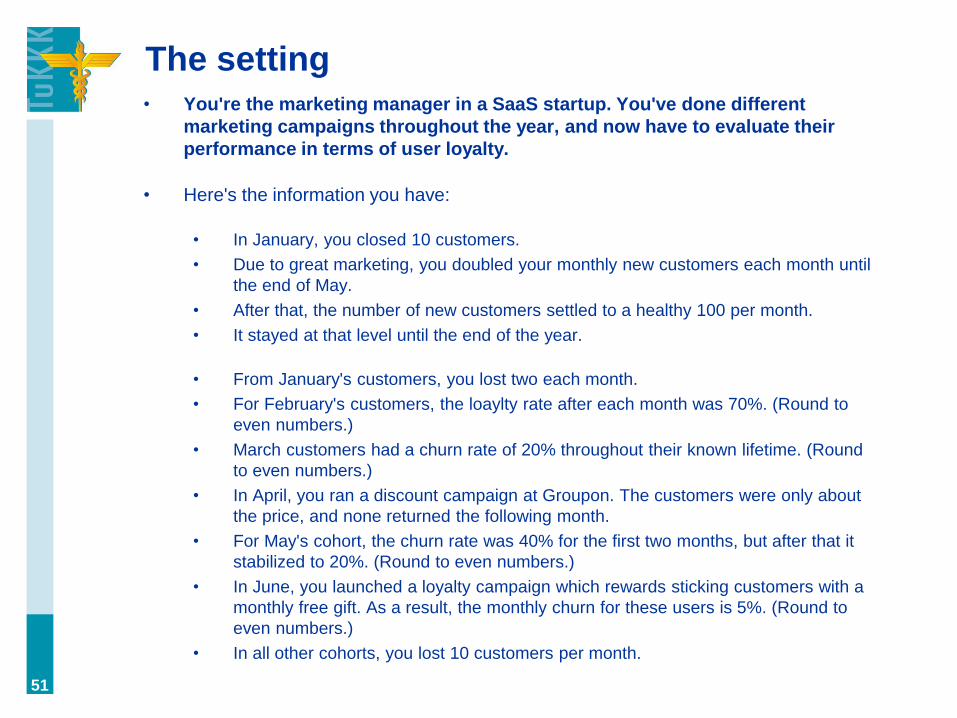
The setting • You're the marketing manager in a SaaS startup. You've done different
marketing campaigns throughout the year, and now have to evaluate their
performance in terms of user loyalty.
• Here's the information you have:
• In January, you closed 10 customers.
• Due to great marketing, you doubled your monthly new customers each month until
the end of May.
• After that, the number of new customers settled to a healthy 100 per month.
• It stayed at that level until the end of the year.
• From January's customers, you lost two each month.
• For February's customers, the loaylty rate after each month was 70%. (Round to
even numbers.)
• March customers had a churn rate of 20% throughout their known lifetime. (Round
to even numbers.)
• In April, you ran a discount campaign at Groupon. The customers were only about
the price, and none returned the following month.
• For May's cohort, the churn rate was 40% for the first two months, but after that it
stabilized to 20%. (Round to even numbers.)
• In June, you launched a loyalty campaign which rewards sticking customers with a
monthly free gift. As a result, the monthly churn for these users is 5%. (Round to
even numbers.)
• In all other cohorts, you lost 10 customers per month.
51
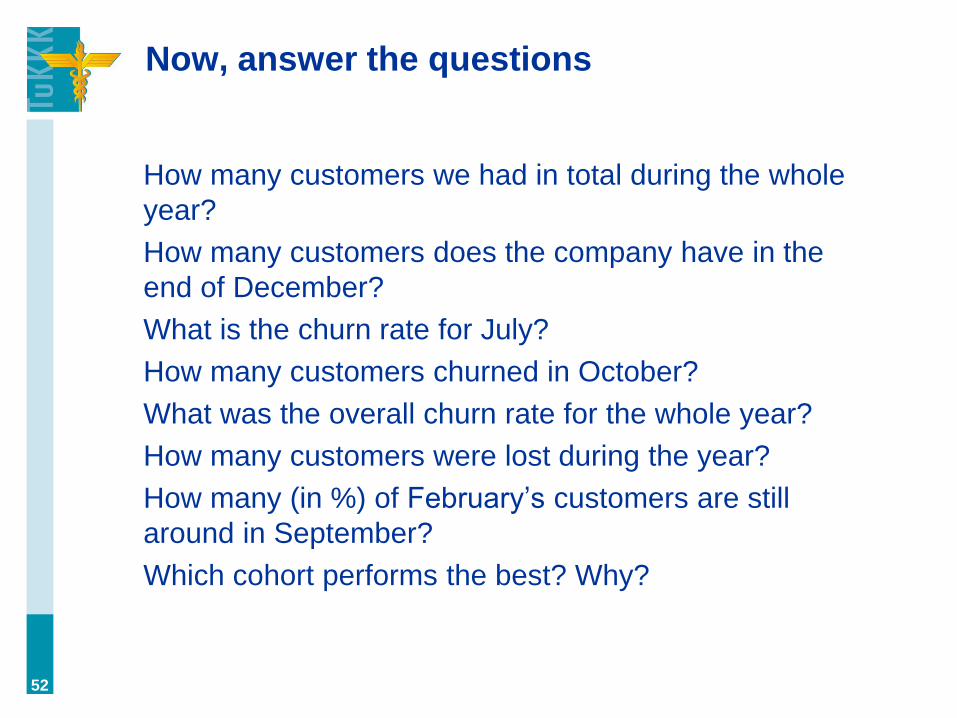
Now, answer the questions
How many customers we had in total during the whole
year?
How many customers does the company have in the
end of December?
What is the churn rate for July?
How many customers churned in October?
What was the overall churn rate for the whole year?
How many customers were lost during the year?
How many (in %) of February’s customers are still
around in September?
Which cohort performs the best? Why?
52
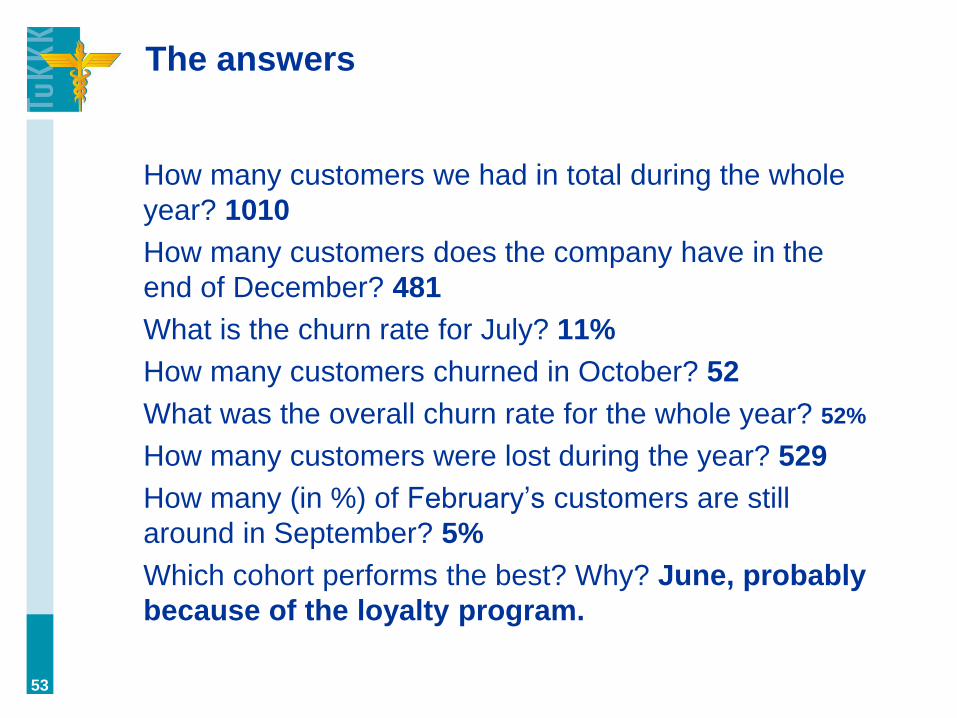
The answers
How many customers we had in total during the whole
year? 1010
How many customers does the company have in the
end of December? 481
What is the churn rate for July? 11%
How many customers churned in October? 52
What was the overall churn rate for the whole year? 52%
How many customers were lost during the year? 529
How many (in %) of February’s customers are still
around in September? 5%
Which cohort performs the best? Why? June, probably
because of the loyalty program.
53
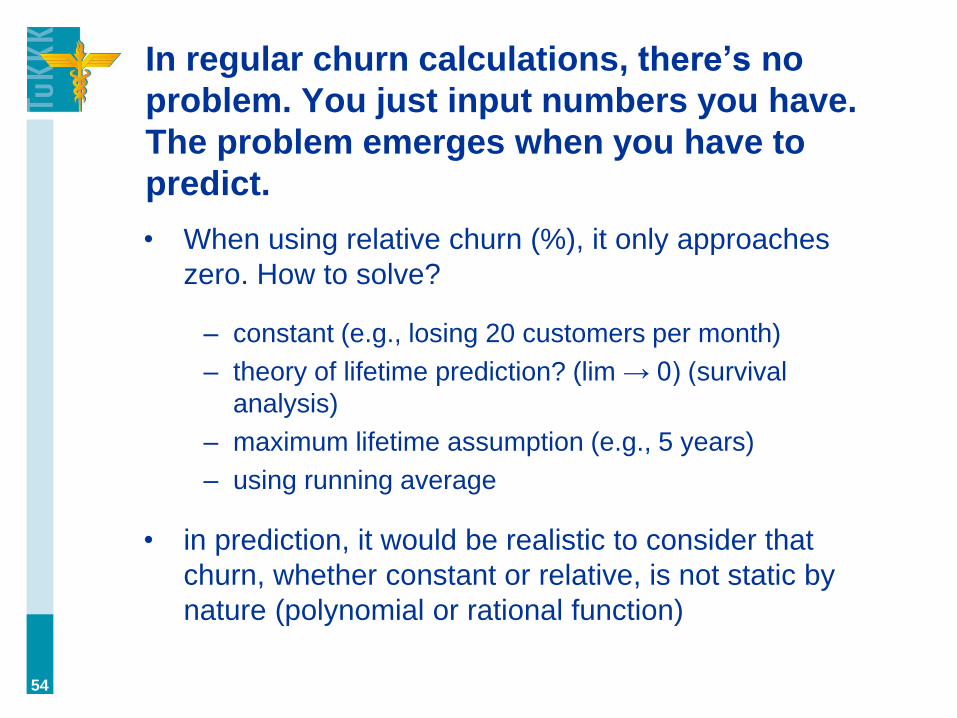
In regular churn calculations, there’s no
problem. You just input numbers you have.
The problem emerges when you have to
predict.
• When using relative churn (%), it only approaches
zero. How to solve?
– constant (e.g., losing 20 customers per month)
– theory of lifetime prediction? (lim →0)(survival
analysis)
– maximum lifetime assumption (e.g., 5 years)
– using running average
• in prediction, it would be realistic to consider that
churn, whether constant or relative, is not static by
nature (polynomial or rational function)
54
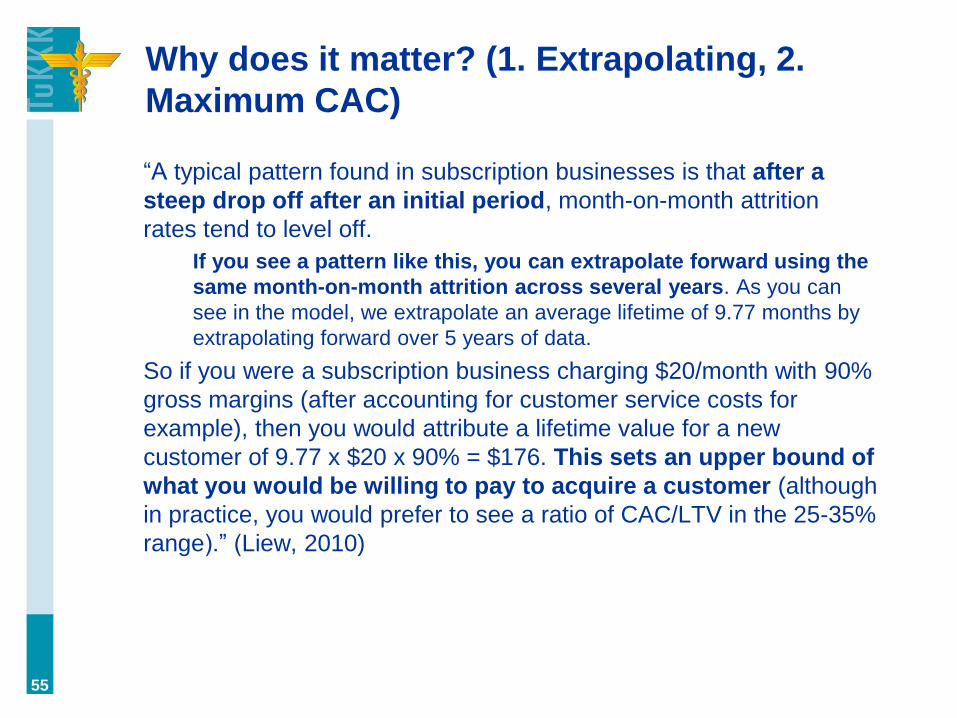
Why does it matter? (1. Extrapolating, 2.
Maximum CAC)
“Atypical pattern found in subscription businesses is that after a
steep drop off after an initial period, month-on-month attrition
rates tend to level off.
If you see a pattern like this, you can extrapolate forward using the
same month-on-month attrition across several years. As you can
see in the model, we extrapolate an average lifetime of 9.77 months by
extrapolating forward over 5 years of data.
So if you were a subscription business charging $20/month with 90%
gross margins (after accounting for customer service costs for
example), then you would attribute a lifetime value for a new
customer of 9.77 x $20 x 90% = $176. This sets an upper bound of
what you would be willing to pay to acquire a customer (although
in practice, you would prefer to see a ratio of CAC/LTV in the 25-35%
range).”(Liew, 2010)
55
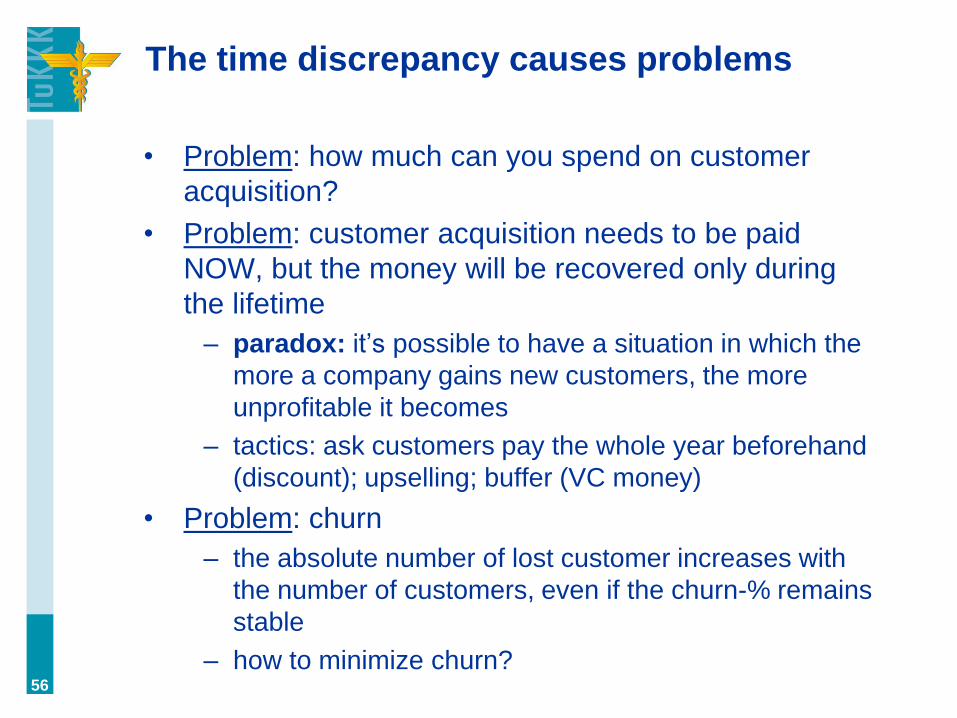
The time discrepancy causes problems
• Problem: how much can you spend on customer
acquisition?
• Problem: customer acquisition needs to be paid
NOW, but the money will be recovered only during
the lifetime
– paradox: it’s possible to have a situation in which the
more a company gains new customers, the more
unprofitable it becomes
– tactics: ask customers pay the whole year beforehand
(discount); upselling; buffer (VC money)
• Problem: churn
– the absolute number of lost customer increases with
the number of customers, even if the churn-% remains
stable
– how to minimize churn? 56