Embed Size (px)
Citation preview
DATA SCIENCEPOP UP
AUSTIN
Predicting Customer Behavior & Enhancing Customer Experience
Vinny SenguttuvanSr. Data Scientist, Metis
DATA SCIENCEPOP UP
AUSTIN
#datapopupaustin
April 13, 2016Galvanize, Austin Campus

PREDICTING CUSTOMERS
Vinny SenguttuvanSenior Data ScientistMETIS
5PREDICTING CUSTOMERS
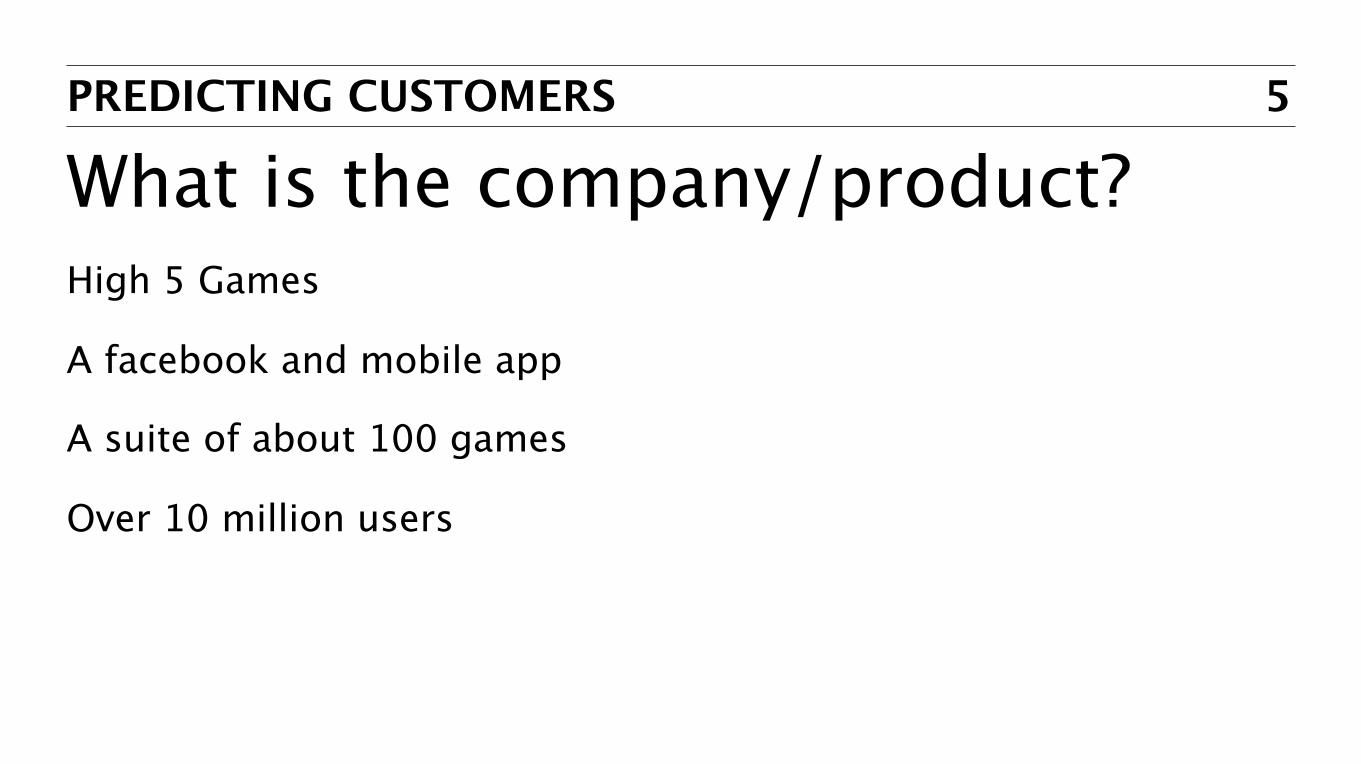
What is the company/product?High 5 Games
A facebook and mobile app
A suite of about 100 games
Over 10 million users
6PREDICTING CUSTOMERS
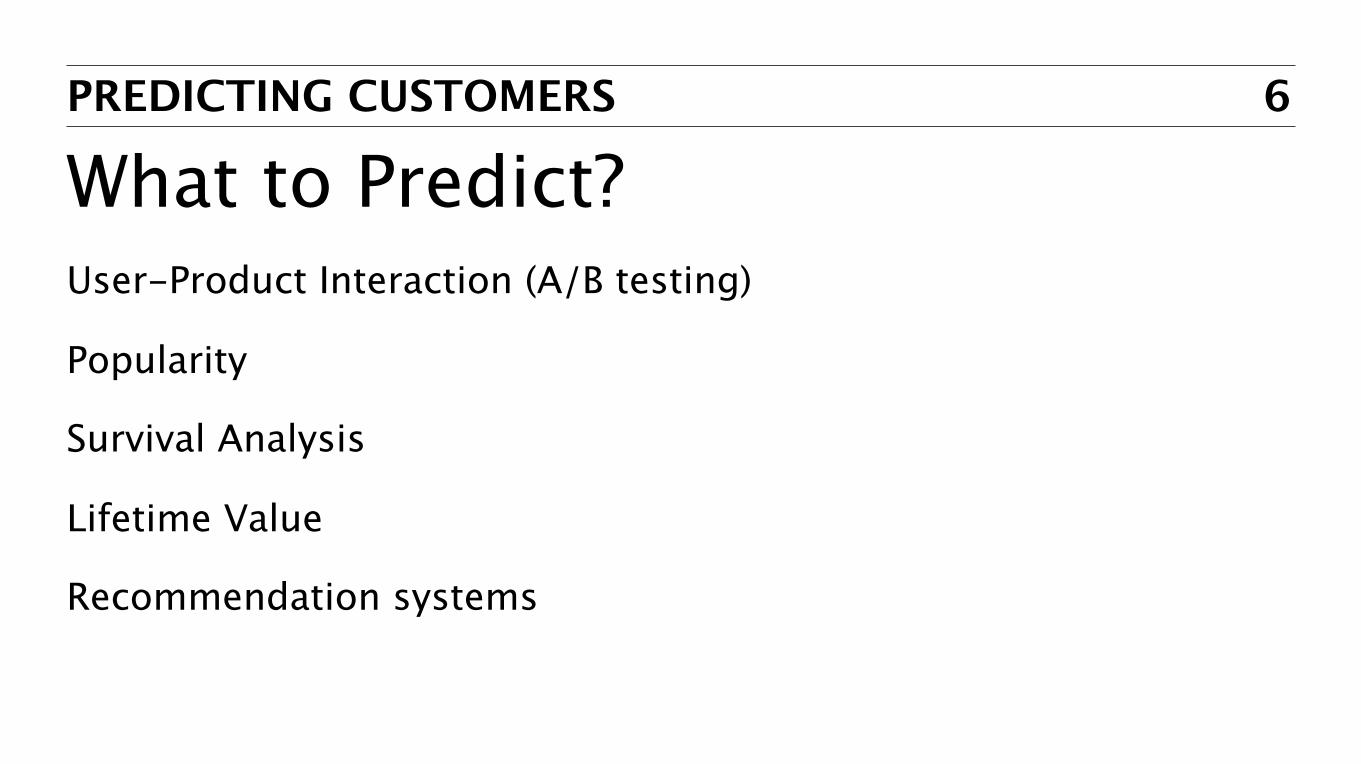
What to Predict?User-Product Interaction (A/B testing)
Popularity
Survival Analysis
Lifetime Value
Recommendation systems
7PREDICTING CUSTOMERS
The main challenge:Most users play for free
2% of the users contribute to all revenue
2% of those 2% are responsible for over half the entire revenue
Double singularity

A/B TESTING
9A/B TESTING
Classic Hypothesis Testing
There is a current product design/feature: A
There is a suggested improvement or variation: B
We split the users into two groups and offer them A or B
10A/B TESTING
Classic Hypothesis TestingAn Example hypothesis:
Moving the “buy credits” button from top-right to a more prominent position in the mid-right of the screen and making it bigger and brighter will lead to at least 20% more clicks.
11A/B TESTING
Classic Hypothesis TestingAn Example hypothesis:
Moving the “buy credits” button from top-right to a more prominent position in the mid-right of the screen and making it bigger and brighter will lead to at least 20% more clicks.
It is important to have a minimum improvement requirement, since there is a cost involved in making the change.
12A/B TESTING
Classic Hypothesis TestingNeed enough data to:• separate the probability density functions• get the required sample size• achieve statistical significance
13A/B TESTING
Classic Hypothesis TestingNeed enough data to:• separate the probability density functions• get the required sample size• achieve statistical significance1. A long list of changes means not enough time per change
14A/B TESTING
Classic Hypothesis TestingNeed enough data to:• separate the probability density functions• get the required sample size• achieve statistical significance1. A long list of changes means not enough time per change
2. Often the high monetizers are the primary test subjects, so the double singularity is a big issue
15A/B TESTING
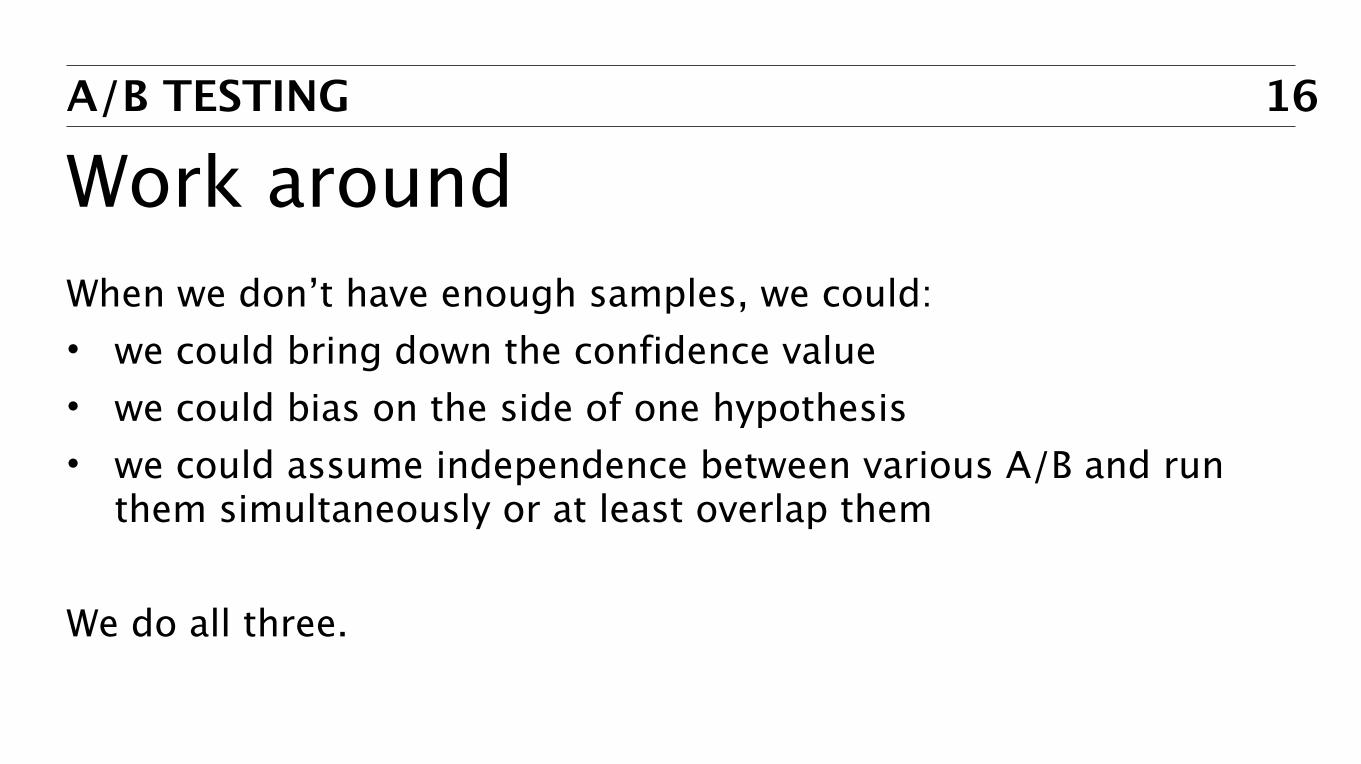
Work aroundWhen we don’t have enough samples, we could:• we could bring down the confidence value• we could bias on the side of one hypothesis• we could assume independence between various A/B and run
them simultaneously or at least overlap them
16A/B TESTING
Work aroundWhen we don’t have enough samples, we could:• we could bring down the confidence value• we could bias on the side of one hypothesis• we could assume independence between various A/B and run
them simultaneously or at least overlap them
We do all three.
17A/B TESTING
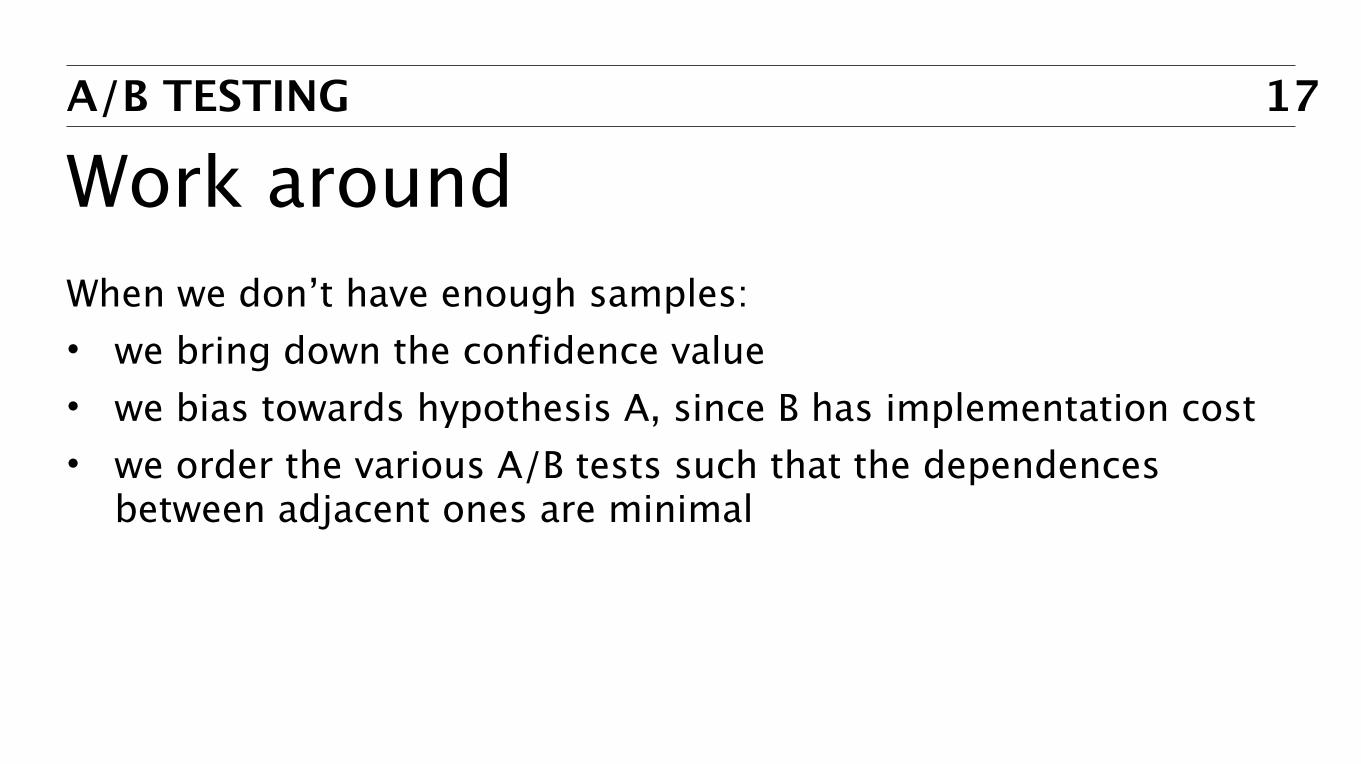
Work aroundWhen we don’t have enough samples:• we bring down the confidence value• we bias towards hypothesis A, since B has implementation cost• we order the various A/B tests such that the dependences
between adjacent ones are minimal

POPULARITY METRICS
19POPULARITY METRIC
Rank or classify products or games• New products added continuously.• Some locked and slowly unlocked.• Others fully unlocked to all users.
20POPULARITY METRIC
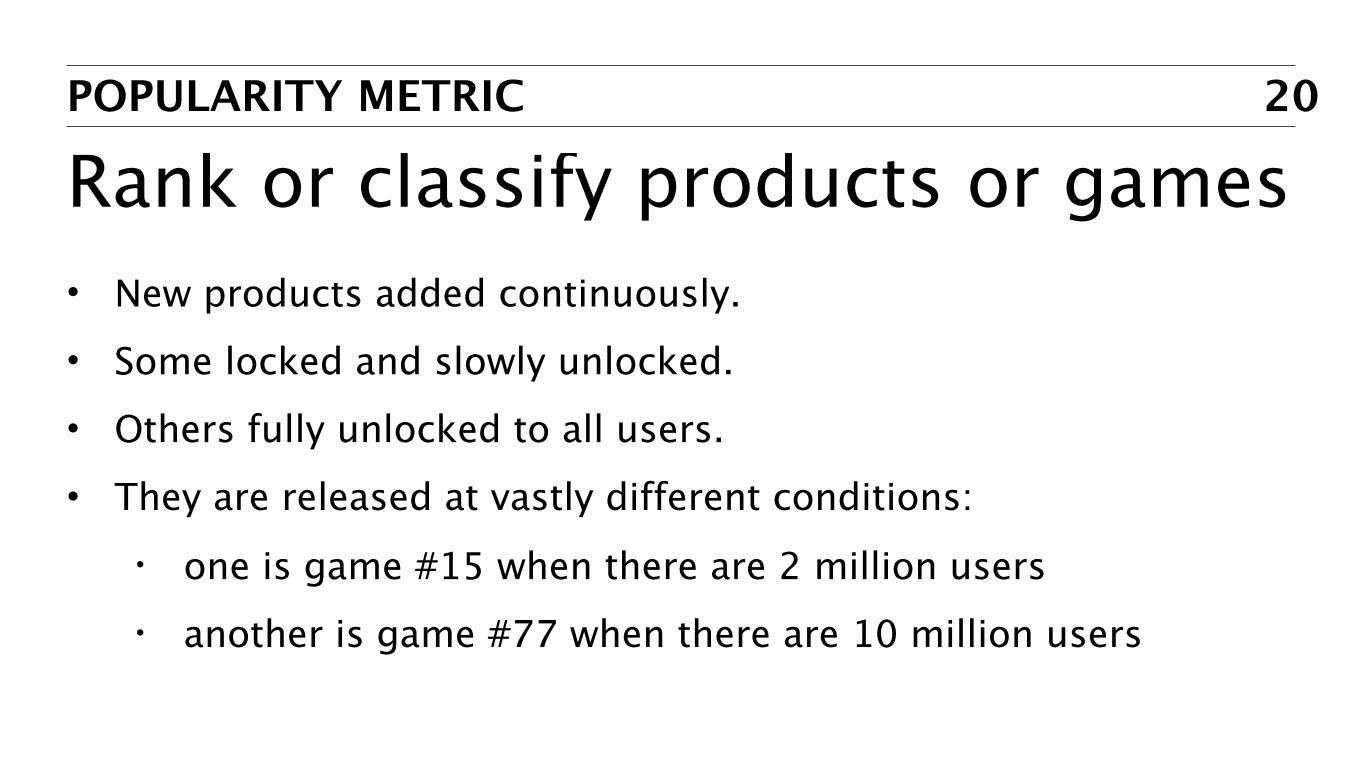
Rank or classify products or games• New products added continuously.• Some locked and slowly unlocked.• Others fully unlocked to all users.• They are released at vastly different conditions:
• one is game #15 when there are 2 million users• another is game #77 when there are 10 million users
21POPULARITY METRIC
Rank or classify products or gamesOpen problem
Also faced with music and other products
22POPULARITY METRIC
Rank or classify products or gamesOpen problem
Also faced with music and other products
We whiteboarded various approaches including N dimensional product spaces and harmonic distributions.
Either they were too complex to build or the data was too noisy.
23POPULARITY METRIC
Rank or classify products or gamesWent with two simple metrics:
1. An average-weighted-spin: Spins per game, over total spins, times number of games unlocked, time log number of days since the unlock of the game.
2. A Bayesian method (my colleague implemented this)
24POPULARITY METRIC
Rank or classify products or gamesWent with two simple metrics:
1. An average-weighted-spin: Spins per game, over total spins, times number of games unlocked, time log number of days since the unlock of the game.
2. A Bayesian method (my colleague implemented this)
Both performed well but had flaws. Used an intersection of the two.

SURVIVAL ANALYSIS
26SURVIVAL ANALYSIS
Survival of usersWanted to know:
1. How many users are still active after a given time since the creation of their account
2. When is a user at risk of discontinuing to use the product
27SURVIVAL ANALYSIS
Survival of usersWanted to know:
1. How many users are still active after a given time since the creation of their account
2. When is a user at risk of discontinuing to use the product
This problem had its beginnings in the medical industry but is widely among internet services and products
28SURVIVAL ANALYSIS
Survival of usersA lot can be learned by grouping users by cohorts and plotting survival rates over time
We can also observe return rates of users after each additional day of absence.
Cox survival model (my colleague worked on this)
29SURVIVAL ANALYSIS
Survival of usersOur observations:
The survival rate of new users were significantly lesser than earlier users and continues to drop
There was a clear day span, if a user was absent by more than that, the chance of their return dropped significantly
30SURVIVAL ANALYSIS
Survival of usersOur actions:
Factor in the decline in quality of the users while estimating revenue. Also focus on acquisition channels that provided better players
Reach out to users at risk of discontinuation with notifications and offers before they hit the absence threshold

PREDICTIVE LIFETIME VALUE
32PREDICTIVE LIFETIME VALUE
Lifetime ValueThe total revenue from a specific user over entire time with product
Often defined as the revenue during the first 365 days of use
Very significant because of costs:• 10% of the revenue spent on acquisition ads• 30% revenue goes to app hosts (facebook/apple)
33PREDICTIVE LIFETIME VALUE
Lifetime ValueThe cost of ads are per new player acquired
While the revenue comes from a small subset of those players
34PREDICTIVE LIFETIME VALUE
Lifetime ValueThe cost of ads are per new player acquired
While the revenue comes from a small subset of those players
So we wanted to build an aggregated LTV for various acquisition sources
35PREDICTIVE LIFETIME VALUE
Lifetime ValueIt’s a time series
Modeling that way would use all available information, but is difficult
36PREDICTIVE LIFETIME VALUE
Lifetime ValueIt’s a time series
Modeling that way would use all available information, but is difficult
Flipped it into a regression problem
37PREDICTIVE LIFETIME VALUE
Regression ProblemPredict 365 day revenue based on user’s first month data.
38PREDICTIVE LIFETIME VALUE
Regression ProblemPredict 365 day revenue based on user’s first month data.
SpendPurchase countDays of playPlayer level achieved
39PREDICTIVE LIFETIME VALUE
Regression ProblemPredict 365 day revenue based on user’s first month data.
SpendPurchase countDays of playPlayer level achievedDate joined (because of the decline in player quality)
40PREDICTIVE LIFETIME VALUE
Regression ProblemIncluding the date joined as a feature makes it a sort of time series
Had to be careful in the setting up of the train and test data
41PREDICTIVE LIFETIME VALUE
Regression ProblemIncluding the date joined as a feature makes it a sort of time series
Had to be careful in the setting up of the train and test data
Prediction rates were 80%, 90% and 95% after 1, 2 & 3 months
Surprising discoveries which made us change strategies

RECOMMENDATION SYSTEMS

44RECOMMENDATION SYSTEMS
How does Pandora do it?
Specialists listened to every song and gave each of them various attributes (about 30 to a hundred)
Two songs are similar if their distance in that n-dimensional space is minimal
This works with a binary scale or a point system

46RECOMMENDATION SYSTEMS
How does YouTube do it?
Algorithmic:• Find all users who listened to the song• Find the song that set of people had listened to the most
The actual solution is a little different but concept is the same
47RECOMMENDATION SYSTEMS
Pandora: • intrinsic recommendation system• internal elements (features) of the songs are used to
measure similarity
YouTube:• extrinsic recommendation system• recommendations are solely based on peer preferences• hence the term “collaborative filtering”
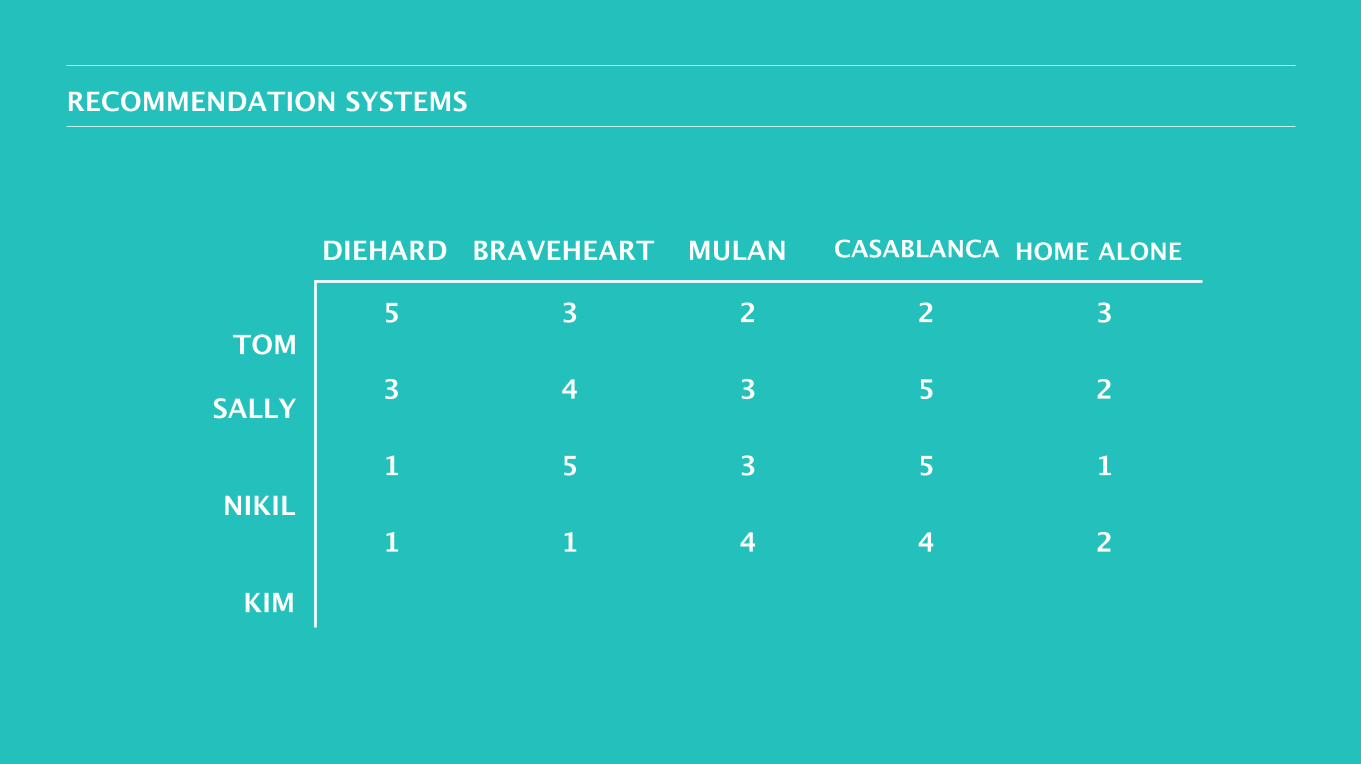
48RECOMMENDATION SYSTEMS
DIEHARD BRAVEHEART MULAN CASABLANCA HOME ALONE
5
3
1
1
3
4
5
1
2
3
3
4
2
5
5
4
3
2
1
2
TOM
SALLY
NIKIL
KIM
49RECOMMENDATION SYSTEMS
ACTION COMEDY HISTORY COMING-OF-AGE ROMANCE
5 3 1 1
5 5 1 4
1 3 5 4
1 2 1 4
1 5 1 3
TOM SALLYNIKIL
KIM
DIE HARD BRAVEHEART MULAN CASABLANCA HOME ALONE
5 2 1 2 1
5 1 5 2 4
4 2 4 4 4
2 2 4 2 5
3 4 1 4 1
ACTION COMEDY HISTORY
COMING-OF-AGE ROMANCE
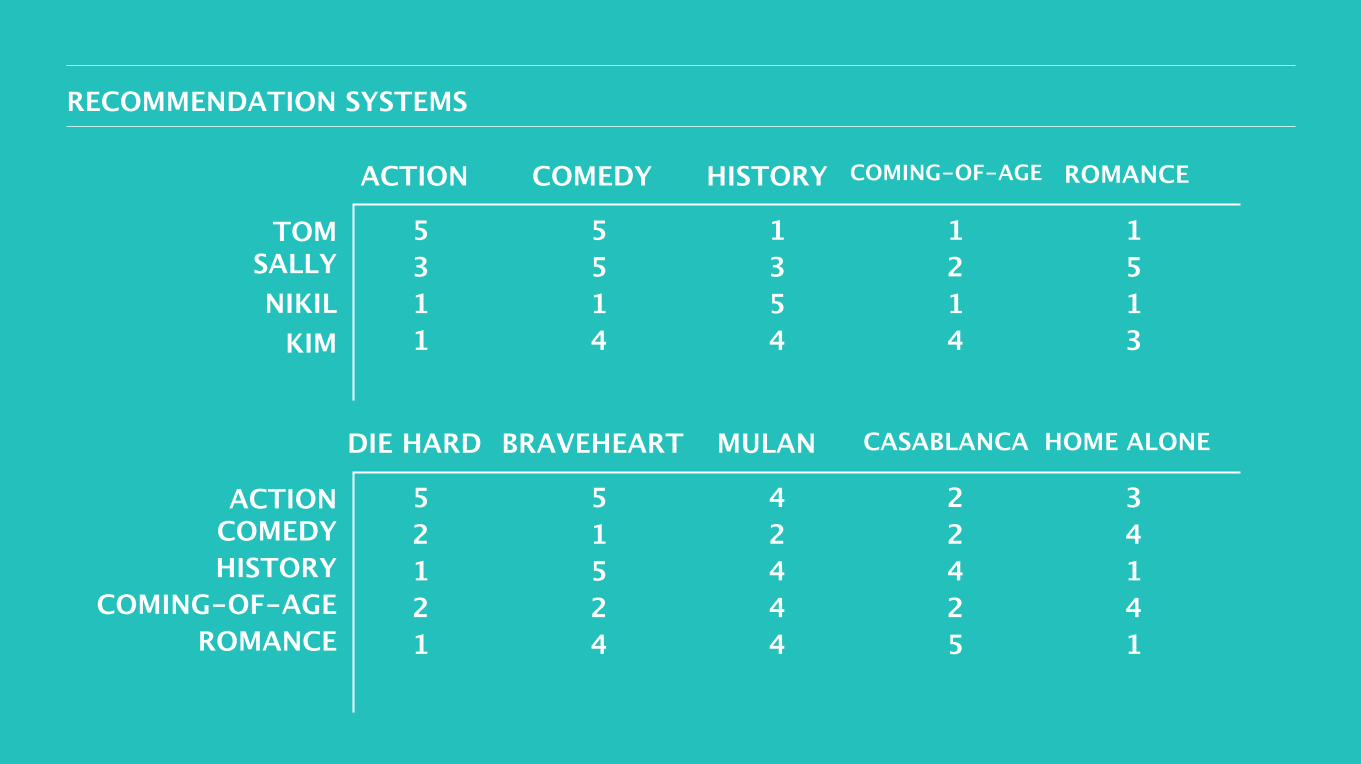
50RECOMMENDATION SYSTEMS
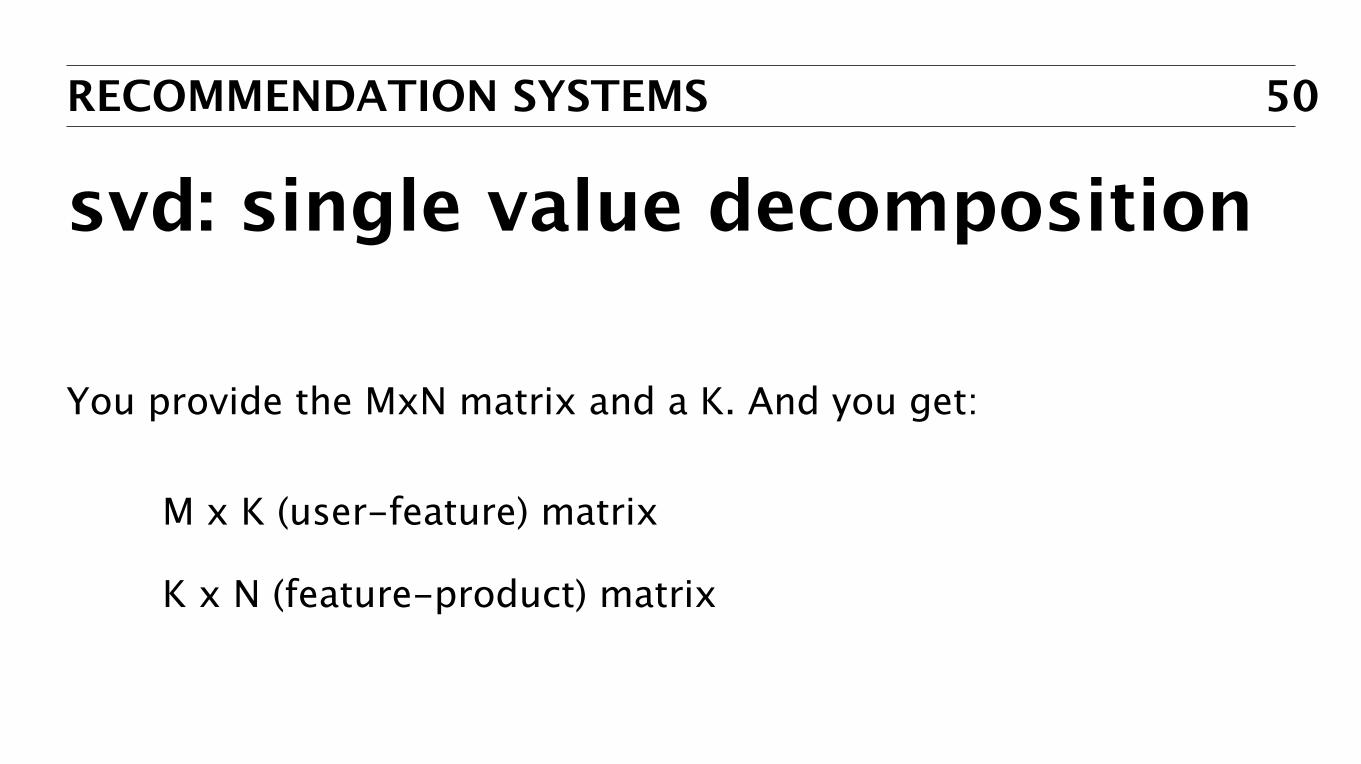
svd: single value decomposition
You provide the MxN matrix and a K. And you get:
M x K (user-feature) matrix
K x N (feature-product) matrix

51RECOMMENDATION SYSTEMS
Collaborative FilteringUser & Product Matrix can be decomposed:
(User & Features) and (Features & Product)
52RECOMMENDATION SYSTEMS
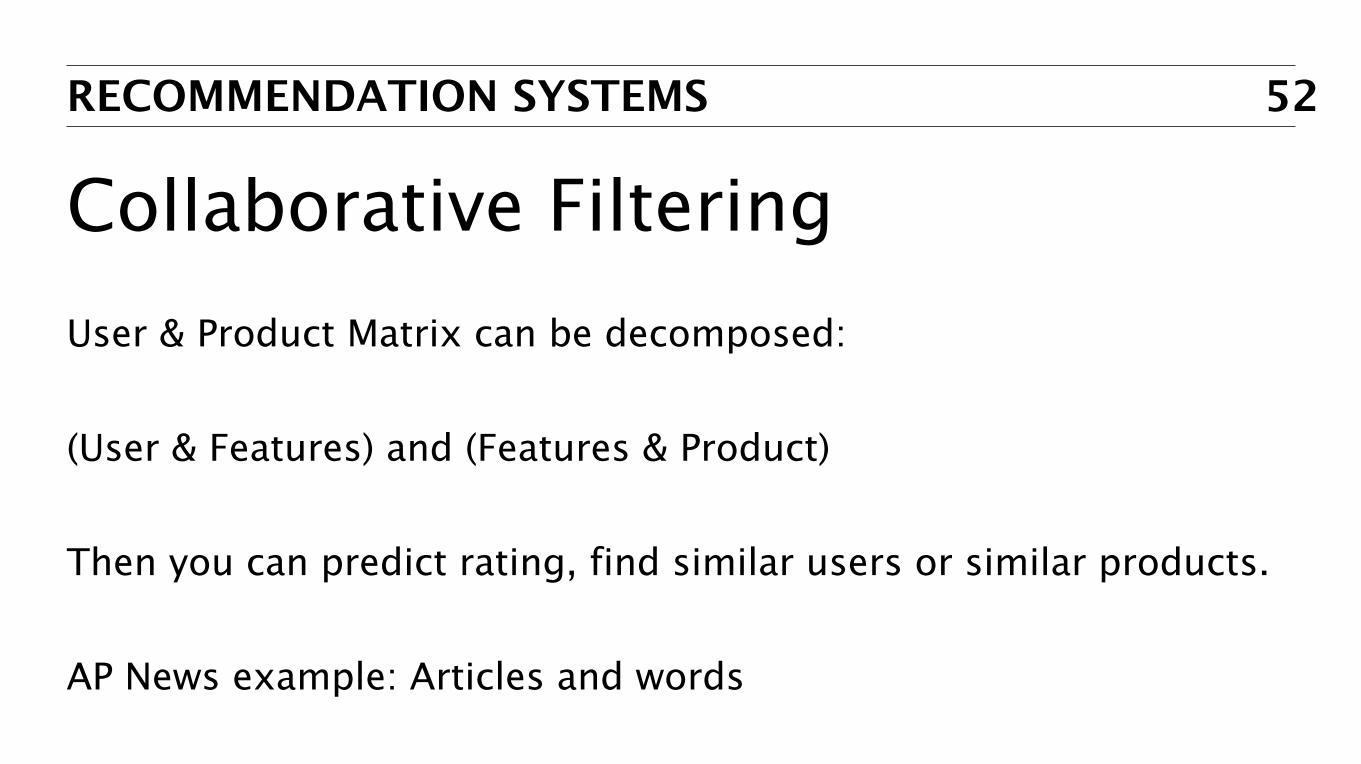
Collaborative FilteringUser & Product Matrix can be decomposed:
(User & Features) and (Features & Product)
Then you can predict rating, find similar users or similar products.
AP News example: Articles and words

53RECOMMENDATION SYSTEMS
Collaborative Filtering
How to choose “K”?

54RECOMMENDATION SYSTEMS
Collaborative Filtering
How to choose “K”?
Could try various K, decompose, multiply and compare (RMSE) to original matrix (cross-validation)
Or look at Eigen Values
55RECOMMENDATION SYSTEMS
Collaborative Filtering
What if the ratings are not clearly defined?
56RECOMMENDATION SYSTEMS
Collaborative Filtering
What if the ratings are not clearly defined?
Could use click, percentage of view, number of views, like, share
57RECOMMENDATION SYSTEMS
Collaborative Filtering
For Missing values:Use averages. Or sparse matrix solvers.
Normalization is important.Outliers and noise get magnified.

58RECOMMENDATION SYSTEMS
Collaborative Filtering
What if there is a progression or order to the content?

59RECOMMENDATION SYSTEMS
Collaborative Filtering
What if there is a progression or order to the content?
Have to do some supervision.
60RECOMMENDATION SYSTEMS
Intrinsic recommendation systemsFeatures are well definedDon’t need user data to beginManual
61RECOMMENDATION SYSTEMS
Extrinsic recommendation systemsAutomaticFeatures are undefinedNeed a lot of user dataNot automatically adaptive to special cases (like order-specific entries)
62RECOMMENDATION SYSTEMS
Combined technique
Begin with the intrinsic knowledgeBetter understanding of the contentEffective initial recommendationOnce enough data points are accumulated, switch to the extrinsic model

63RECOMMENDATION SYSTEMS
Combined technique
Double the workMost effective, especially for timely contentThis is what Netflix does… likely the best recommendation system
64RECOMMENDATION SYSTEMS
What more, with recommender systems?


70RECOMMENDATION SYSTEMS
Plus recommender systems can be more than mere recommendation..
DATA SCIENCEPOP UP
AUSTIN
@datapopup #datapopupaustin