Embed Size (px)
Citation preview
Data Science in the Real World: Making a
Difference
Srinath PereraDirector Research WSO2, Apache Member
(@srinath_perera) [email protected]
StatDay 2015 @ University of Colombo
Outline
Making sense of World’s Data Building Data Systems Changing Dynamics of Data Analysis
with Big Data ( Sensor Data) Challenges and Open Problems
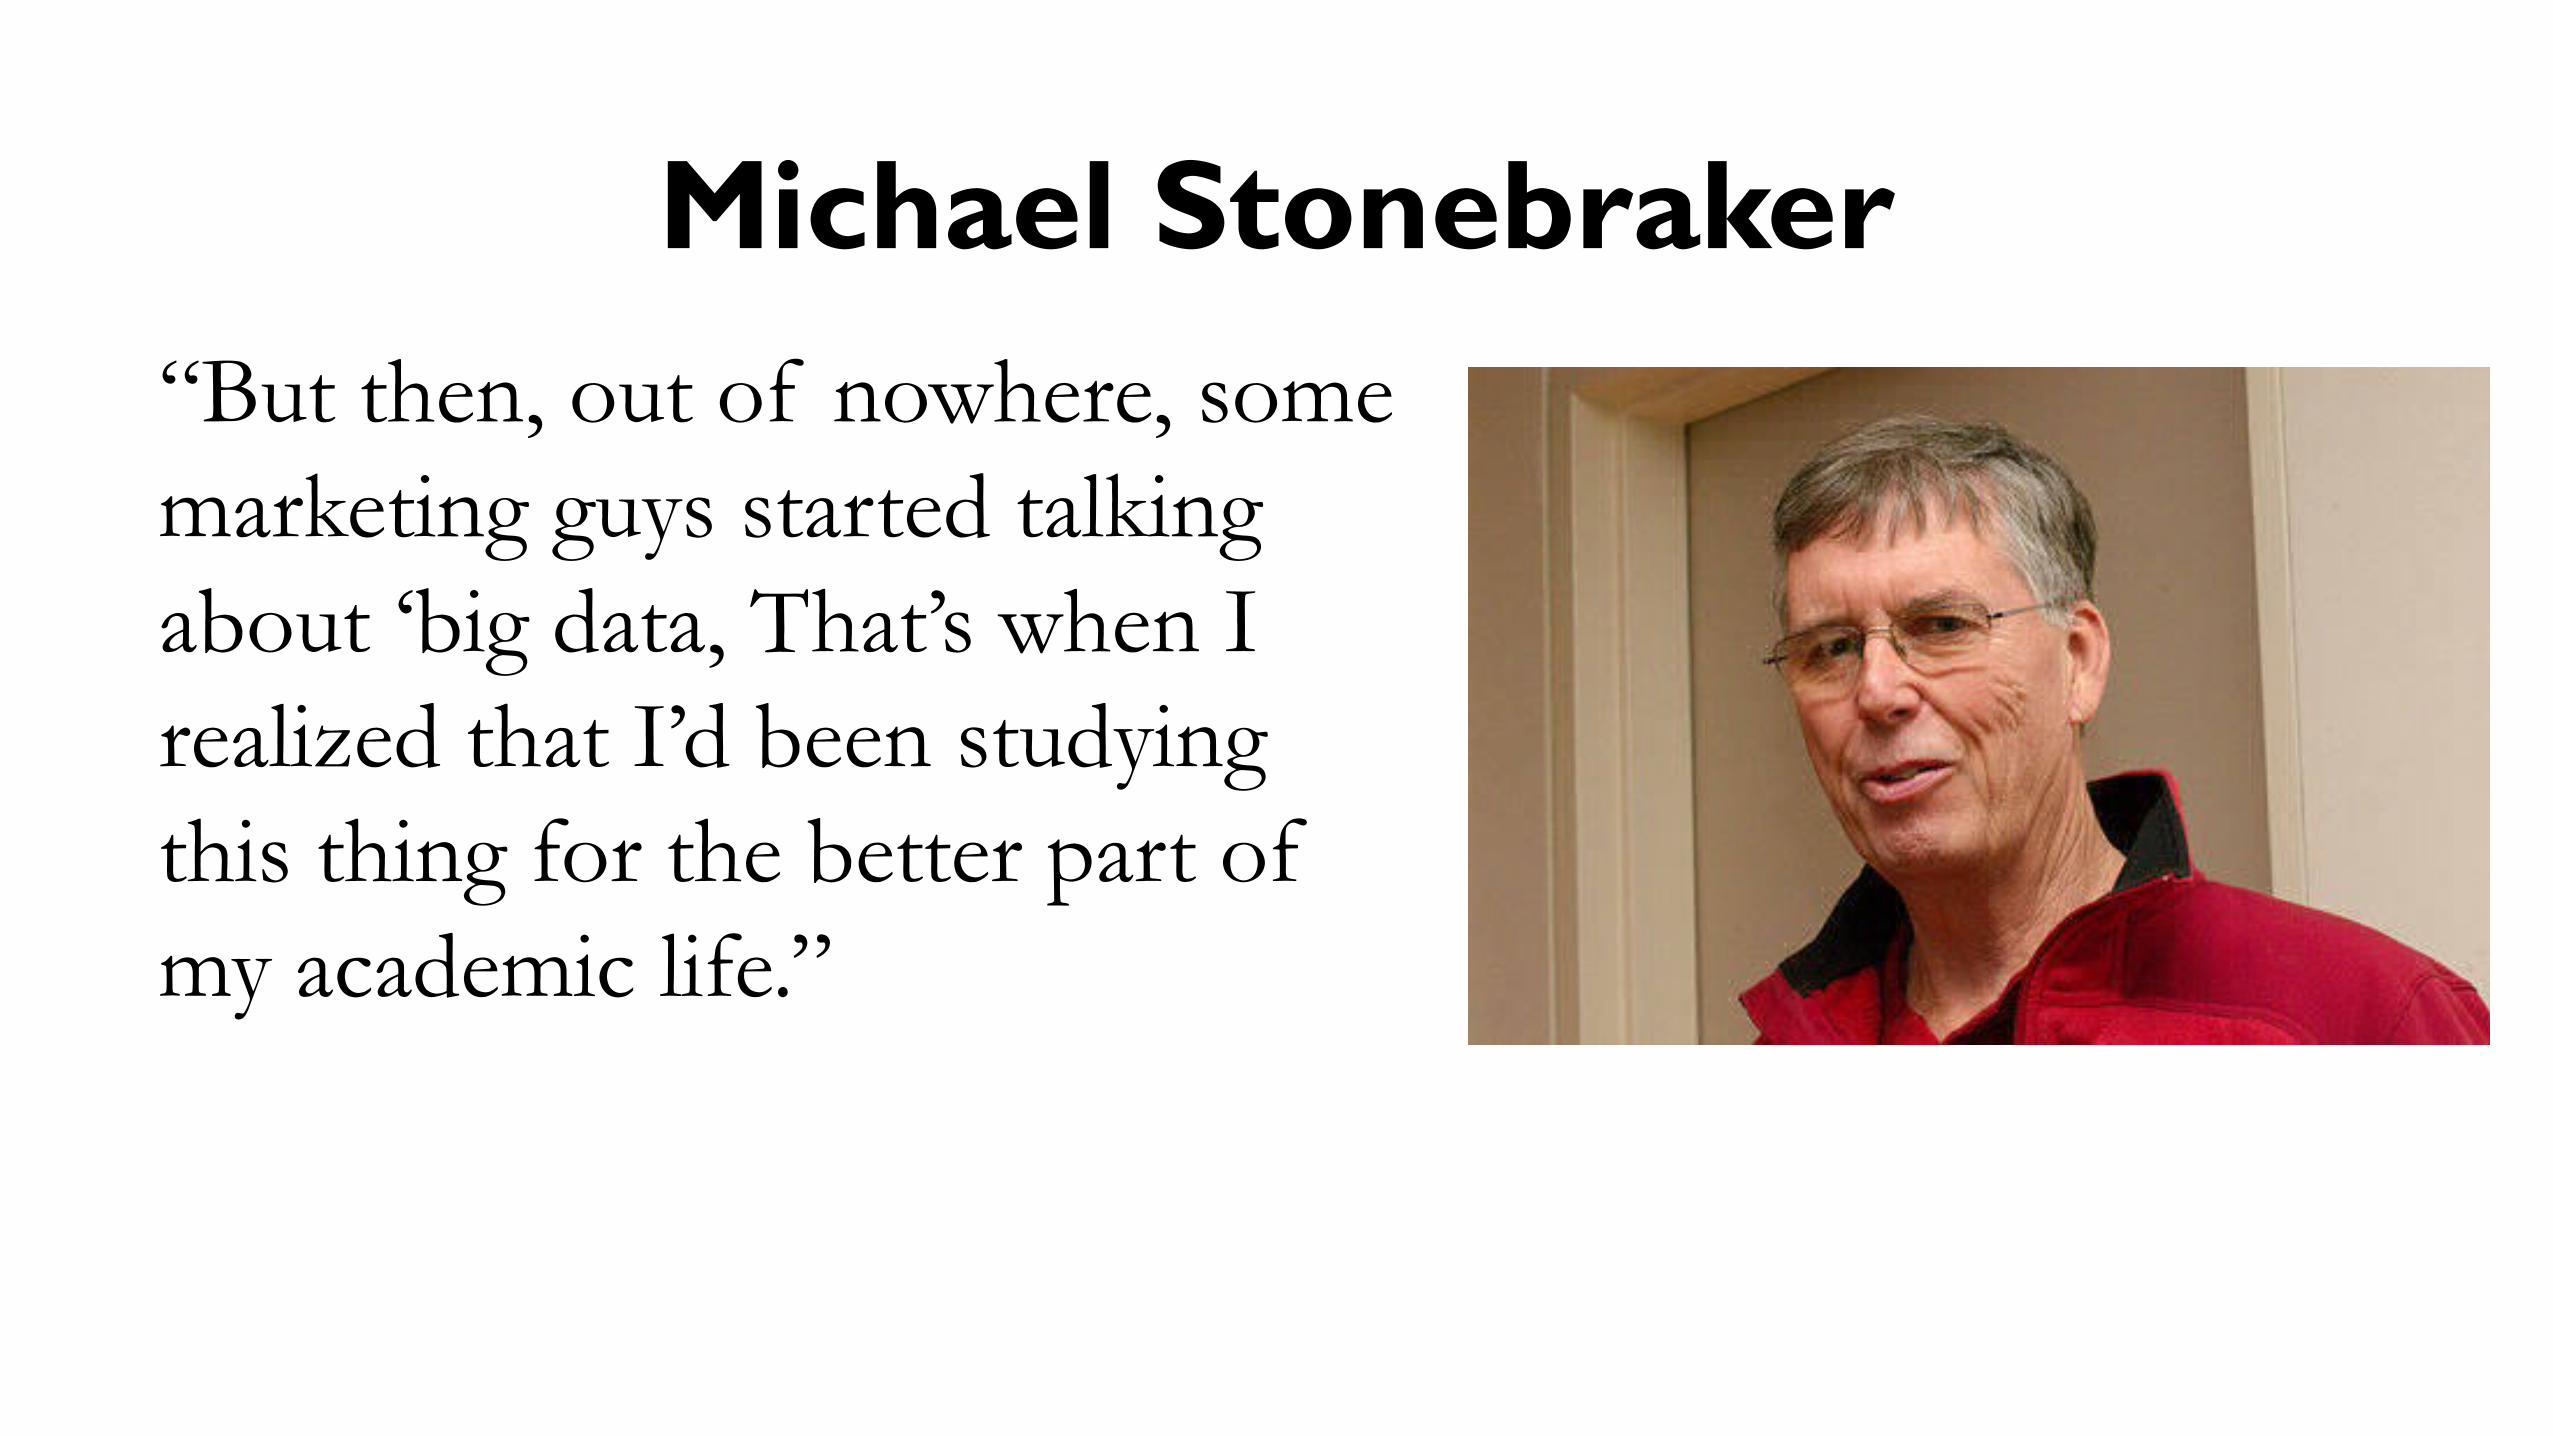
Michael Stonebraker“But then, out of nowhere, some marketing guys started talking about ‘big data, That’s when I realized that I’d been studying this thing for the better part of my academic life.”
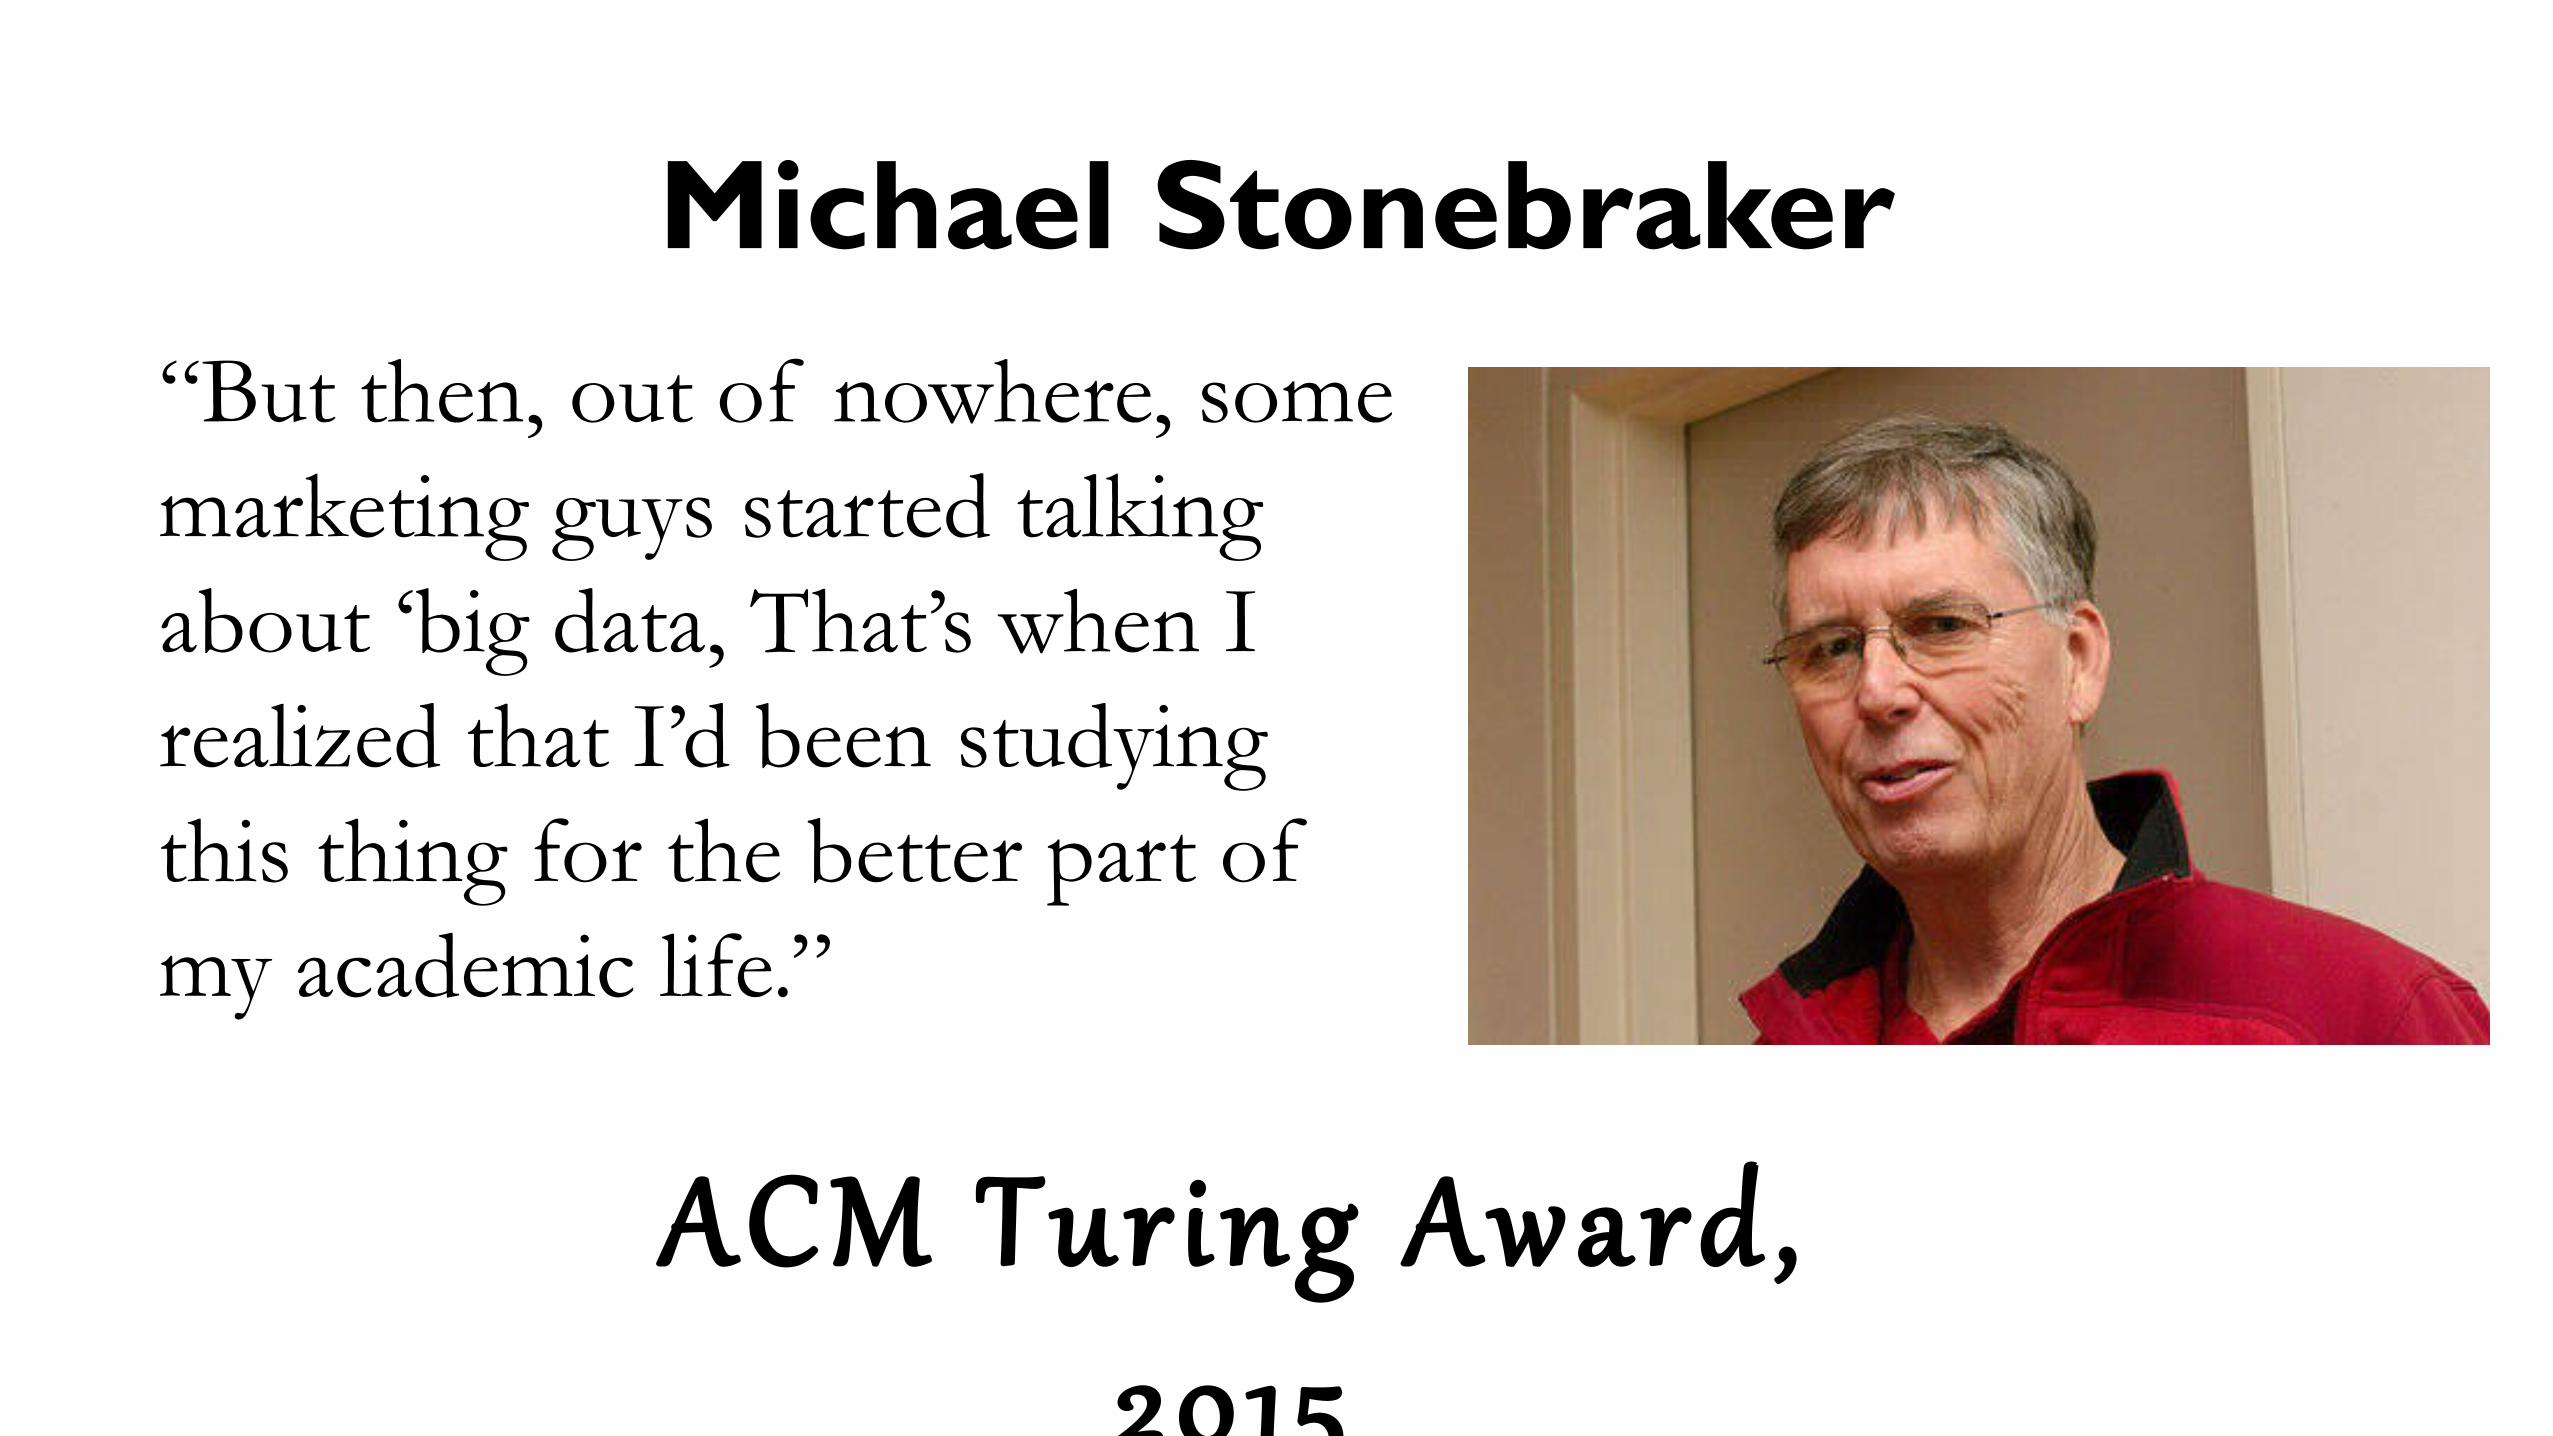
Michael Stonebraker“But then, out of nowhere, some marketing guys started talking about ‘big data, That’s when I realized that I’d been studying this thing for the better part of my academic life.”
ACM Tur ing Award , 2015
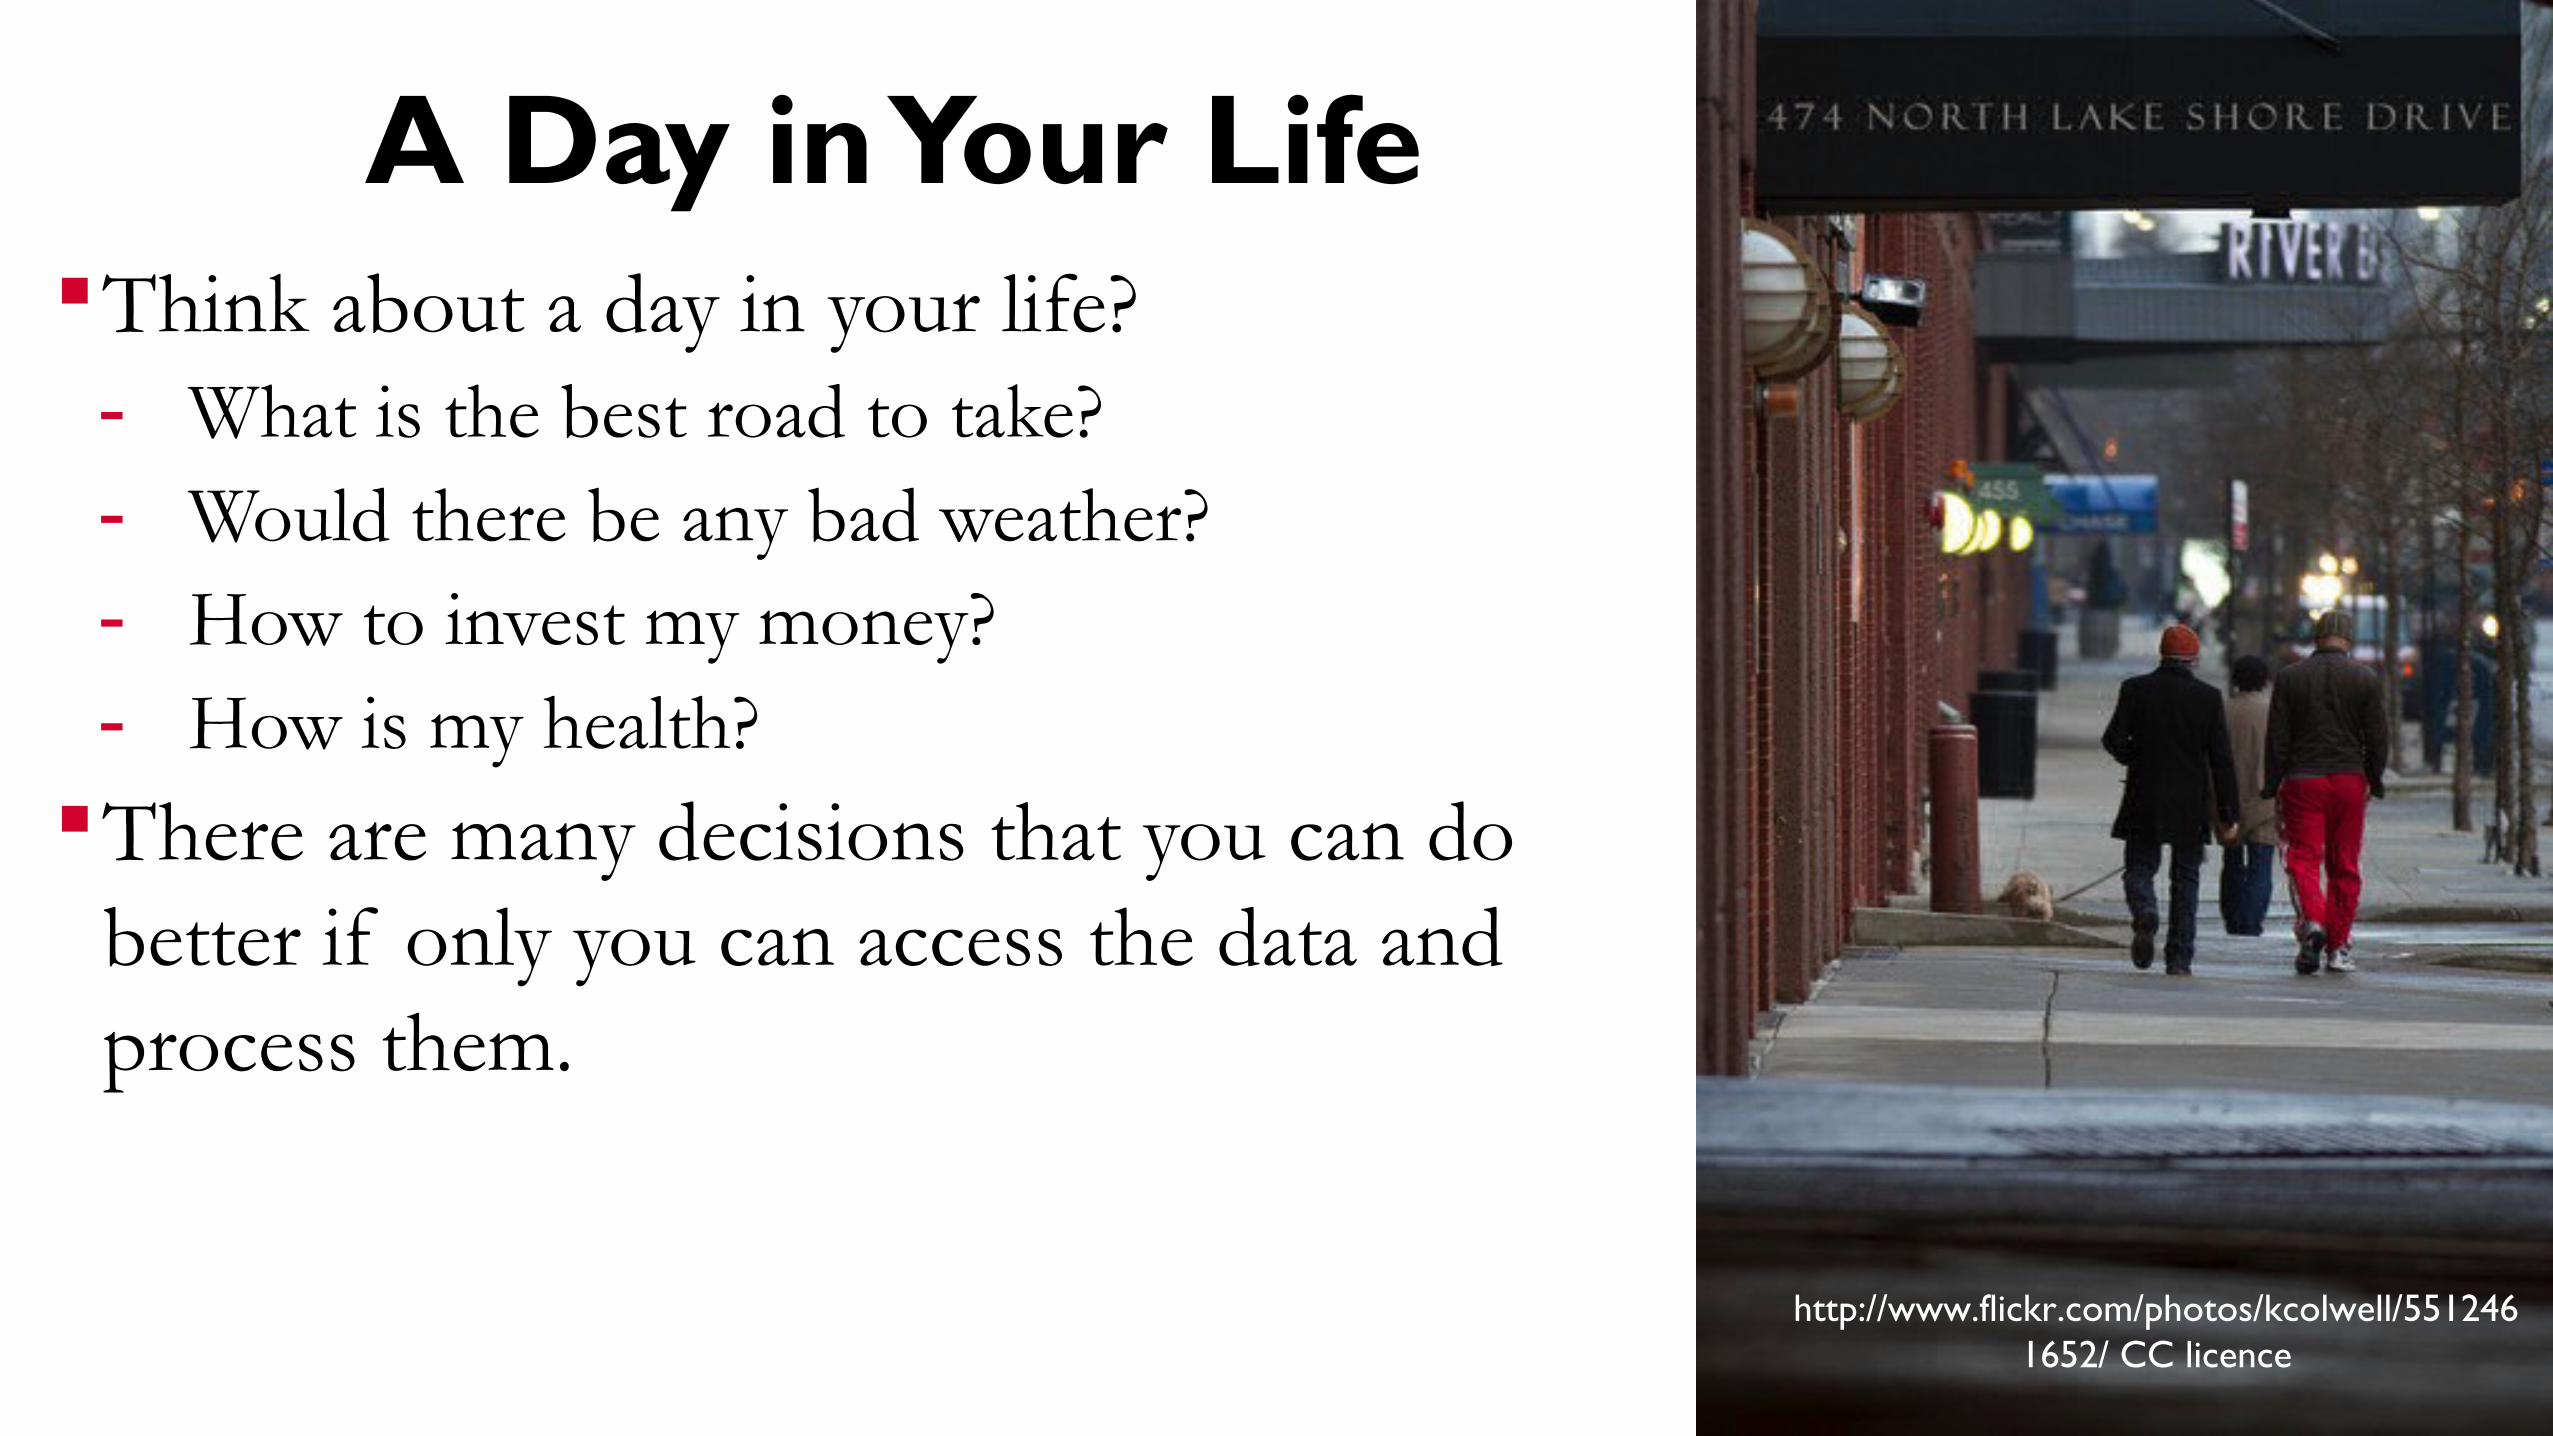
A Day in Your LifeThink about a day in your life?- What is the best road to take?- Would there be any bad weather?- How to invest my money?- How is my health?
There are many decisions that you can do better if only you can access the data and process them.
http://www.flickr.com/photos/kcolwell/5512461652/ CC licence
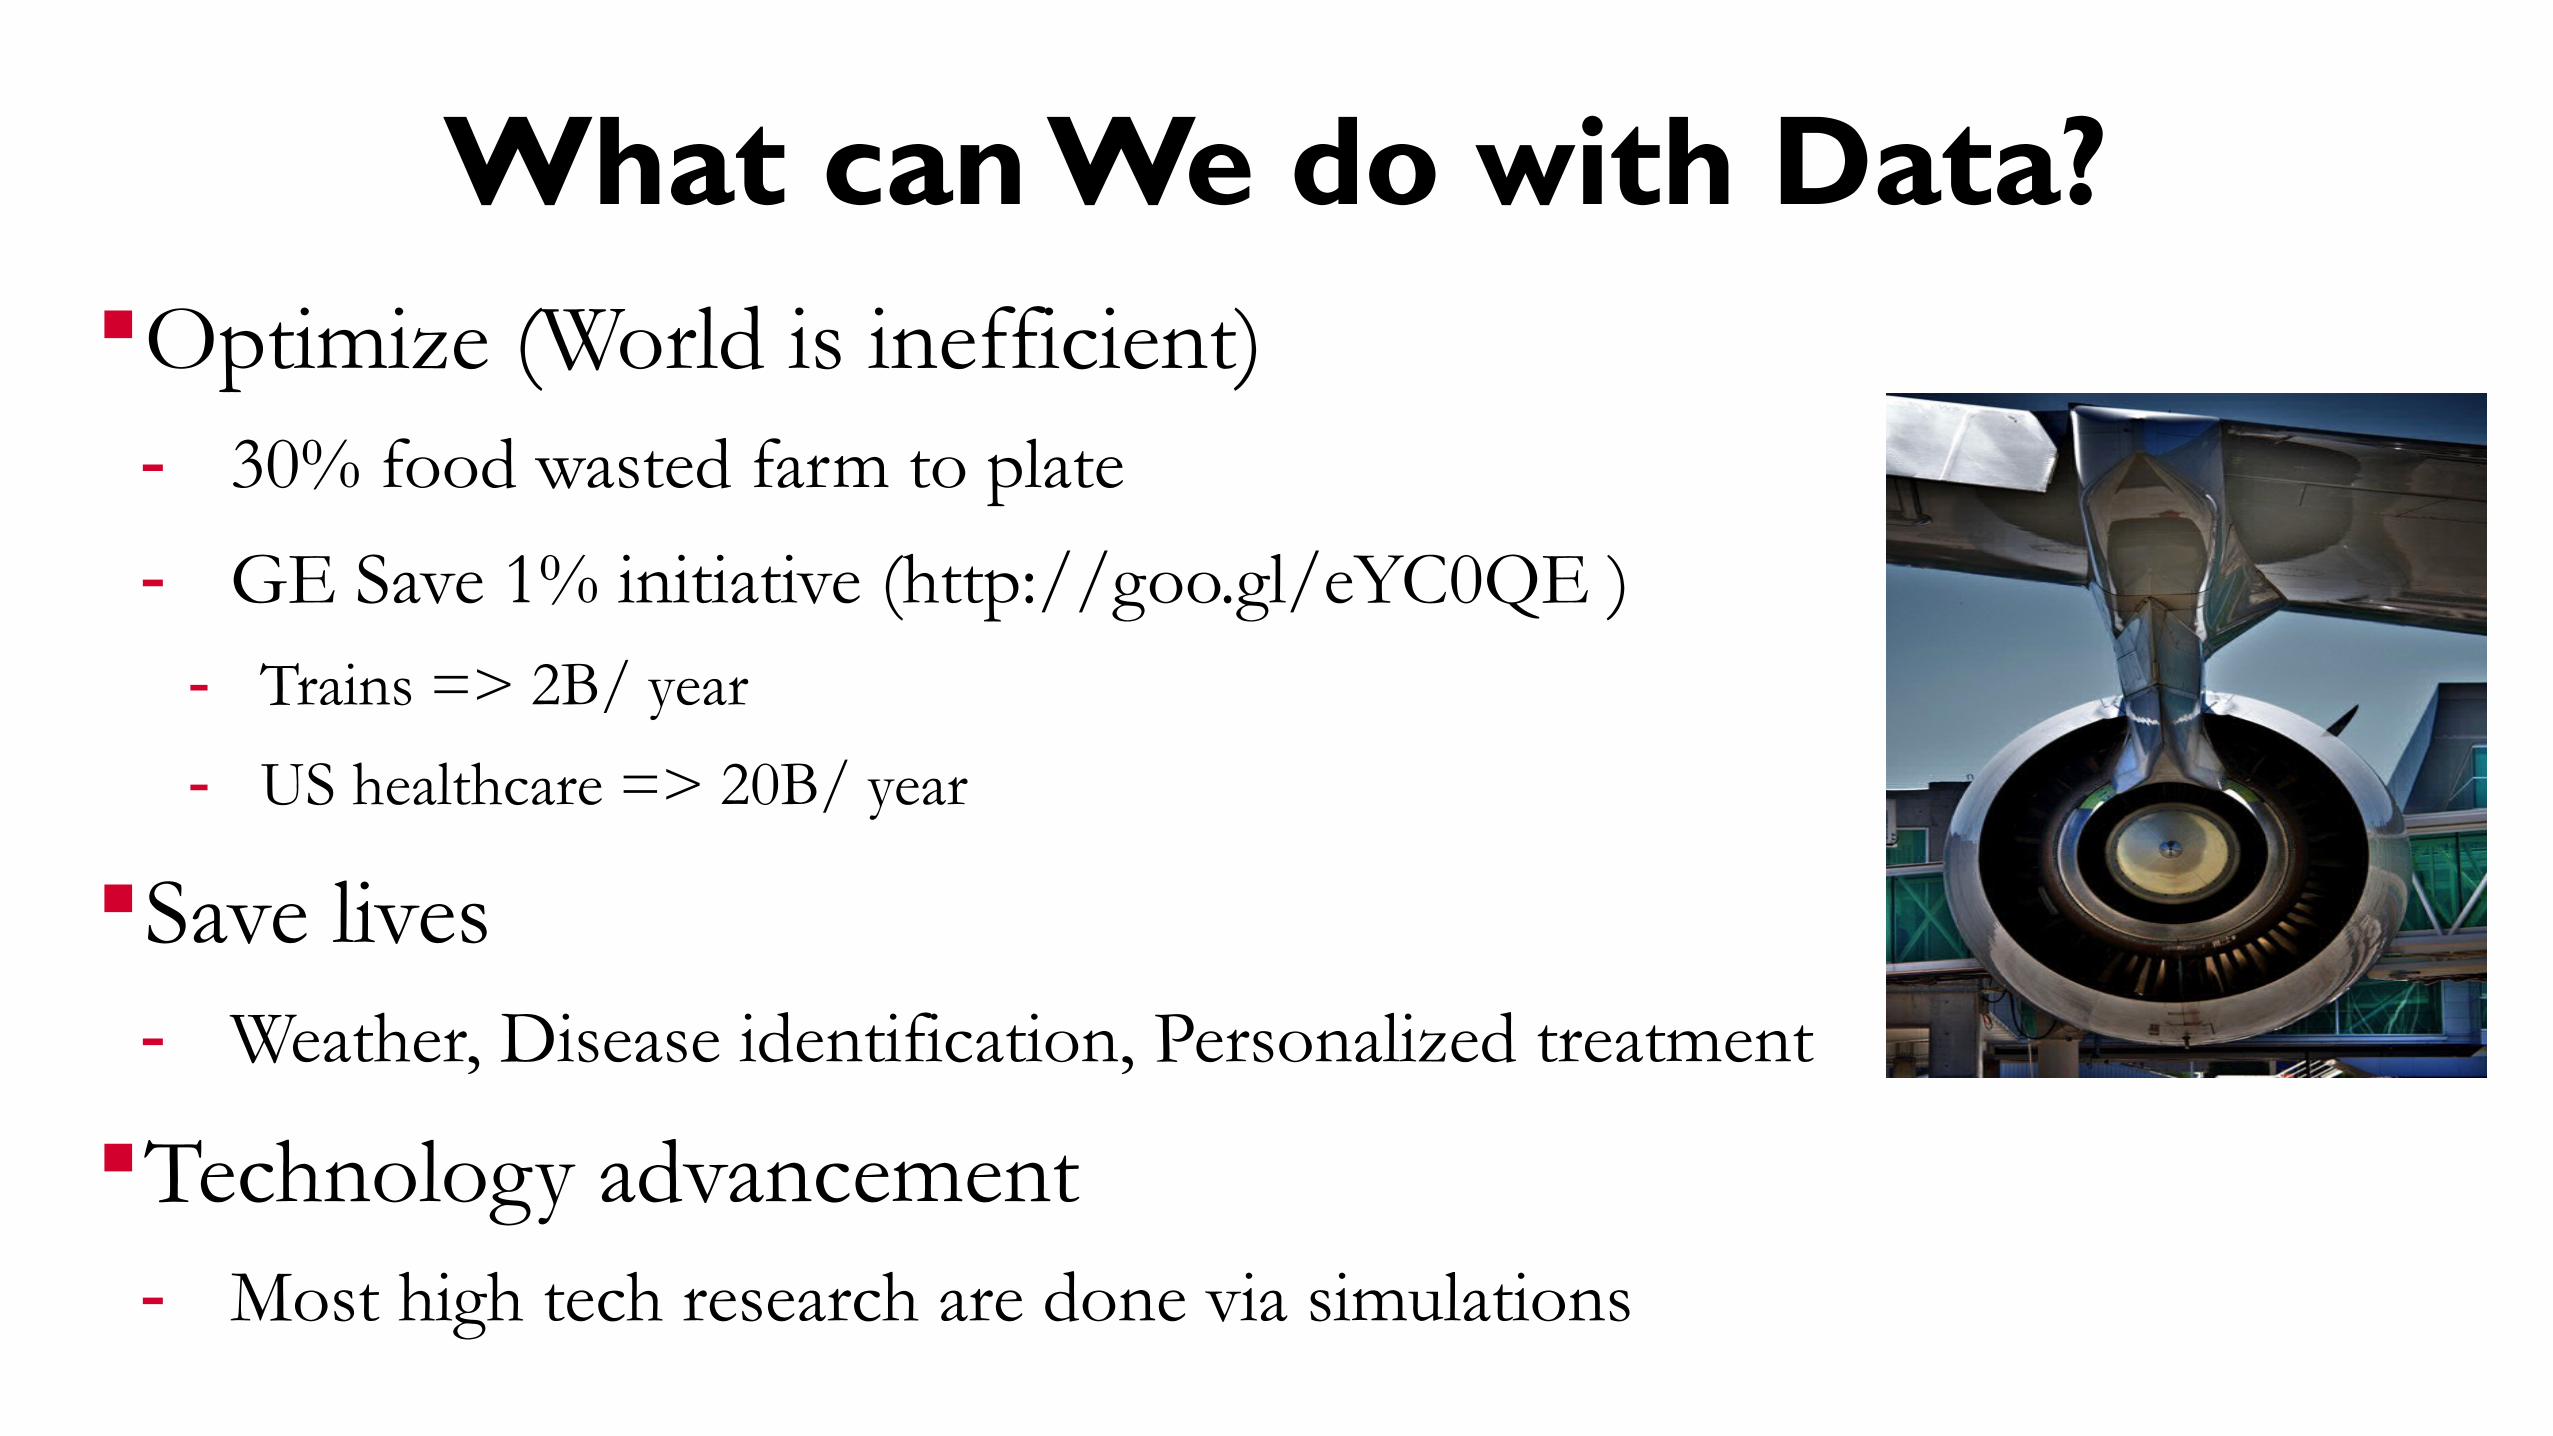
What can We do with Data?Optimize (World is inefficient)- 30% food wasted farm to plate
- GE Save 1% initiative (http://goo.gl/eYC0QE )- Trains => 2B/ year
- US healthcare => 20B/ year
Save lives - Weather, Disease identification, Personalized treatment
Technology advancement- Most high tech research are done via simulations
Building Data Processing Systems
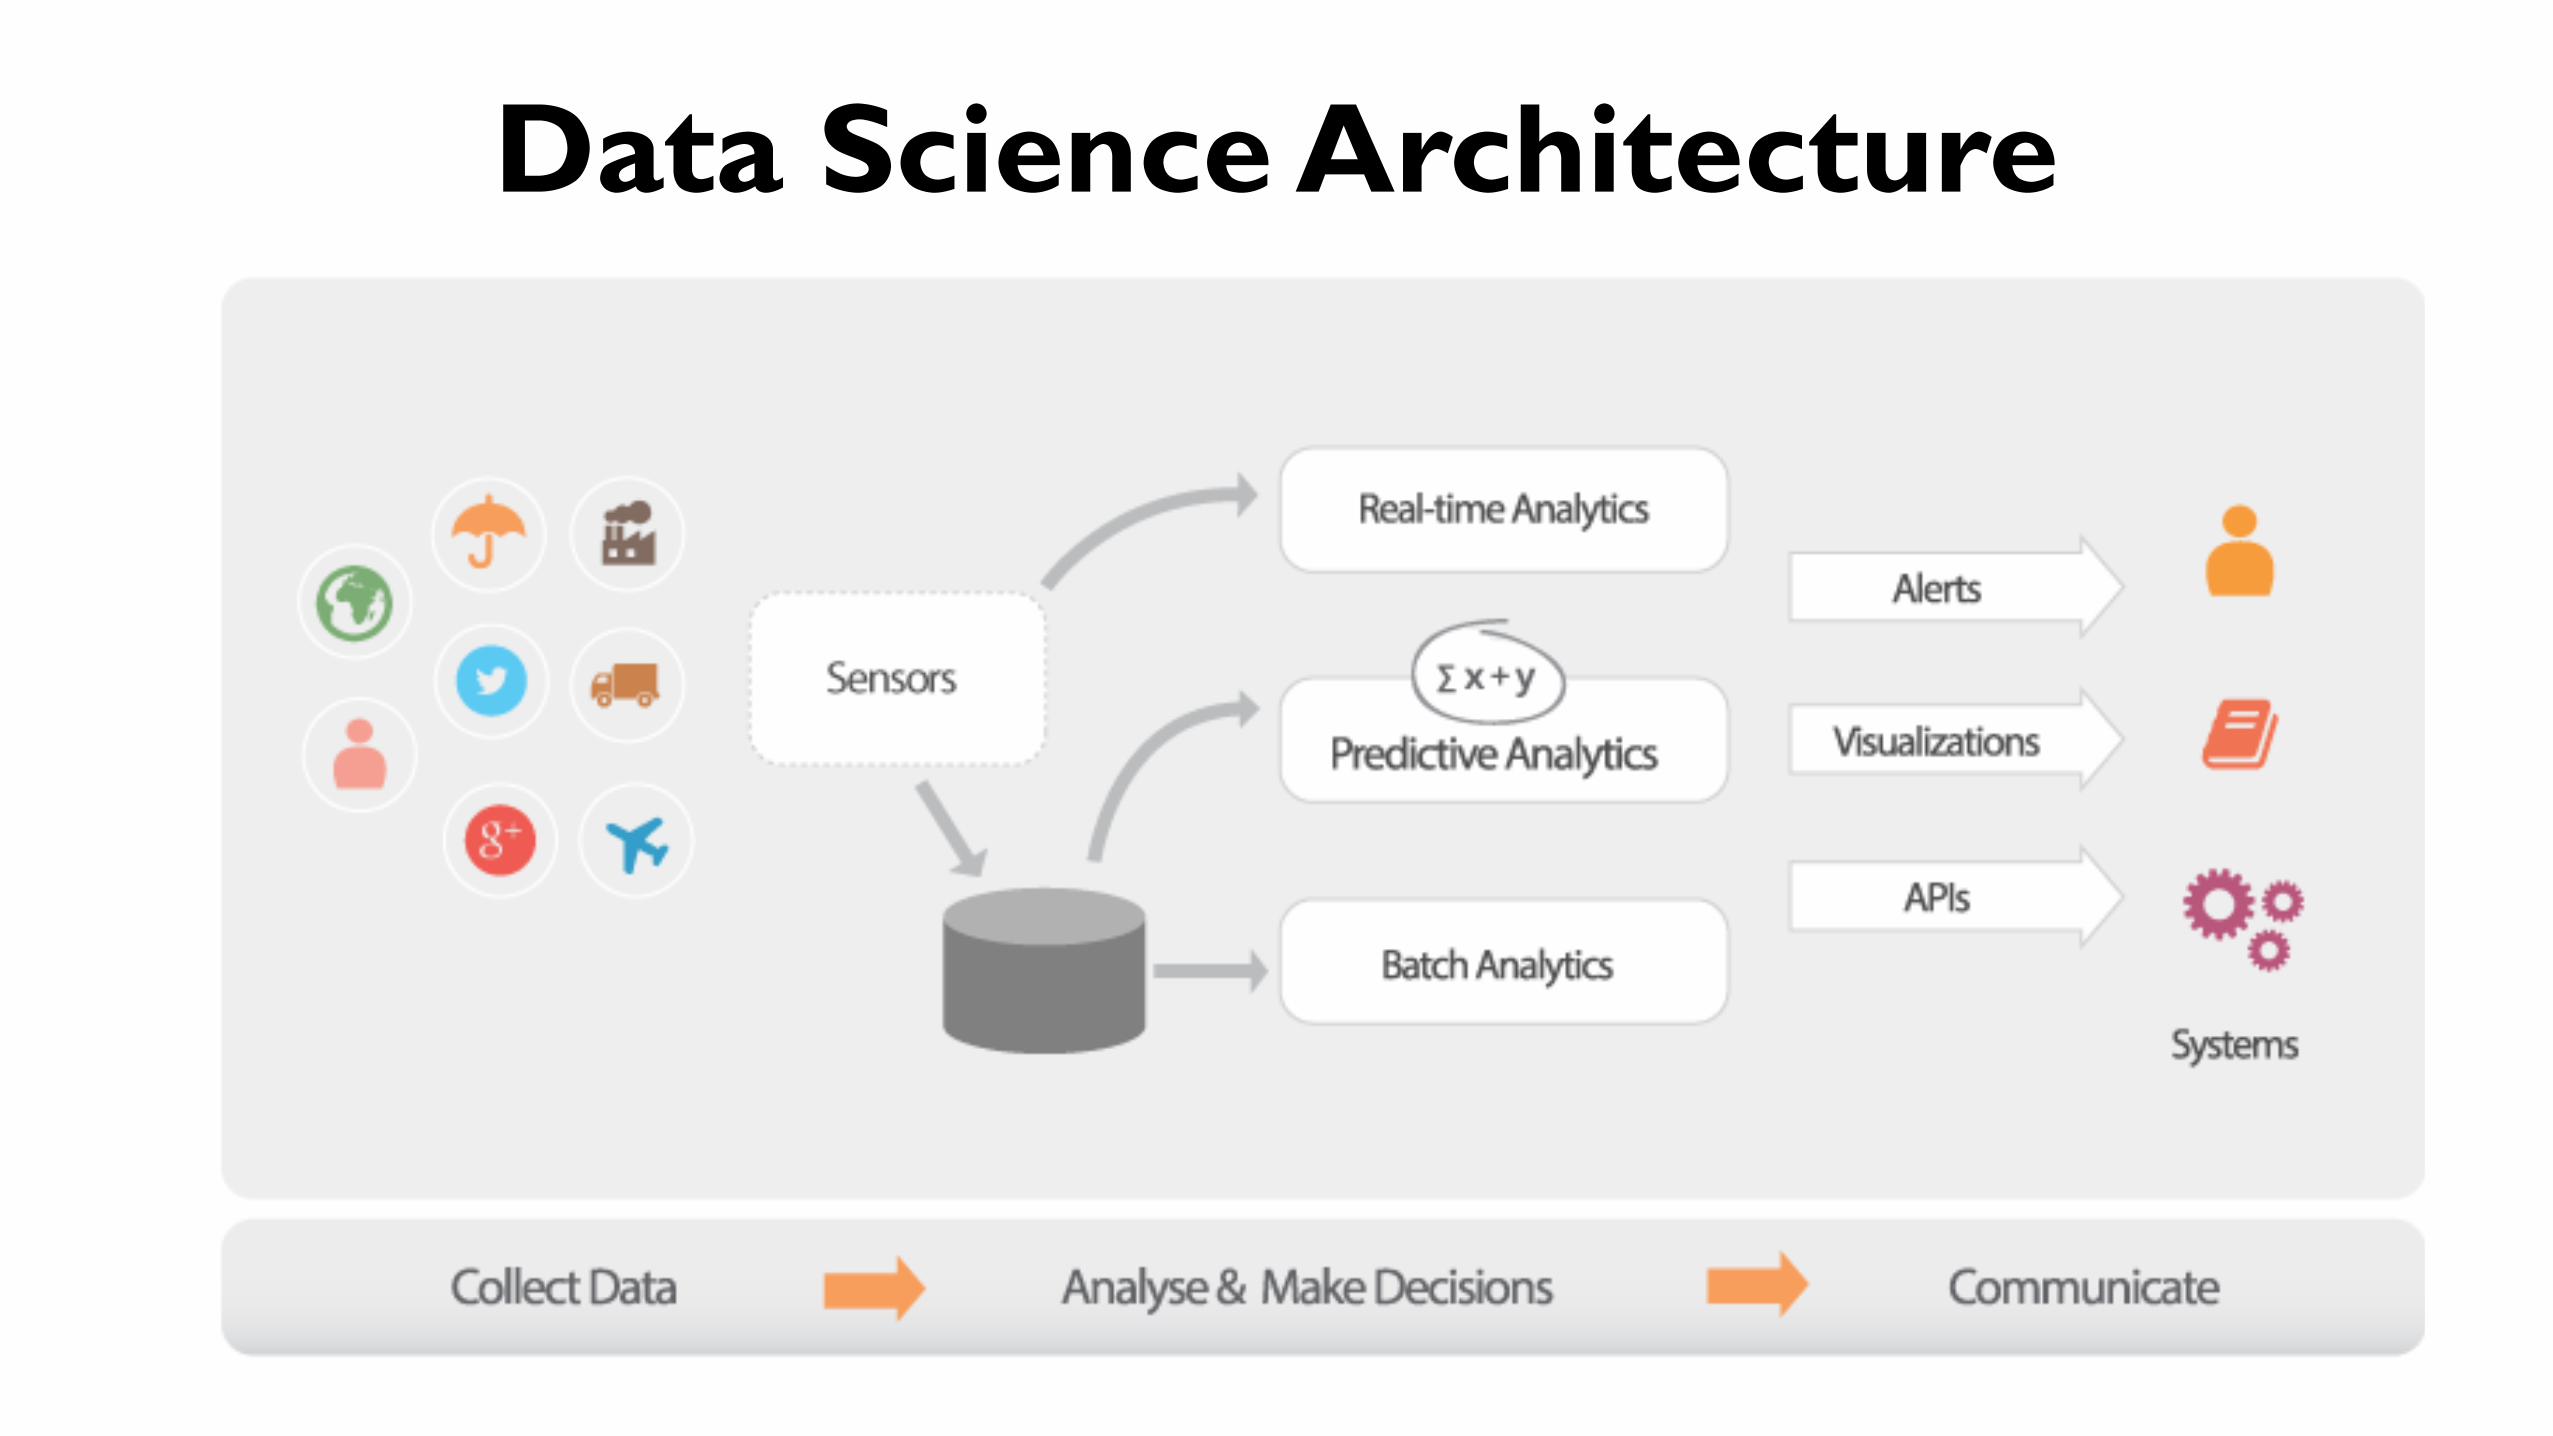
Data Science Architecture
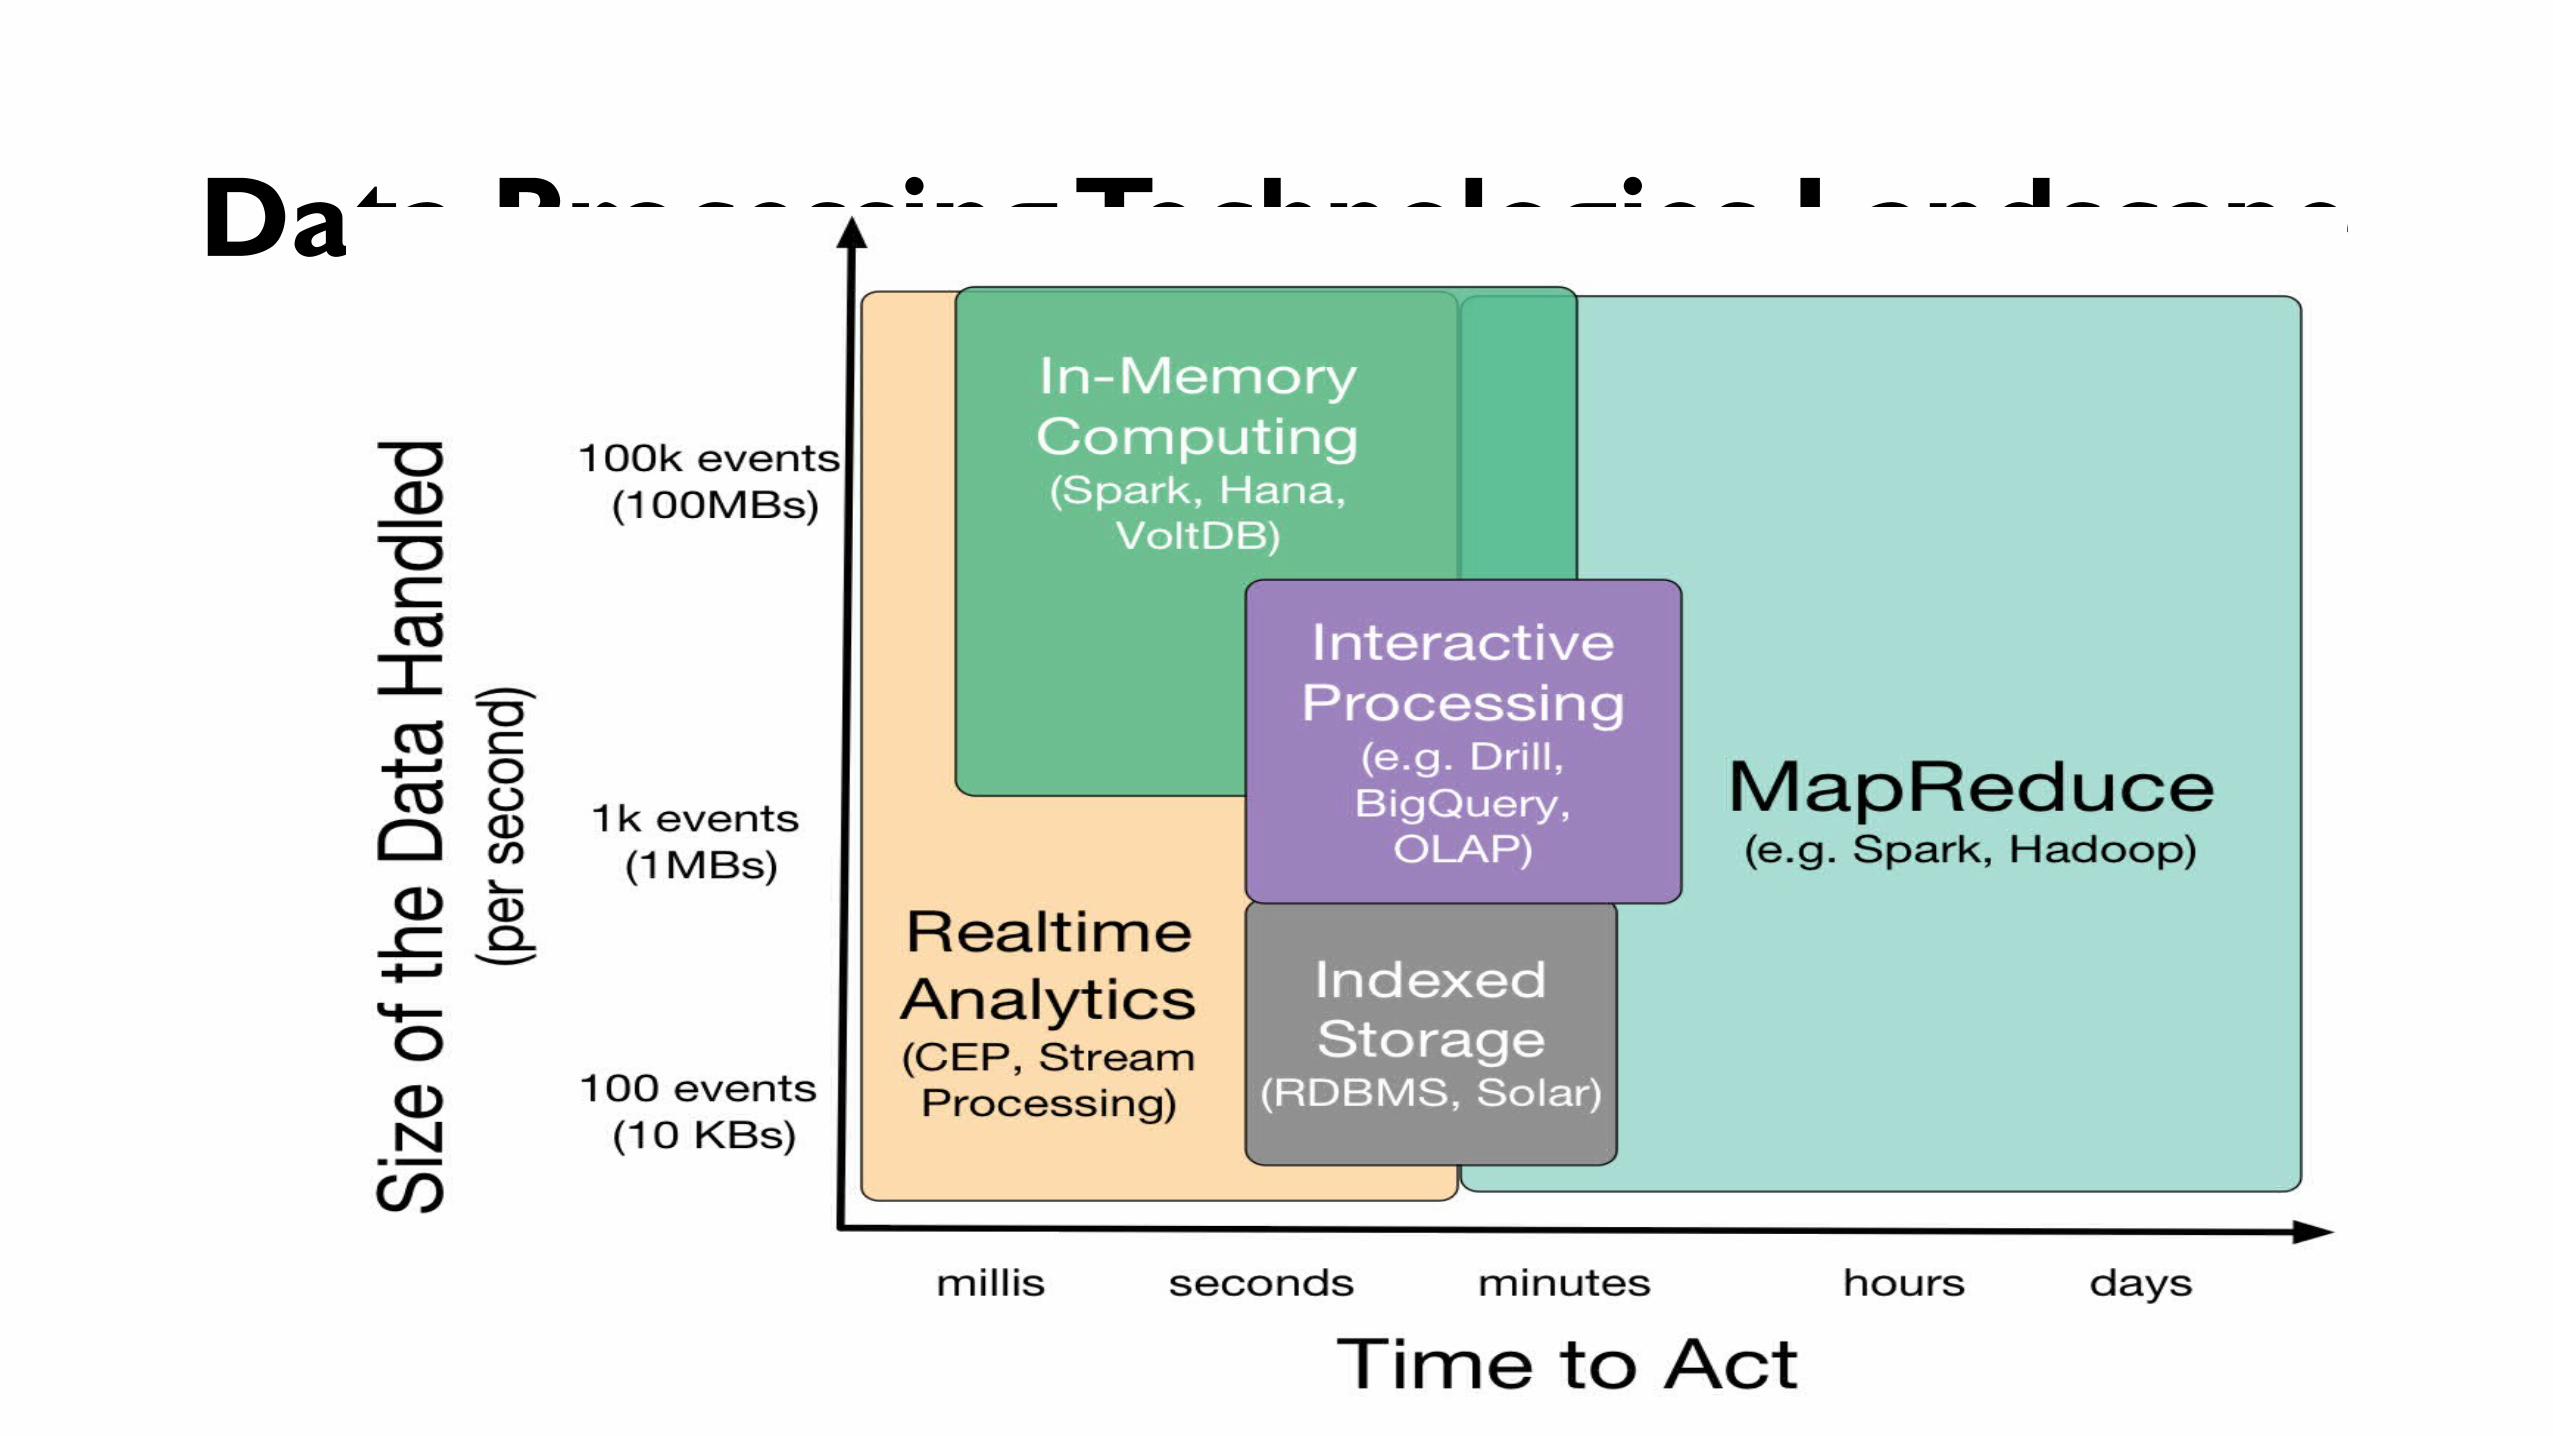
Data Processing Technologies Landscape
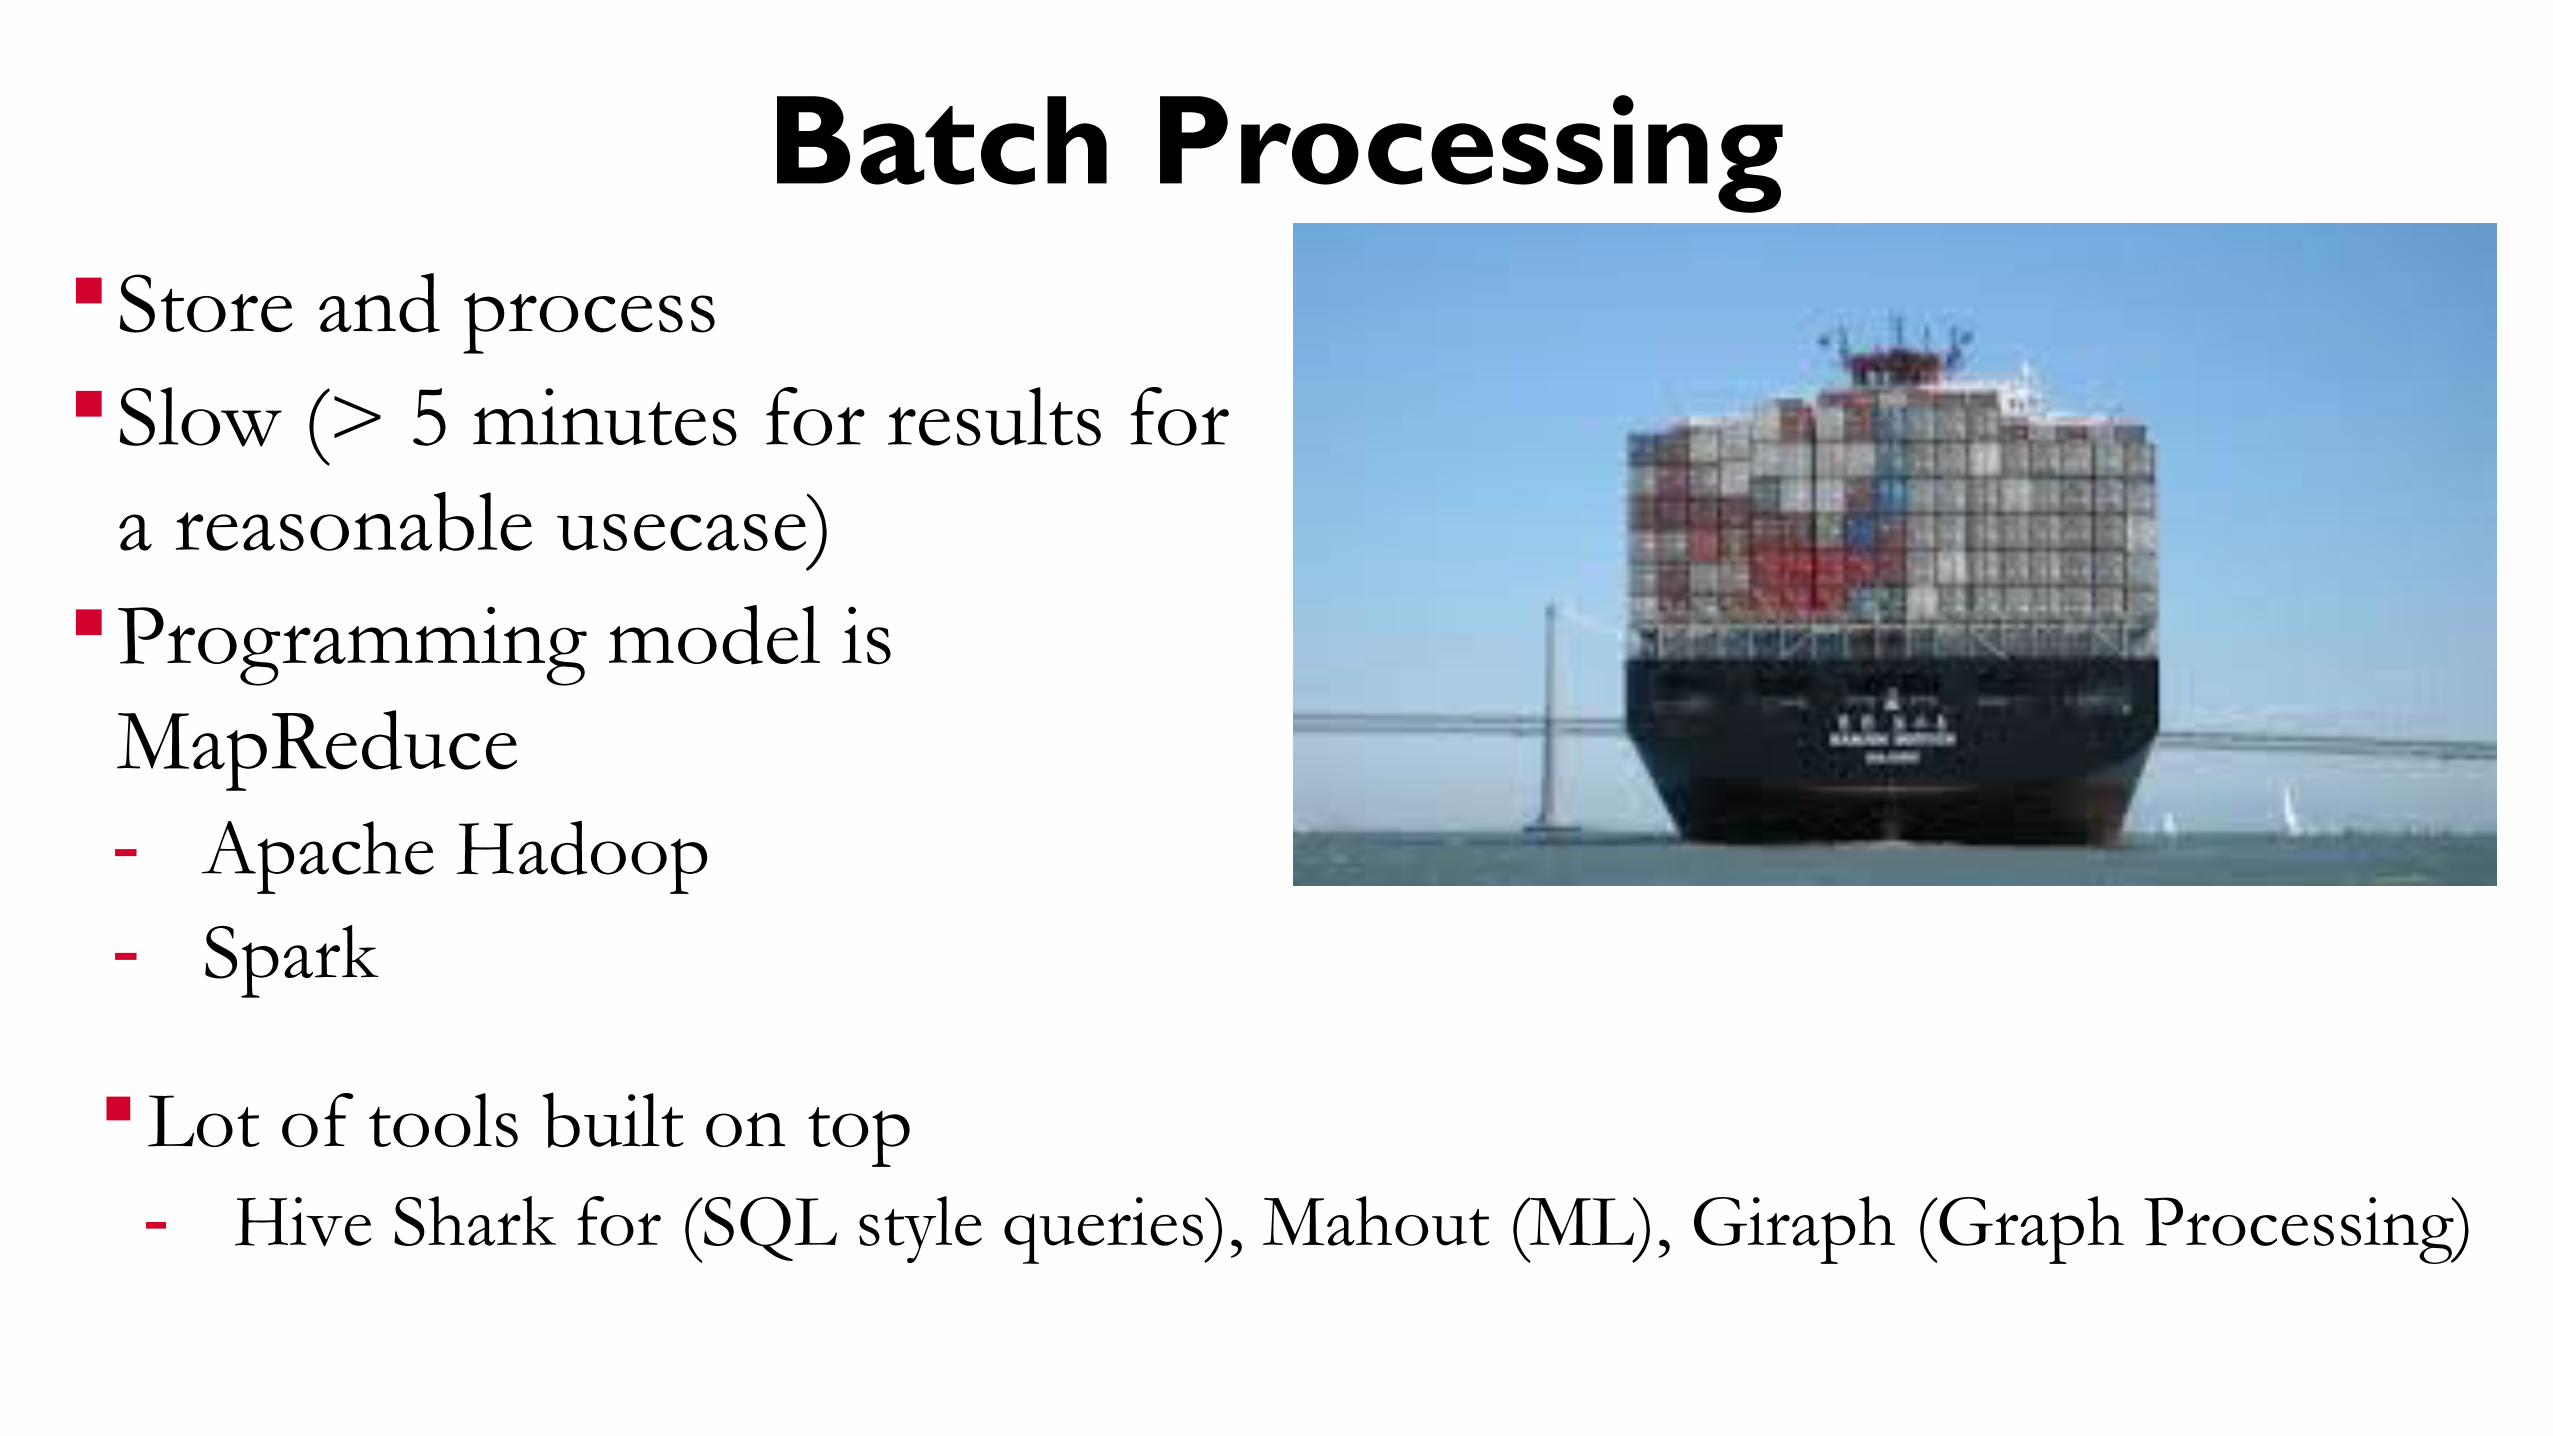
Batch ProcessingStore and process Slow (> 5 minutes for results for
a reasonable usecase)Programming model is
MapReduce - Apache Hadoop- Spark
Lot of tools built on top - Hive Shark for (SQL style queries), Mahout (ML), Giraph (Graph Processing)
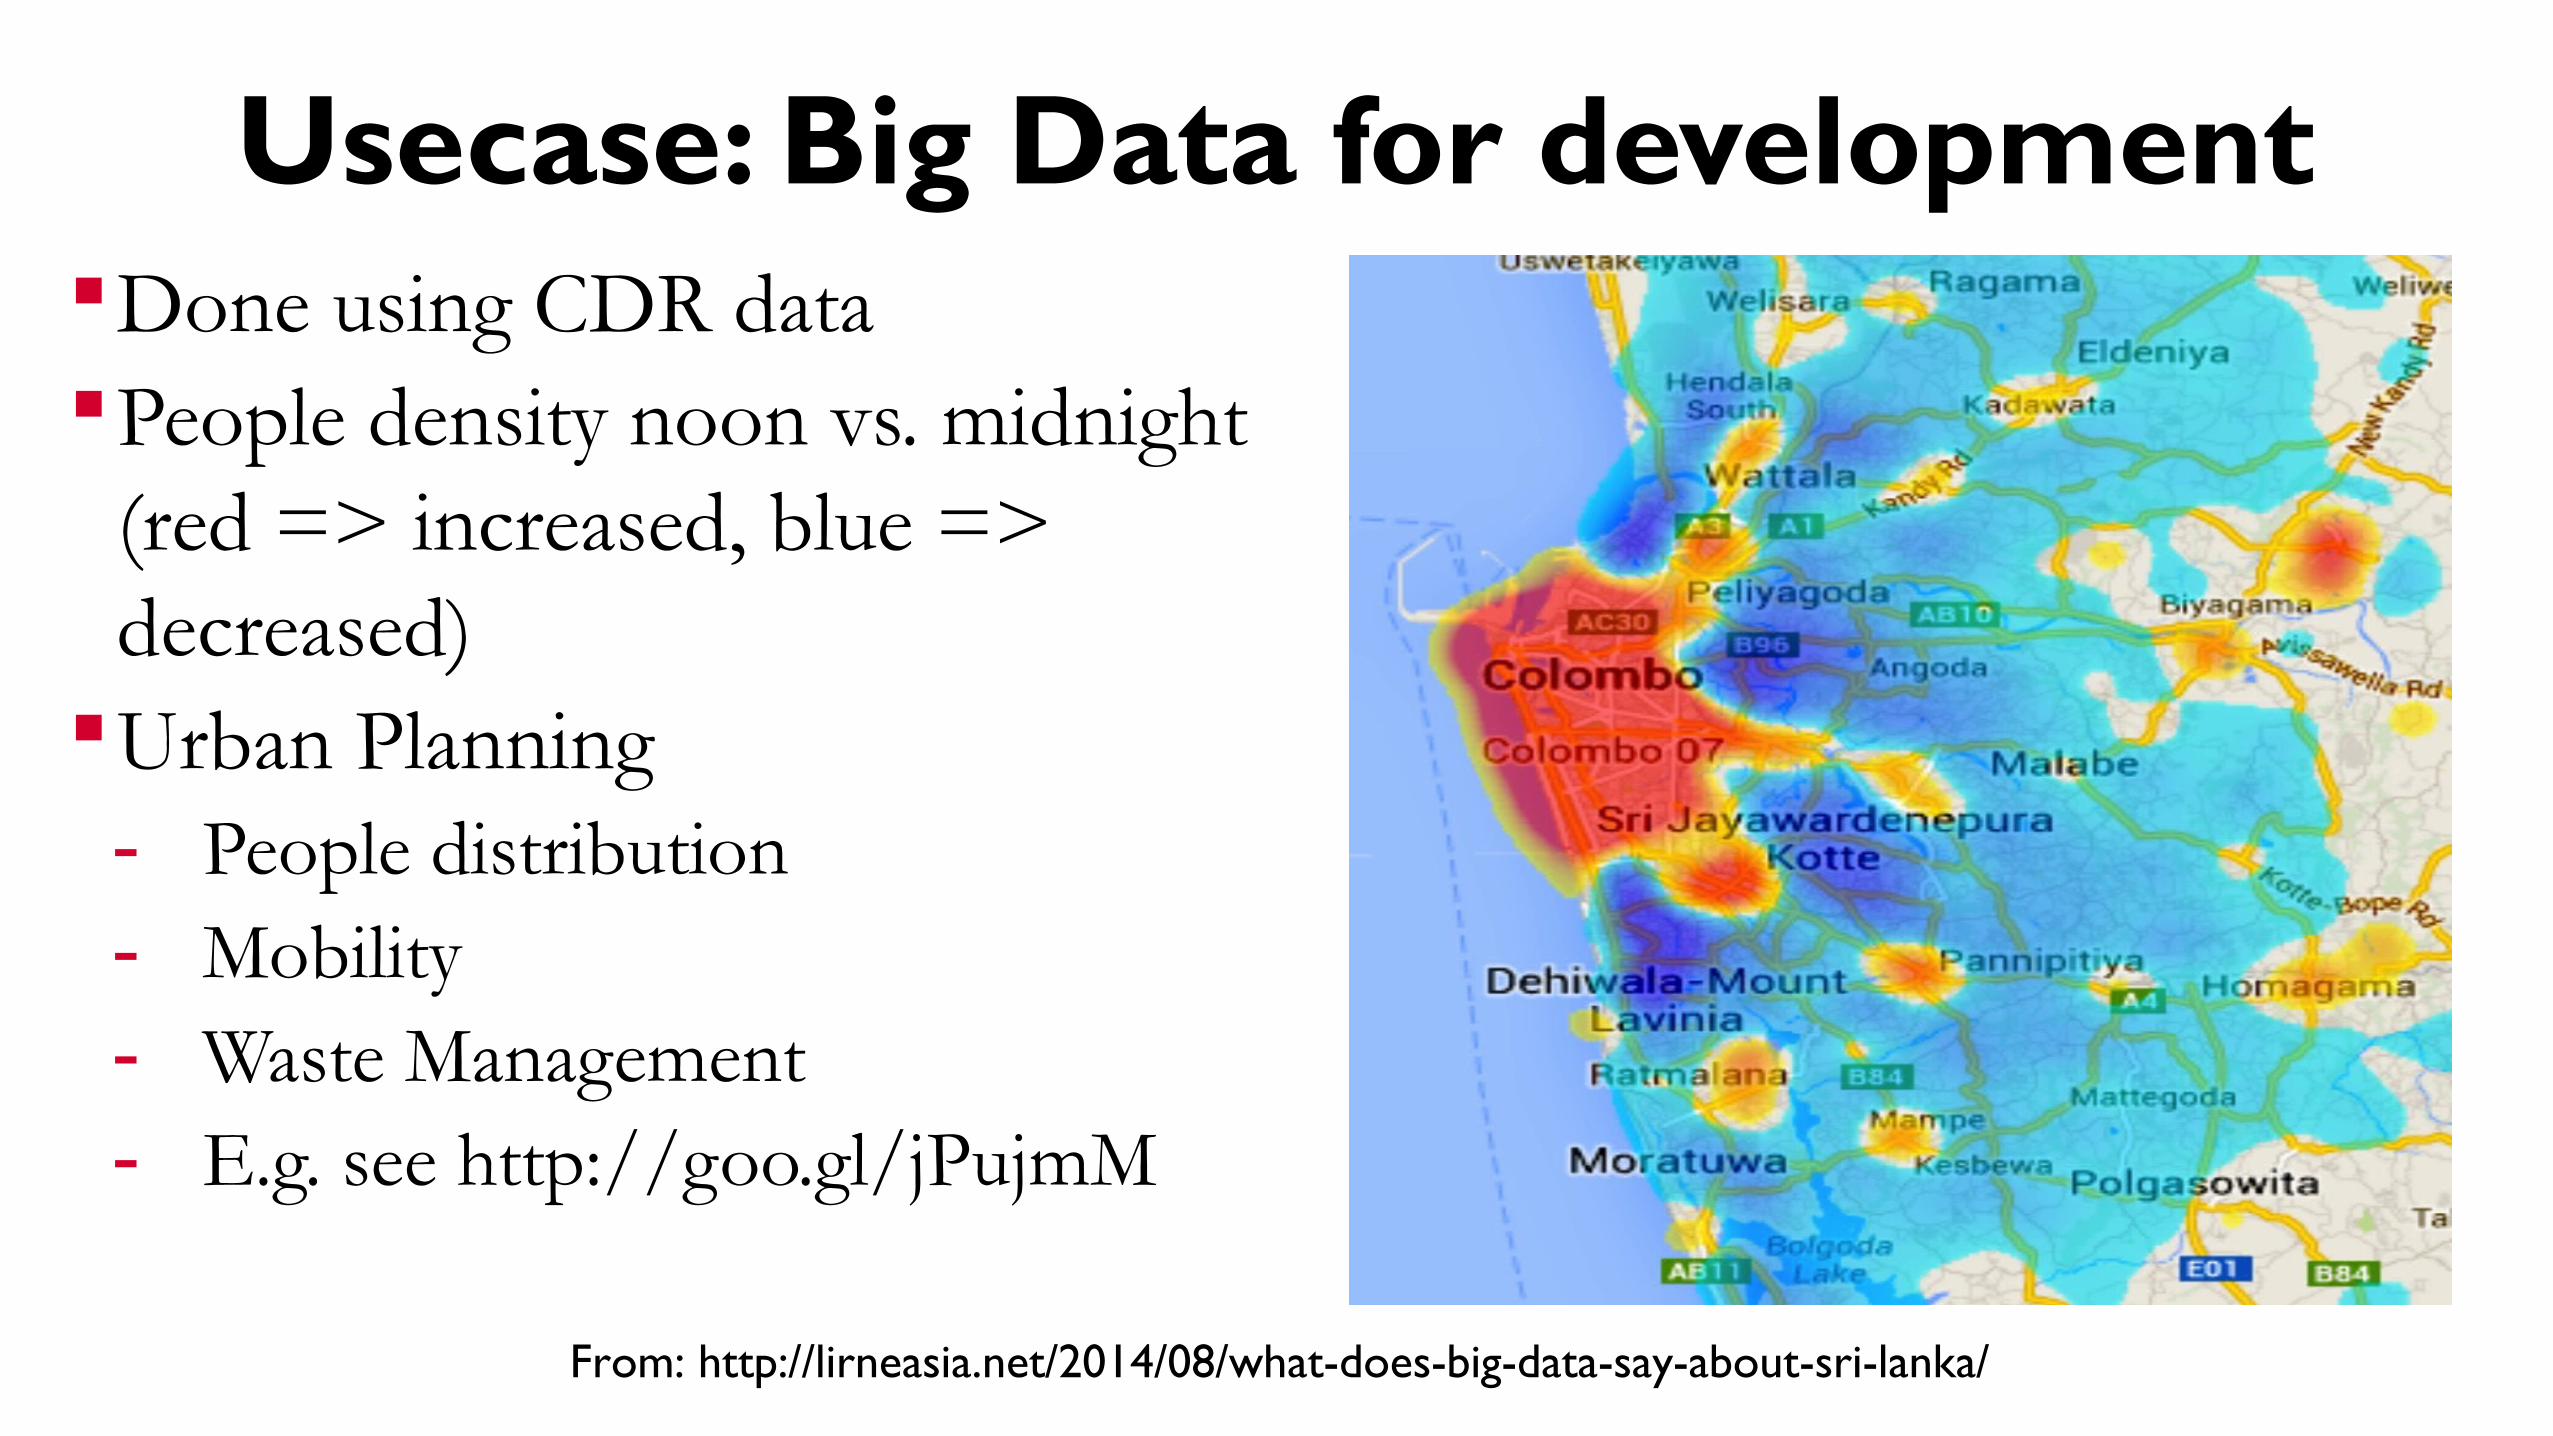
Usecase: Big Data for developmentDone using CDR dataPeople density noon vs. midnight
(red => increased, blue => decreased)
Urban Planning - People distribution - Mobility - Waste Management- E.g. see http://goo.gl/jPujmM
From: http://lirneasia.net/2014/08/what-does-big-data-say-about-sri-lanka/
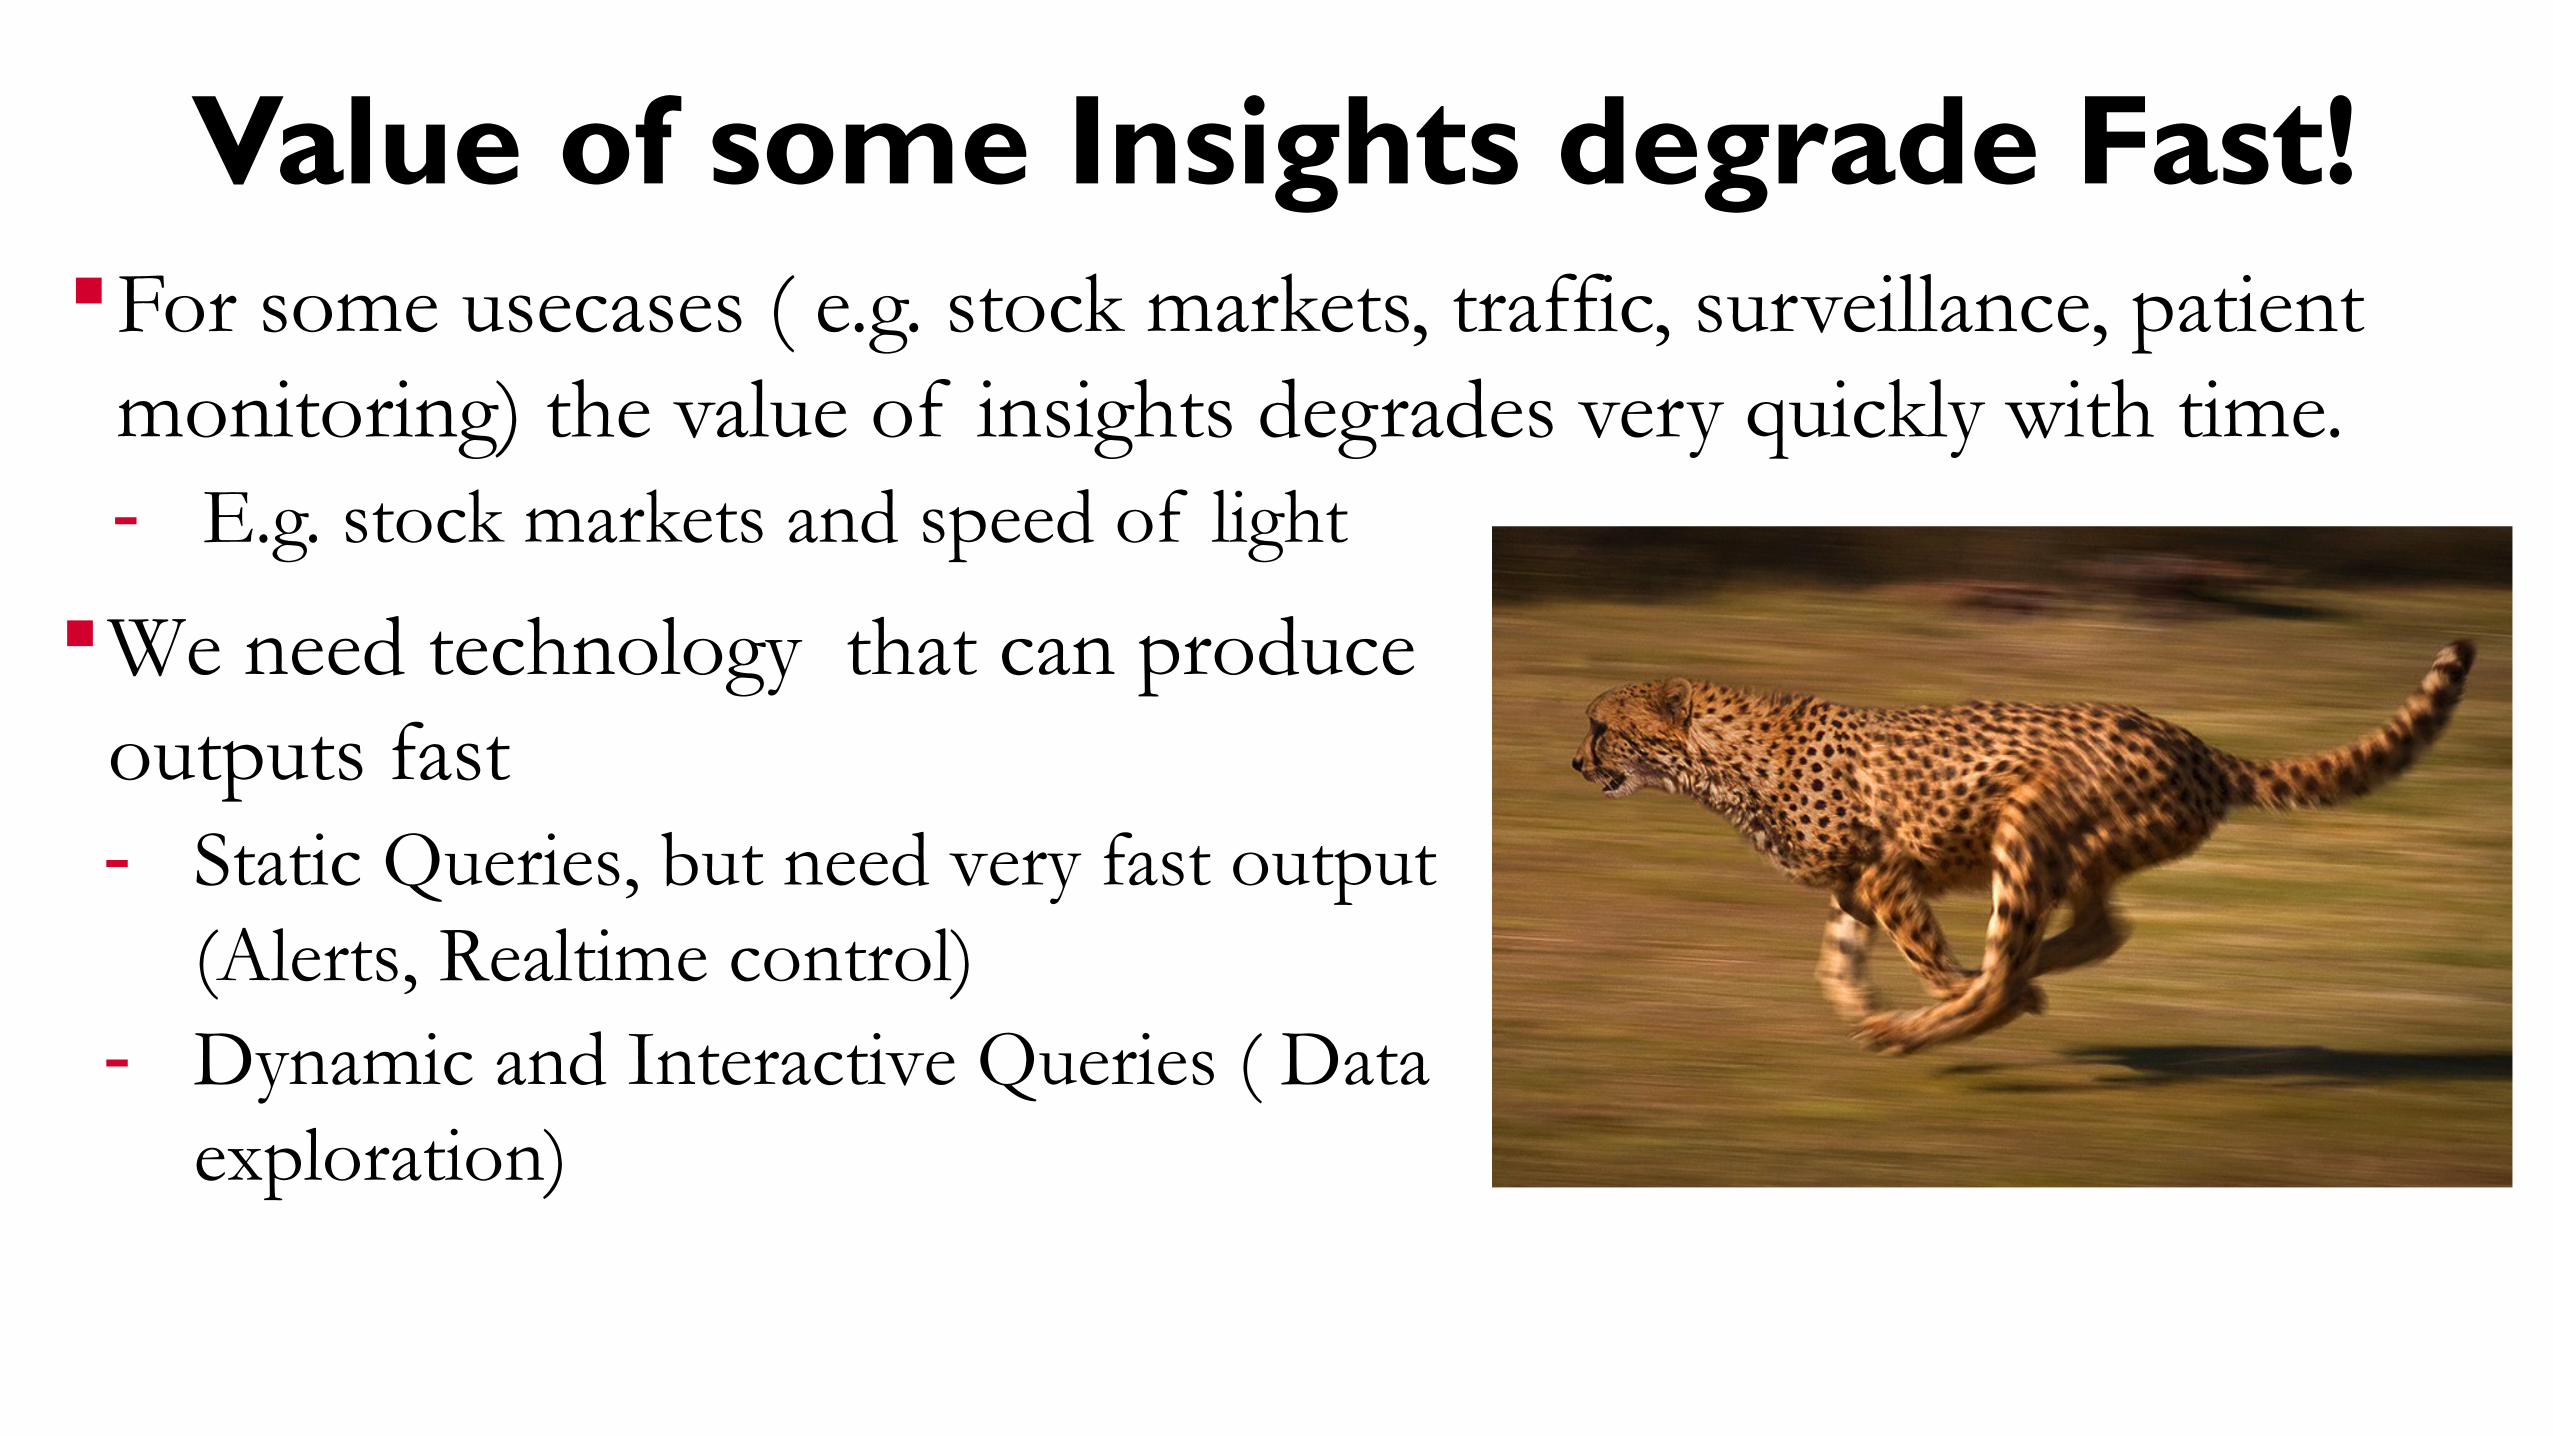
Value of some Insights degrade Fast!For some usecases ( e.g. stock markets, traffic, surveillance, patient
monitoring) the value of insights degrades very quickly with time. - E.g. stock markets and speed of light
We need technology that can produce outputs fast - Static Queries, but need very fast output
(Alerts, Realtime control) - Dynamic and Interactive Queries ( Data
exploration)
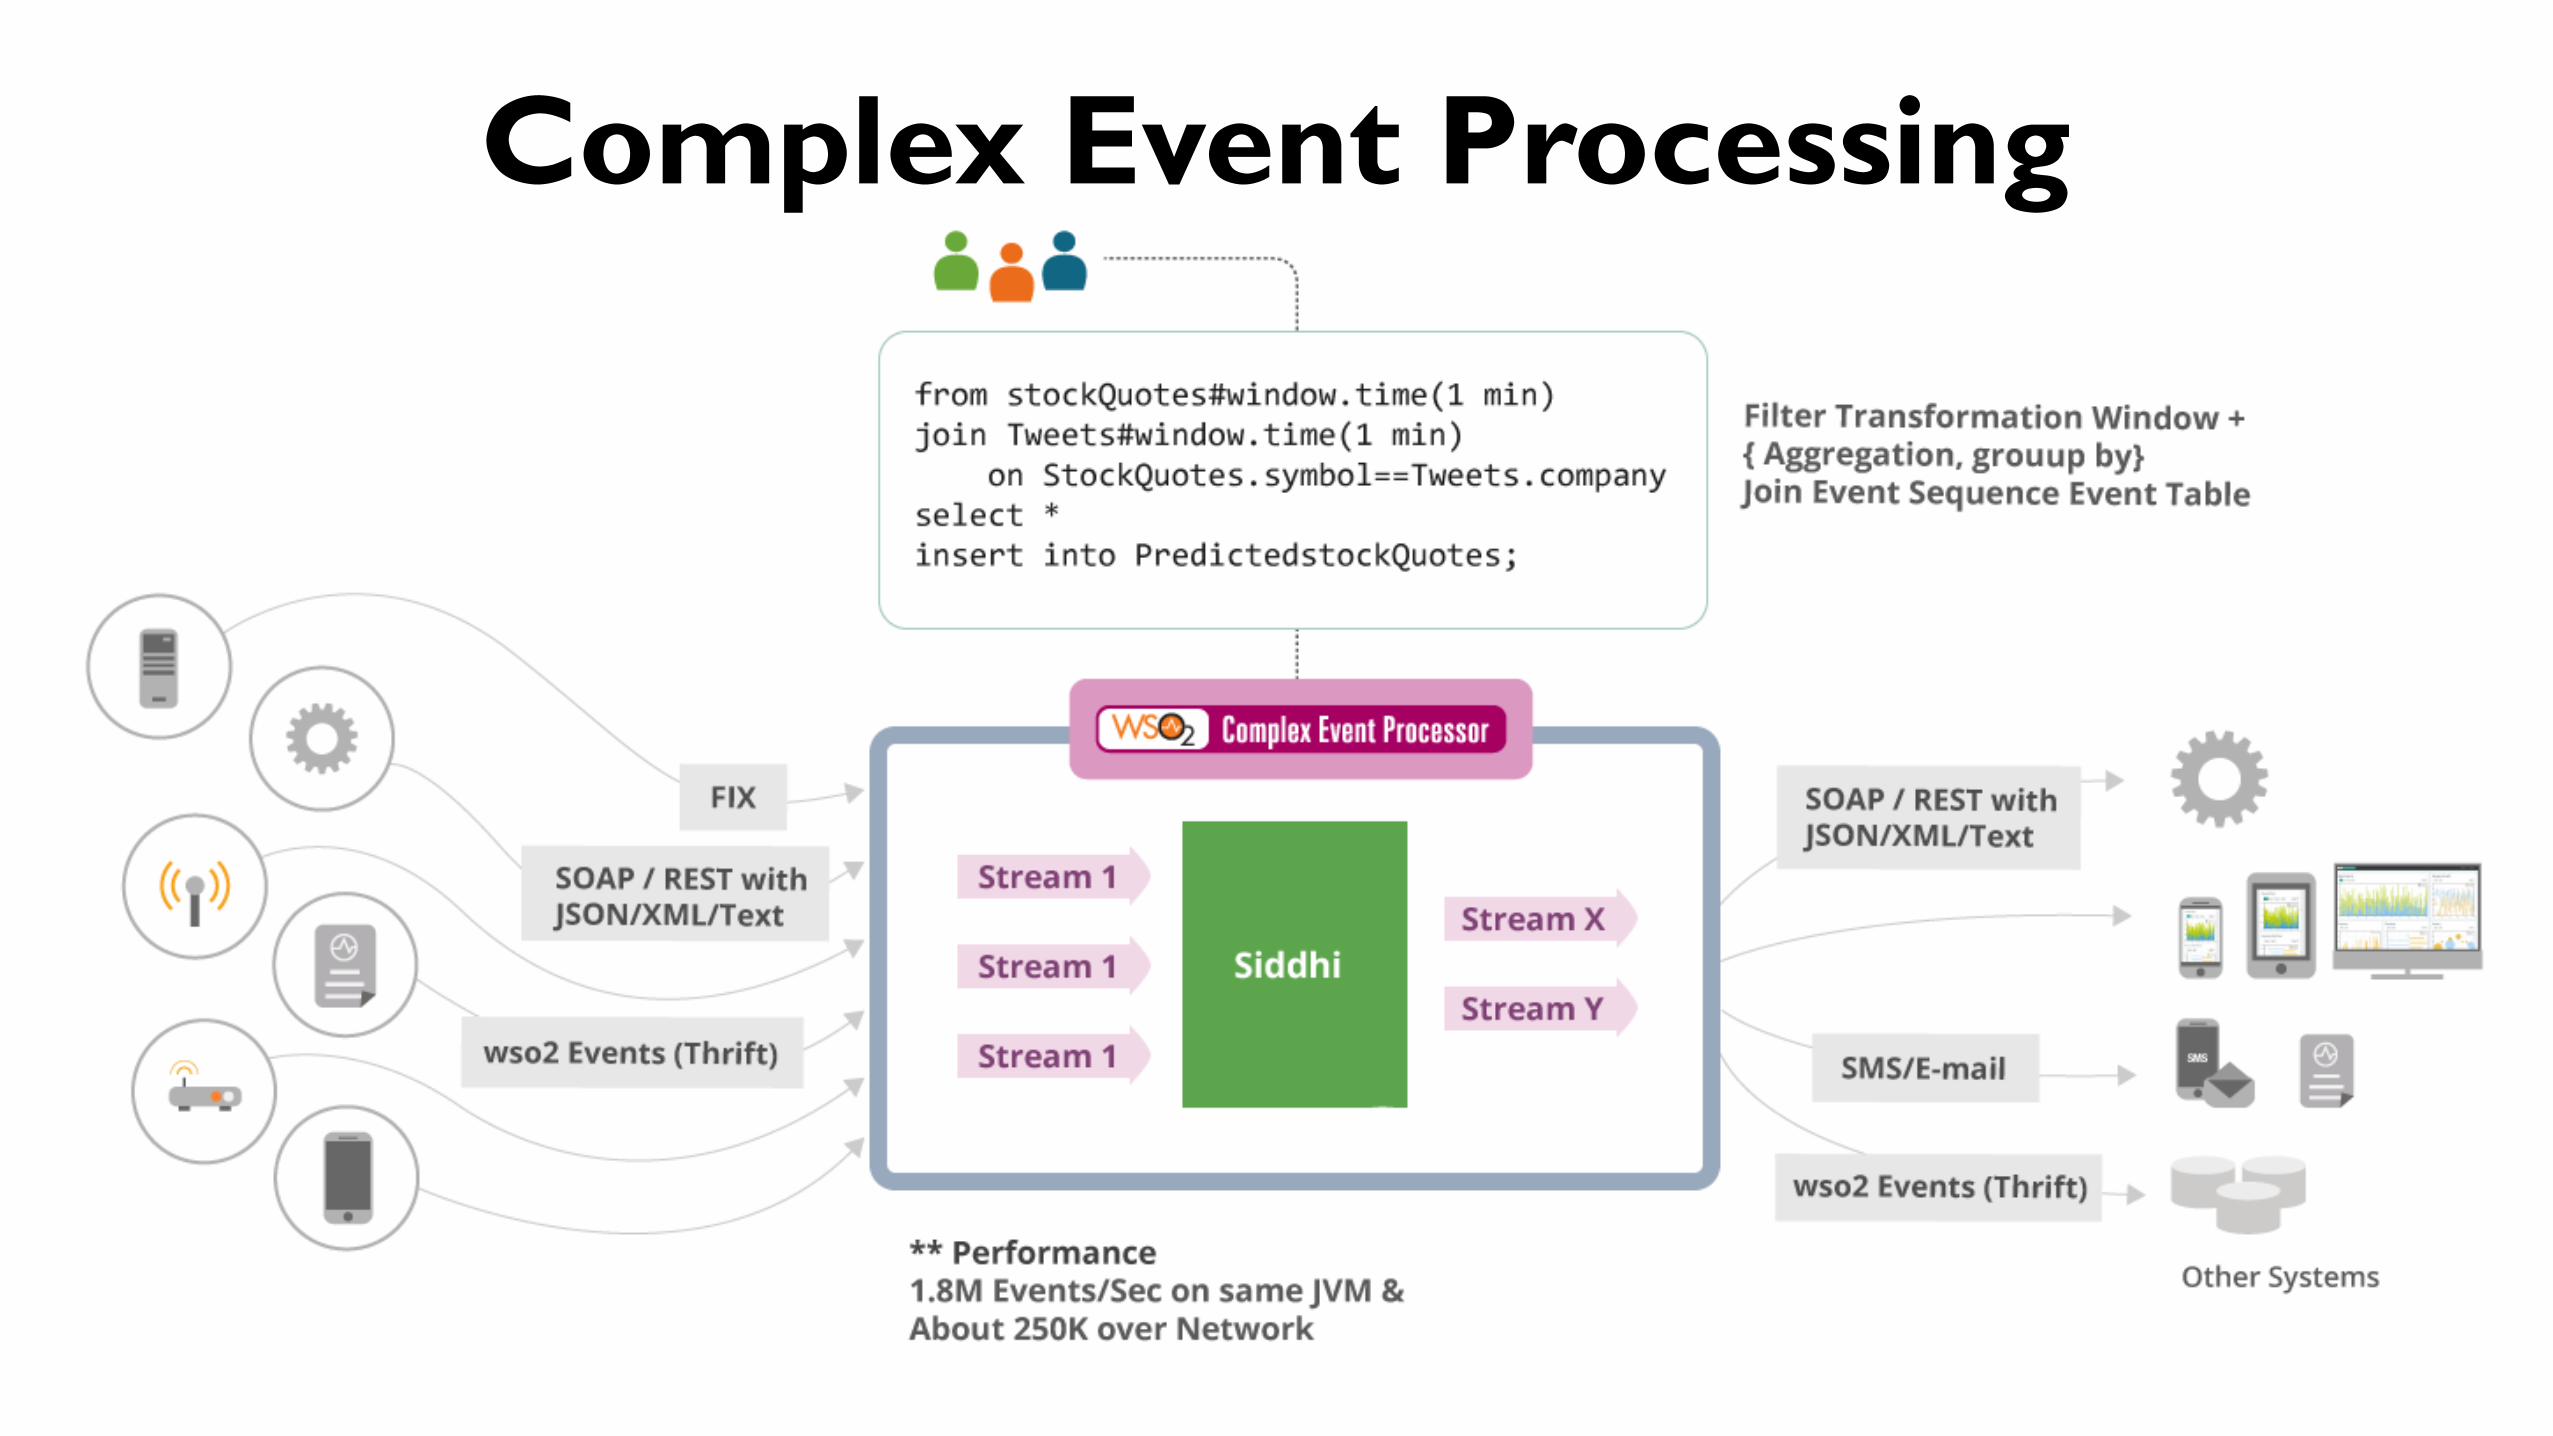
Complex Event Processing
Predictive Analytics If we know how to solve a problem, that is if we know
a finite set of rules, then we can programs it. For some problems (e.g. Drive a car, character
recognition), we do not know a finite fix rule set. Instead of programming, we give lot of examples and
ask the computer to learn (often called Machine Learning)
Lot of tools - R ( Statistical language)- Sci-kit learn (Phython)- Apache Spark’s MLBase and Apache Mahout (Java)
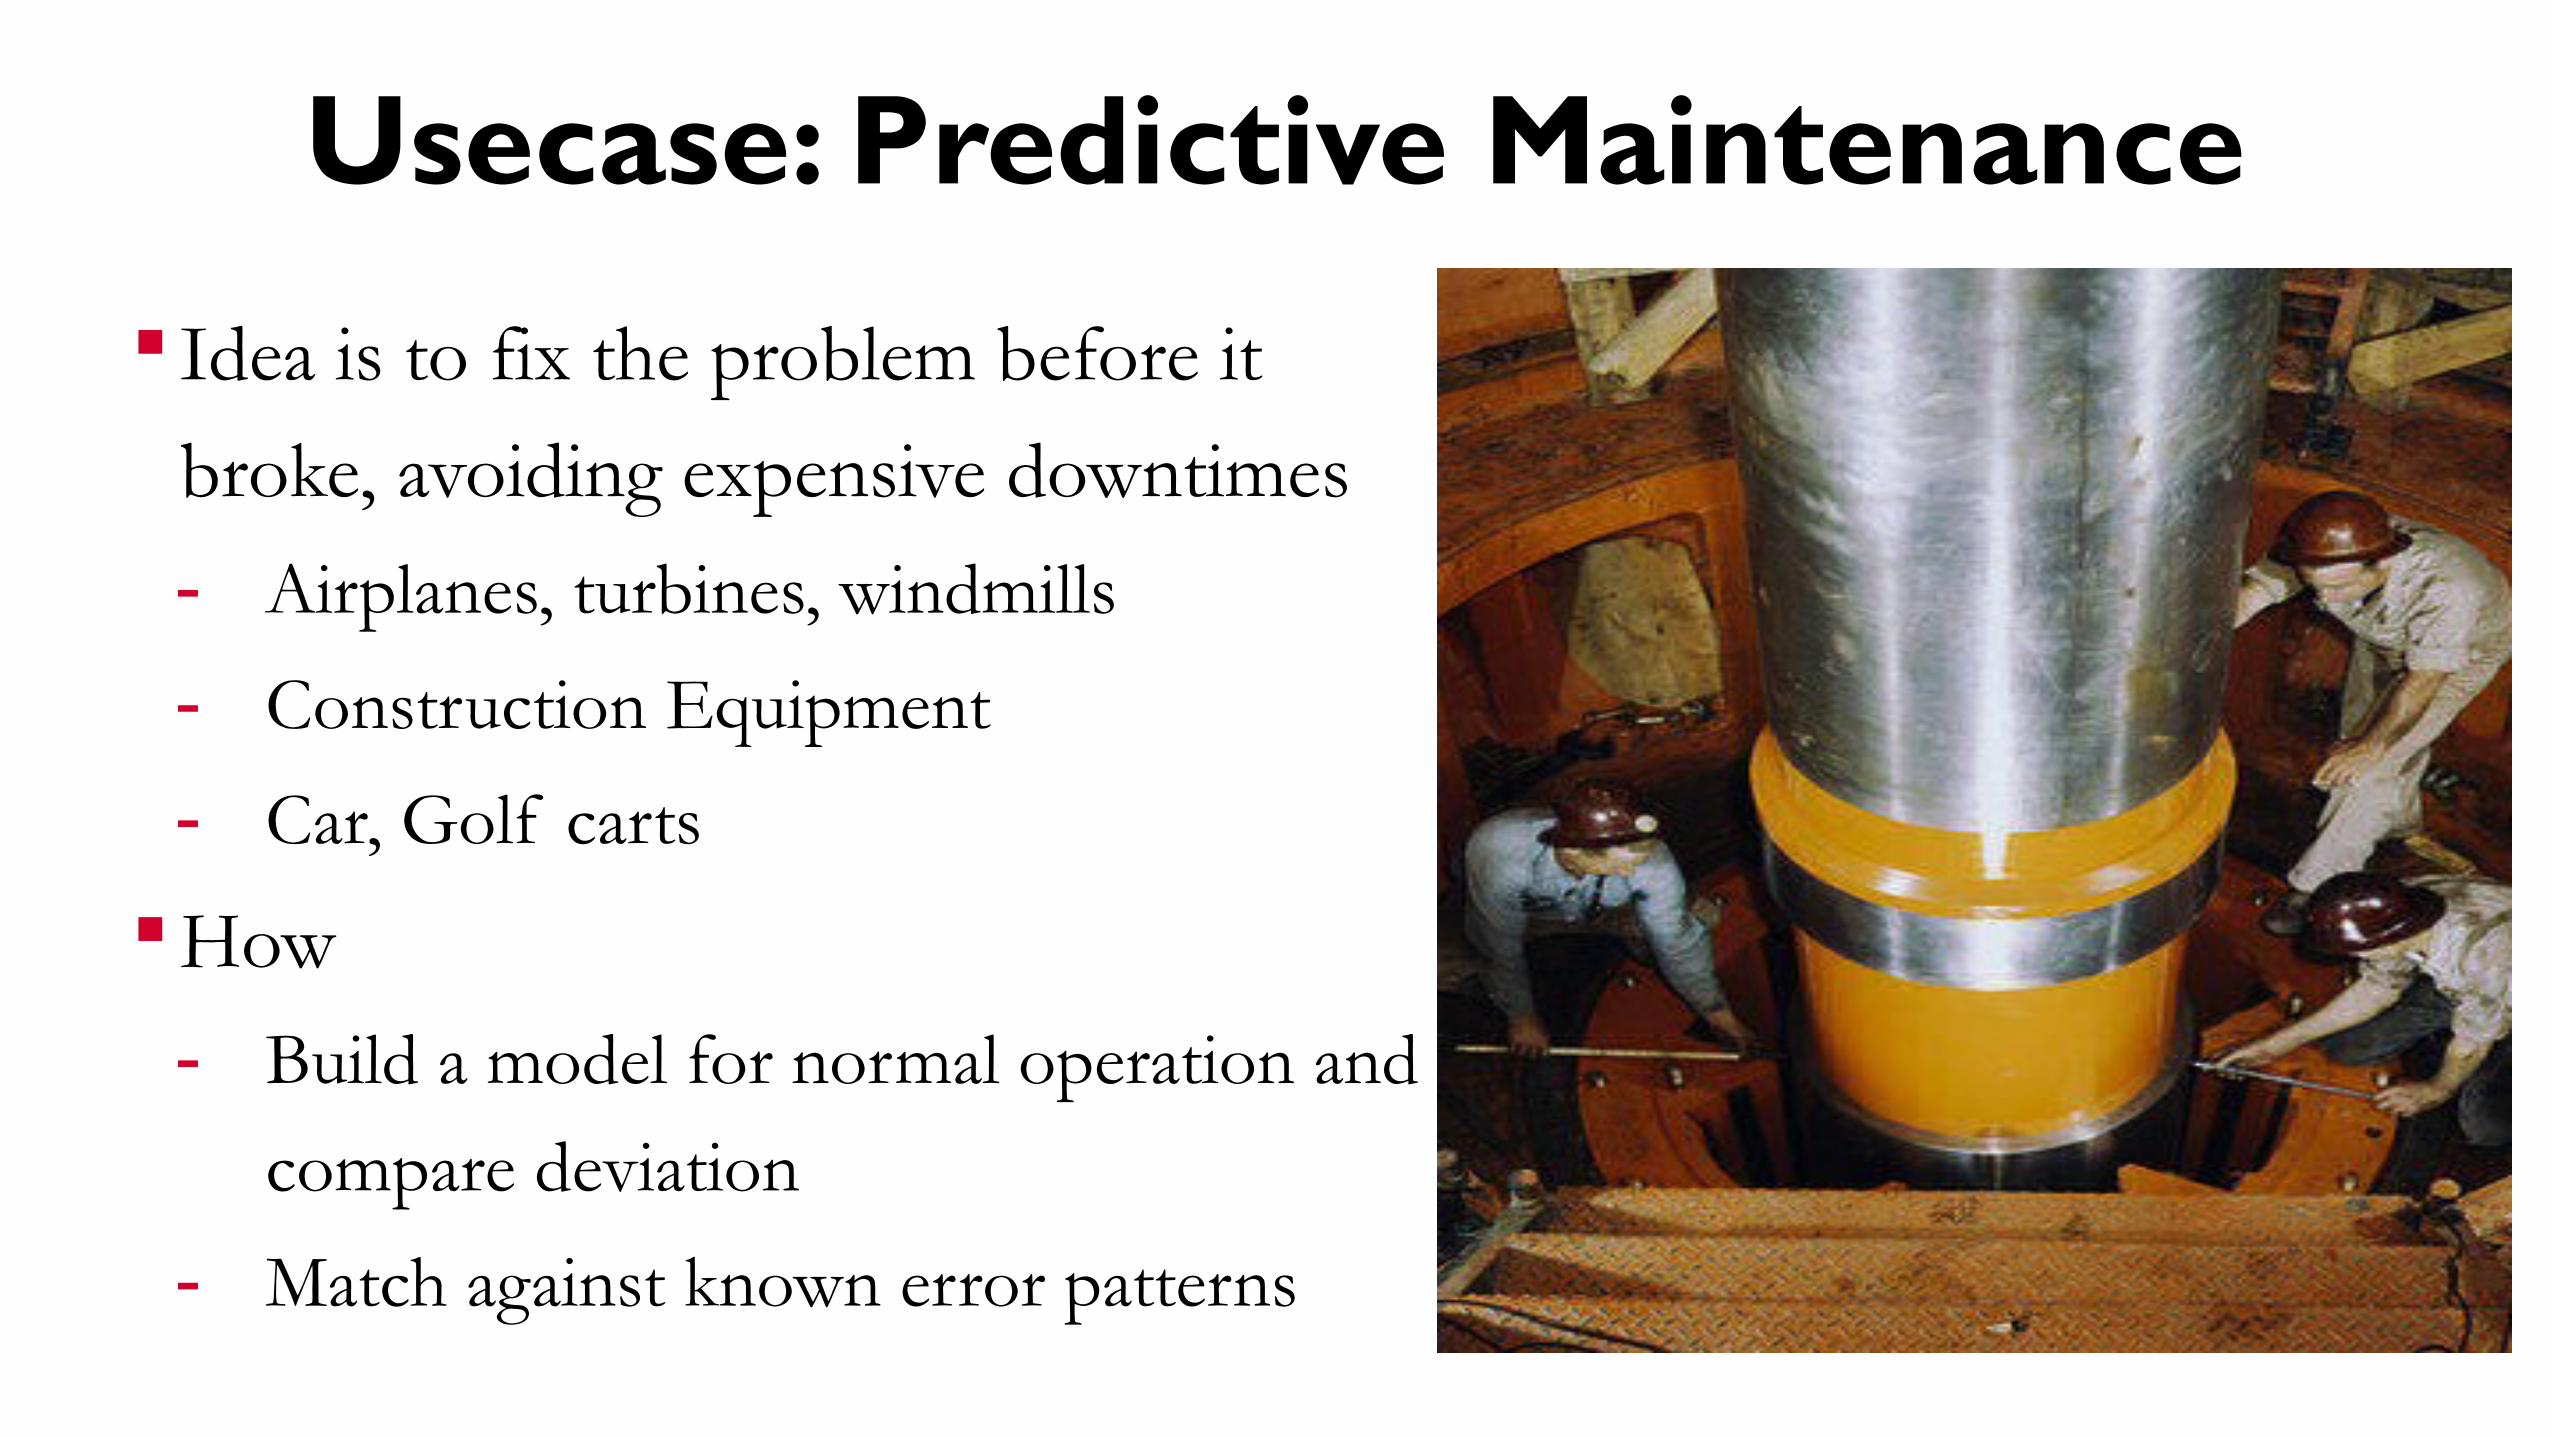
Usecase: Predictive Maintenance
Idea is to fix the problem before it
broke, avoiding expensive downtimes
- Airplanes, turbines, windmills
- Construction Equipment
- Car, Golf carts
How
- Build a model for normal operation and
compare deviation
- Match against known error patterns
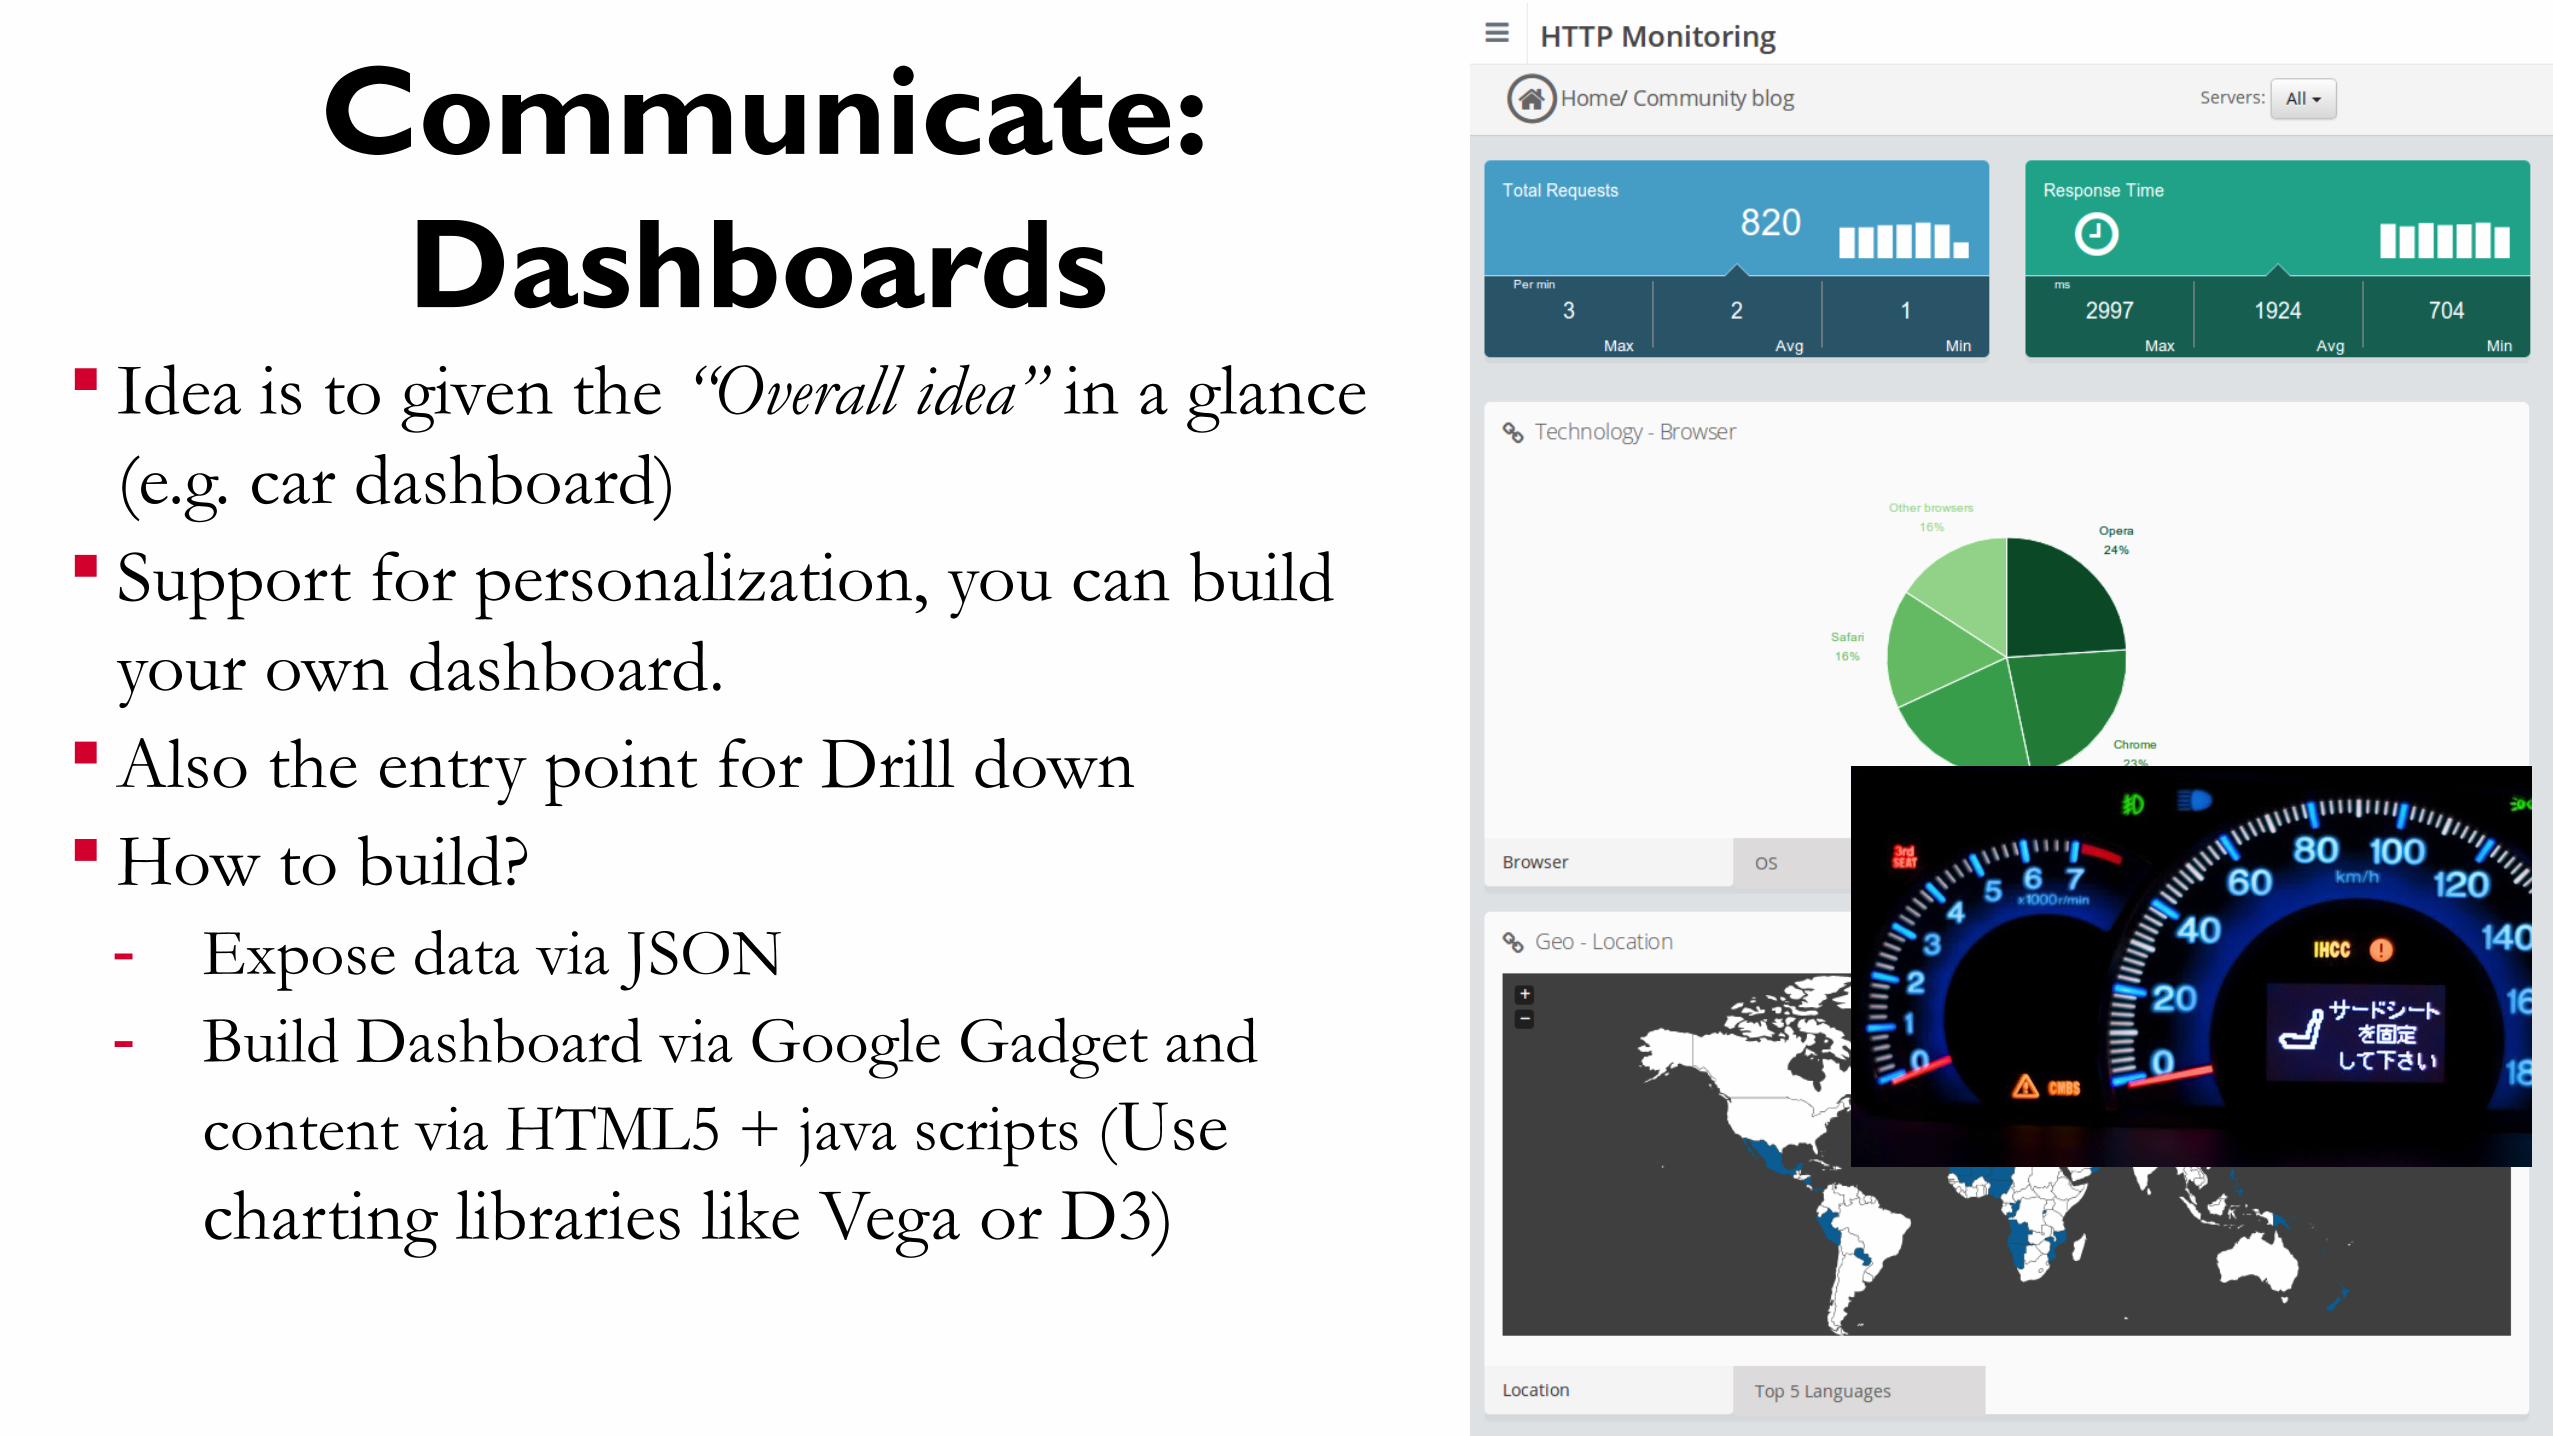
Communicate: Dashboards
Idea is to given the “Overall idea” in a glance (e.g. car dashboard)
Support for personalization, you can build your own dashboard.
Also the entry point for Drill down How to build?- Expose data via JSON- Build Dashboard via Google Gadget and
content via HTML5 + java scripts (Use charting libraries like Vega or D3)
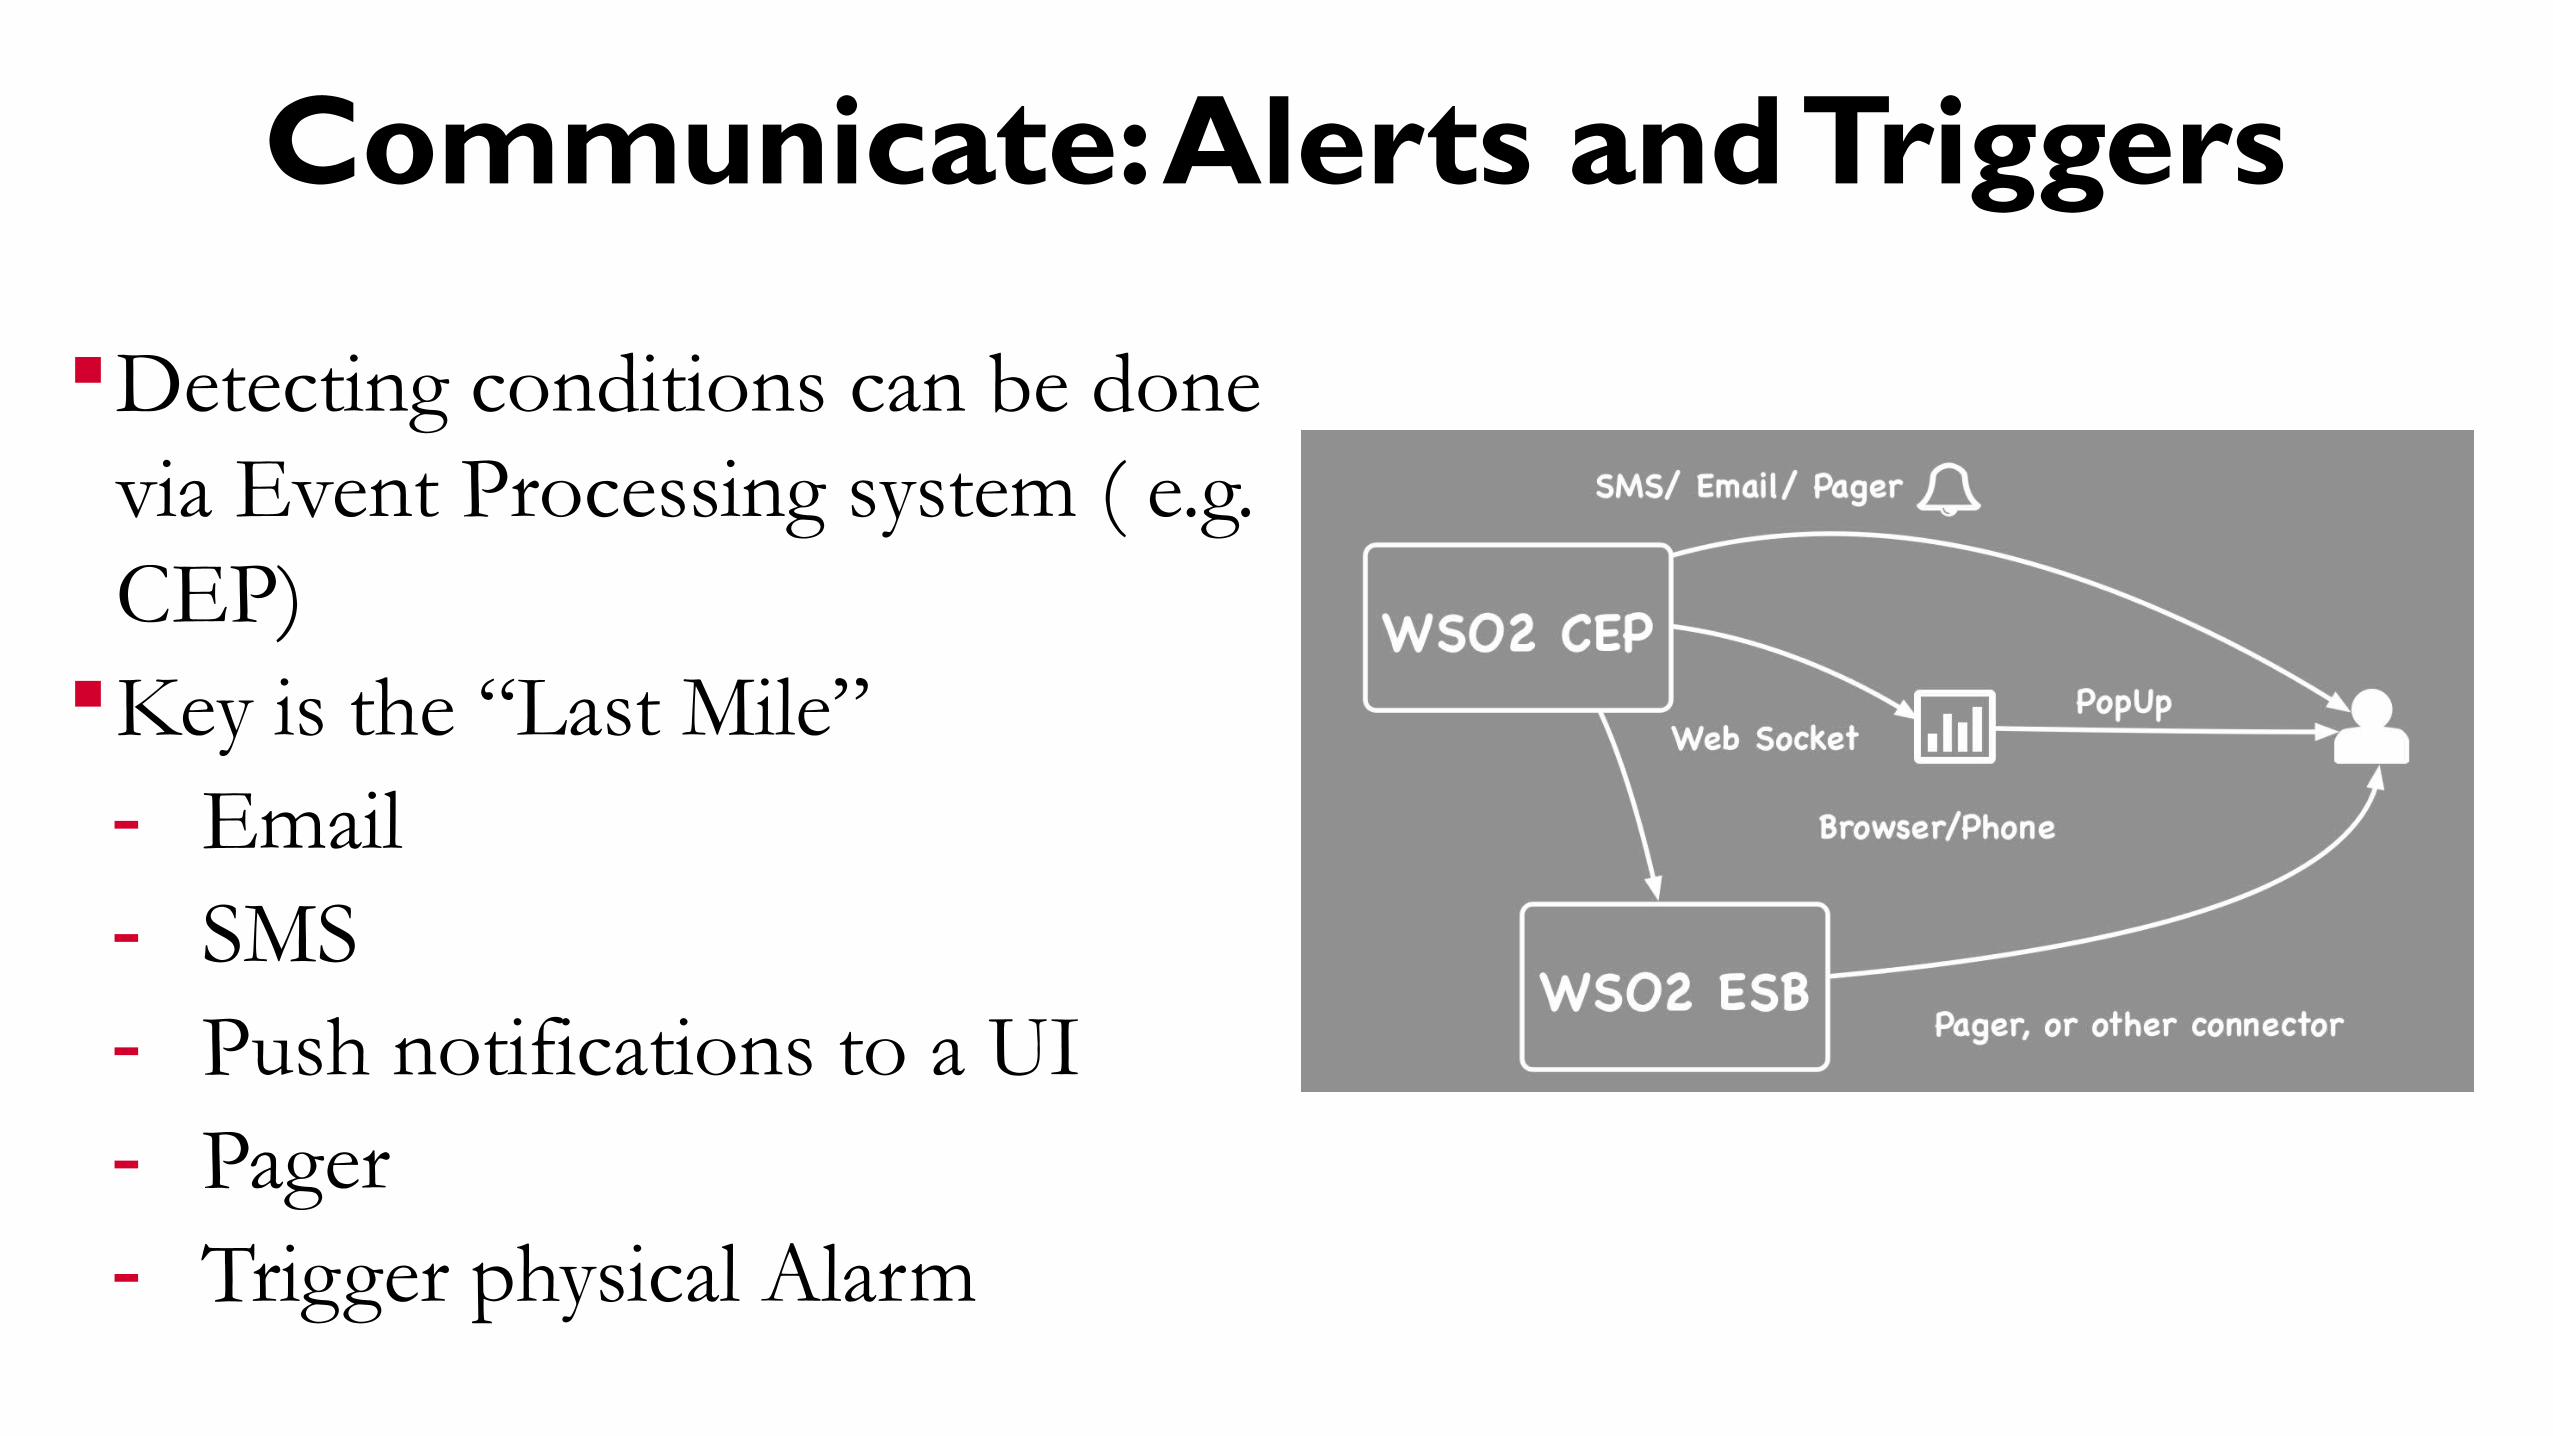
Communicate: Alerts and Triggers
Detecting conditions can be done via Event Processing system ( e.g. CEP)
Key is the “Last Mile”- Email- SMS- Push notifications to a UI- Pager - Trigger physical Alarm
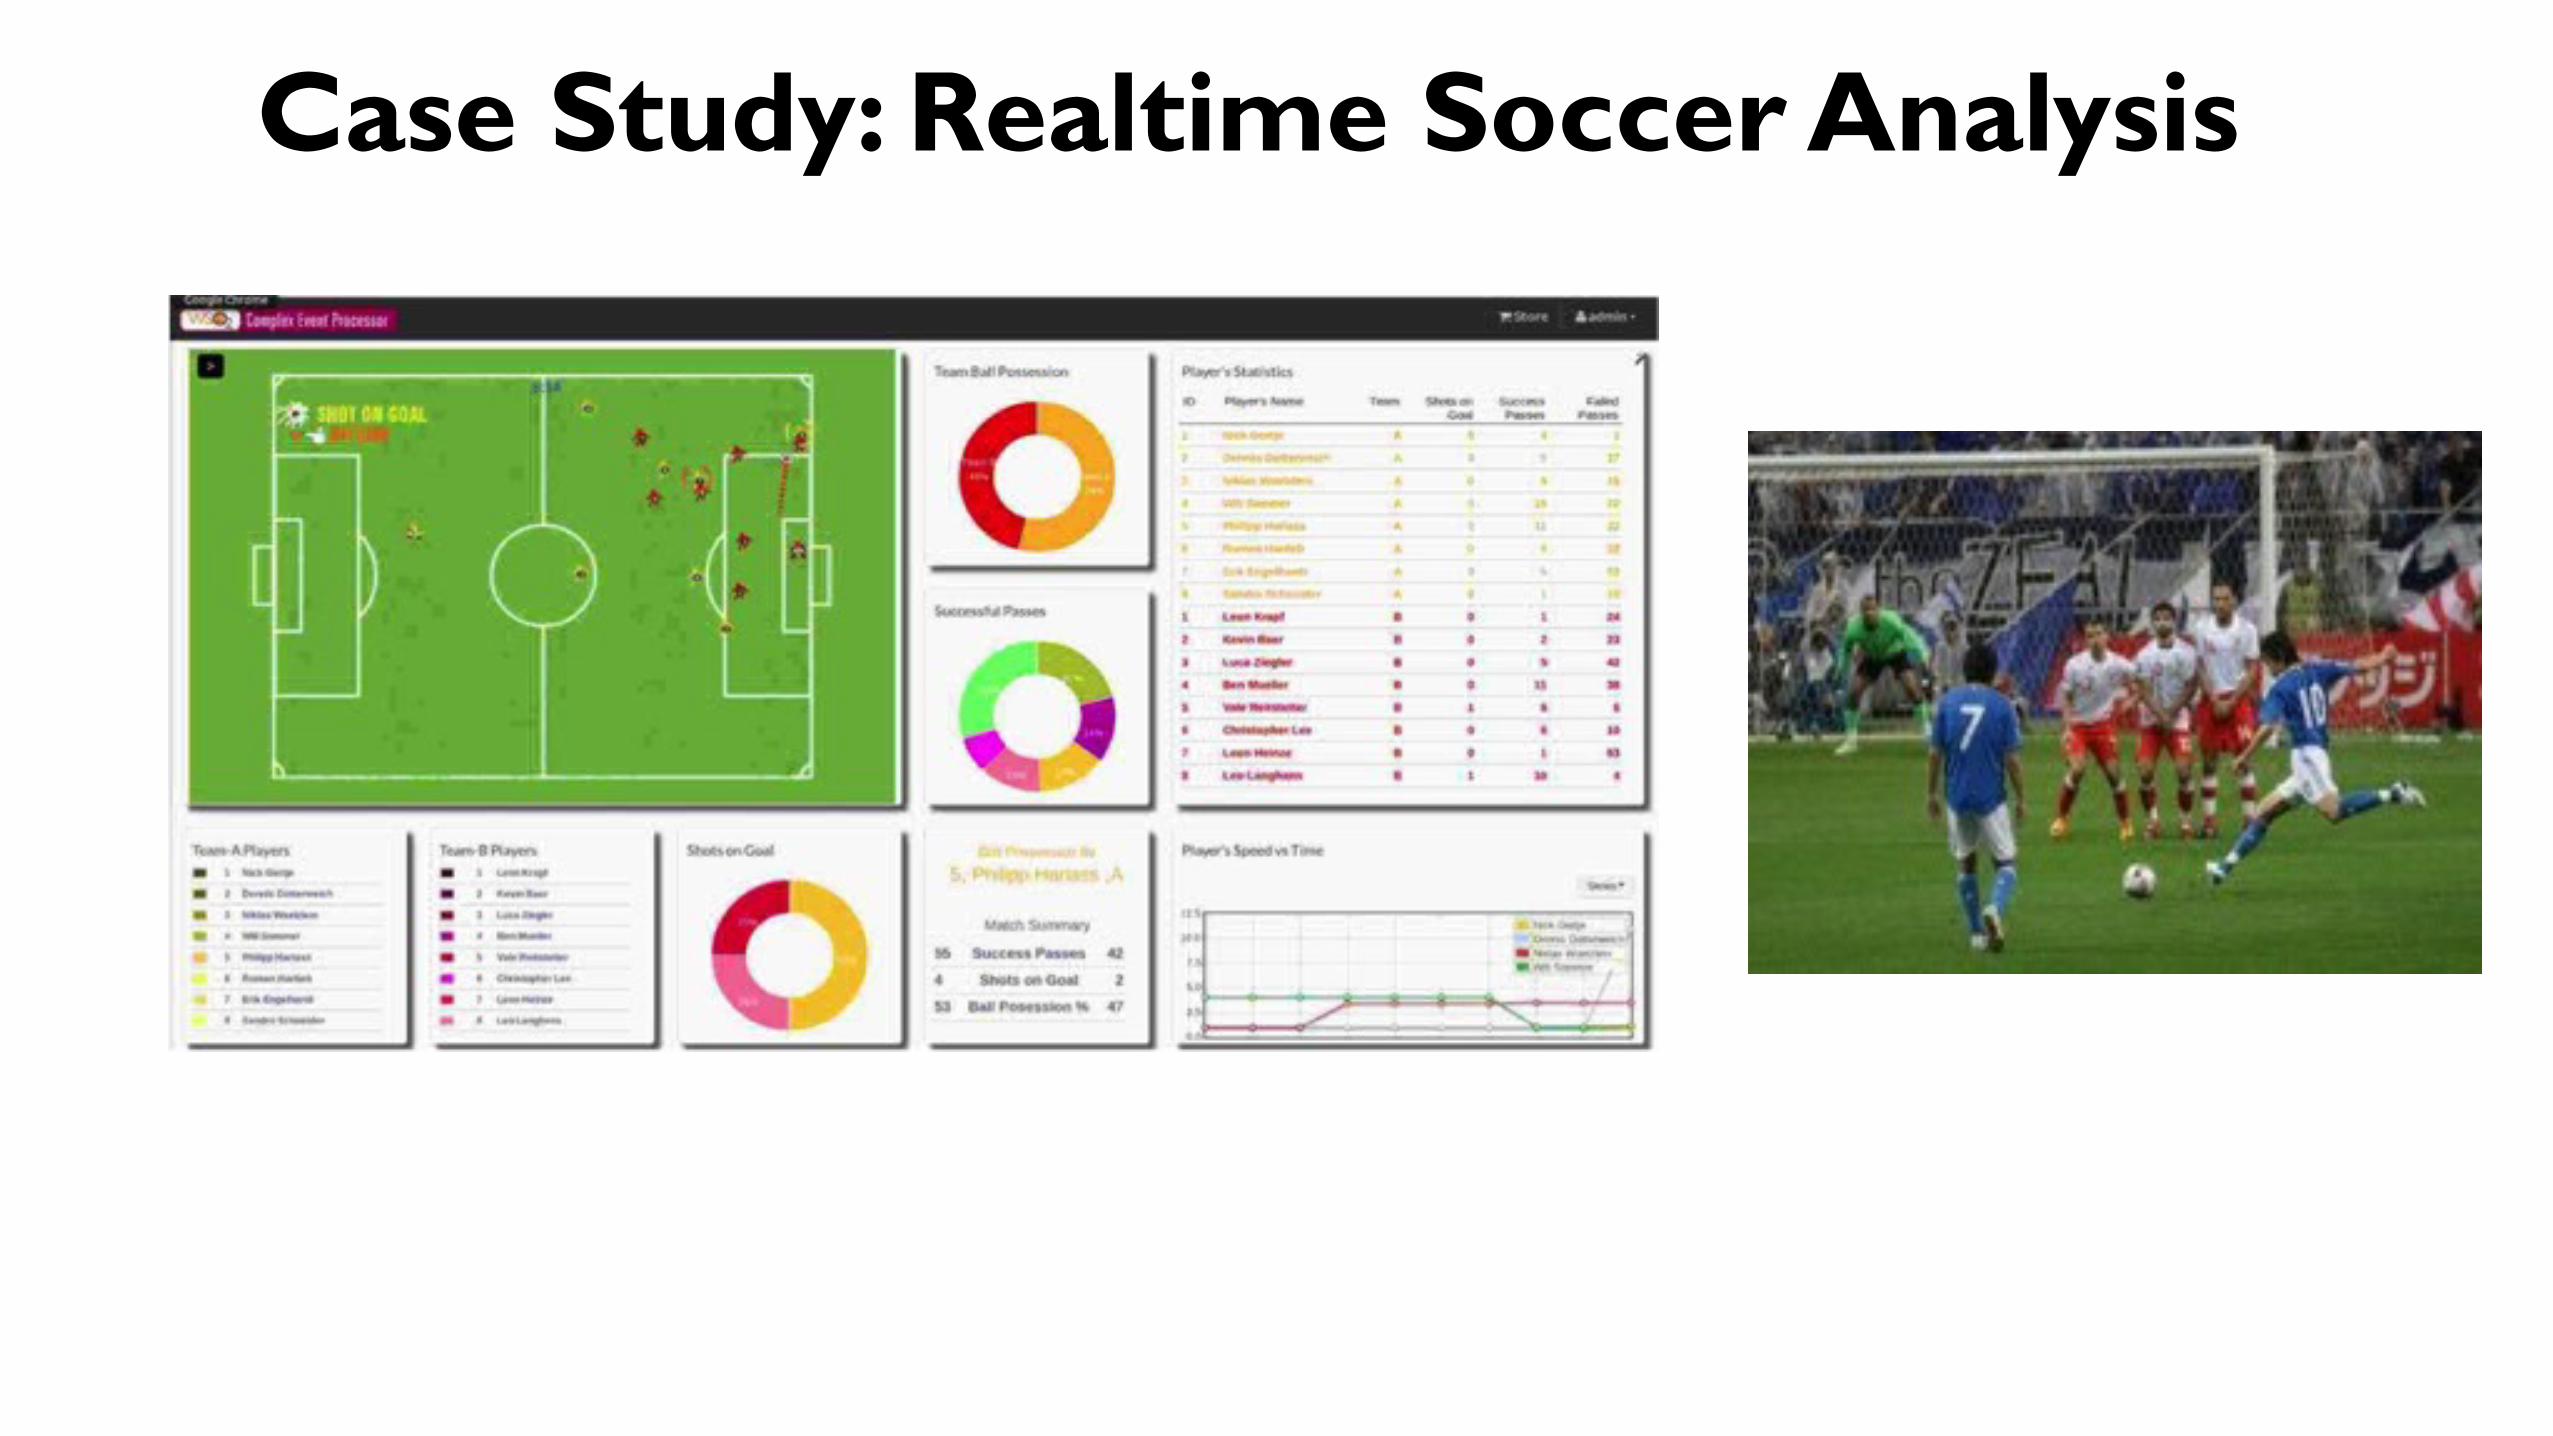
Case Study: Realtime Soccer Analysis
Watch at: https://www.youtube.com/watch?v=nRI6buQ0NOM

Changing Dynamics
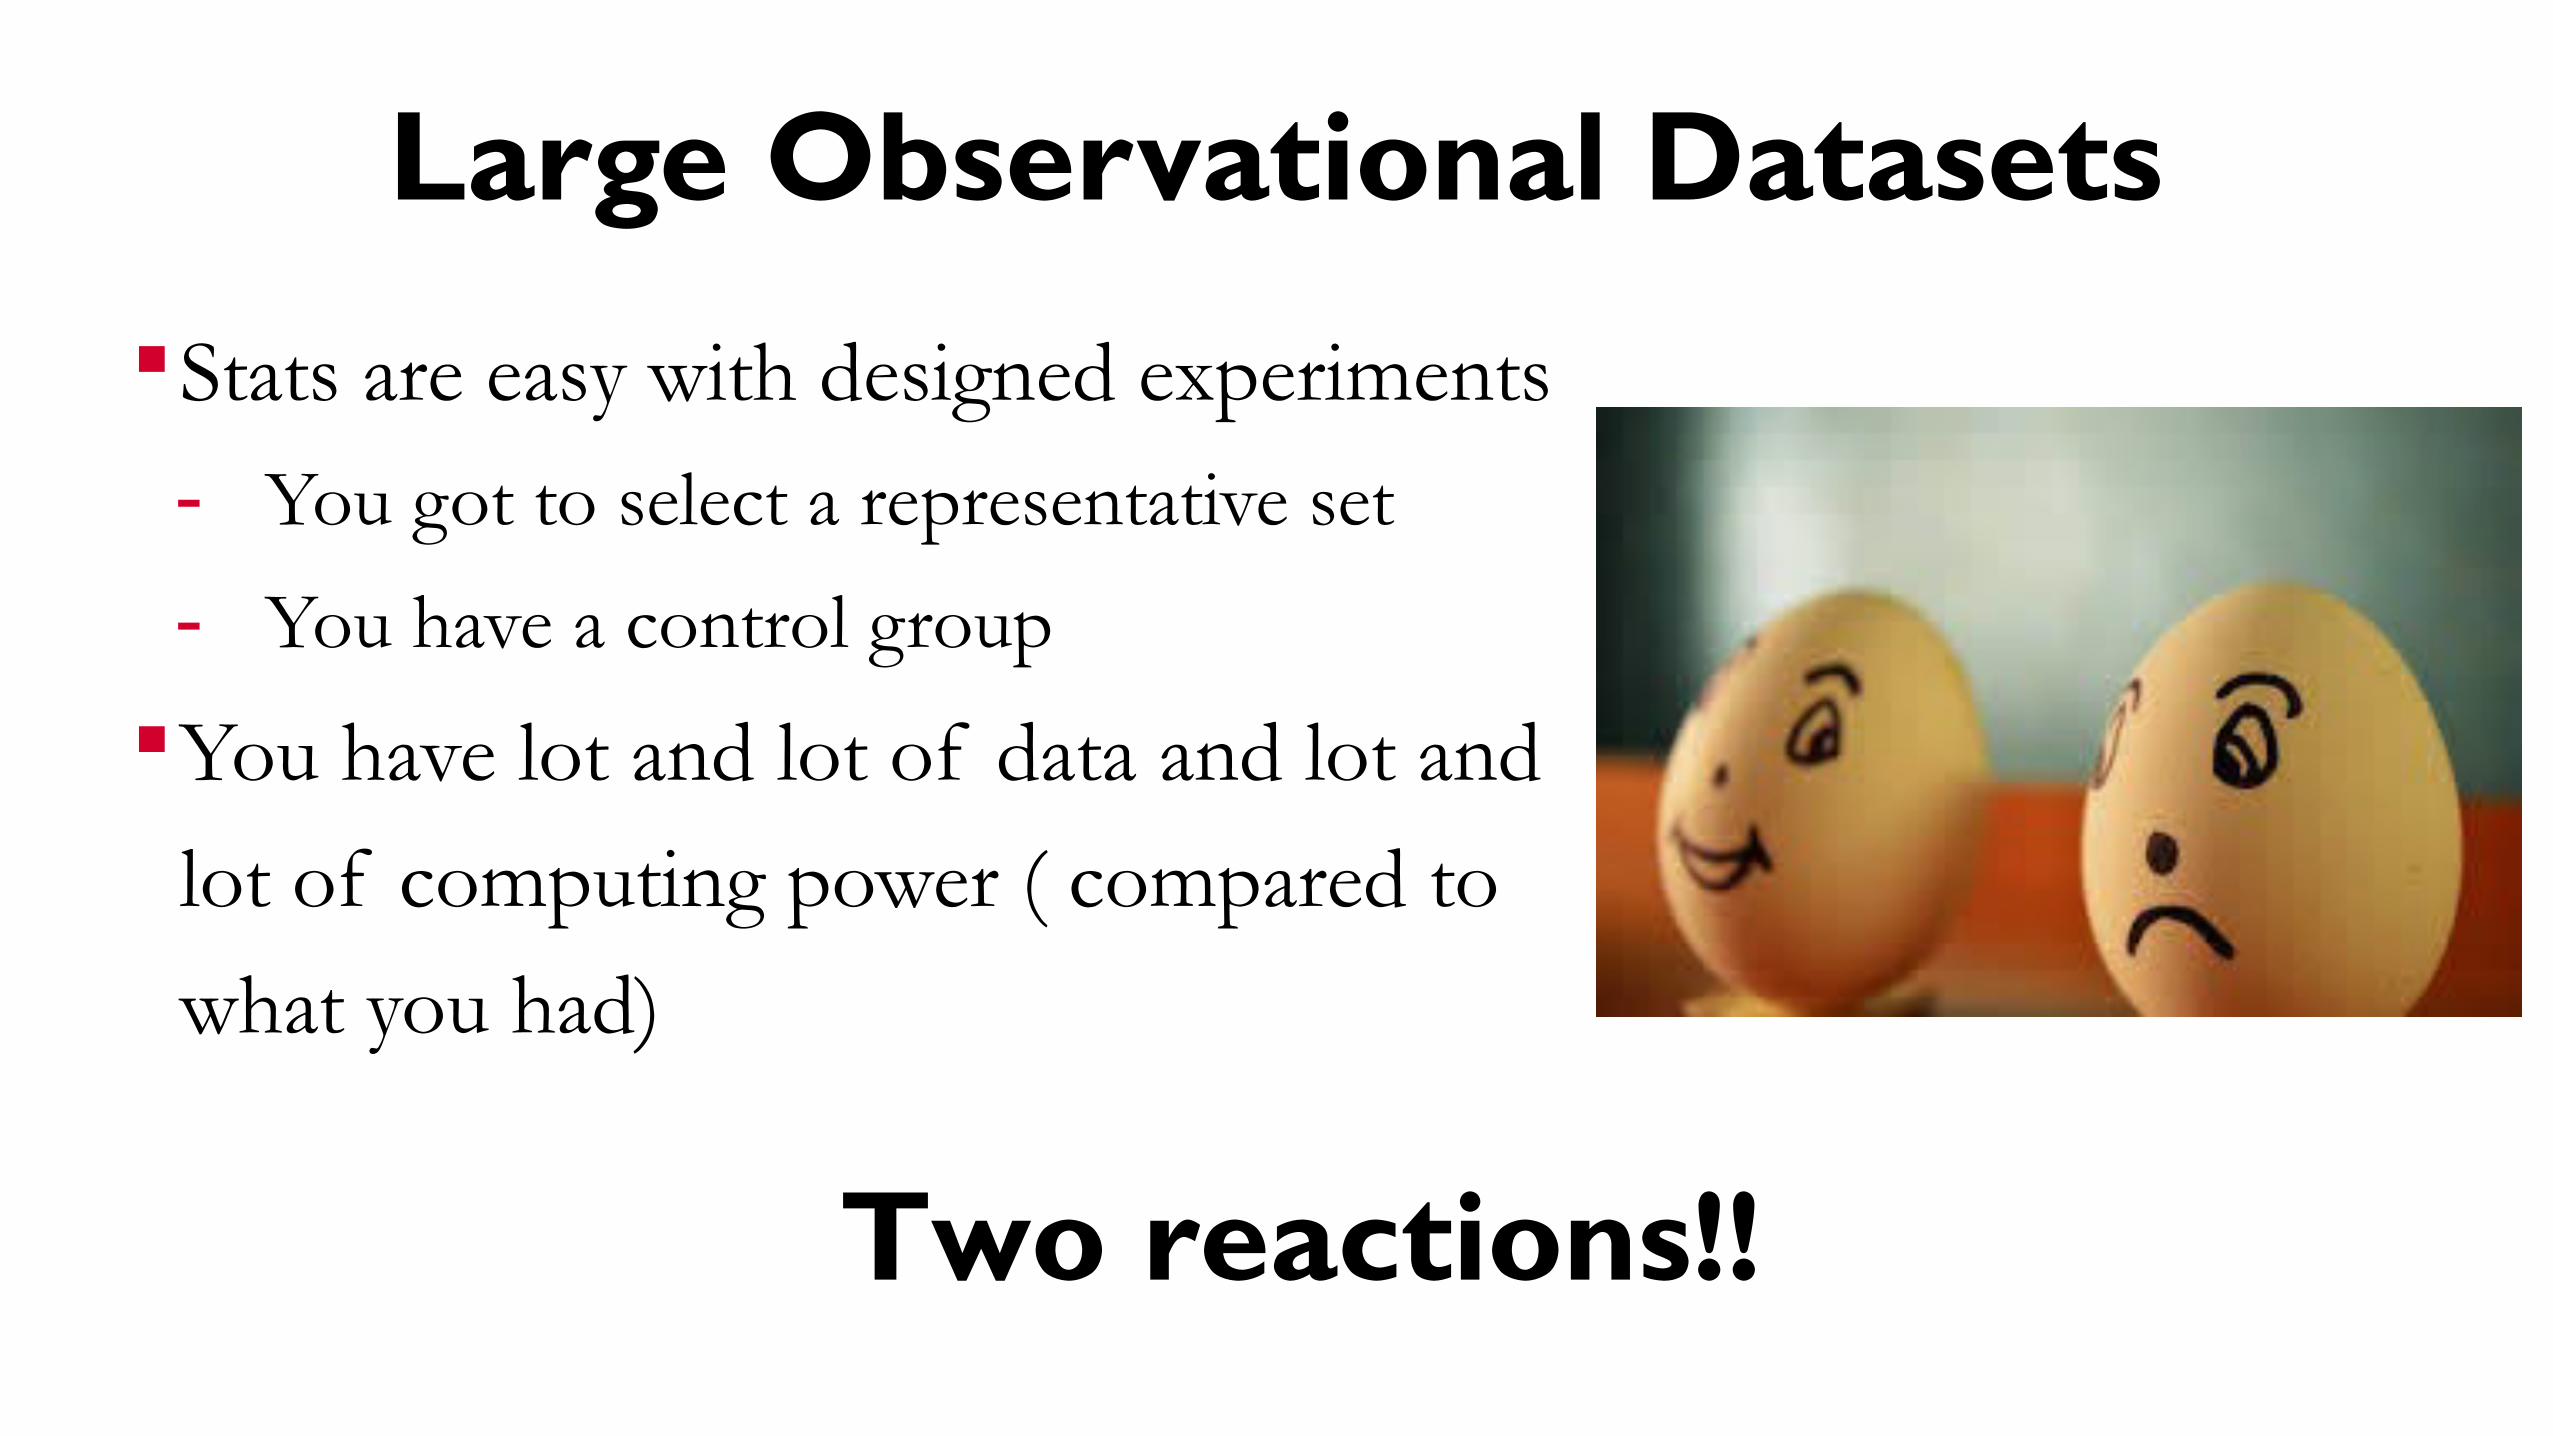
Large Observational Datasets
Stats are easy with designed experiments
- You got to select a representative set
- You have a control group
You have lot and lot of data and lot and
lot of computing power ( compared to
what you had)
Two reactions!!
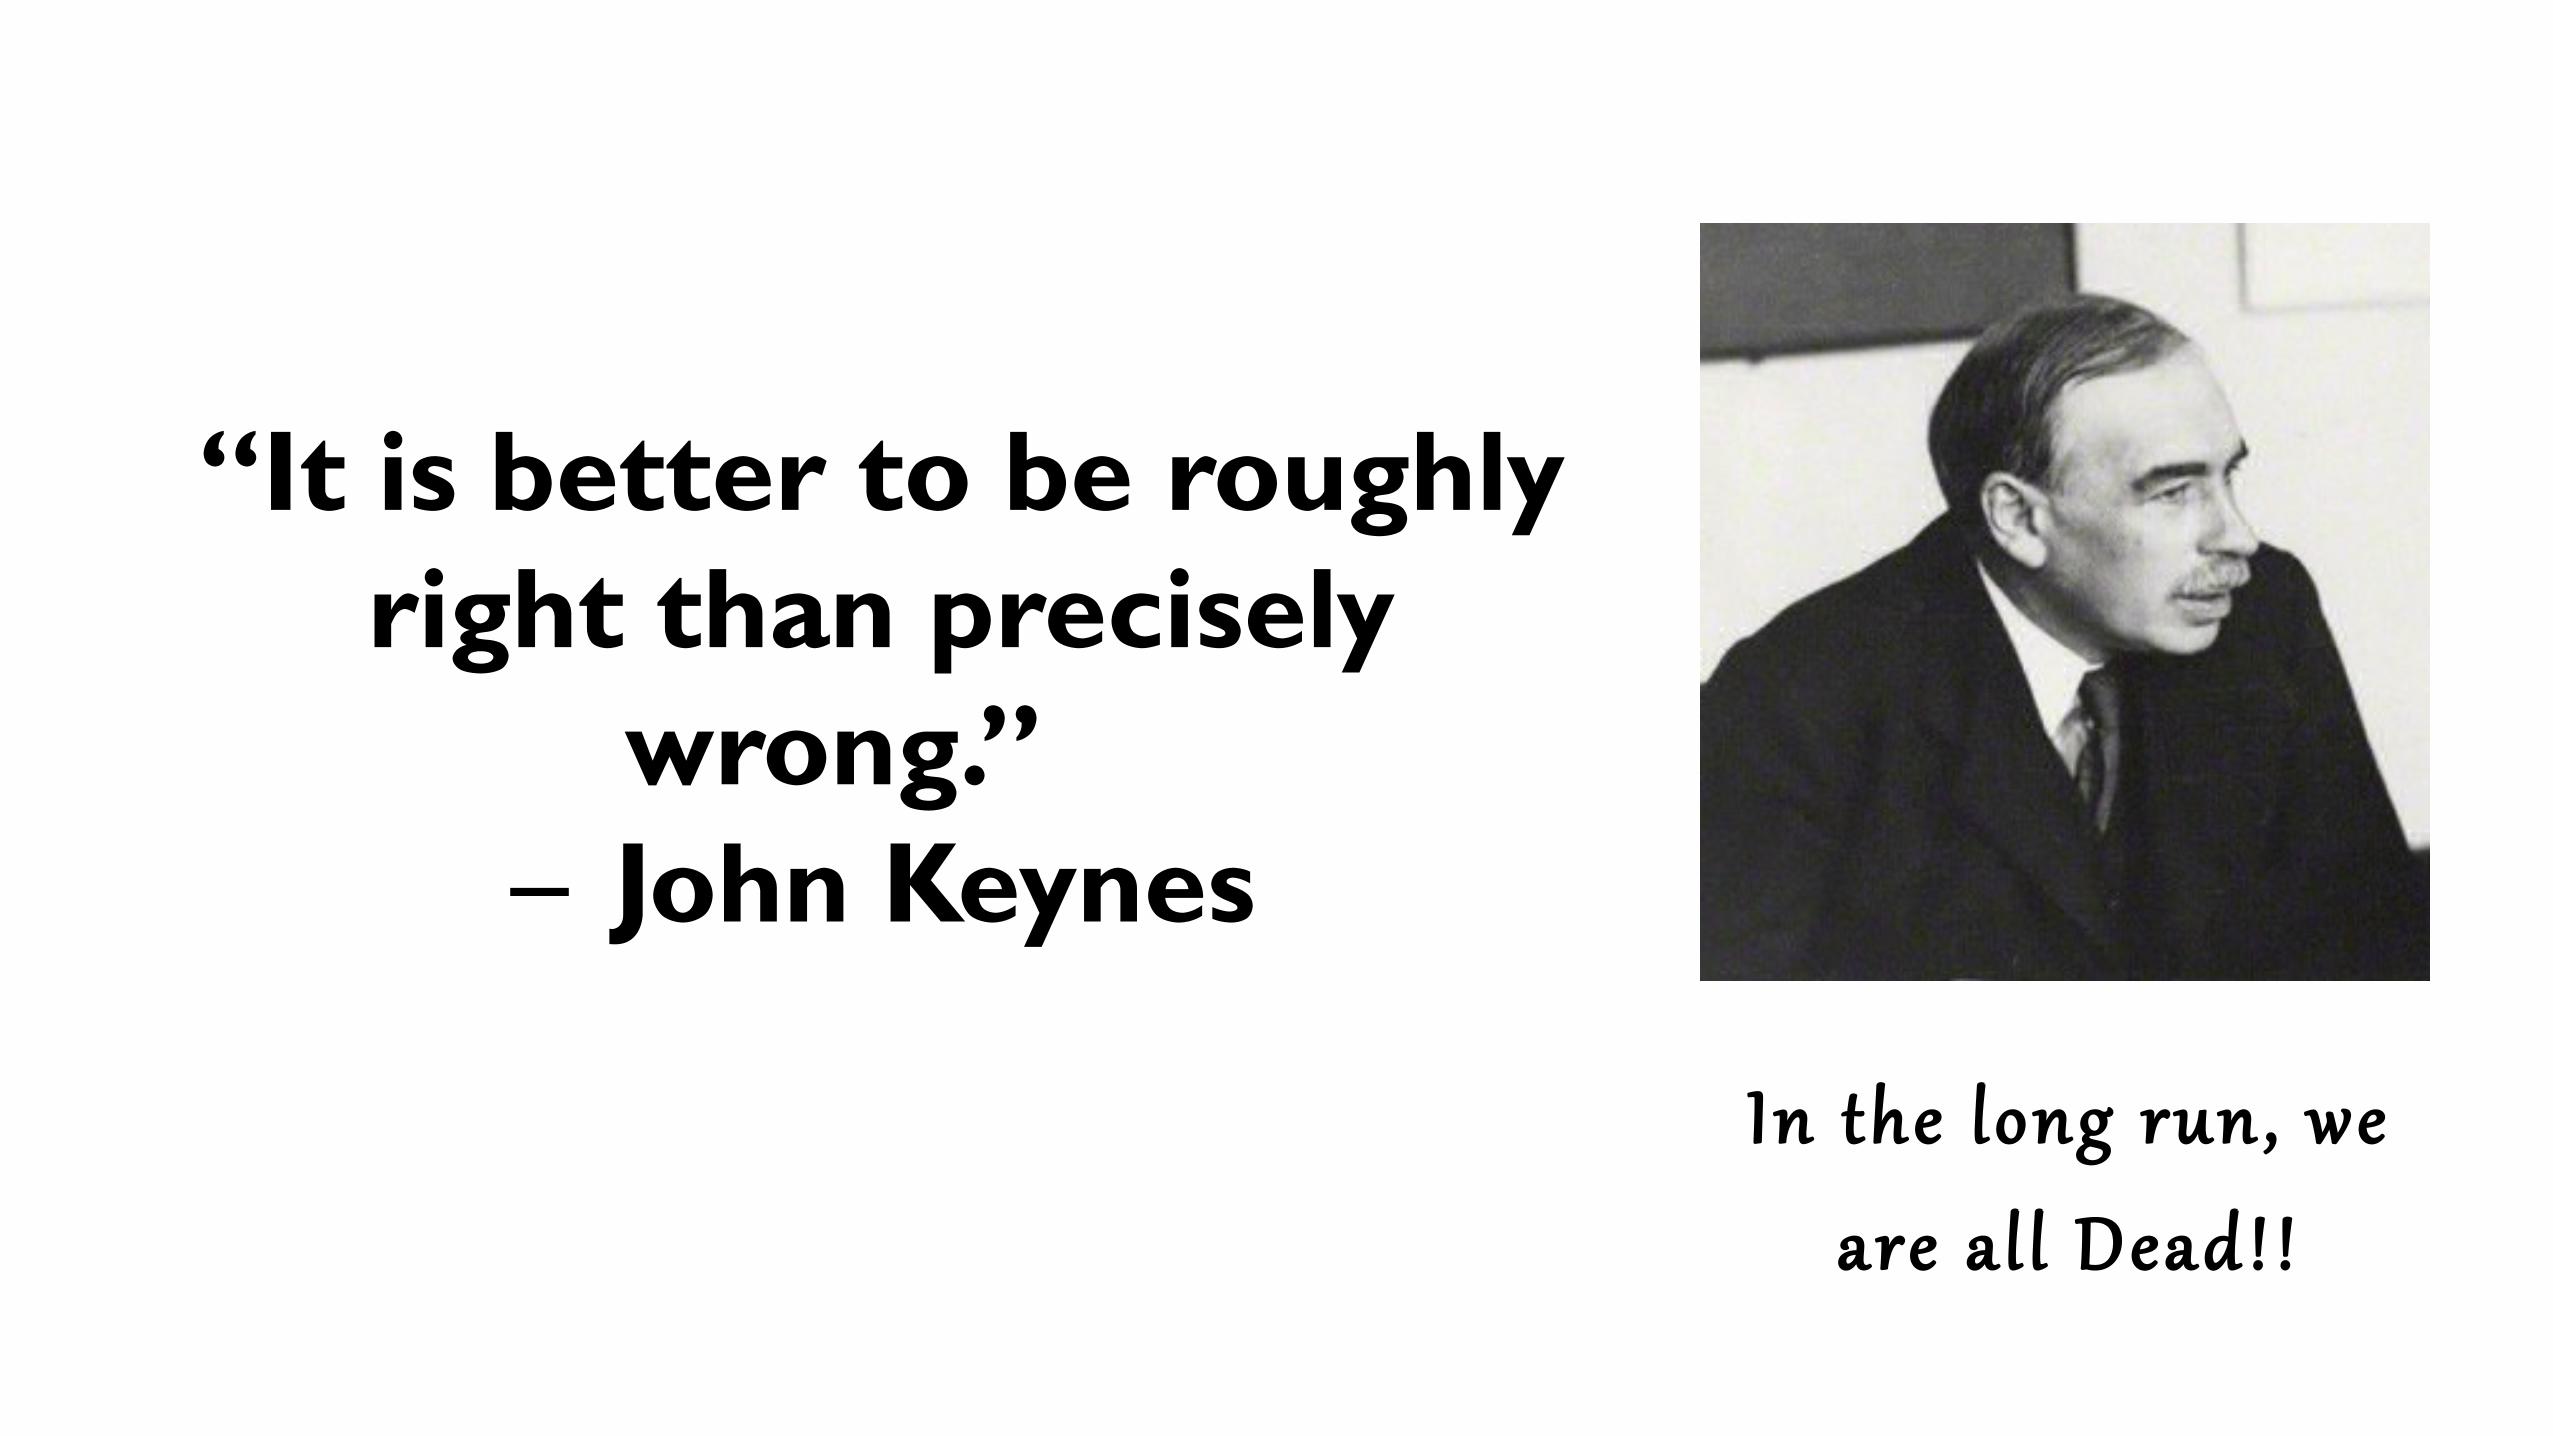
“It is better to be roughly right than precisely
wrong.” John Keynes―
In the long run , we are a l l Dead! !
Challenges: Causality Correlation does not imply Causality!! ( send a book home
example [1]) Causality - do repeat experiment with identical test - If CAN’T do a randomized test (A/B test)- With Big data we cannot do either
Option 1: We can act on correlation if we can verify the guess or if correctness is not critical (Start Investigation, Check for a disease, Marketing )
Option 2: We verify correlations using A/B testing or propensity analysis
[1] http://www.freakonomics.com/2008/12/10/the-blagojevich-upside/[2] https://hbr.org/2014/03/when-to-act-on-a-correlation-and-when-not-to/
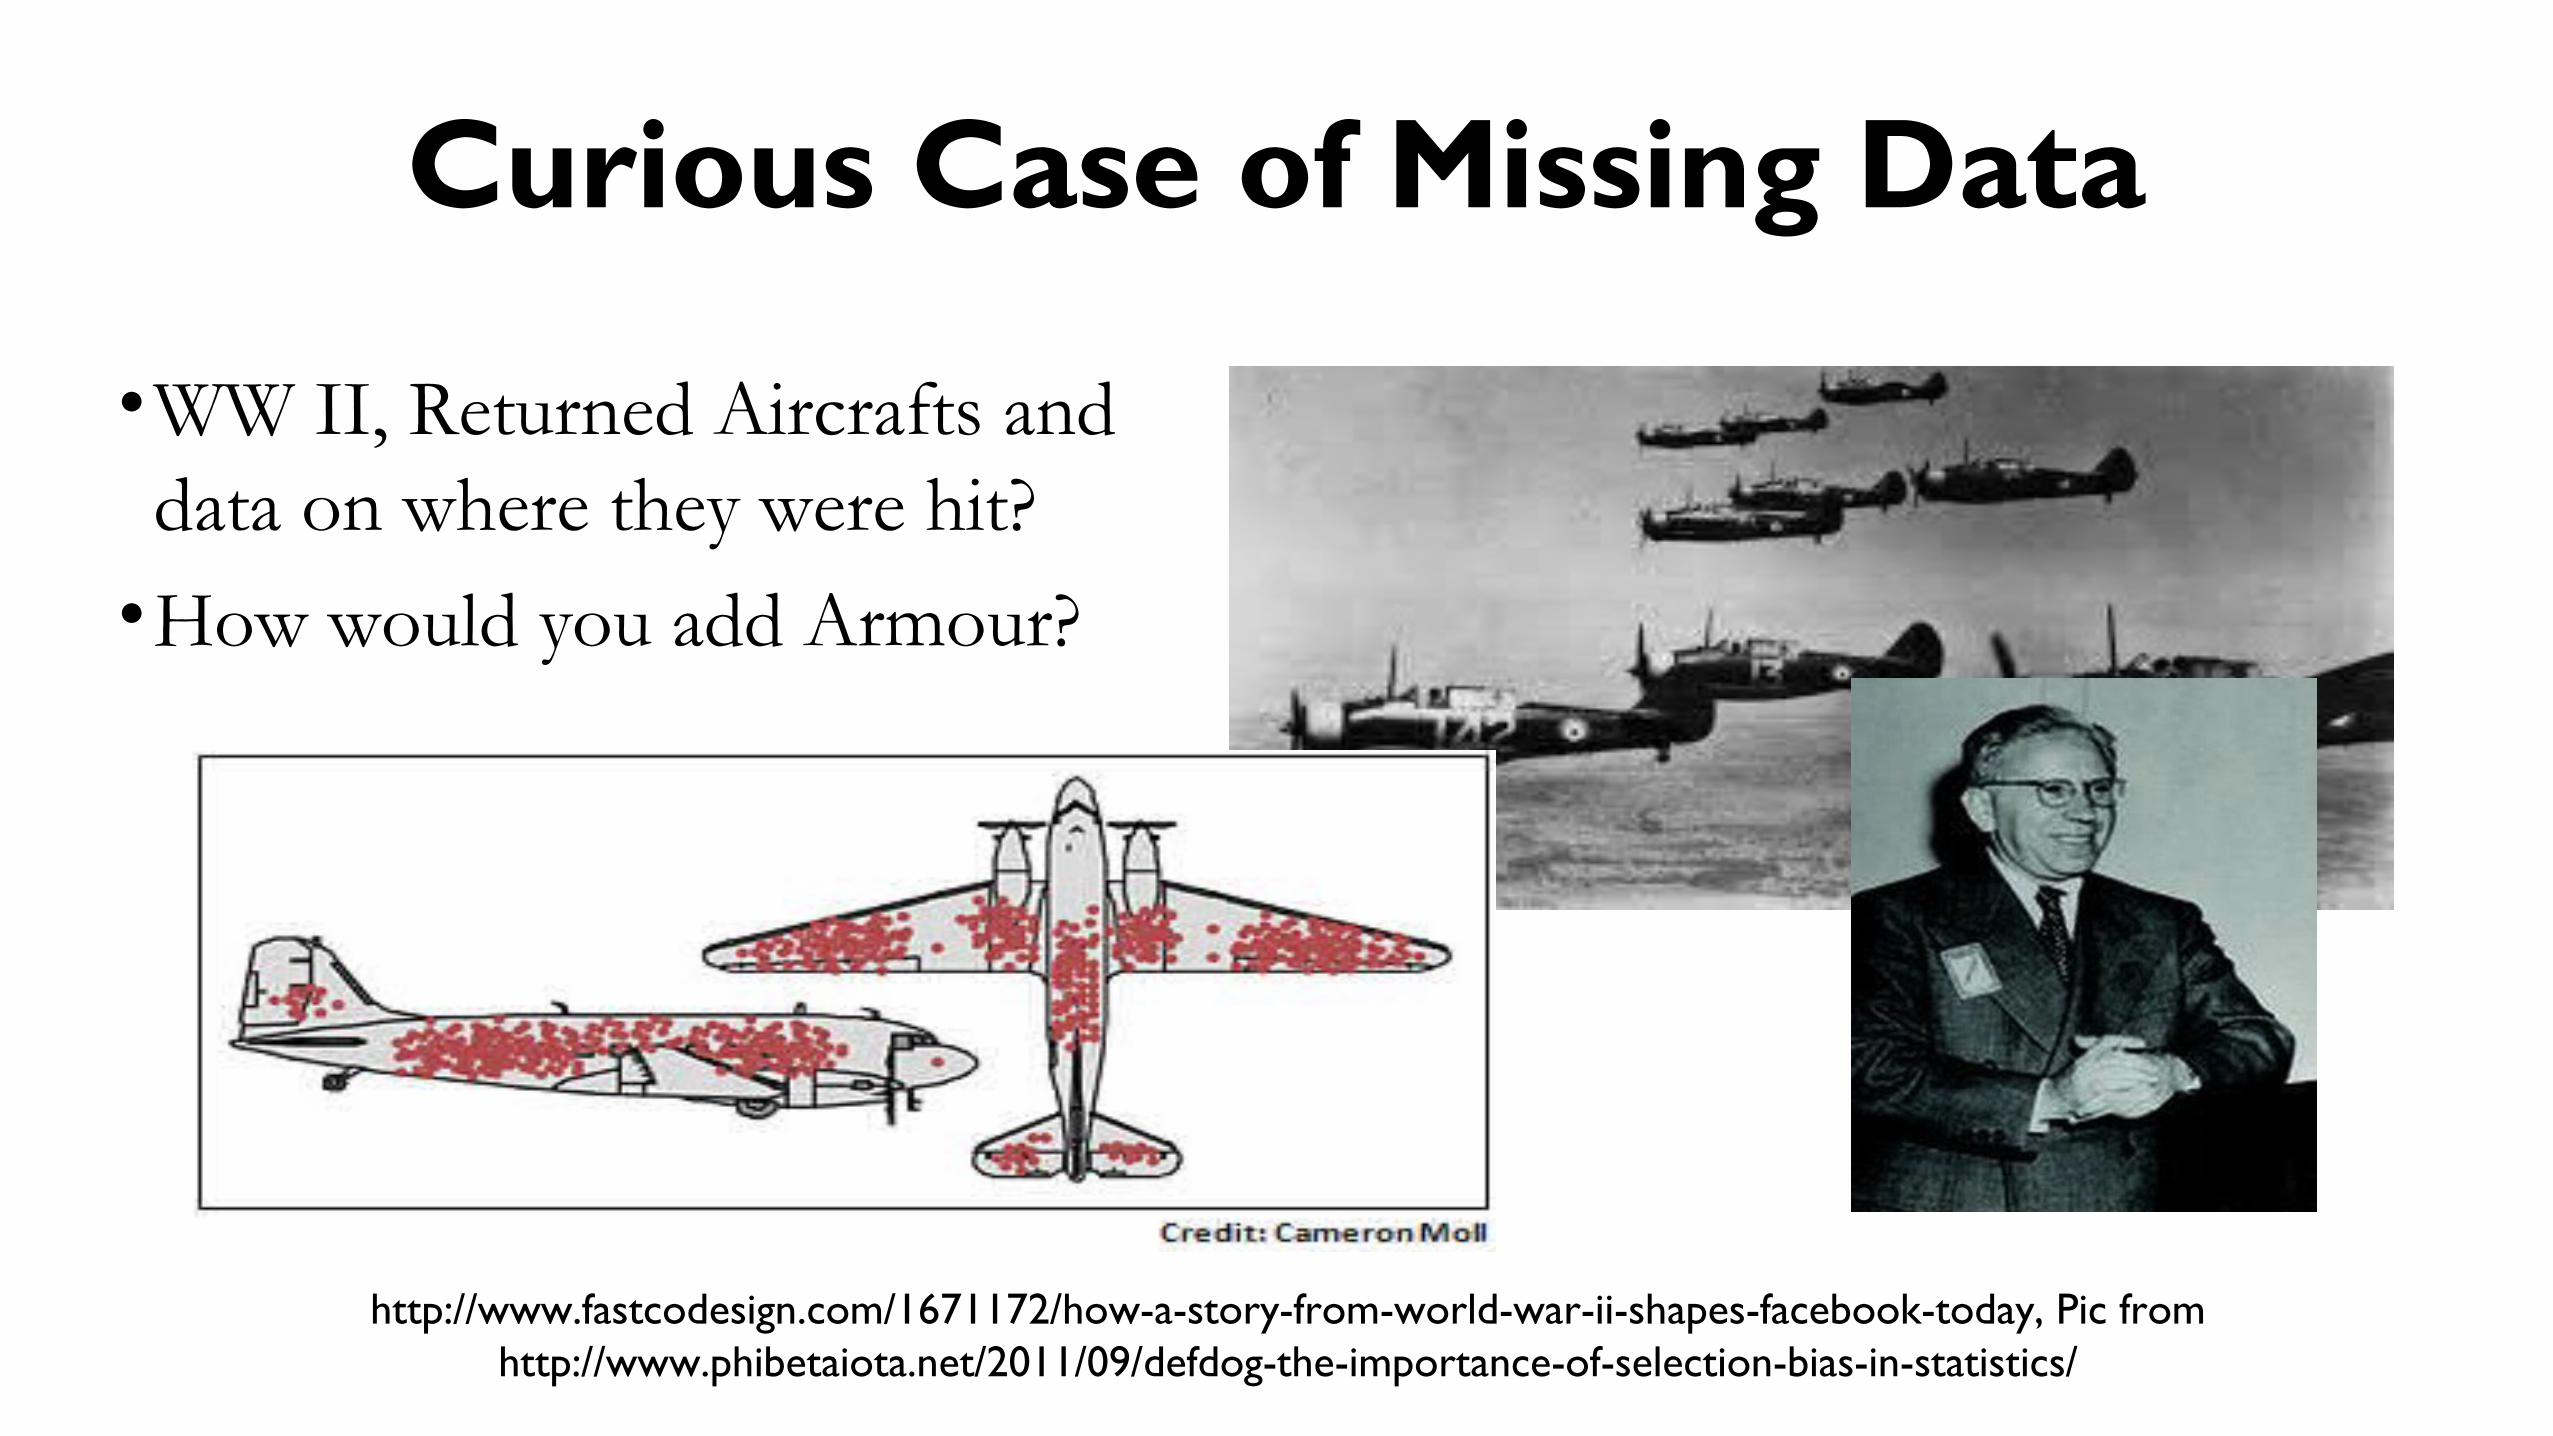
Curious Case of Missing Data
http://www.fastcodesign.com/1671172/how-a-story-from-world-war-ii-shapes-facebook-today, Pic from http://www.phibetaiota.net/2011/09/defdog-the-importance-of-selection-bias-in-statistics/
•WW II, Returned Aircrafts and data on where they were hit?•How would you add Armour?
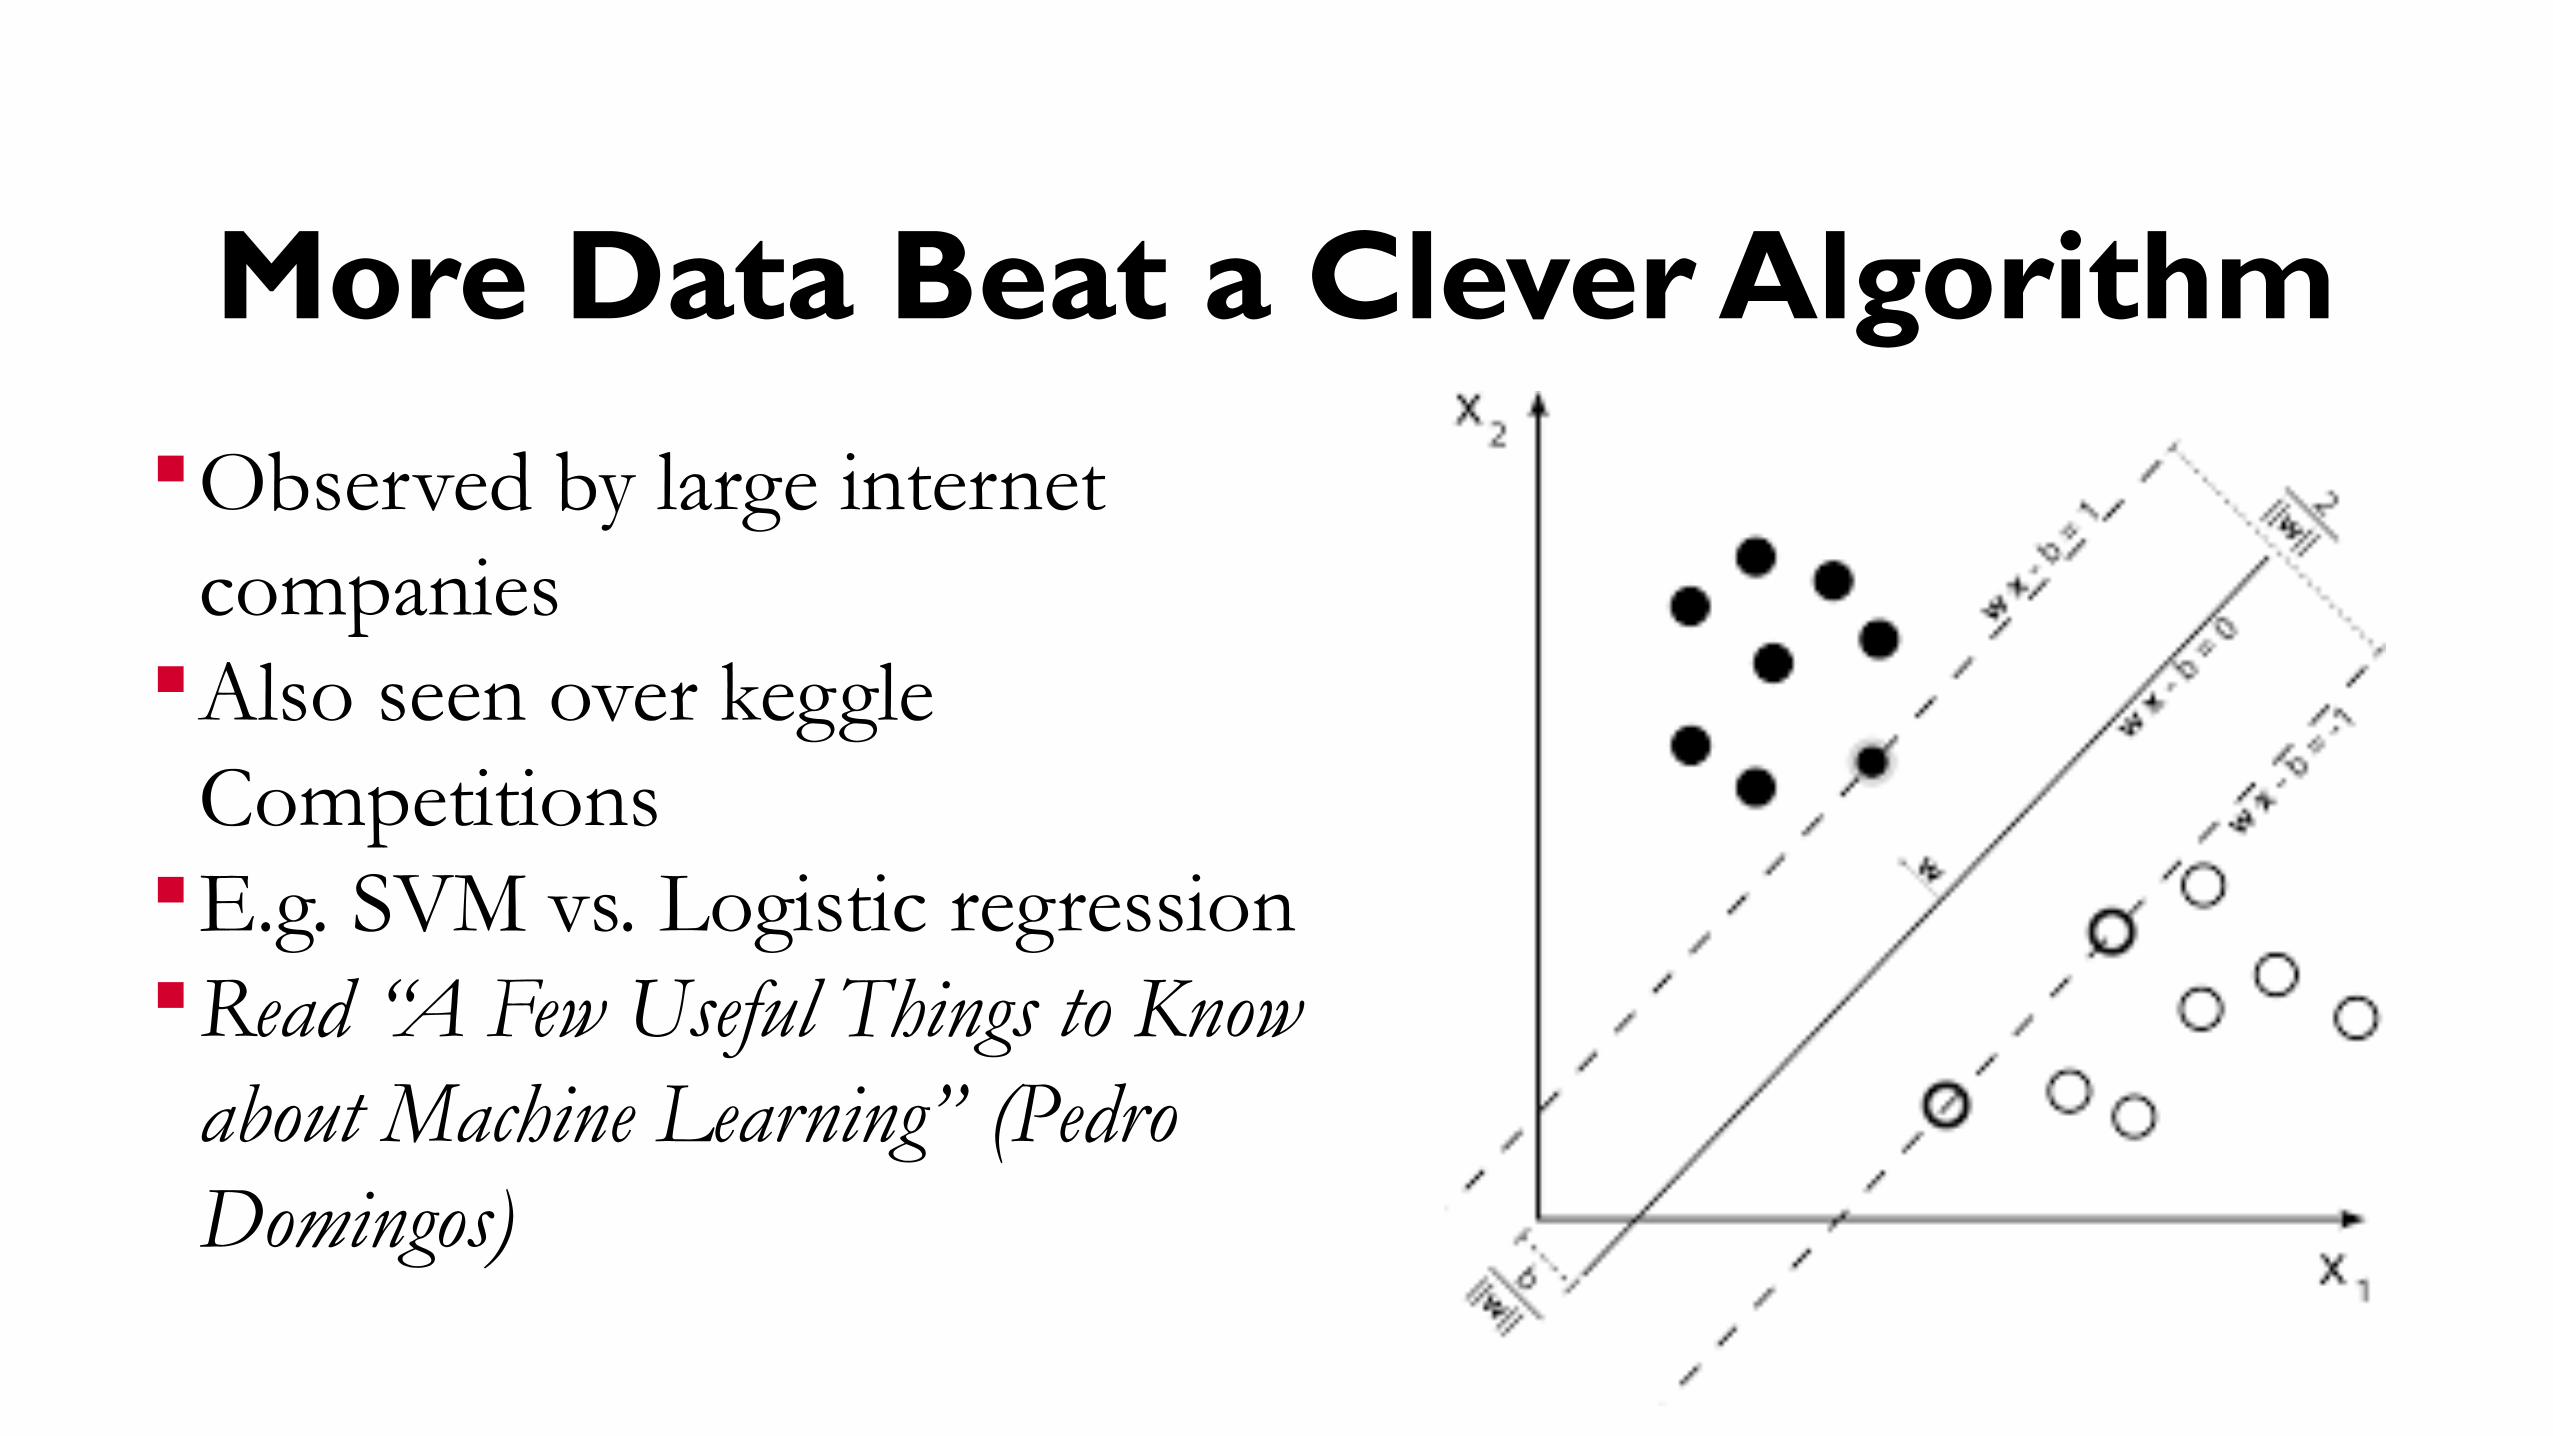
More Data Beat a Clever AlgorithmObserved by large internet
companies Also seen over keggle
Competitions E.g. SVM vs. Logistic regressionRead “A Few Useful Things to Know
about Machine Learning” (Pedro Domingos)
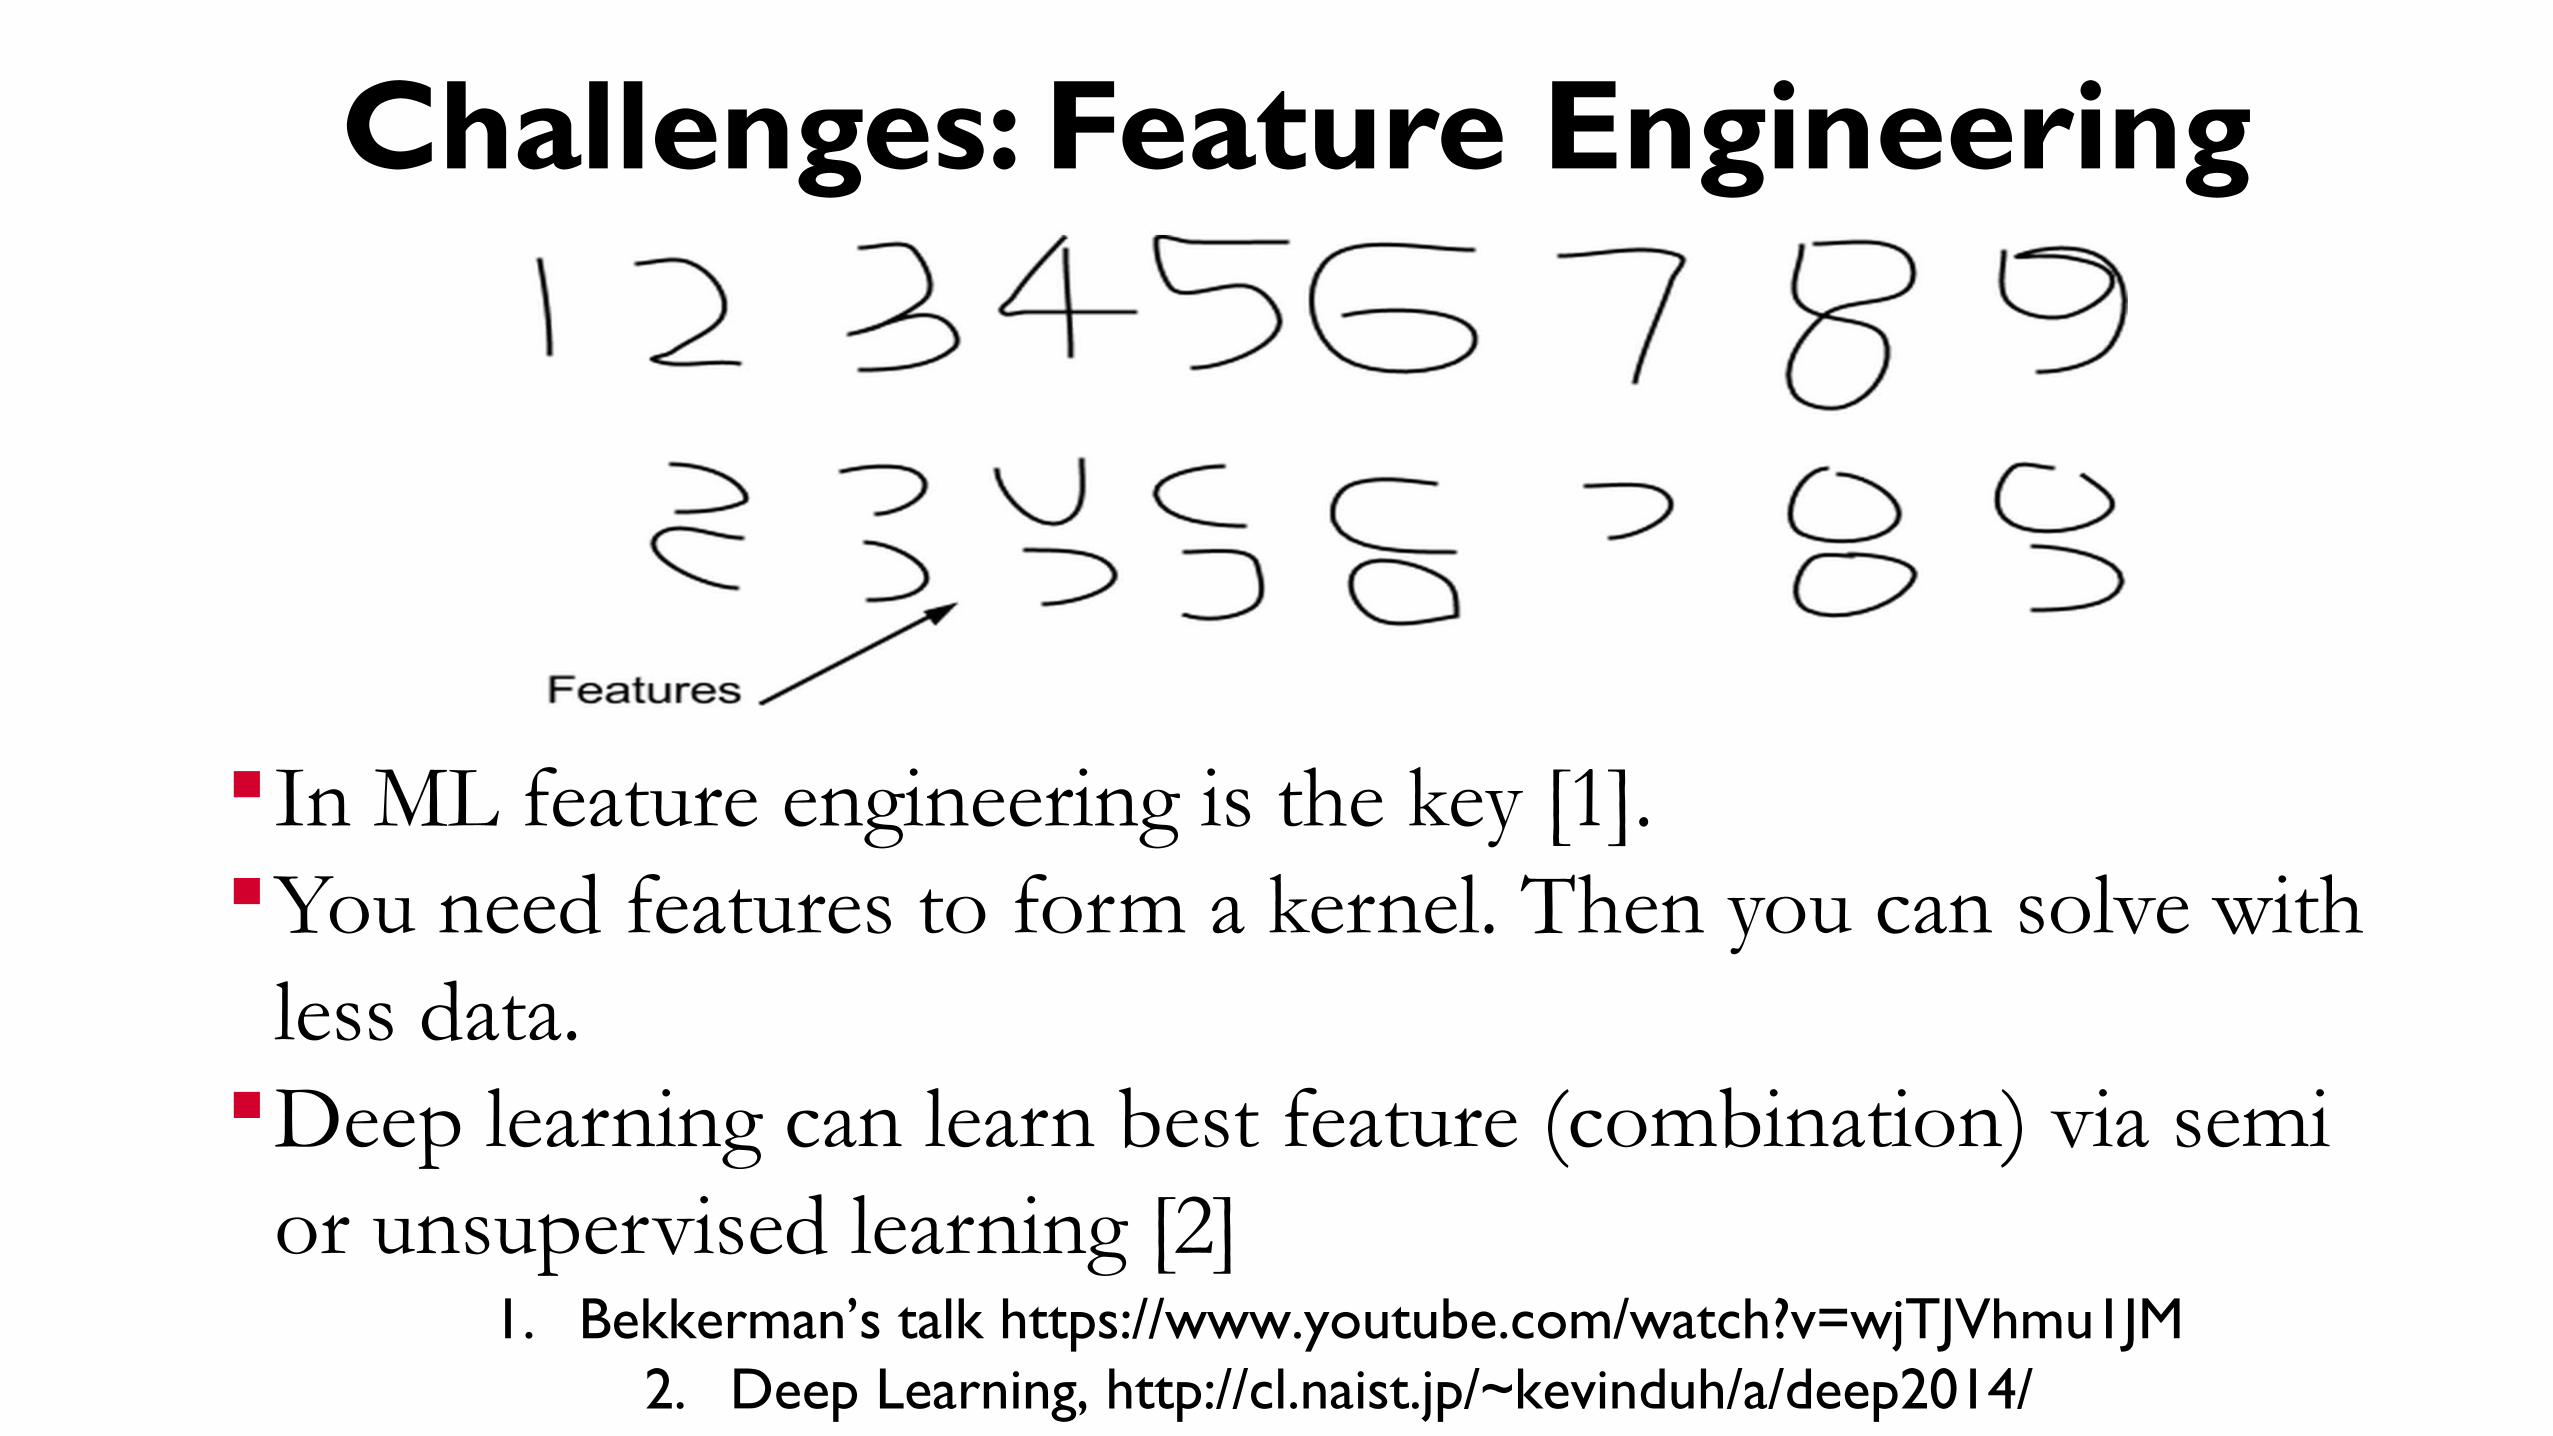
Challenges: Feature Engineering
In ML feature engineering is the key [1]. You need features to form a kernel. Then you can solve with
less data.Deep learning can learn best feature (combination) via semi
or unsupervised learning [2]1. Bekkerman’s talk https://www.youtube.com/watch?v=wjTJVhmu1JM
2. Deep Learning, http://cl.naist.jp/~kevinduh/a/deep2014/
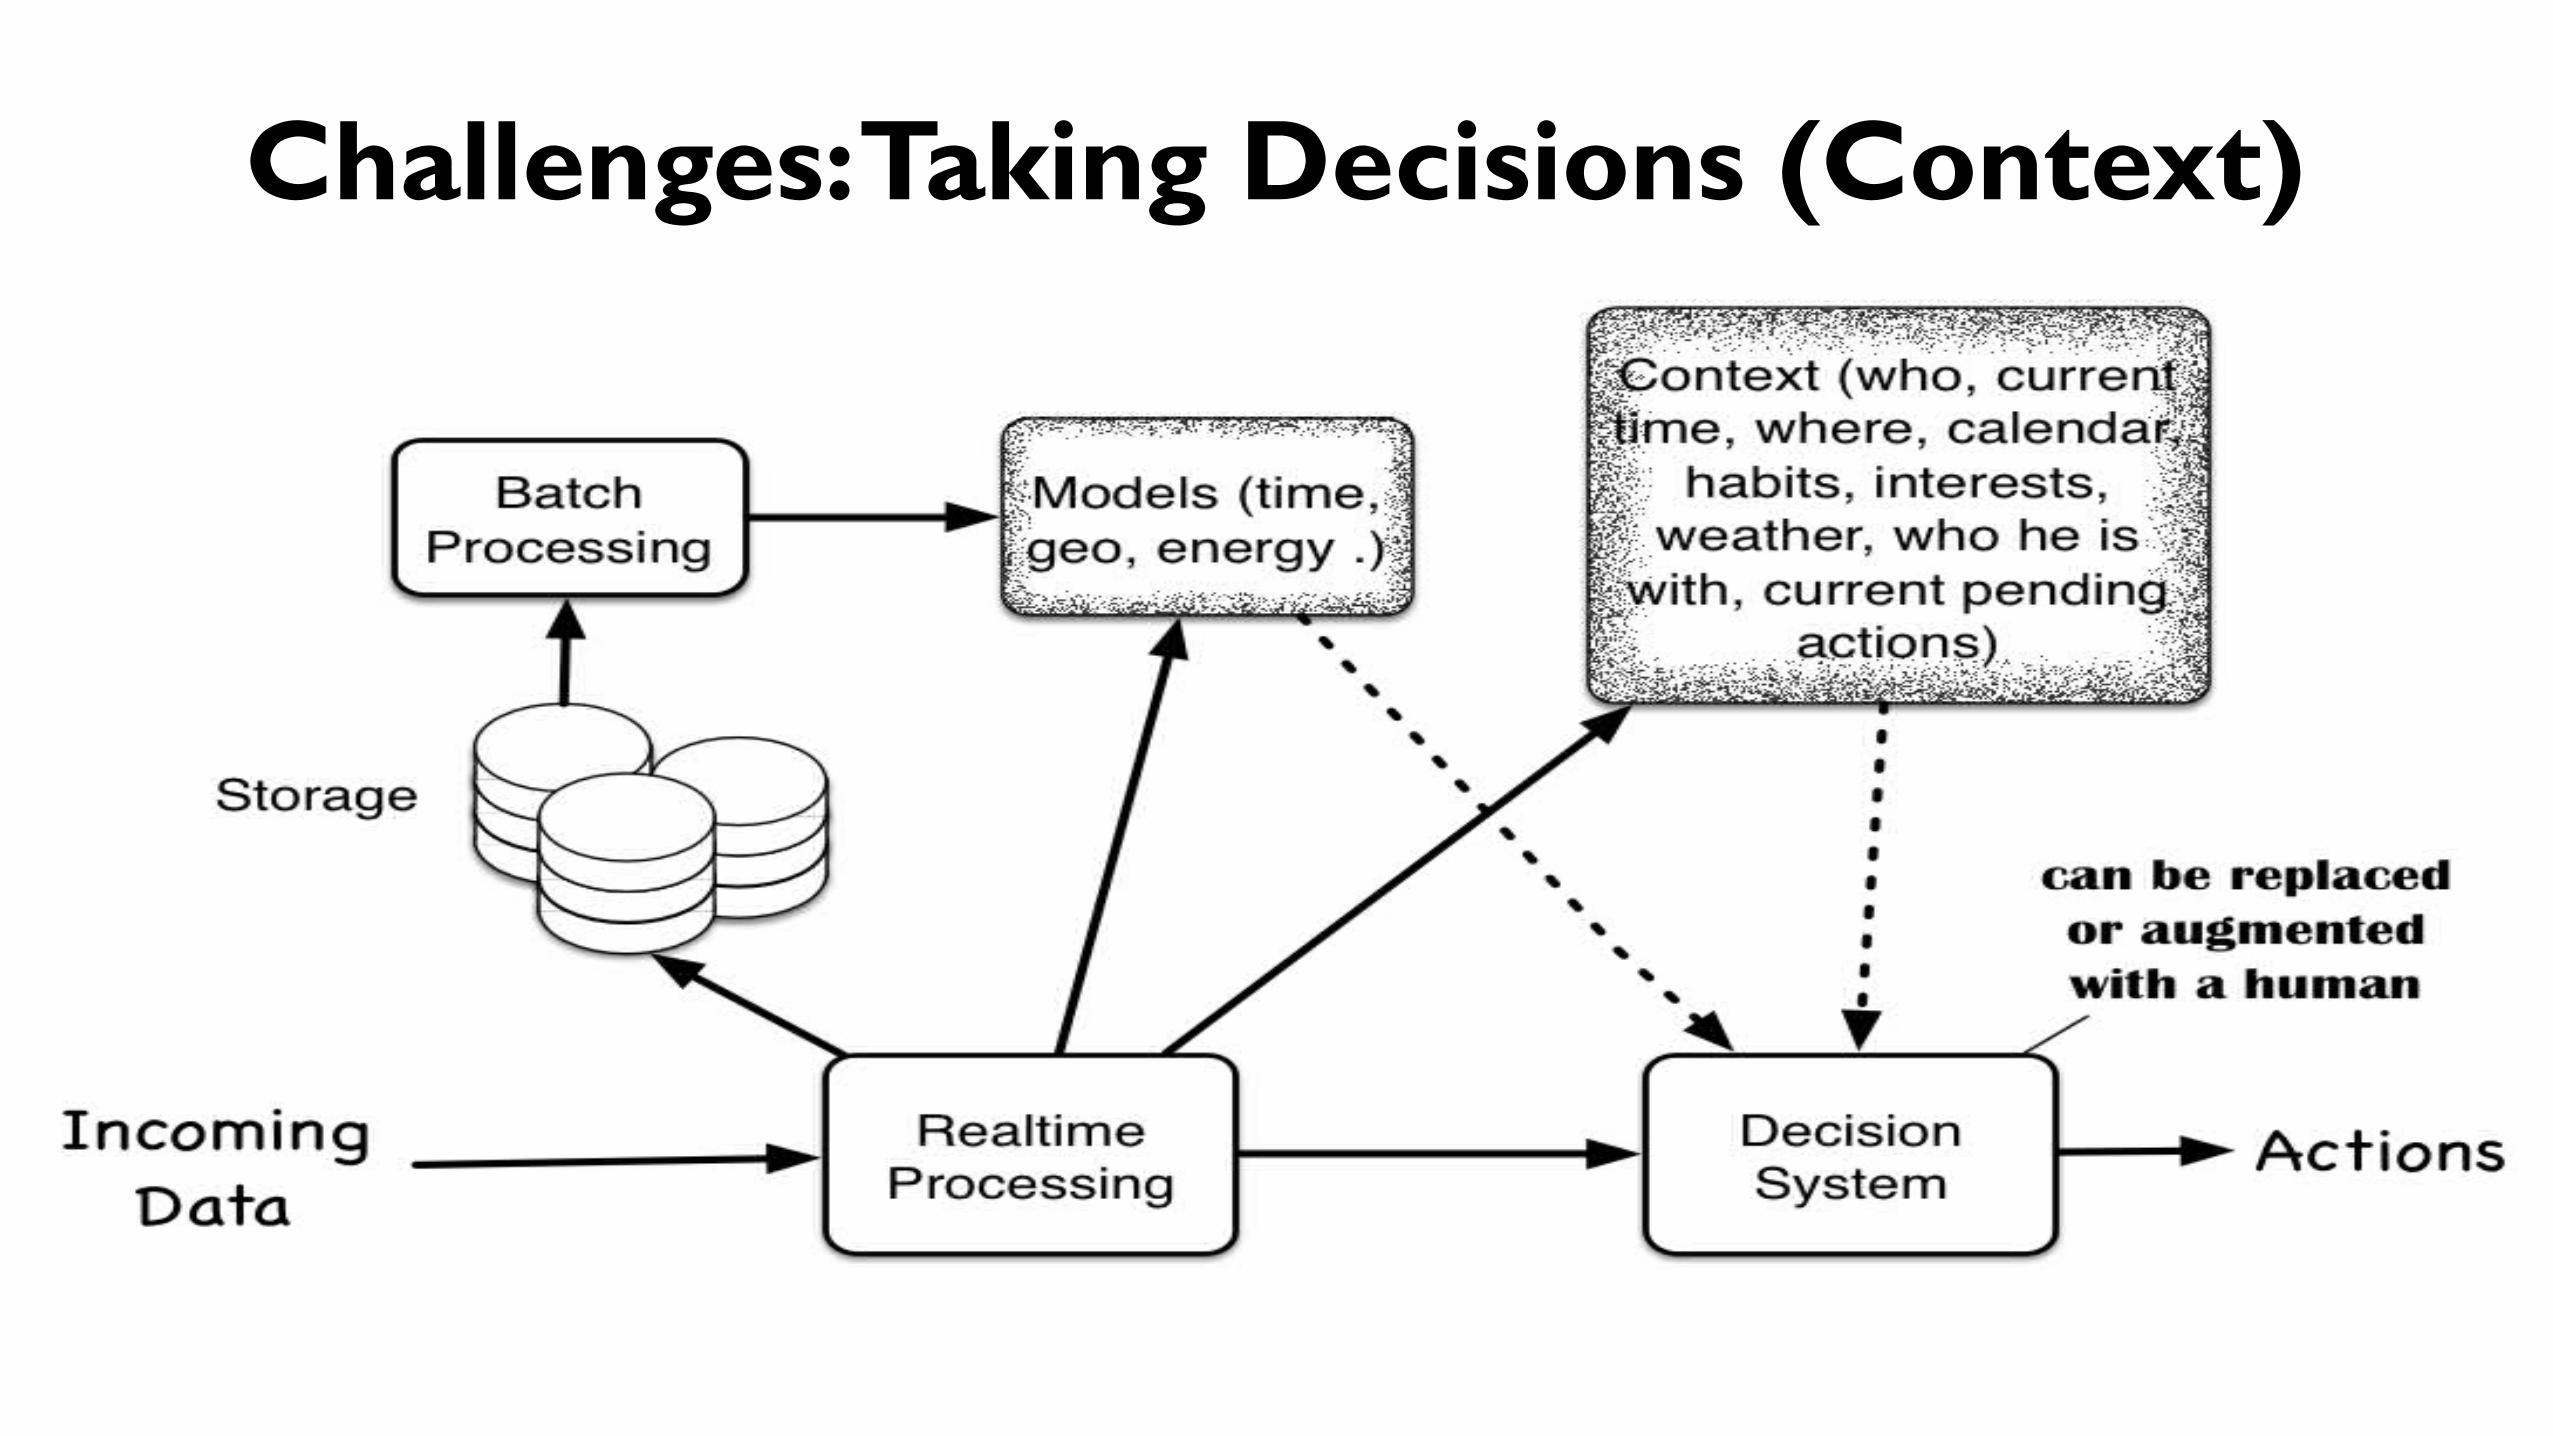
Challenges: Taking Decisions (Context)
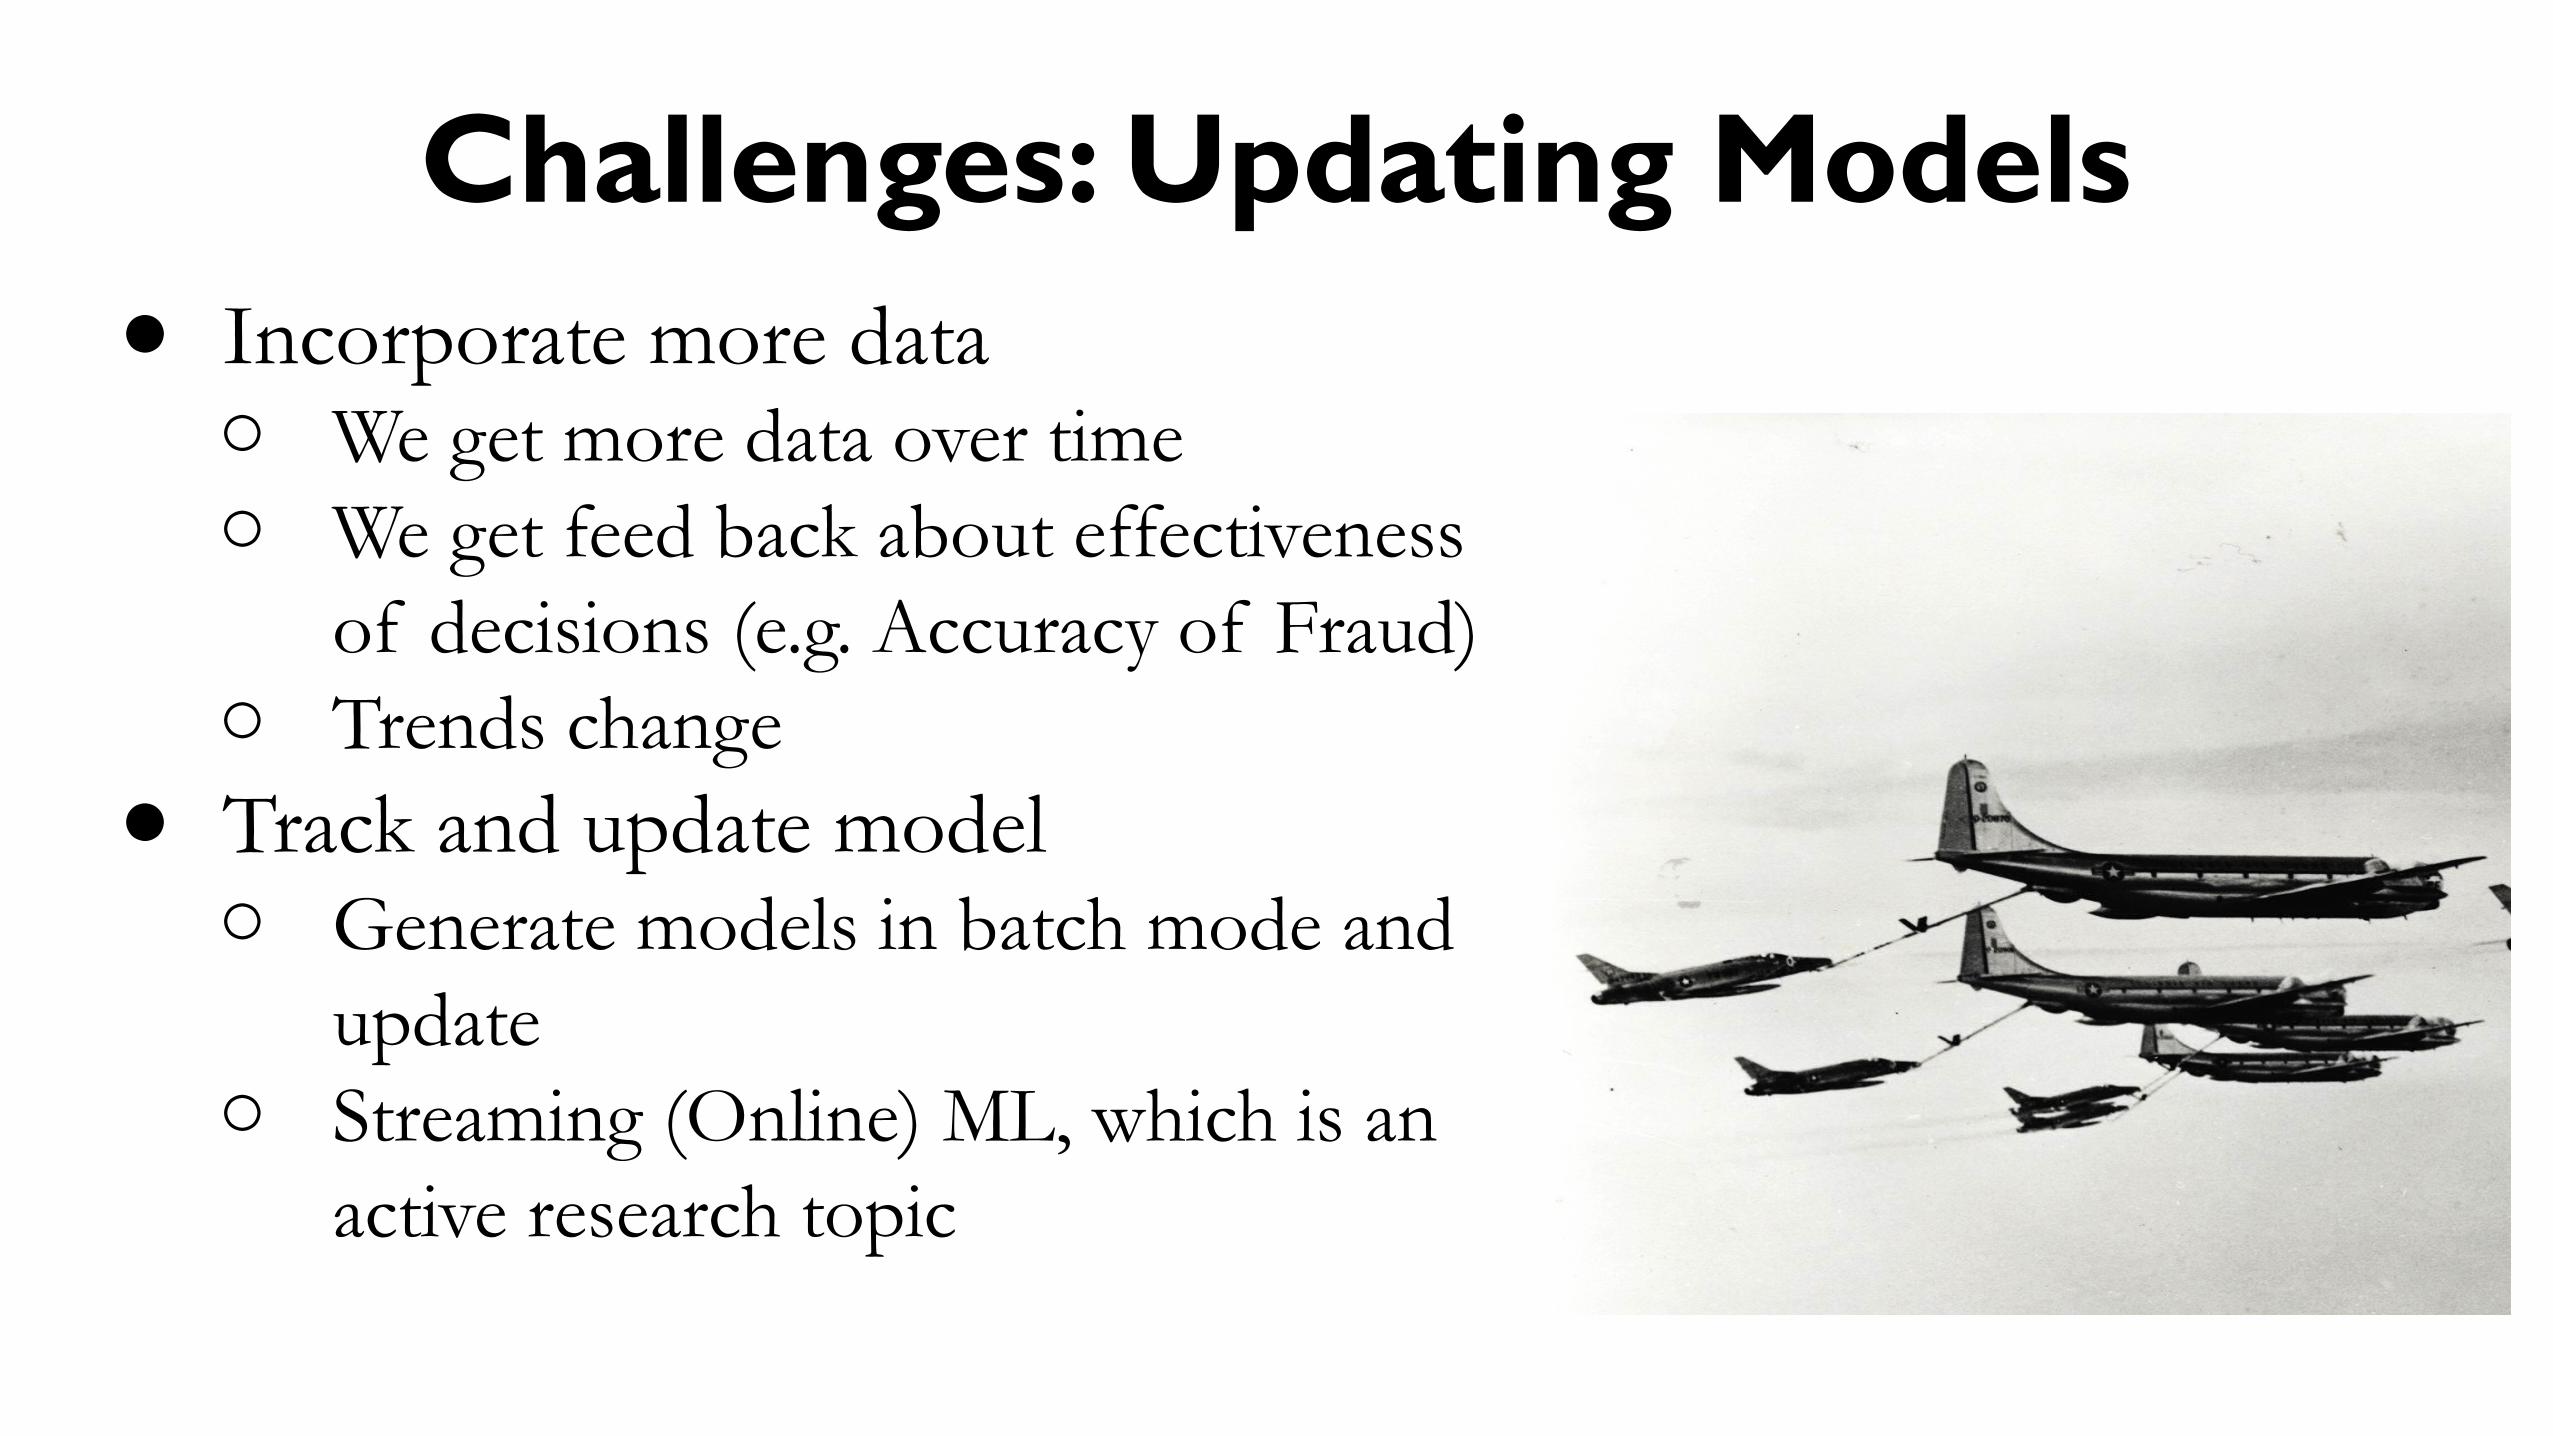
Challenges: Updating Models● Incorporate more data
o We get more data over time o We get feed back about effectiveness
of decisions (e.g. Accuracy of Fraud)o Trends change
● Track and update modelo Generate models in batch mode and
update o Streaming (Online) ML, which is an
active research topic
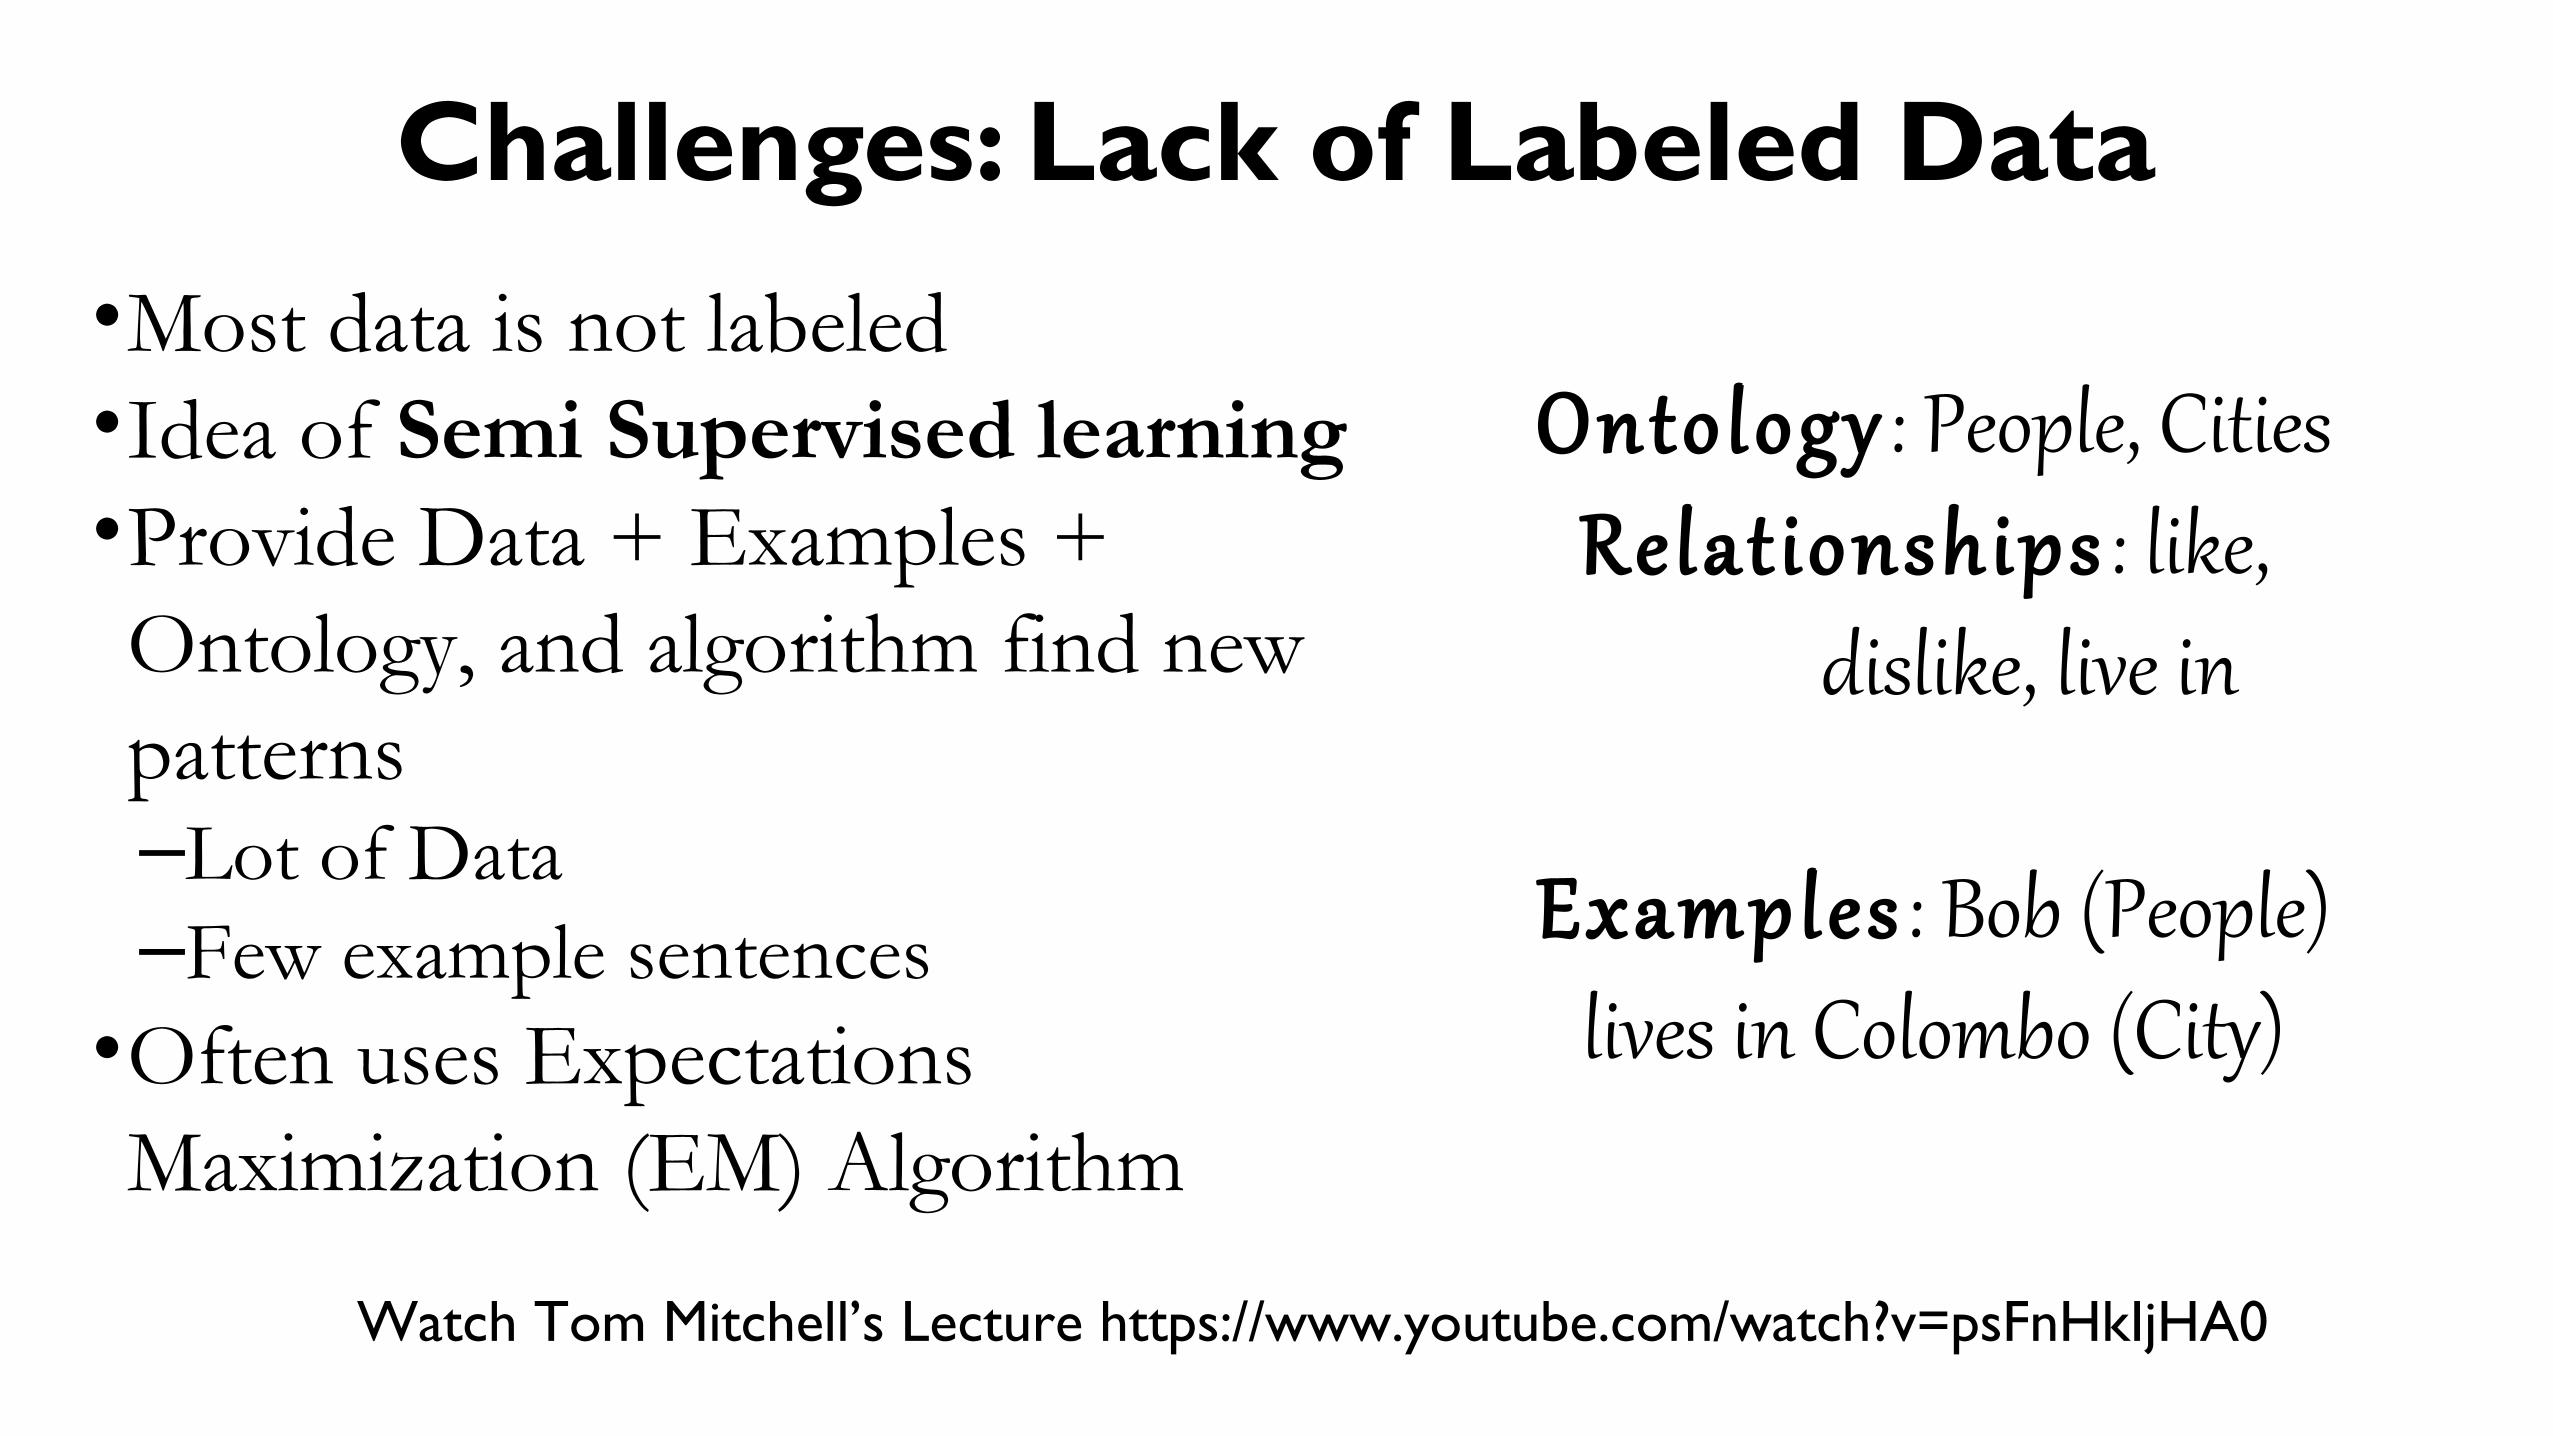
Challenges: Lack of Labeled Data
•Most data is not labeled •Idea of Semi Supervised learning •Provide Data + Examples + Ontology, and algorithm find new patterns –Lot of Data –Few example sentences •Often uses Expectations Maximization (EM) Algorithm
Watch Tom Mitchell’s Lecture https://www.youtube.com/watch?v=psFnHkIjHA0
Ontology : People, CitiesRe lat ionships : like,
dislike, live in
Examples : Bob (People) lives in Colombo (City)
Two TakeawaysDo your data Processing as part of a Bigger system - Think Systems, automate, make a difference - Realtime vs Batch - Use tools ( Do not reinvent the wheel)
Think how dynamics are changing (Uncontrolled experiments, lot of Data) - Do not be a data Pessimist - However, do not do stupid things either

Questions?