Embed Size (px)
Citation preview
Data Science,
Data Curation,
Human-Data Interaction
Bill Howe, Ph.D.Associate Professor, Information School
Adjunct Associate Professor, Computer Science & Engineering
Associate Director and Senior Data Science Fellow, eScience Institute
7/26/2016 Bill Howe, UW 1
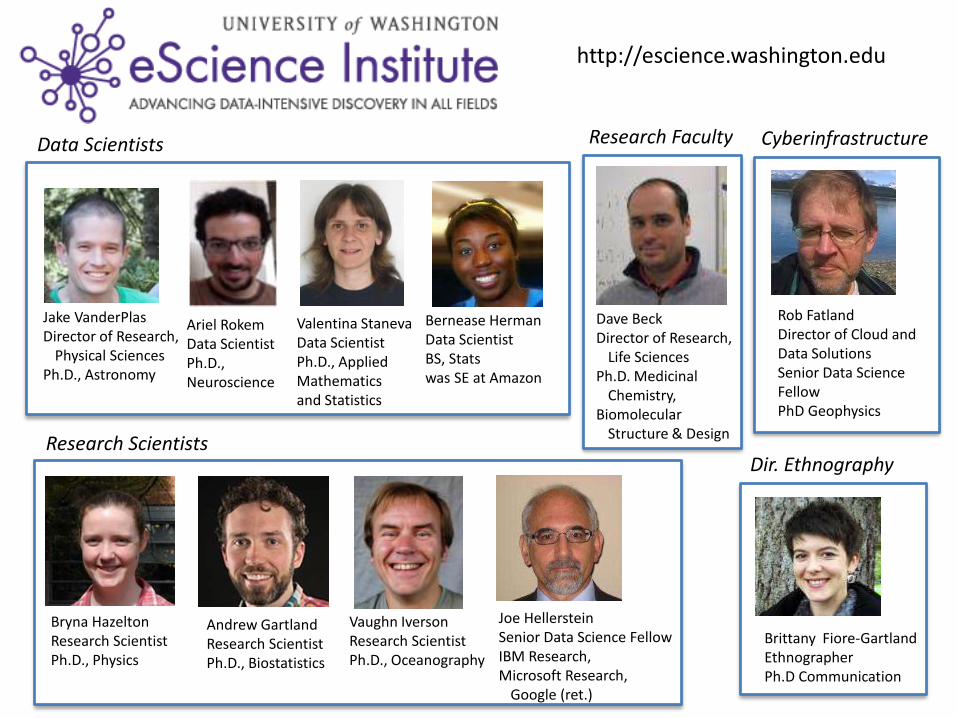
Dave BeckDirector of Research,
Life SciencesPh.D. Medicinal
Chemistry, Biomolecular
Structure & Design
Jake VanderPlasDirector of Research,
Physical SciencesPh.D., Astronomy
Valentina StanevaData ScientistPh.D., Applied Mathematics and Statistics
Ariel RokemData ScientistPh.D., Neuroscience
Andrew GartlandResearch ScientistPh.D., Biostatistics
Bryna HazeltonResearch ScientistPh.D., Physics
Bernease HermanData ScientistBS, Statswas SE at Amazon
Vaughn IversonResearch ScientistPh.D., Oceanography
Rob FatlandDirector of Cloud and Data SolutionsSenior Data Science FellowPhD Geophysics
Joe HellersteinSenior Data Science FellowIBM Research, Microsoft Research,
Google (ret.)
Data Scientists
Research Scientists
Research Faculty Cyberinfrastructure
Brittany Fiore-GartlandEthnographerPh.D Communication
Dir. Ethnography
http://escience.washington.edu
Time
Am
ou
nt
of
data
in
th
e w
orl
d
Time
Pro
cessin
g p
ow
er
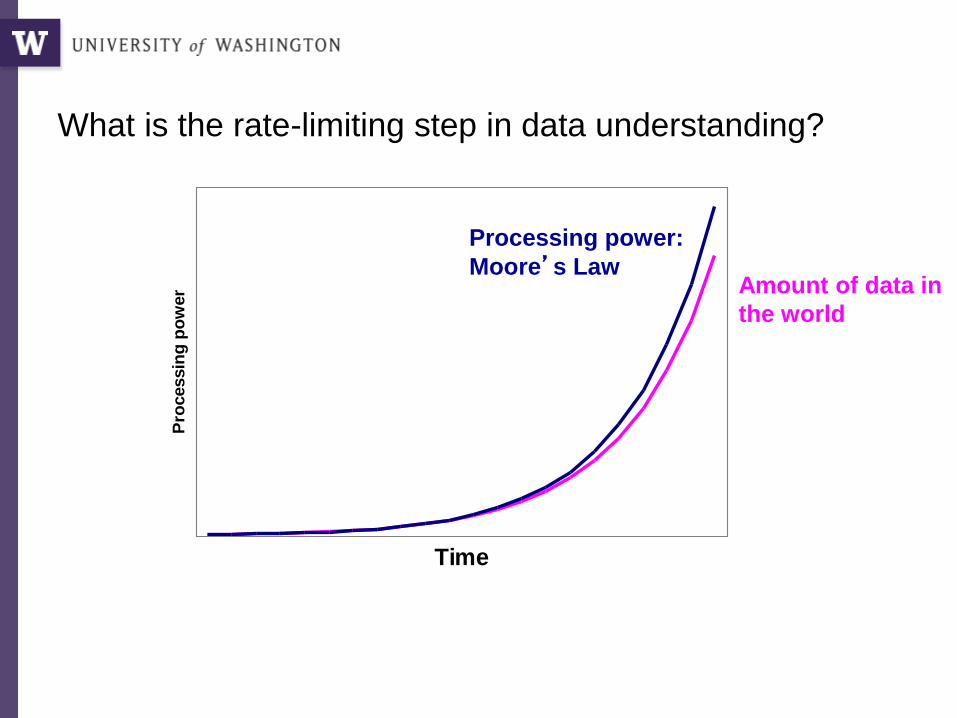
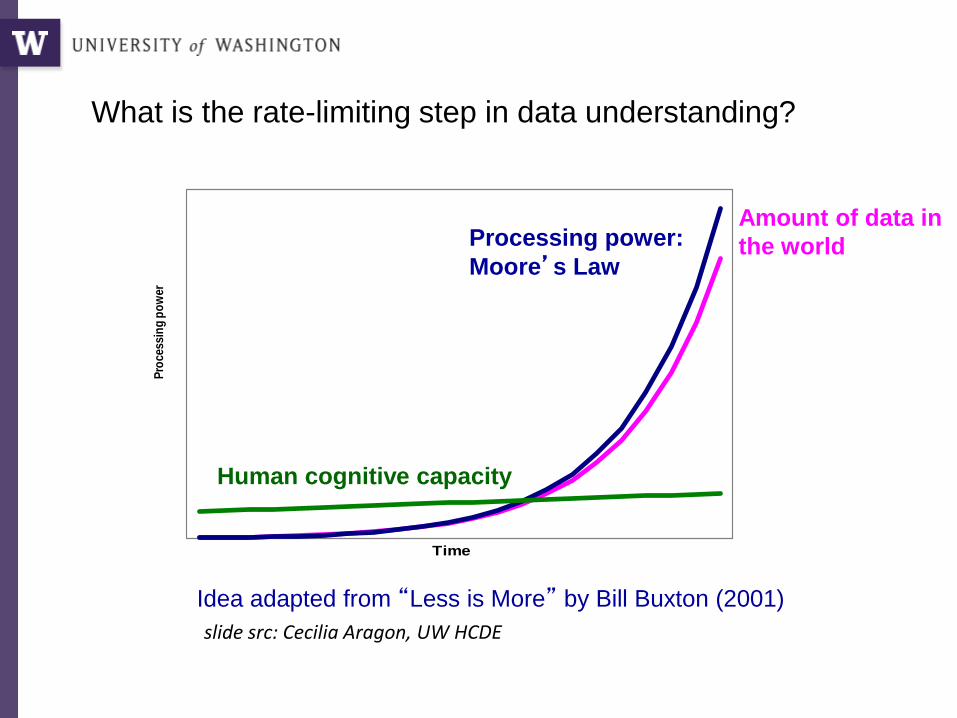
What is the rate-limiting step in data understanding?
Processing power:
Moore’s LawAmount of data in
the world

Pro
cess
ing
po
wer
Time
What is the rate-limiting step in data understanding?
Processing power:
Moore’s Law
Human cognitive capacity
Idea adapted from “Less is More” by Bill Buxton (2001)
Amount of data in
the world
slide src: Cecilia Aragon, UW HCDE

How much time do you spend “handling data” as opposed to “doing science”?
Mode answer: “90%”
7/26/2016 Bill Howe, UW 5
7/26/2016 Bill Howe, UW 8
Goal: Understand and optimize how people use and share quantitative information
“Human-Data Interaction”
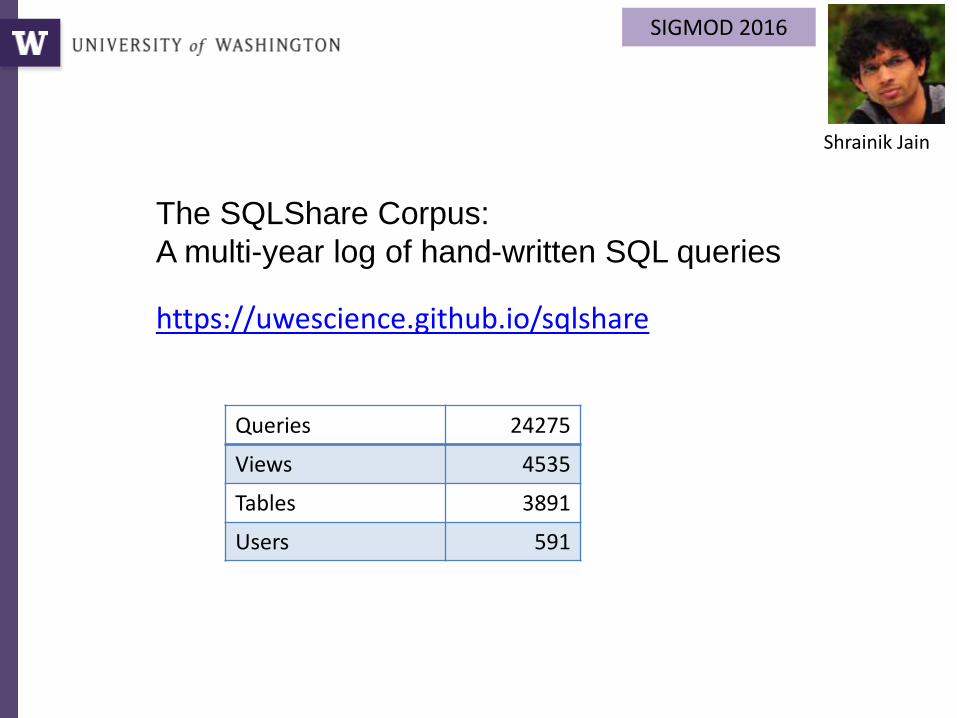
The SQLShare Corpus:
A multi-year log of hand-written SQL queries
Queries 24275
Views 4535
Tables 3891
Users 591
SIGMOD 2016
Shrainik Jain
https://uwescience.github.io/sqlshare
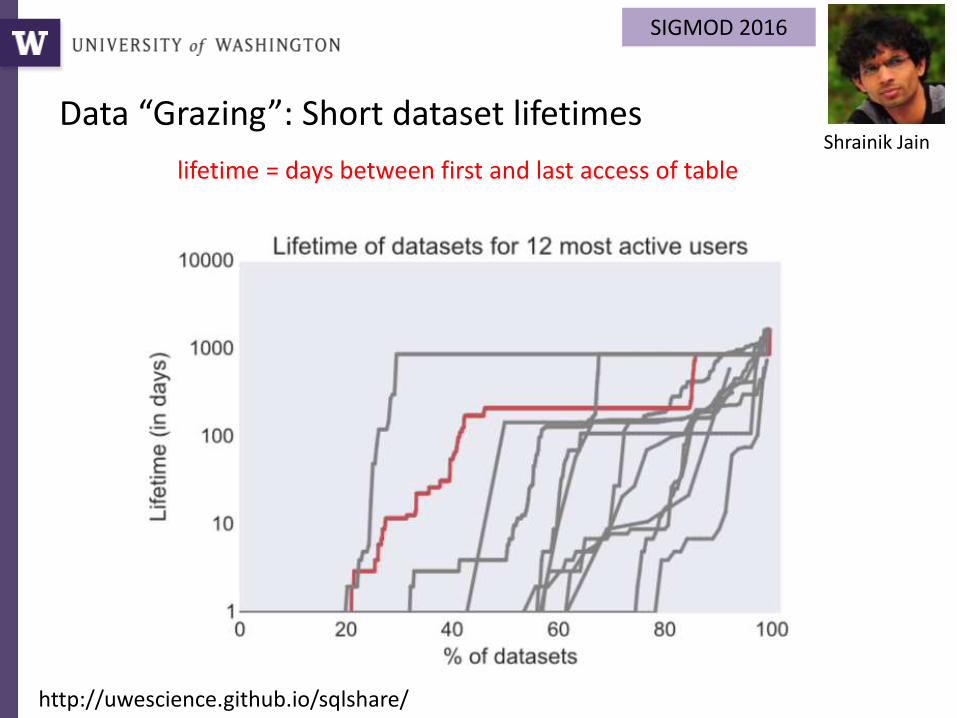
lifetime = days between first and last access of table
SIGMOD 2016
Shrainik Jain
http://uwescience.github.io/sqlshare/
Data “Grazing”: Short dataset lifetimes
MYRIA: POLYSTORE MGMT
Human-Data Interaction
7/26/2016 Bill Howe, UW 18
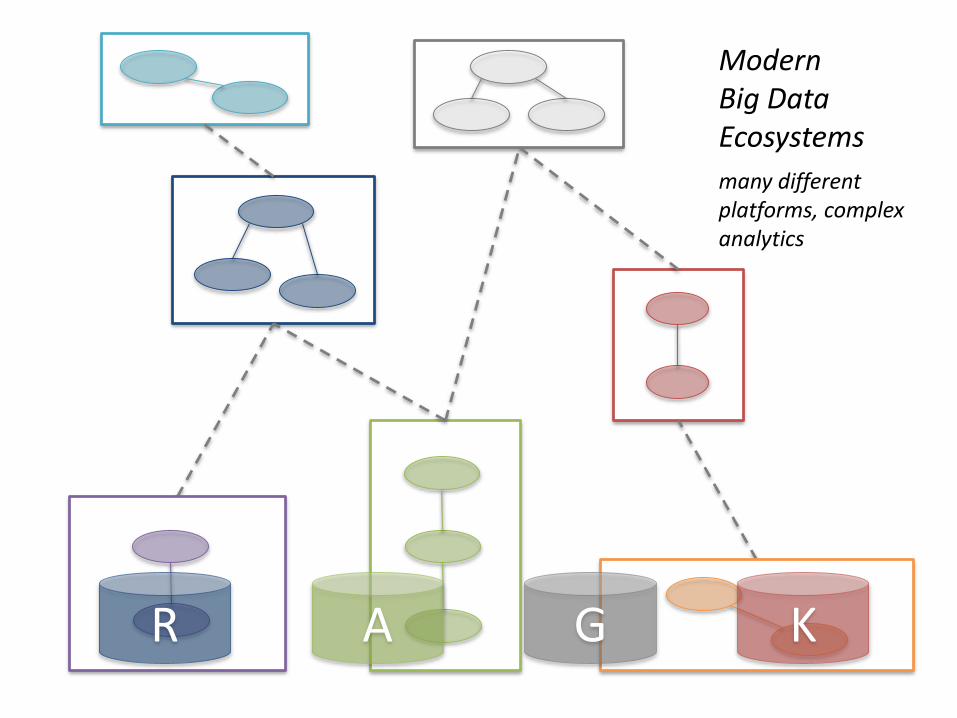
R A G K
Modern Big Data Ecosystems
many different platforms, complex analytics
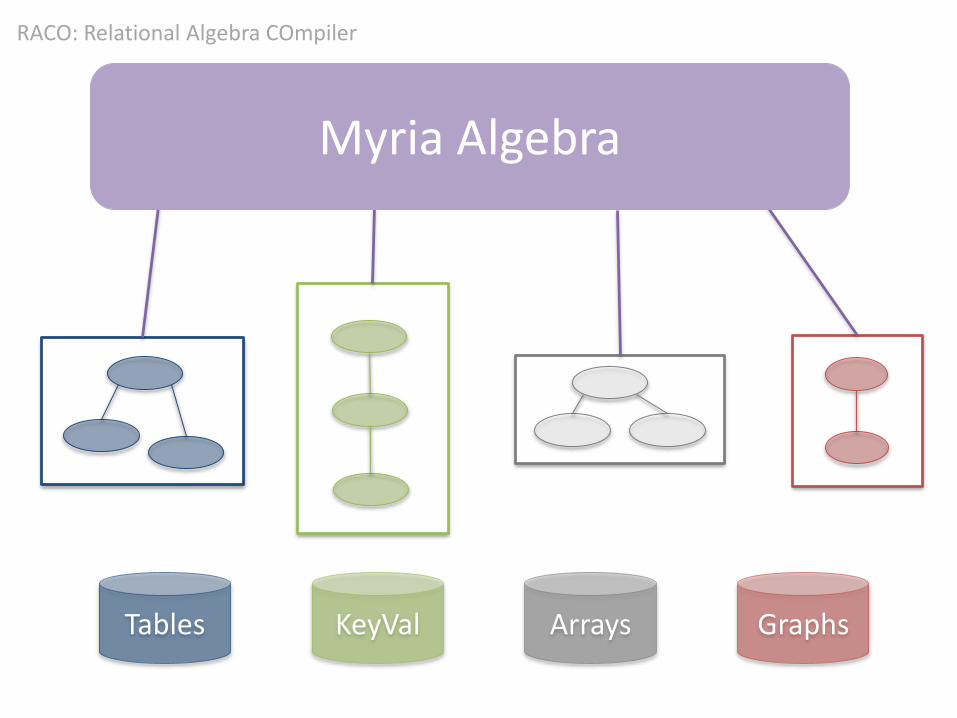
Myria Algebra
Tables KeyVal Arrays Graphs
RACO: Relational Algebra COmpiler
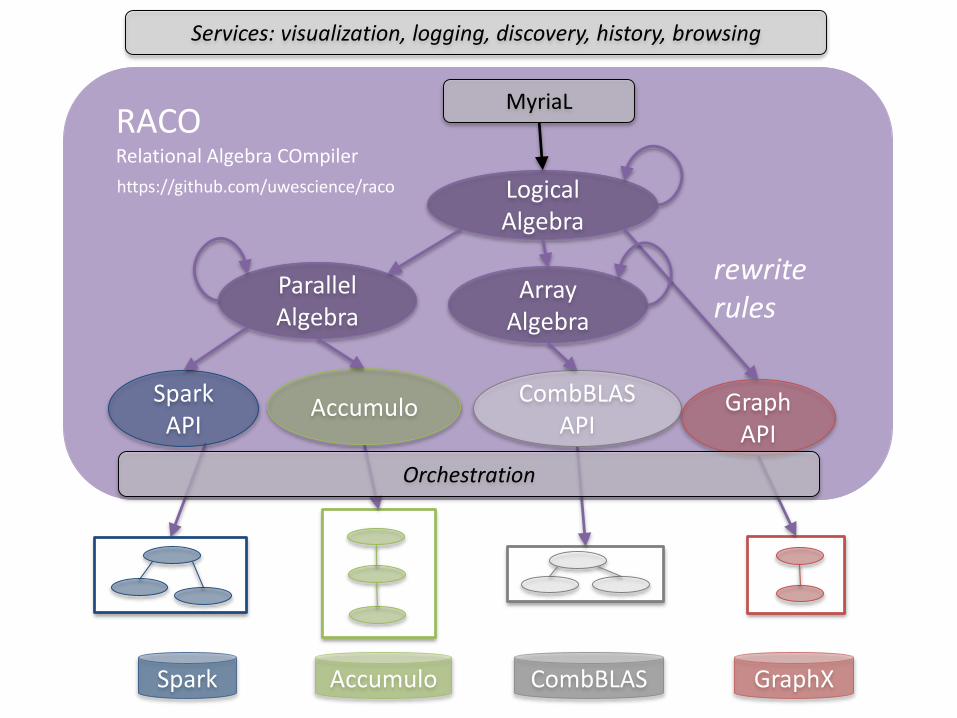
Spark Accumulo CombBLAS GraphX
Parallel Algebra
Logical Algebra
RACORelational Algebra COmpiler
CombBLAS API
Spark API
Accumulo Graph API
rewrite rules
Array Algebra
MyriaL
Services: visualization, logging, discovery, history, browsing
Orchestration
https://github.com/uwescience/raco
7/26/2016 Bill Howe, UW 22
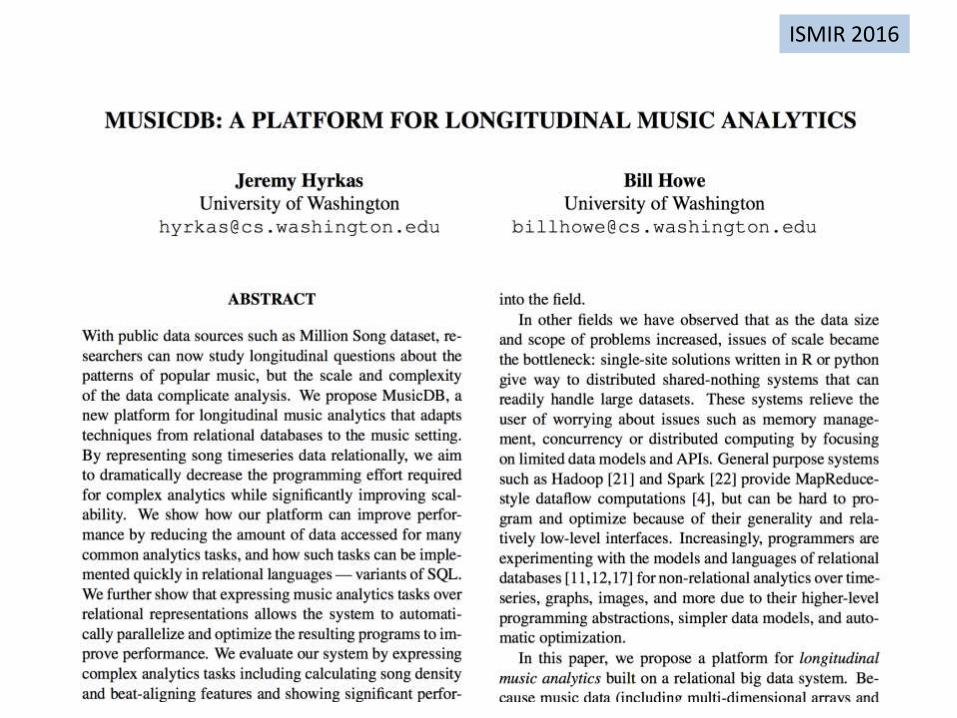
ISMIR 2016
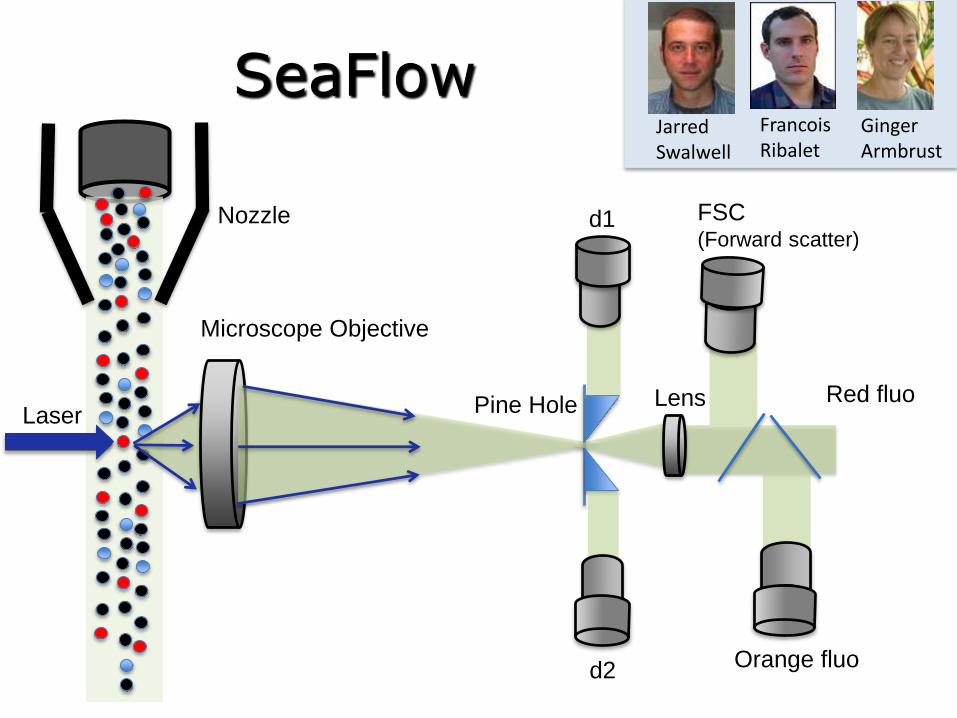
Laser
Microscope Objective
Pine Hole Lens
Nozzle d1
d2
FSC (Forward scatter)
Orange fluo
Red fluo
SeaFlowFrancois Ribalet
Jarred Swalwell
Ginger Armbrust
7/26/2016 Bill Howe, UW 25
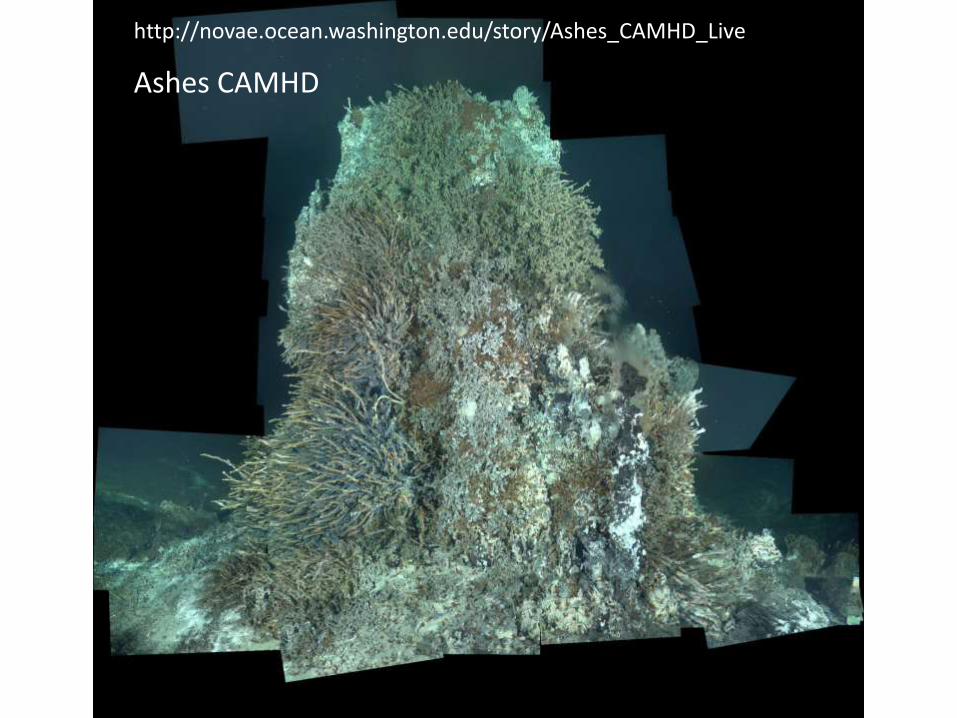
Ashes CAMHD
http://novae.ocean.washington.edu/story/Ashes_CAMHD_Live
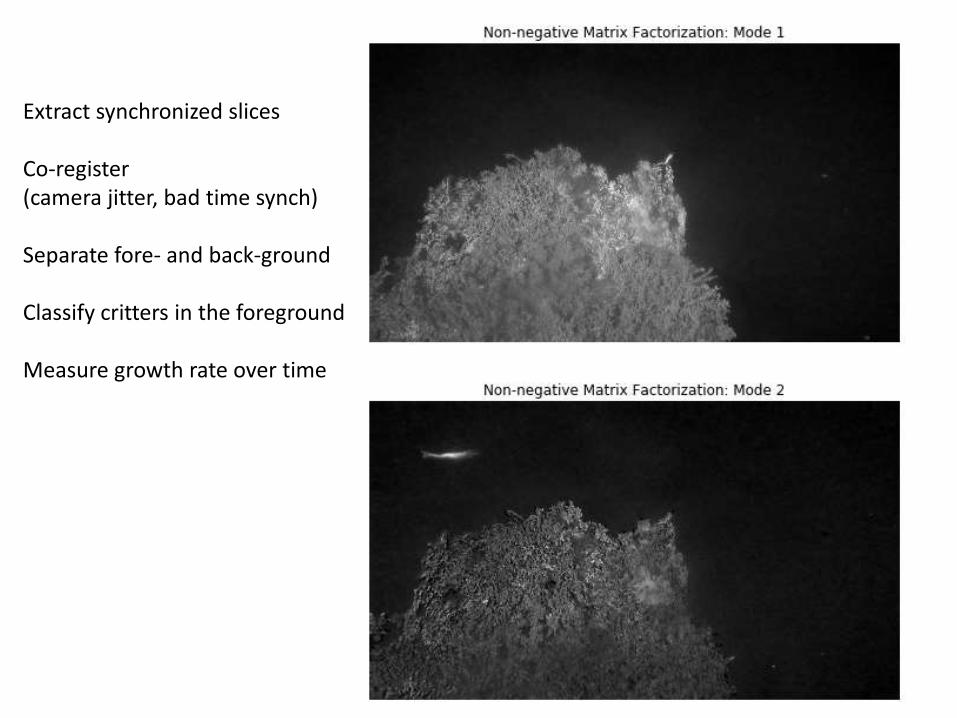
Extract synchronized slices
Co-register (camera jitter, bad time synch)
Separate fore- and back-ground
Classify critters in the foreground
Measure growth rate over time
“DEEP” CURATION
Human-Data Interaction
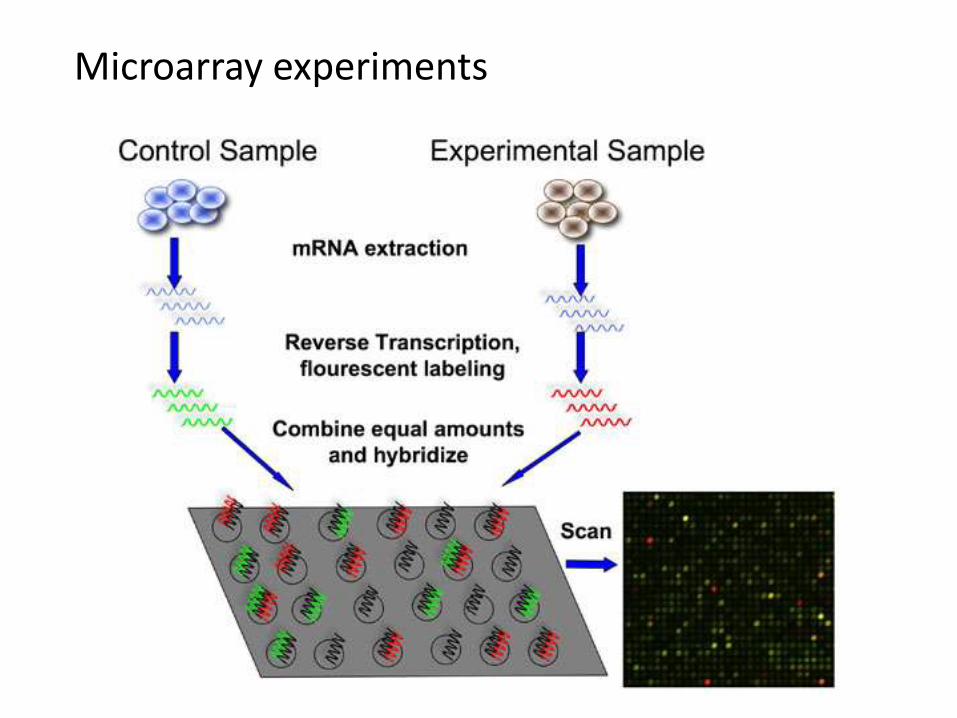
Microarray experiments
7/26/2016 Bill Howe, UW 33
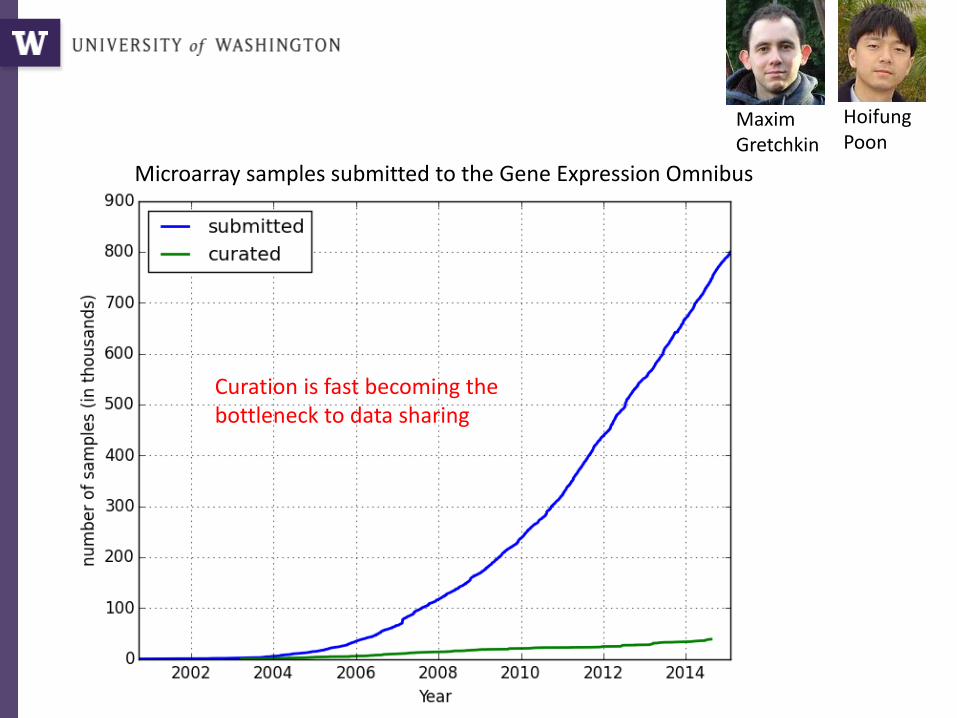
Microarray samples submitted to the Gene Expression Omnibus
Curation is fast becoming the bottleneck to data sharing
Maxim Gretchkin
Hoifung Poon
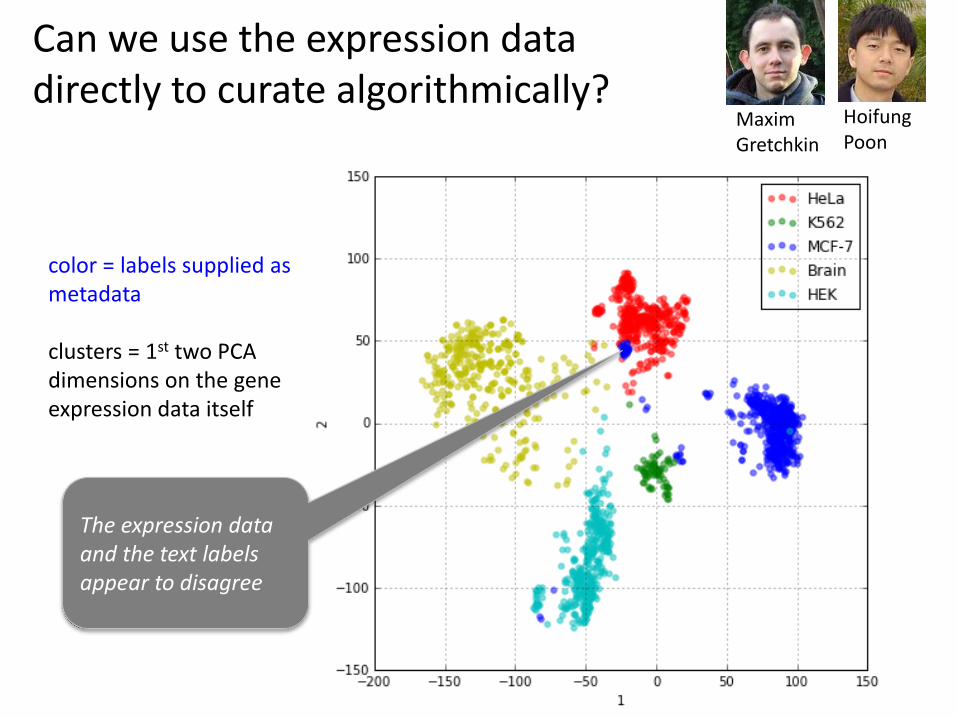
color = labels supplied as metadata
clusters = 1st two PCA dimensions on the gene expression data itself
Can we use the expression data directly to curate algorithmically?
Maxim Gretchkin
Hoifung Poon
The expression data and the text labels appear to disagree
Maxim Gretchkin
Hoifung Poon
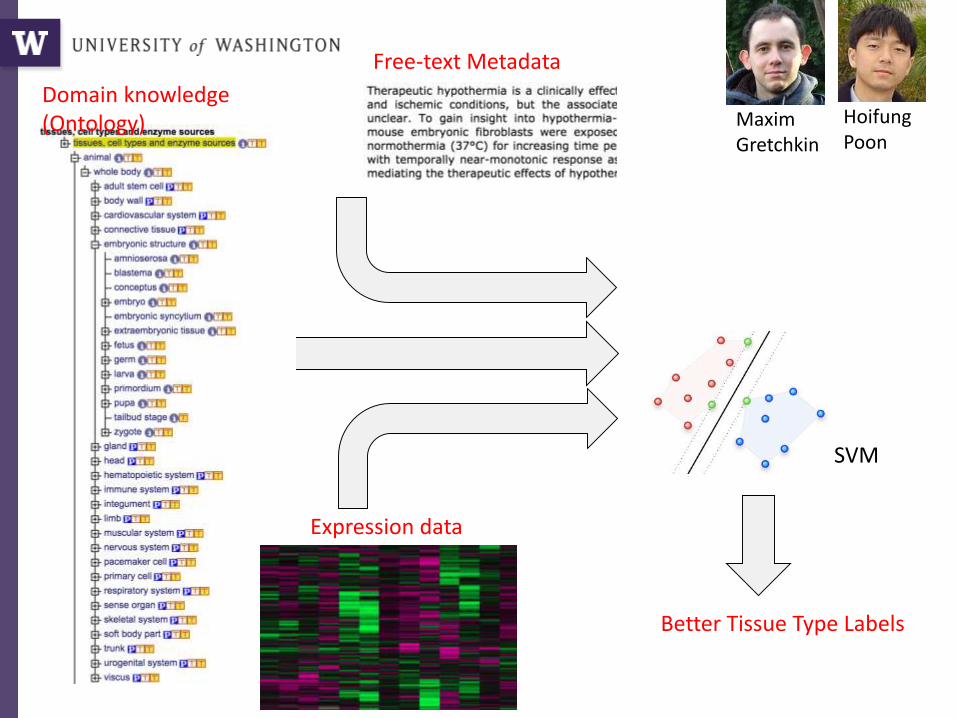
Better Tissue Type Labels
Domain knowledge (Ontology)
Expression data
Free-text Metadata
2 Deep Networkstext
expr
SVM
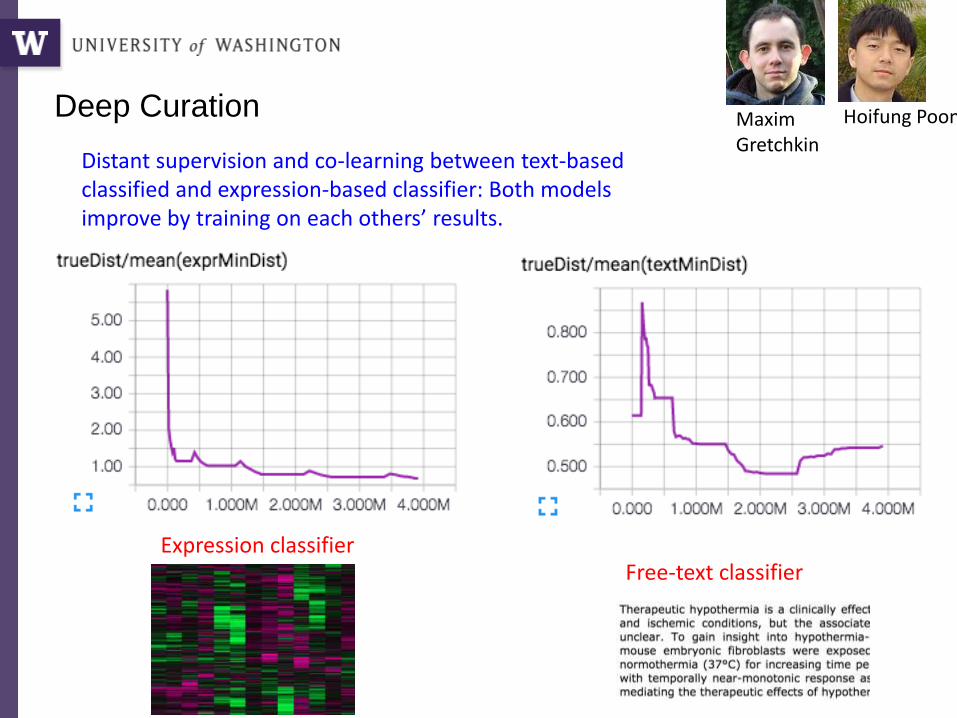
Deep Curation Maxim Gretchkin
Hoifung Poon
Distant supervision and co-learning between text-based classified and expression-based classifier: Both models improve by training on each others’ results.
Free-text classifierExpression classifier
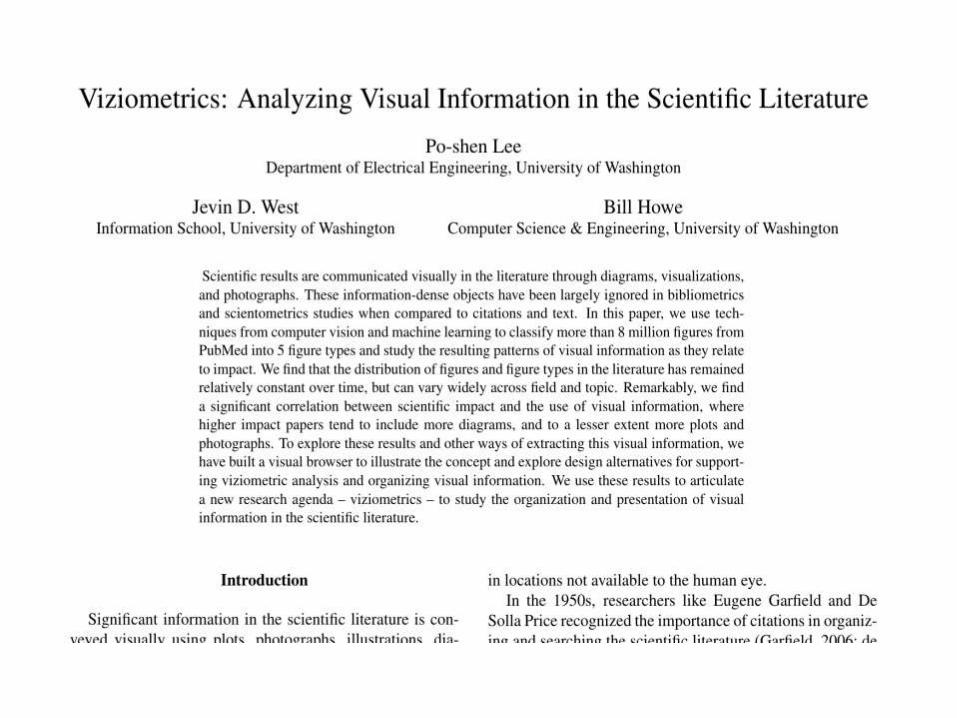
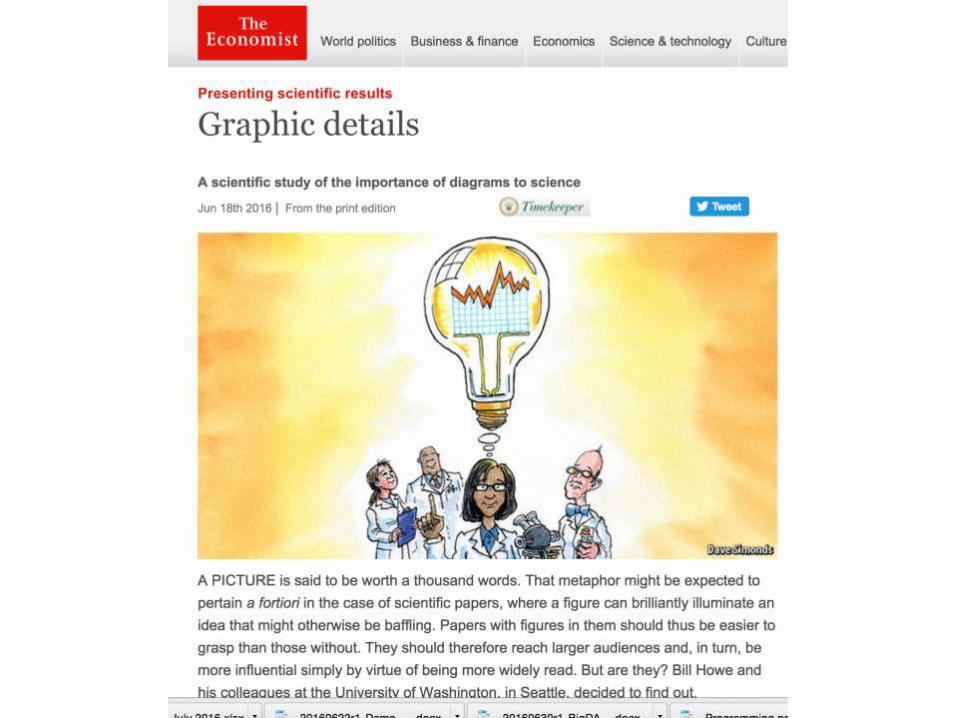
VIZIOMETRICS:COMPREHENDING VISUAL INFORMATION
IN THE SCIENTIFIC LITERATURE
Human-Data Interaction
7/26/2016 Bill Howe, UW 37

Observations
• Figures in the literature are the currency of
scientific ideas
• Almost entirely unexplored
• Our thought: Mine patterns in the visual
literature
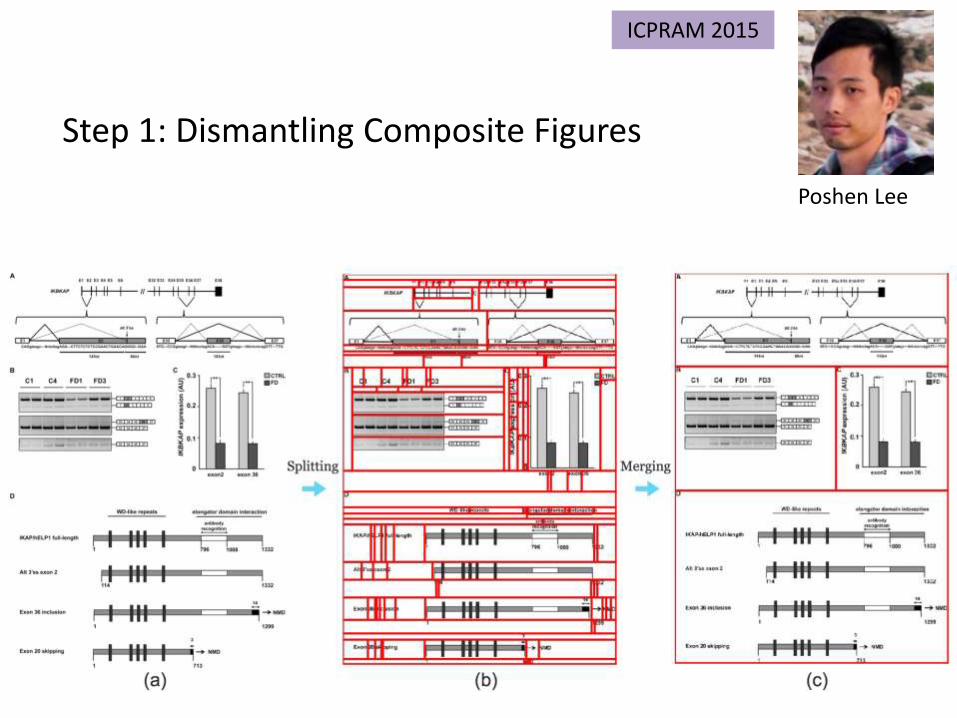
Step 1: Dismantling Composite Figures
Poshen Lee
ICPRAM 2015
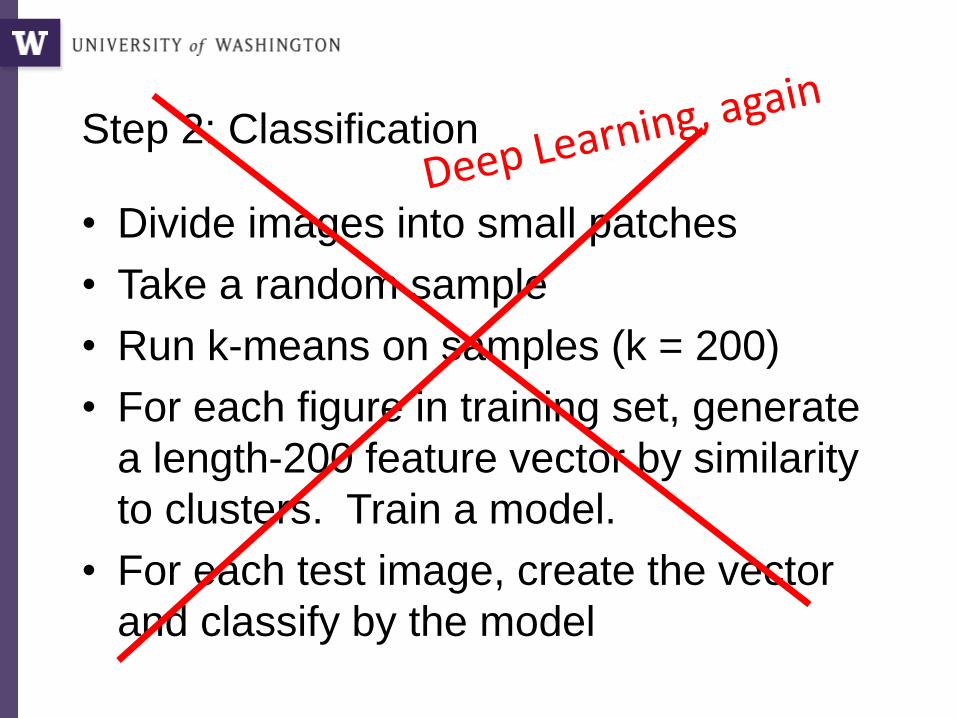
Step 2: Classification
• Divide images into small patches
• Take a random sample
• Run k-means on samples (k = 200)
• For each figure in training set, generate
a length-200 feature vector by similarity
to clusters. Train a model.
• For each test image, create the vector
and classify by the model
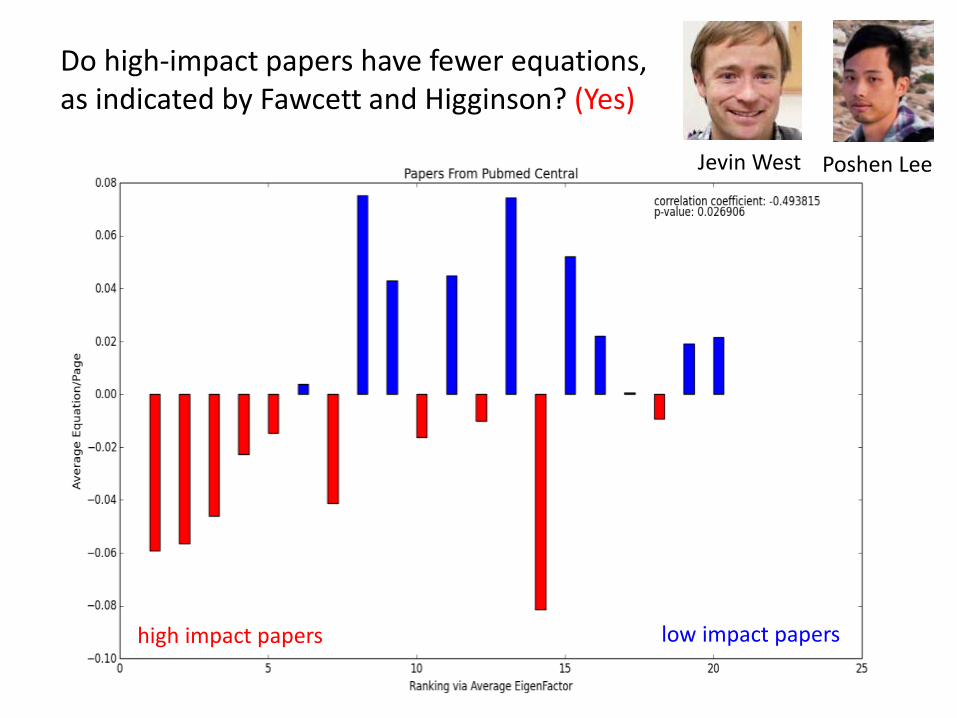
Do high-impact papers have fewer equations, as indicated by Fawcett and Higginson? (Yes)
Poshen LeeJevin West
high impact papers low impact papers
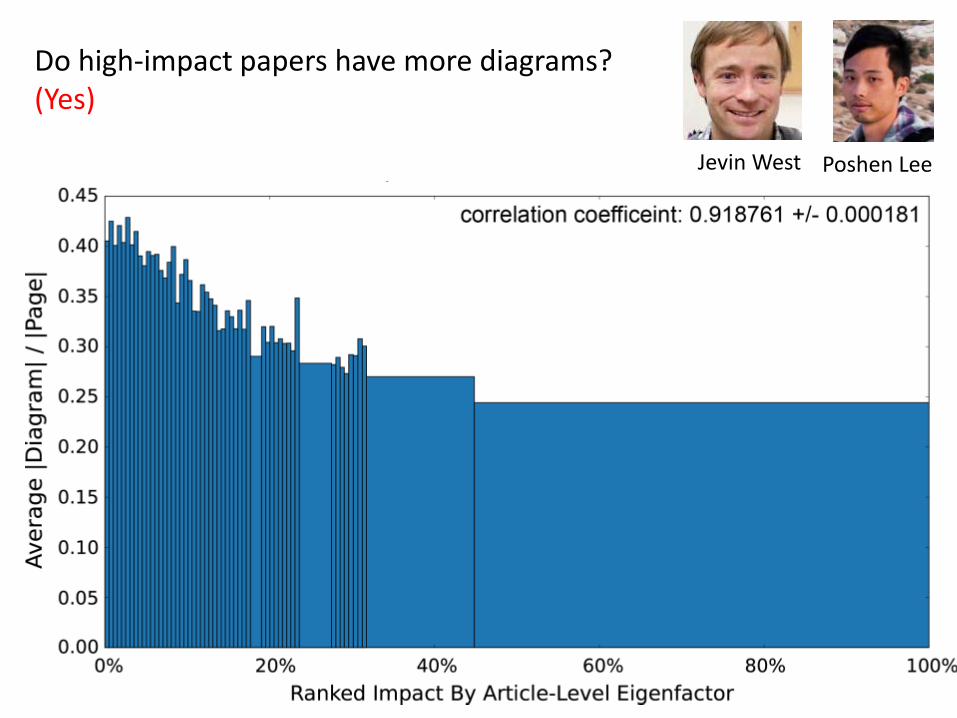
Do high-impact papers have more diagrams? (Yes)
Poshen LeeJevin West
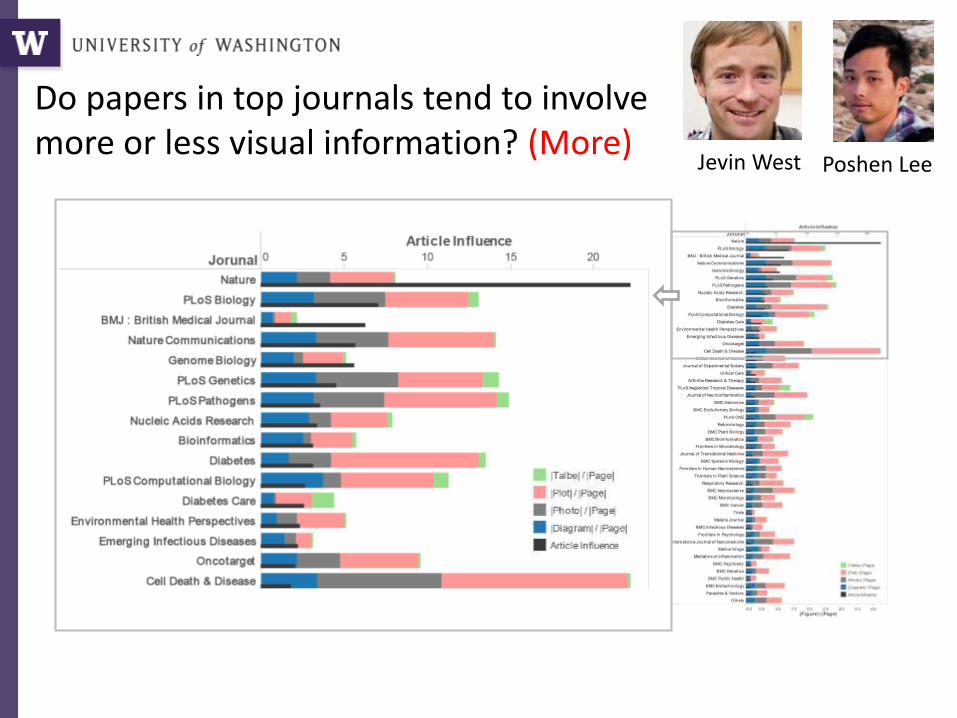
Do papers in top journals tend to involve more or less visual information? (More)
Poshen LeeJevin West
7/26/2016 Poshen Lee, UW 52
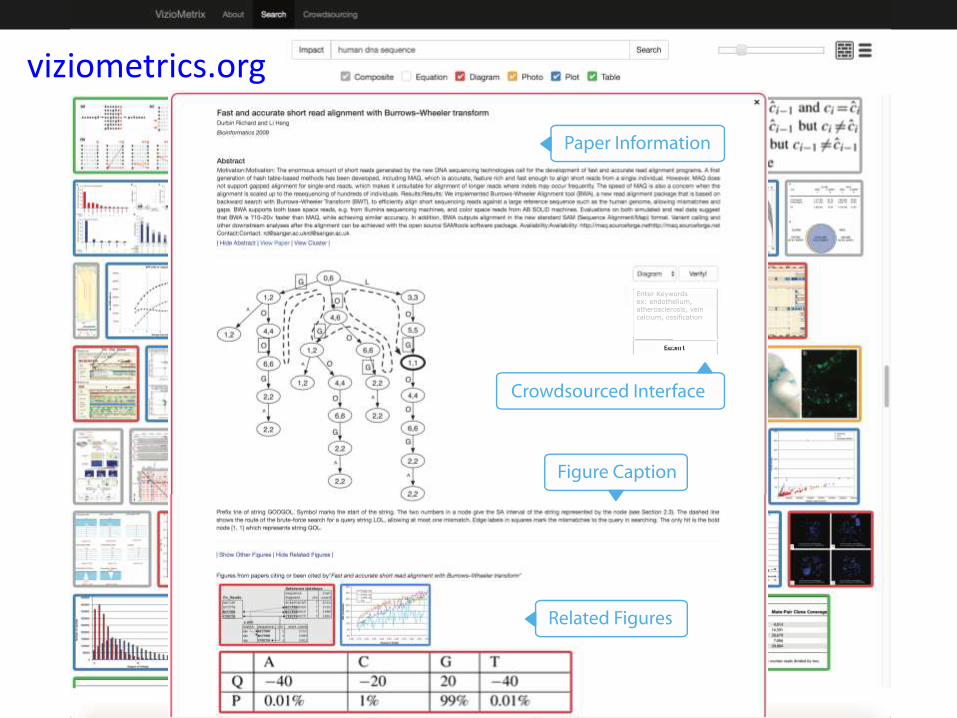
viziometrics.org
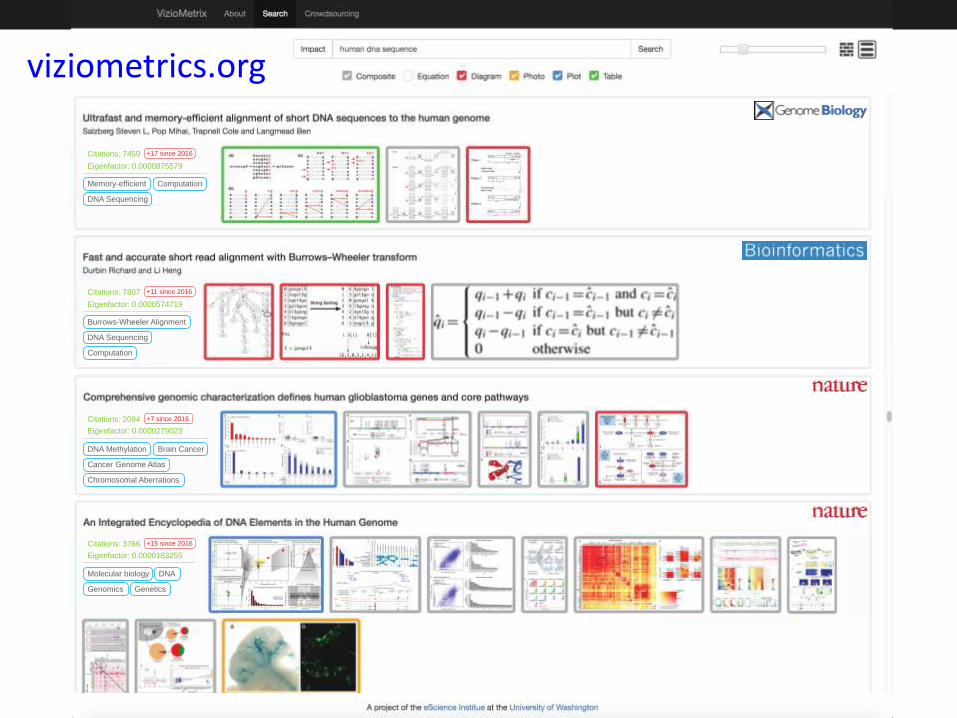
7/26/2016 Poshen Lee, UW 53
Burrows-Wheeler Alignment
Computation
DNA Sequencing
Citations: 7807 +11 since 2016
Eigenfactor: 0.0000574719
DNA Methylation Brain Cancer
Chromosomal Aberrations
Cancer Genome Atlas
Citations: 2094 +7 since 2016
Eigenfactor: 0.0000279023
Memory-efficient Computation
DNA Sequencing
Citations: 7459 +17 since 2016
Eigenfactor: 0.0000875579
Molecular biology
GeneticsGenomics
DNA
Citations: 3766 +15 since 2016
Eigenfactor: 0.0000183255
viziometrics.org

INFORMATION EXTRACTION
FROM FIGURES
Information-critical figures
Metabolic pathway diagrams
Phylogenetic heat maps
Architecture diagrams
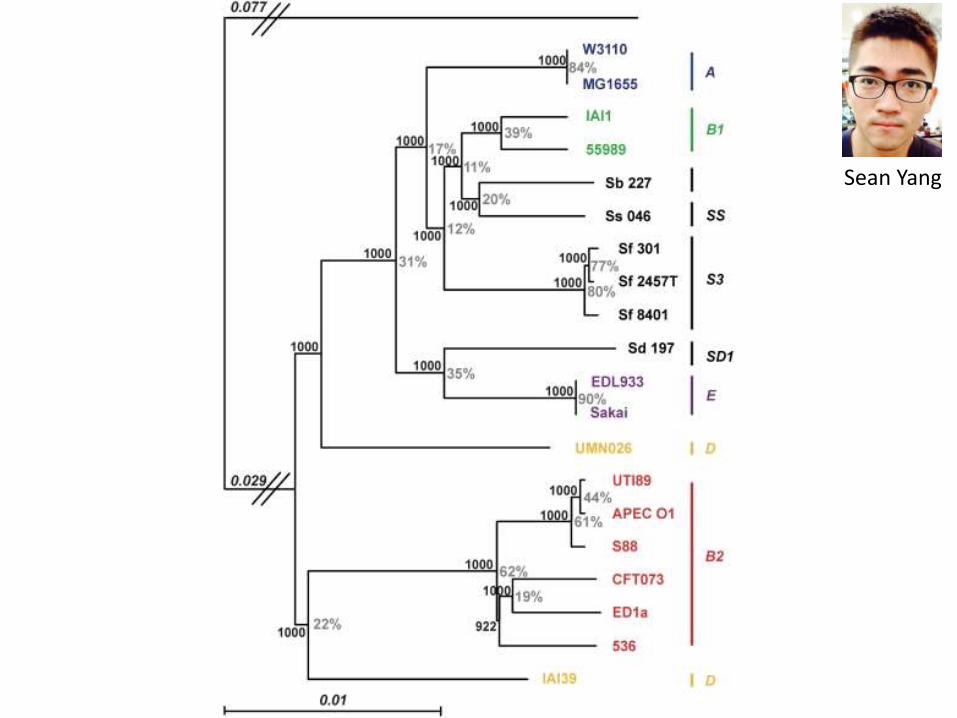
Sean Yang
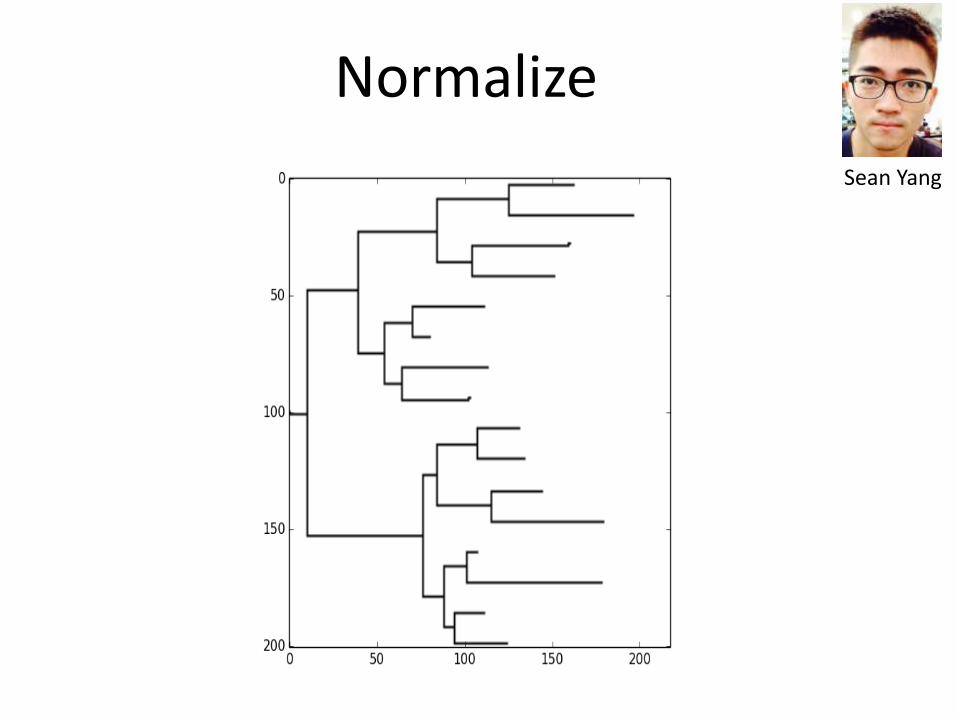
Normalize
Sean Yang
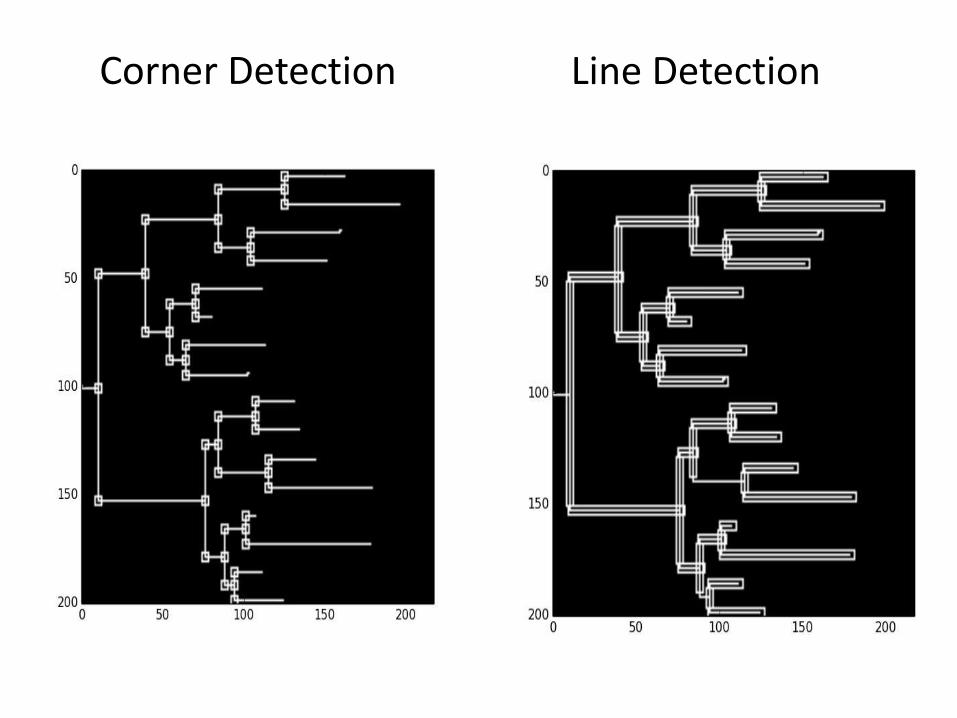
Corner Detection Line Detection
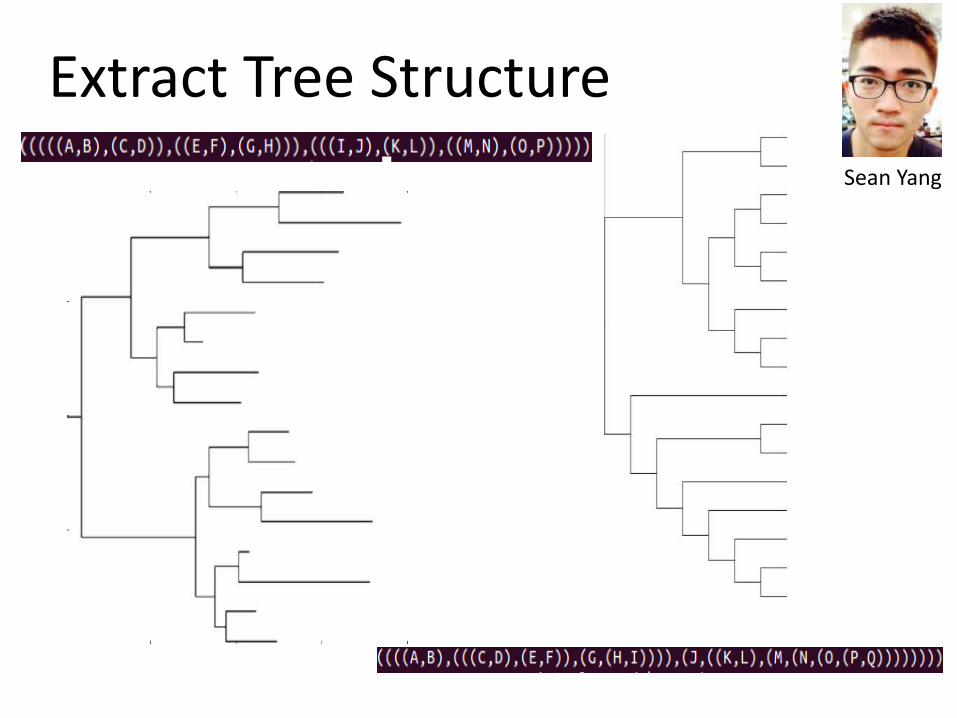
Extract Tree Structure
Sean Yang
VISUALIZATION
RECOMMENDATION
7/26/2016 Bill Howe, UW 59
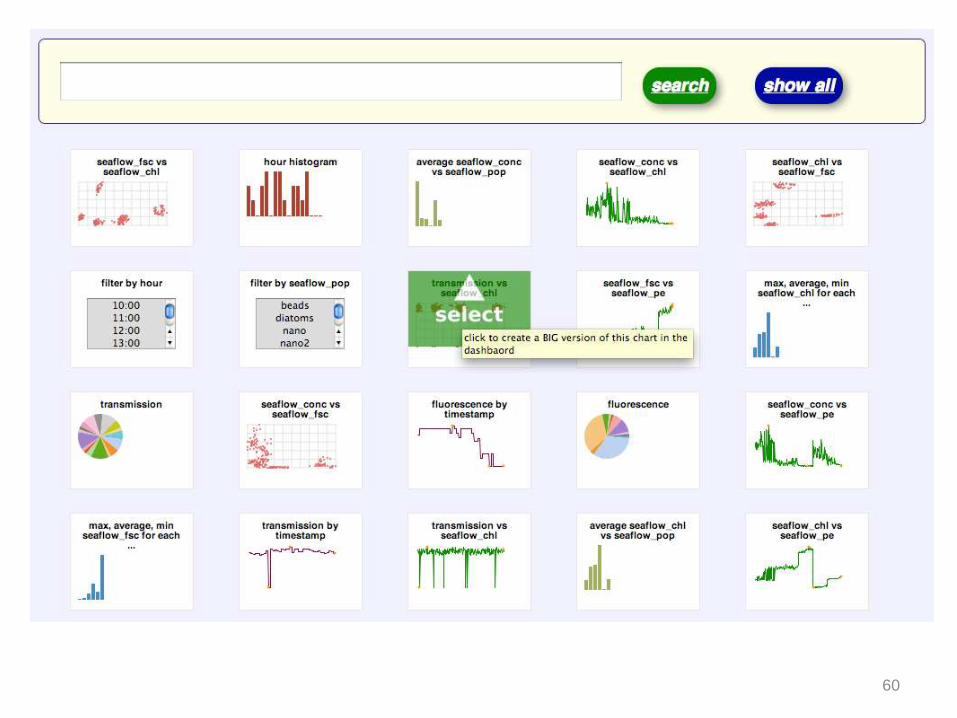
60
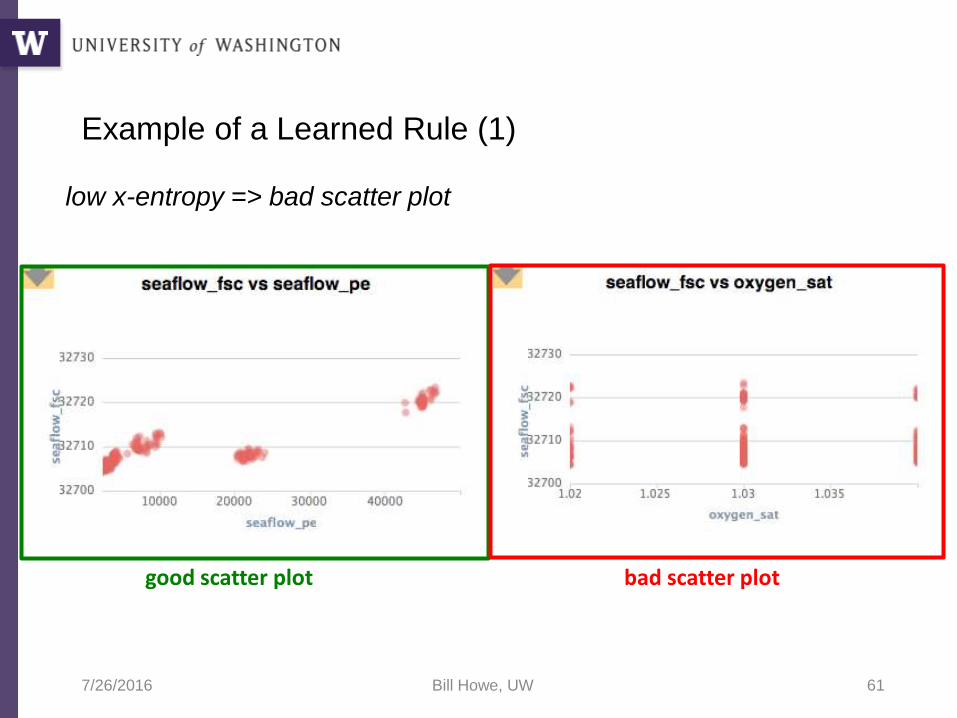
Example of a Learned Rule (1)
low x-entropy => bad scatter plot
7/26/2016 Bill Howe, UW 61
bad scatter plotgood scatter plot
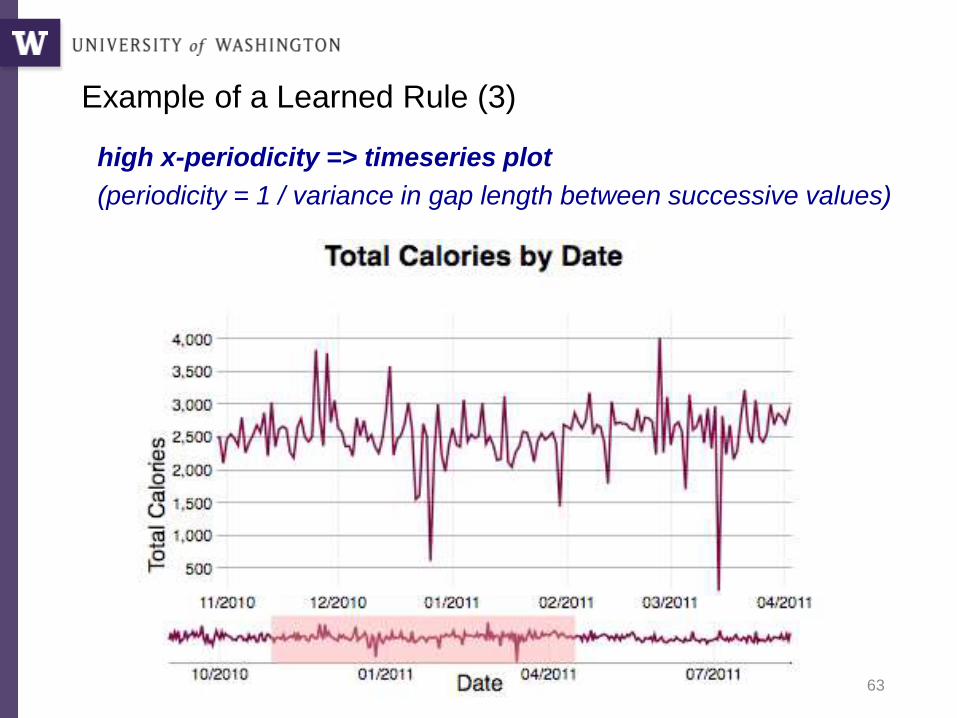
Example of a Learned Rule (3)
63
high x-periodicity => timeseries plot
(periodicity = 1 / variance in gap length between successive values)
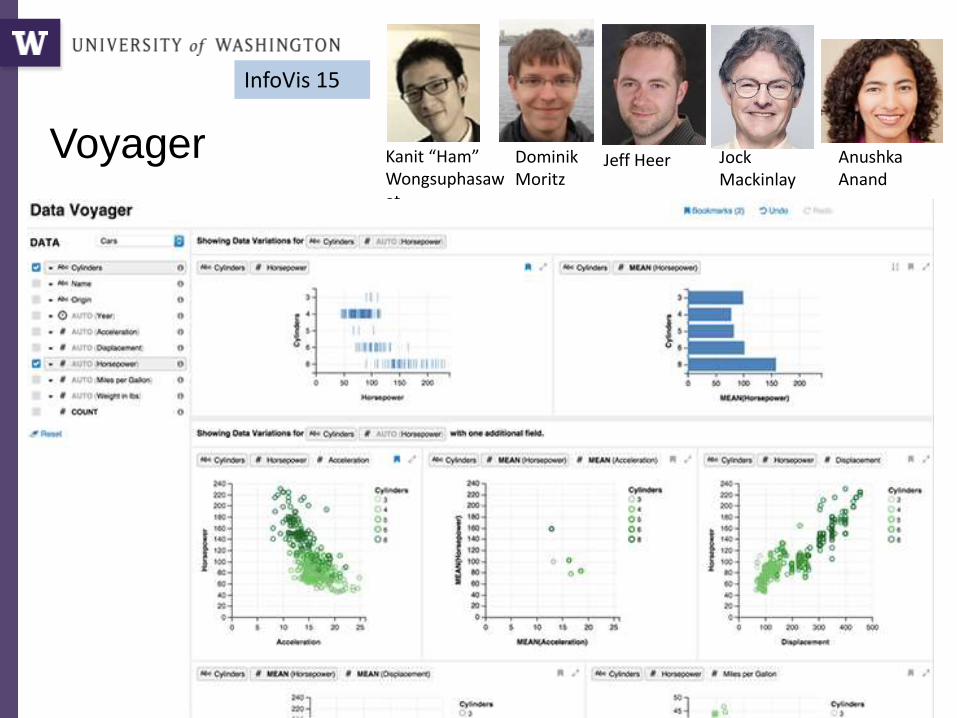
Voyager
7/26/2016 Bill Howe, UW 64
Kanit “Ham” Wongsuphasawat
Dominik Moritz
InfoVis 15
Jeff Heer Jock Mackinlay
Anushka Anand
SCALABLE GRAPH
CLUSTERING
7/26/2016 Bill Howe, UW 65
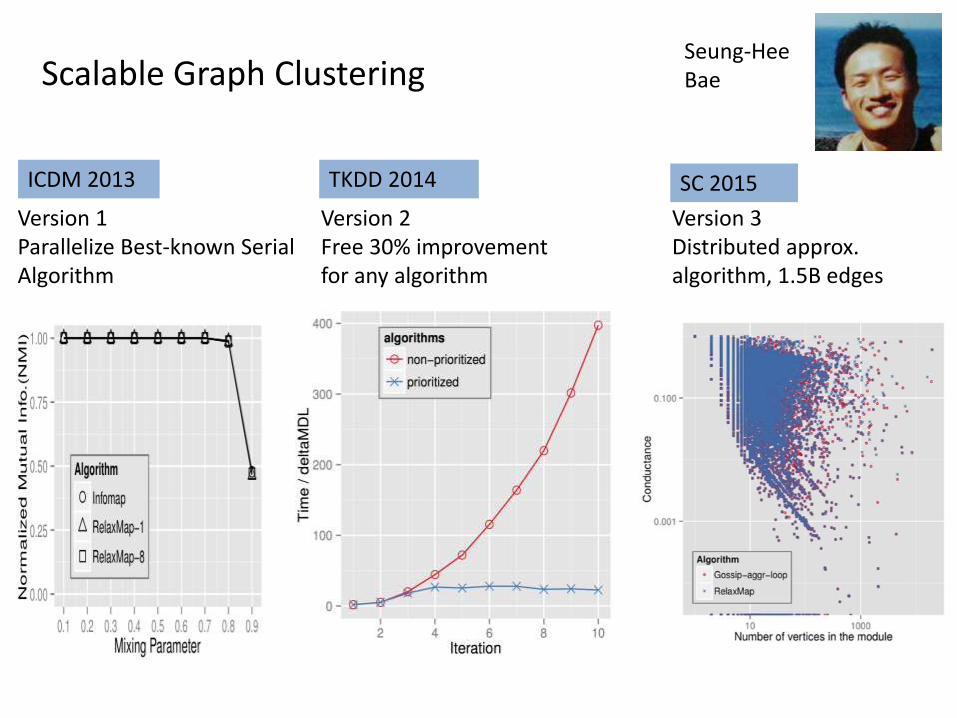
Seung-Hee BaeScalable Graph Clustering
Version 1Parallelize Best-known Serial Algorithm
ICDM 2013
Version 2Free 30% improvement for any algorithm
TKDD 2014 SC 2015
Version 3Distributed approx. algorithm, 1.5B edges
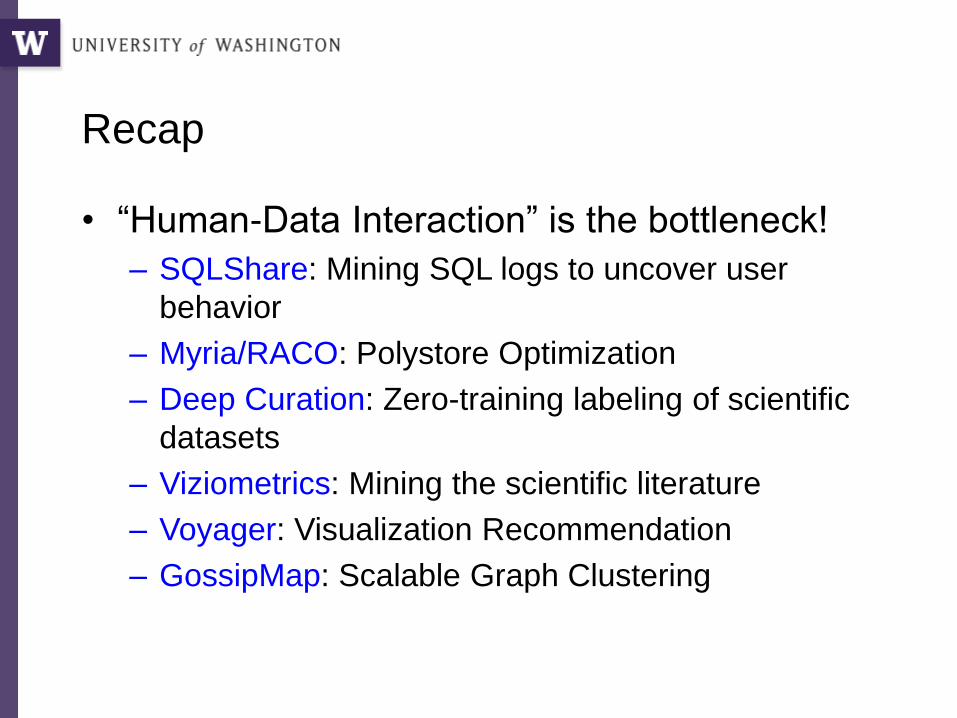
Recap
• “Human-Data Interaction” is the bottleneck!
– SQLShare: Mining SQL logs to uncover user
behavior
– Myria/RACO: Polystore Optimization
– Deep Curation: Zero-training labeling of scientific
datasets
– Viziometrics: Mining the scientific literature
– Voyager: Visualization Recommendation
– GossipMap: Scalable Graph Clustering
http://myria.cs.washington.edu
http://uwescience.github.io/sqlshare/
https://github.com/vega/voyager
Voyager @billghowegithub: billhowe
http://homes.cs.washington.edu/~billhowe/
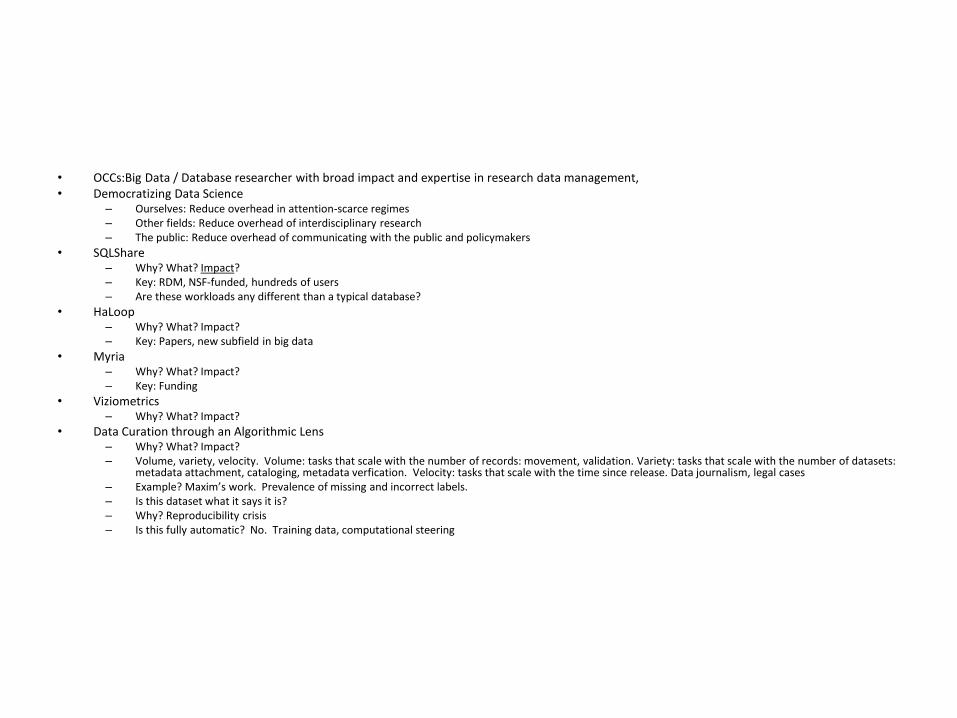
• OCCs:Big Data / Database researcher with broad impact and expertise in research data management, • Democratizing Data Science
– Ourselves: Reduce overhead in attention-scarce regimes– Other fields: Reduce overhead of interdisciplinary research– The public: Reduce overhead of communicating with the public and policymakers
• SQLShare– Why? What? Impact?– Key: RDM, NSF-funded, hundreds of users– Are these workloads any different than a typical database?
• HaLoop– Why? What? Impact?– Key: Papers, new subfield in big data
• Myria– Why? What? Impact?– Key: Funding
• Viziometrics– Why? What? Impact?
• Data Curation through an Algorithmic Lens– Why? What? Impact?– Volume, variety, velocity. Volume: tasks that scale with the number of records: movement, validation. Variety: tasks that scale with the number of datasets:
metadata attachment, cataloging, metadata verfication. Velocity: tasks that scale with the time since release. Data journalism, legal cases– Example? Maxim’s work. Prevalence of missing and incorrect labels. – Is this dataset what it says it is?– Why? Reproducibility crisis– Is this fully automatic? No. Training data, computational steering
• http://www.urbanlibraries.org/living-voters-guide--librarians-as-fact-checkers-innovation-722.php?page_id=167

• http://engage.cs.washington.edu/
• https://www.commerce.gov/datausability/
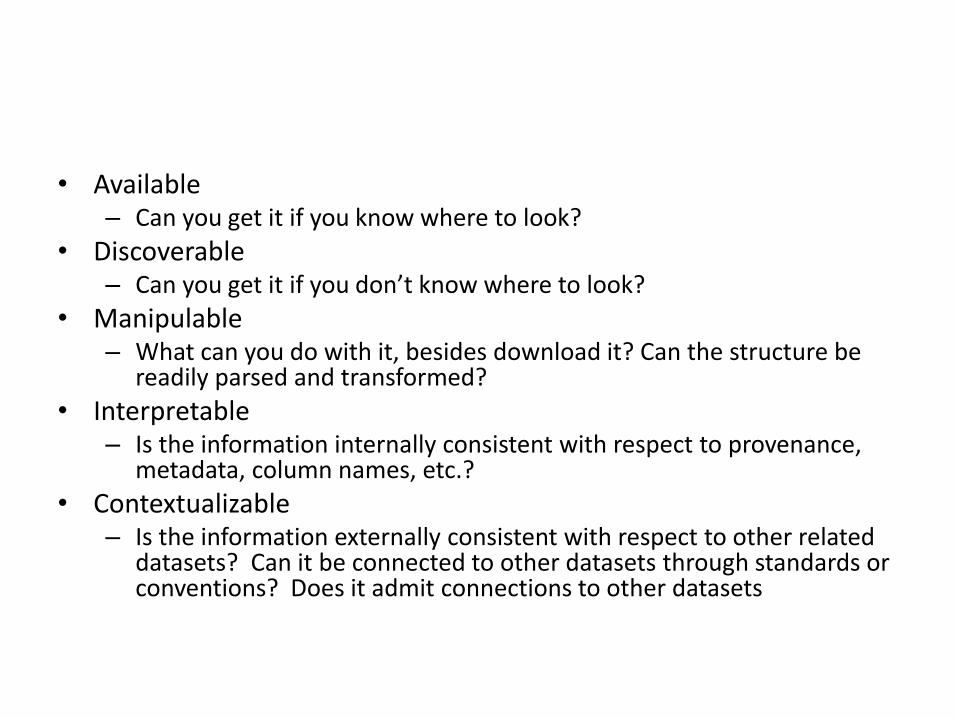
• Available– Can you get it if you know where to look?
• Discoverable– Can you get it if you don’t know where to look?
• Manipulable– What can you do with it, besides download it? Can the structure be
readily parsed and transformed?
• Interpretable– Is the information internally consistent with respect to provenance,
metadata, column names, etc.?
• Contextualizable – Is the information externally consistent with respect to other related
datasets? Can it be connected to other datasets through standards or conventions? Does it admit connections to other datasets
Services emphasizing discovery, citation, and preservation
Query, Viz, and Analytics Services
Google Fusion Tables
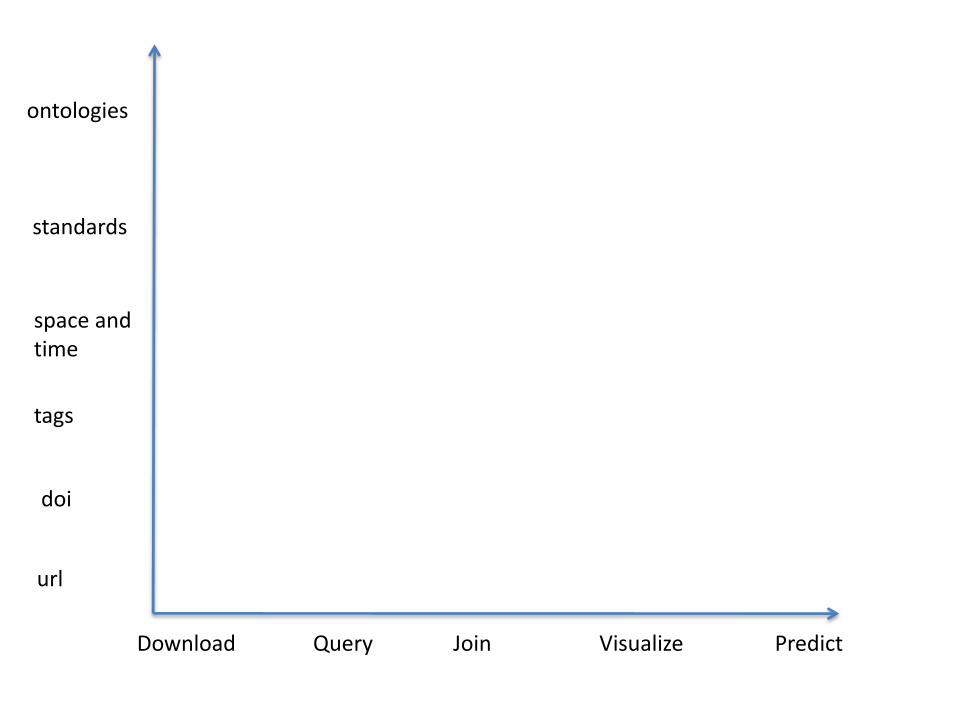
PredictDownload Query Join Visualize
url
doi
tags
space and time
ontologies
standards
Server software, locally installed

• ISMIR paper
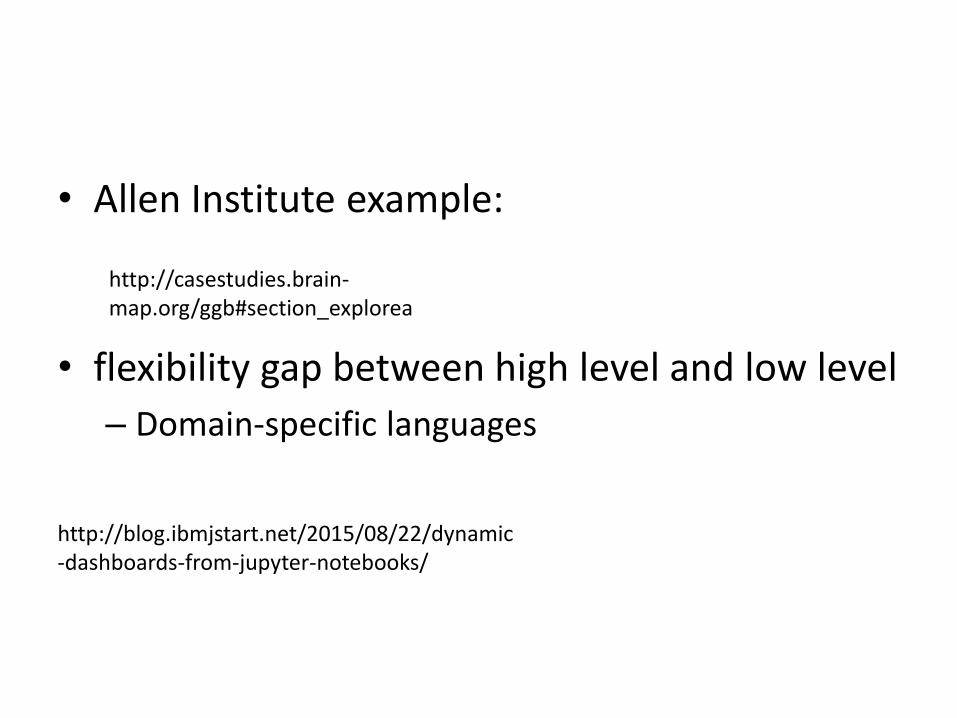
• Allen Institute example:
• flexibility gap between high level and low level
– Domain-specific languages
http://casestudies.brain-map.org/ggb#section_explorea
http://blog.ibmjstart.net/2015/08/22/dynamic-dashboards-from-jupyter-notebooks/

Time
Am
ou
nt
of
data
in
th
e w
orl
d
Time
Pro
cessin
g p
ow
er
What is the rate-limiting step in data understanding?
Processing power:
Moore’s LawAmount of data in
the world
Pro
cess
ing
po
wer
Time
What is the rate-limiting step in data understanding?
Processing power:
Moore’s Law
Human cognitive capacity
Idea adapted from “Less is More” by Bill Buxton (2001)
Amount of data in
the world
slide src: Cecilia Aragon, UW HCDE
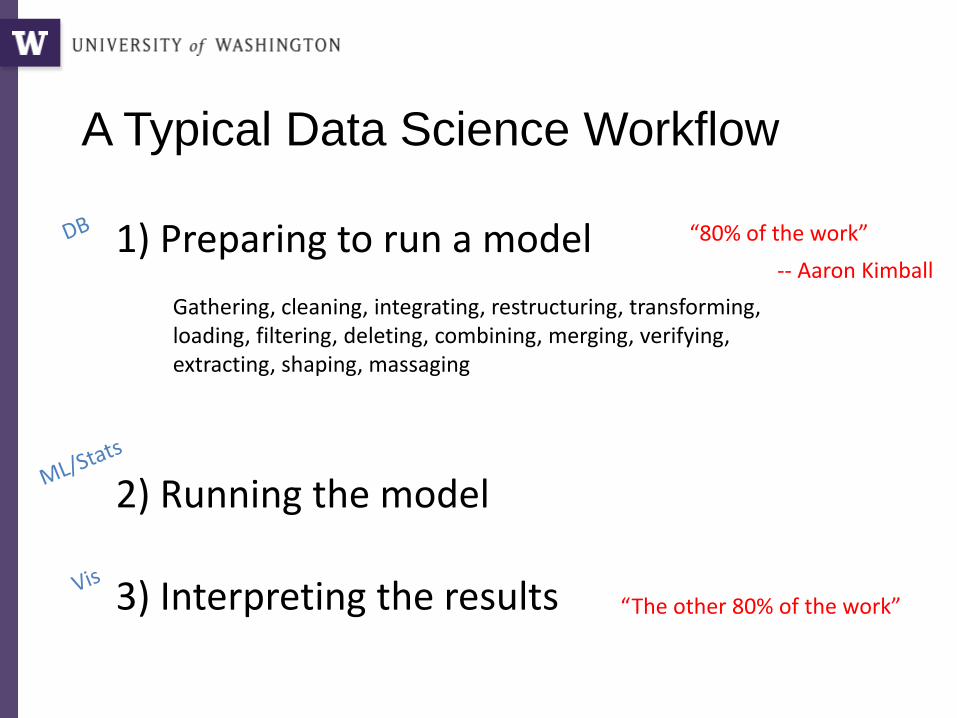
A Typical Data Science Workflow
1) Preparing to run a model
2) Running the model
3) Interpreting the results
Gathering, cleaning, integrating, restructuring, transforming, loading, filtering, deleting, combining, merging, verifying, extracting, shaping, massaging
“80% of the work”
-- Aaron Kimball
“The other 80% of the work”
How much time do you spend “handling data” as opposed to “doing science”?
Mode answer: “90%”
7/26/2016 Bill Howe, UW 93