Embed Size (px)
Citation preview

Kobi Shely www.kshely.com / 24
What Da’Data?Using VOD Data To Create Cinema Demand

Kobi Shely www.kshely.com / 242
ABOUT I'm an online marketing professional with focus on video and the film industry. I execute and manage marketing campaigns and partnerships for video on demand digital distribution companies including Distrify, China Public Television CCTV, Wise Data, and different content creators, with a particular focus on expanding solution for selling films, web video , and a range of video content.

Kobi Shely www.kshely.com / 243
Viewers Habbits ShiftsAccording to Horowitz Research, since 2012, the weekly share of traditional viewing among millennials has dropped from 75% to 39%.
The share of viewing that is streamed, though, has risen from 15% to 54%.Streaming is the new normal for Millennials

Kobi Shely www.kshely.com / 244
Lack of choice driving down demand for filmAccording to Deloitte, 70% of Netflix consumers now binge watch TV, averaging 5 episodes per sitting.
Now hang on a second, that’s not how linear film distribution works.
But it’s not just happening on Netflix. It’s across the board According to EU Creative Media Study (2015) 14% of respondents have no access to cinemas within 30 minutes of their home. This figure rises to 37% in Romania, 27% in Lithuania and 16% in Croatia.
.

Kobi Shely www.kshely.com / 245
Cinema Vs Binge European films are considered original and thought provoking, but audiences are critical about "slow or heavy" storylines
Europe produces more than 1000 films a year, but most are only seen in the country where they are made and relatively few films are screened abroad
Most people choose the film they are going to view just before going to the cinema, with trailers being the most effective marketing tool
28% of Europeans watch films in festivals

Kobi Shely www.kshely.com / 246
You Have Potential The study confirms that the European film industry is not making the most of its potential to reach new audiences or capitalizing on cross-border partnerships. What the study doesn’t suggest is how to maximize the potential - And data can really help.

Kobi Shely www.kshely.com / 247
Data BuzzFor the last two or three years, you’ve been hearing about the disruptive changes facing our business: the relevance of film distribution in an on-demand world competitive cross channel promotion, the rise of Netflix, the death of DVD market, TVOD (Pay Per View) vs. AVOD (Ad Support) SVOD (Subscription).

Kobi Shely www.kshely.com / 248
3 Categories Of Proposals - Invest in data to reach targeted audience
- Measures data and use it for acquisition and distribution strategies
- Create your In House Data - If the data isn’t available then you need to create your own.
Kobi Shely www.kshely.com / 2411
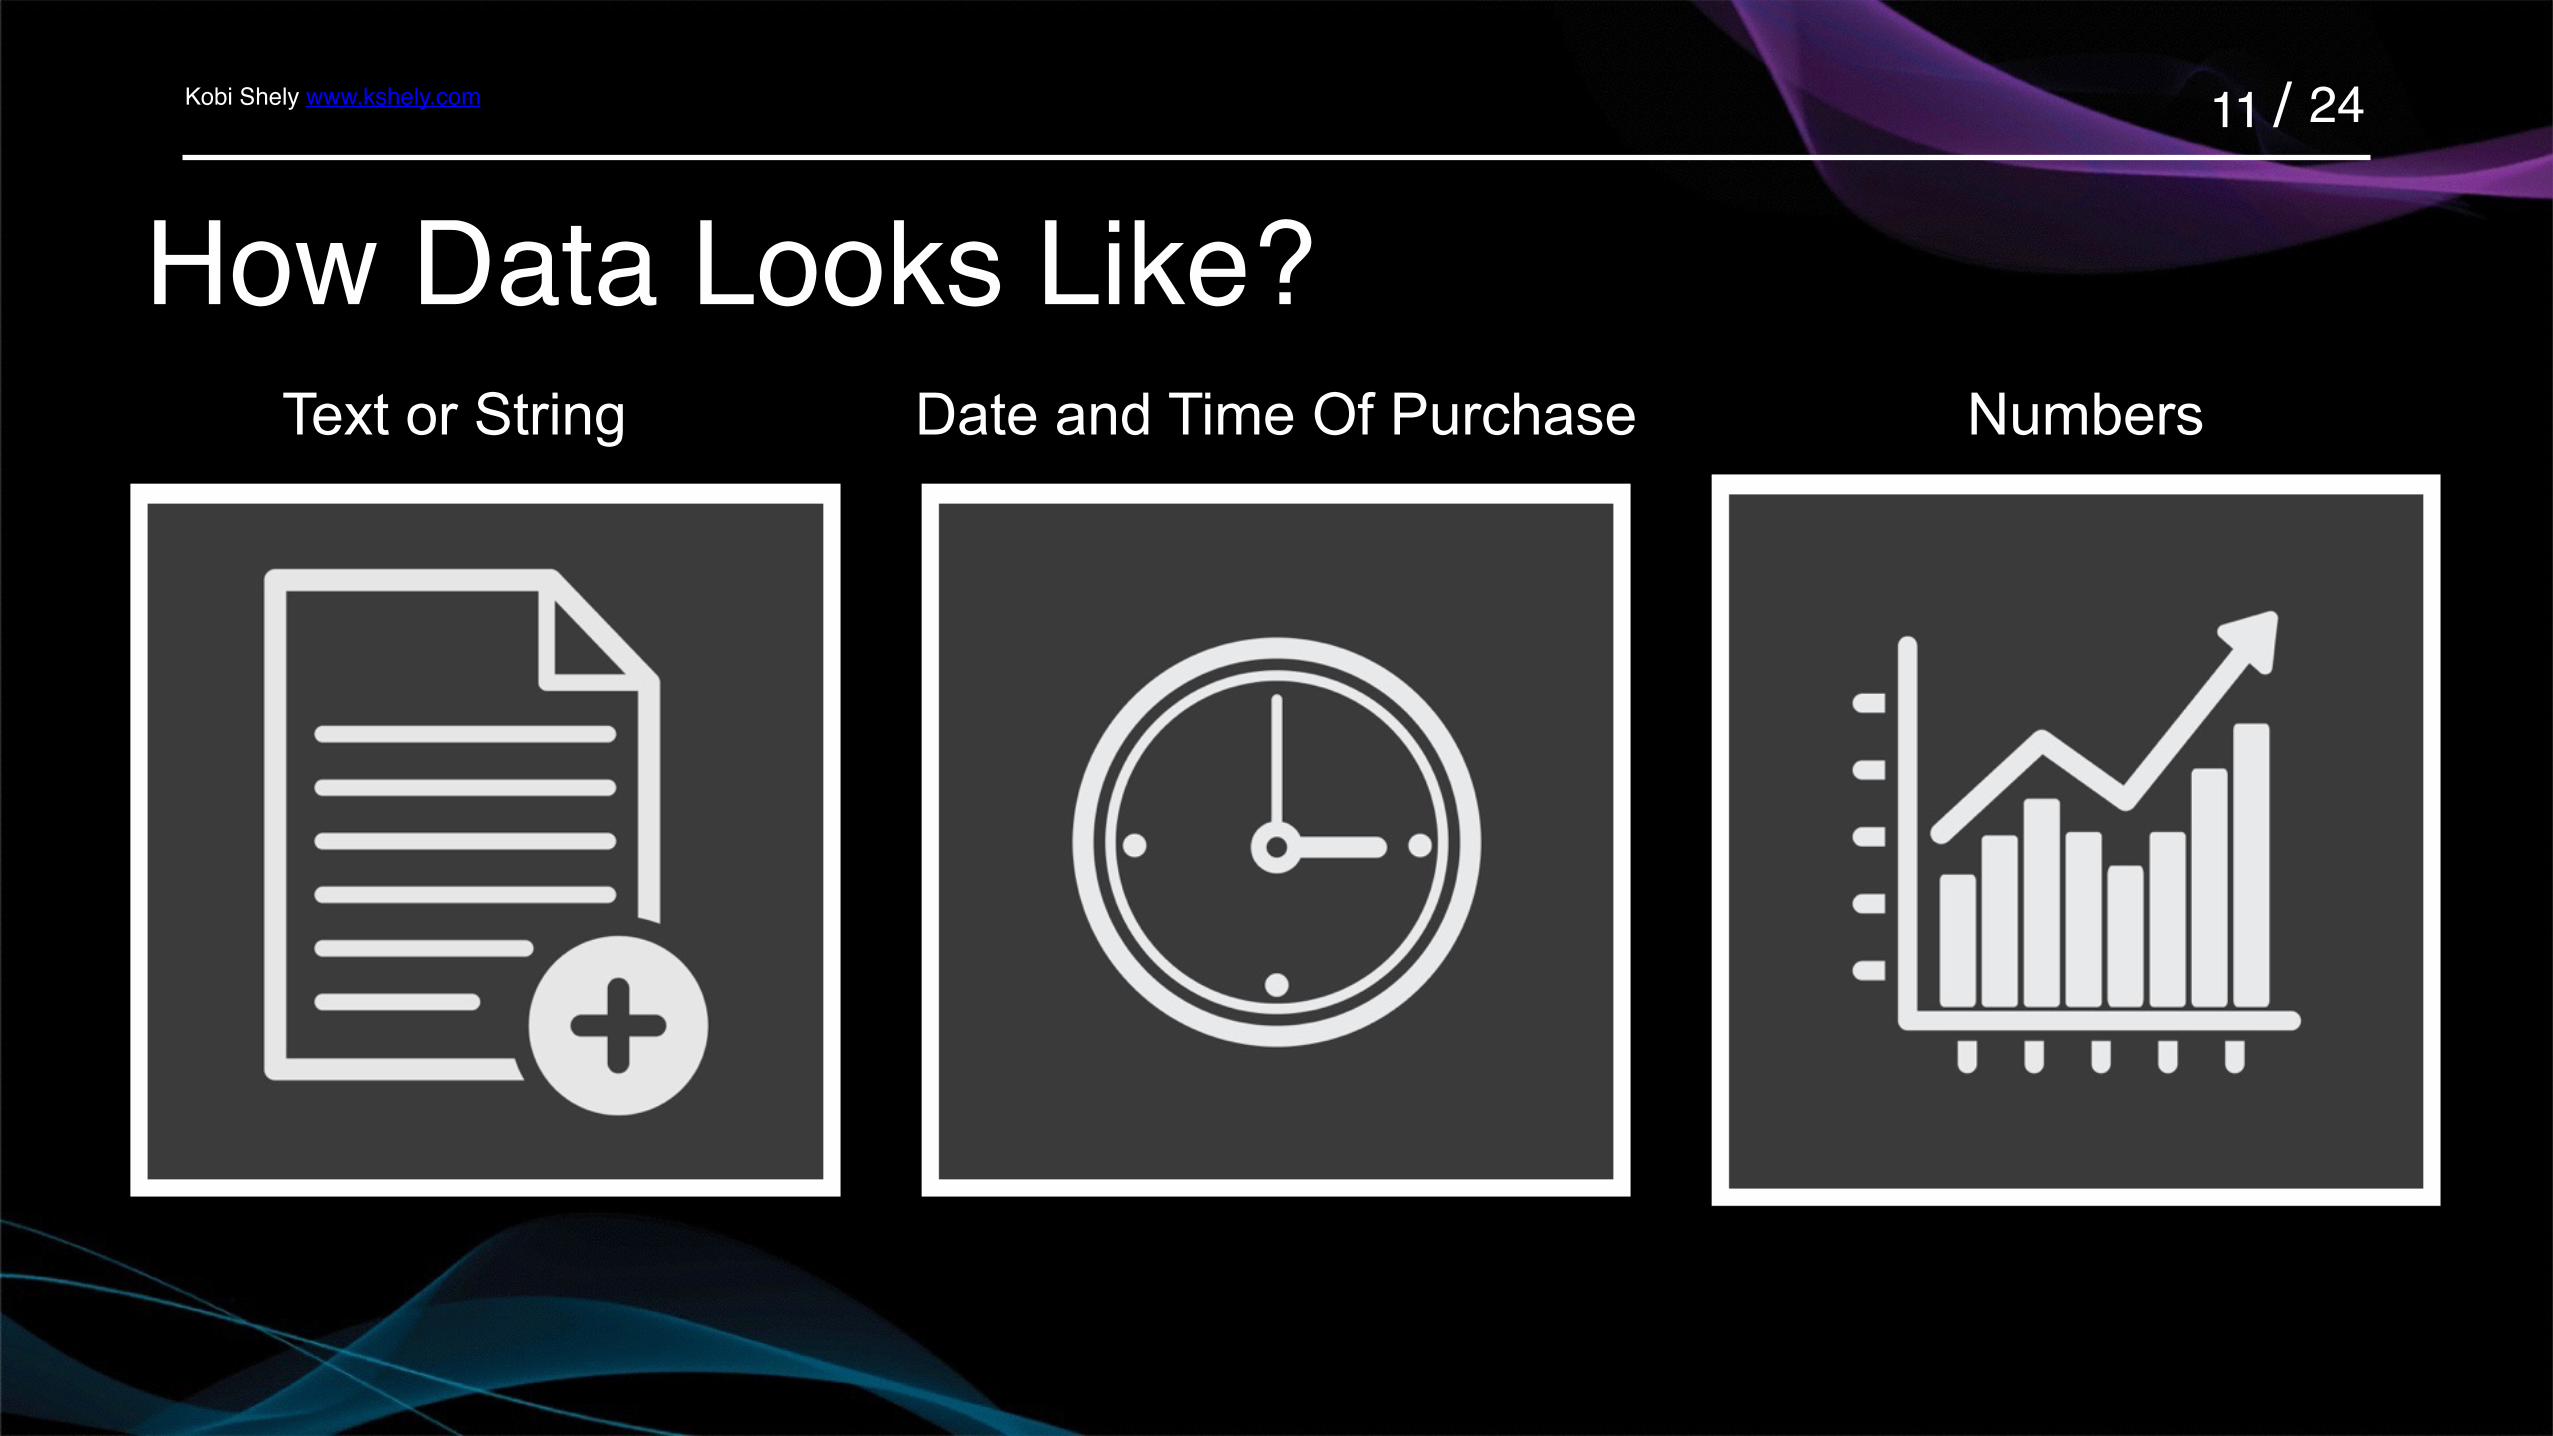
How Data Looks Like? Text or String Date and Time Of Purchase Numbers

Kobi Shely www.kshely.com / 2412
How Data Looks Like? Boolean True Or False Location Referral

Kobi Shely www.kshely.com / 2413
Field Heading and Data ValueRecords are fields and values together
Gender Genre Twitter Address Country City Code
Female Drama, Romantic, LGBT @talg Bedford USA Brooklyn 90210
Surname Email Opt-In Purchased Product Repeating
Tal Shely [email protected] YES Submerge No
Name
YES

Kobi Shely www.kshely.com / 2414
The Jelly Beans TheoryIt actually comes from a thing about guess the number of jelly beans in a large jar. If you take everybody's predictions and average them, that's usually going to be closer to the real number than any one individual's actual guess
Kobi Shely www.kshely.com / 2415
Netflix PrizeA million dollar prize to anybody who could improve the quality of their recommendations by 10% using an anonymized data set that they had provided.
build as many different predictive models as you possibly can, and then you basically average the results of them. Because it turns out that when it comes to predictions, the average prediction is usually more accurate than any one individual prediction.
Kobi Shely www.kshely.com / 2416
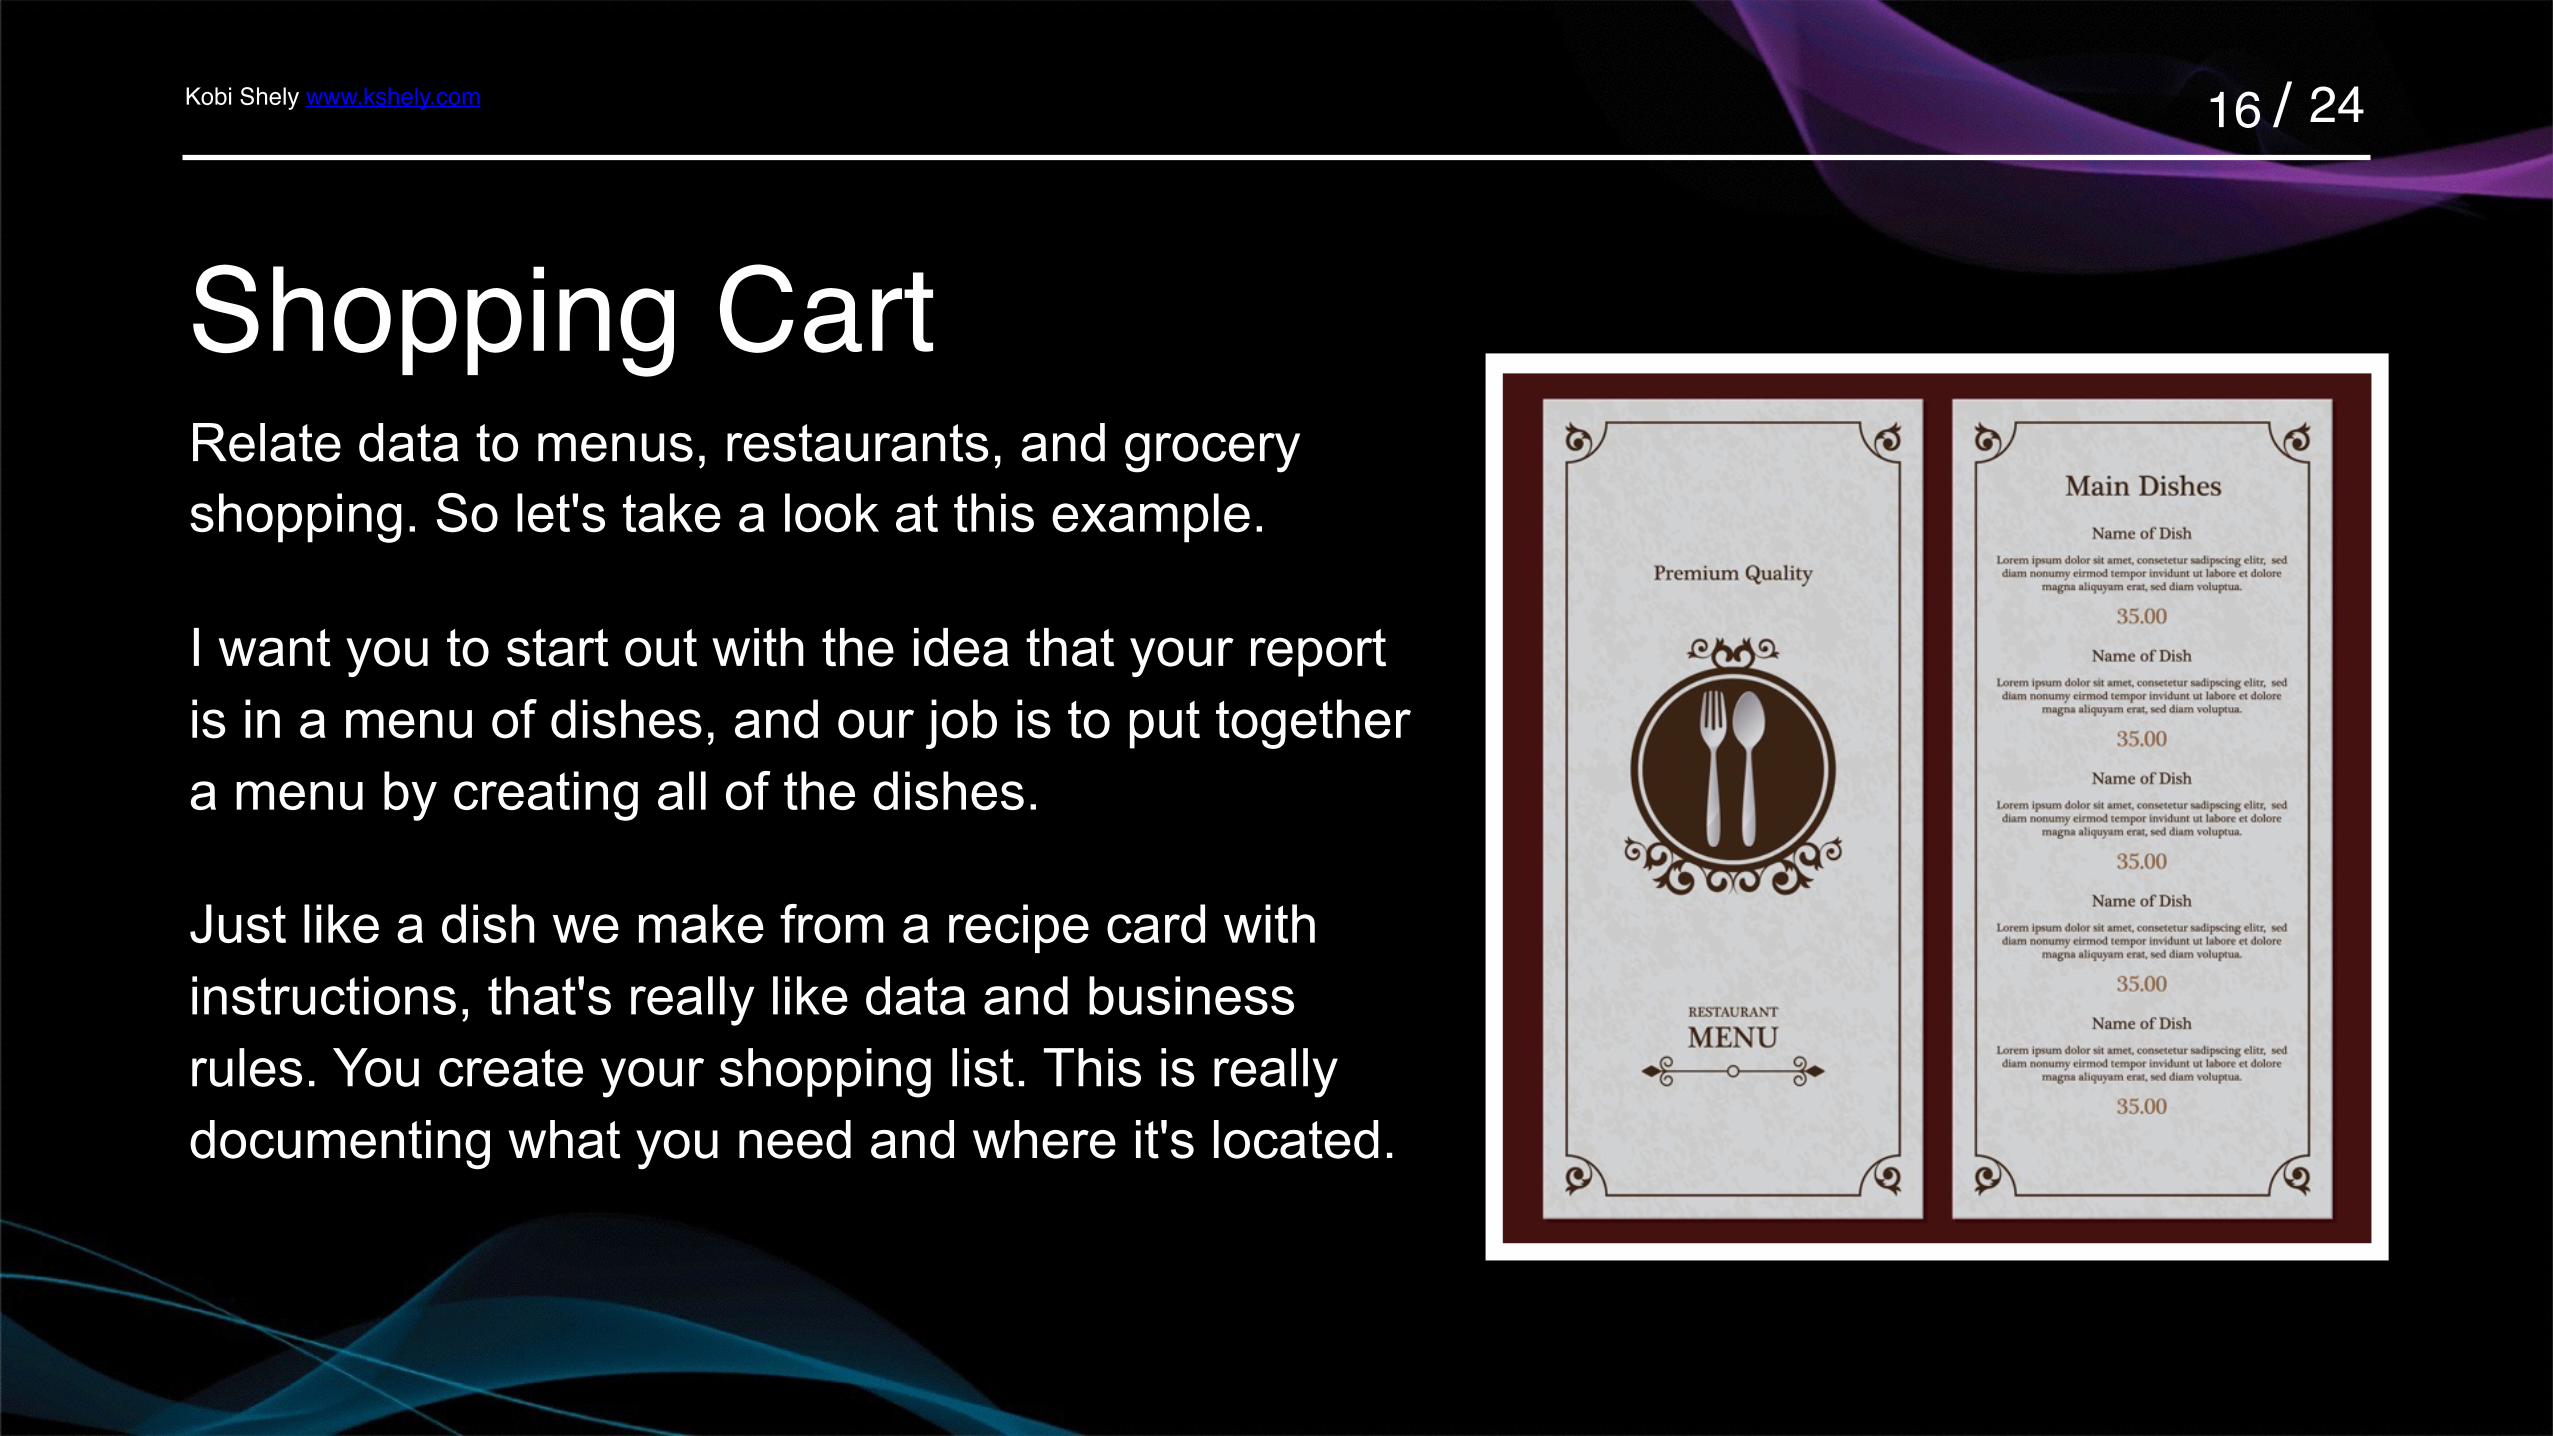
Shopping CartRelate data to menus, restaurants, and grocery shopping. So let's take a look at this example.
I want you to start out with the idea that your report is in a menu of dishes, and our job is to put together a menu by creating all of the dishes.
Just like a dish we make from a recipe card with instructions, that's really like data and business rules. You create your shopping list. This is really documenting what you need and where it's located.

Kobi Shely www.kshely.com / 2417
Time To ShopFor data, you always create the list. Then it's time to shop for your data. You go through the aisles and find what you need based on where it's located. You may find a million things you need, but try to stay focused to fill your data cart with just what you need for this dish.

Kobi Shely www.kshely.com / 24
Film Data Recipe
= Your Audience
18
Genre
Age
Location
Time / Date
Channel
Sign Up
Name

Kobi Shely www.kshely.com / 2419
Building Your In House Data Marketing Channels
Sales performance all distribution channels
Live Social Trends
Sharing data with peers
Kobi Shely www.kshely.com / 2421
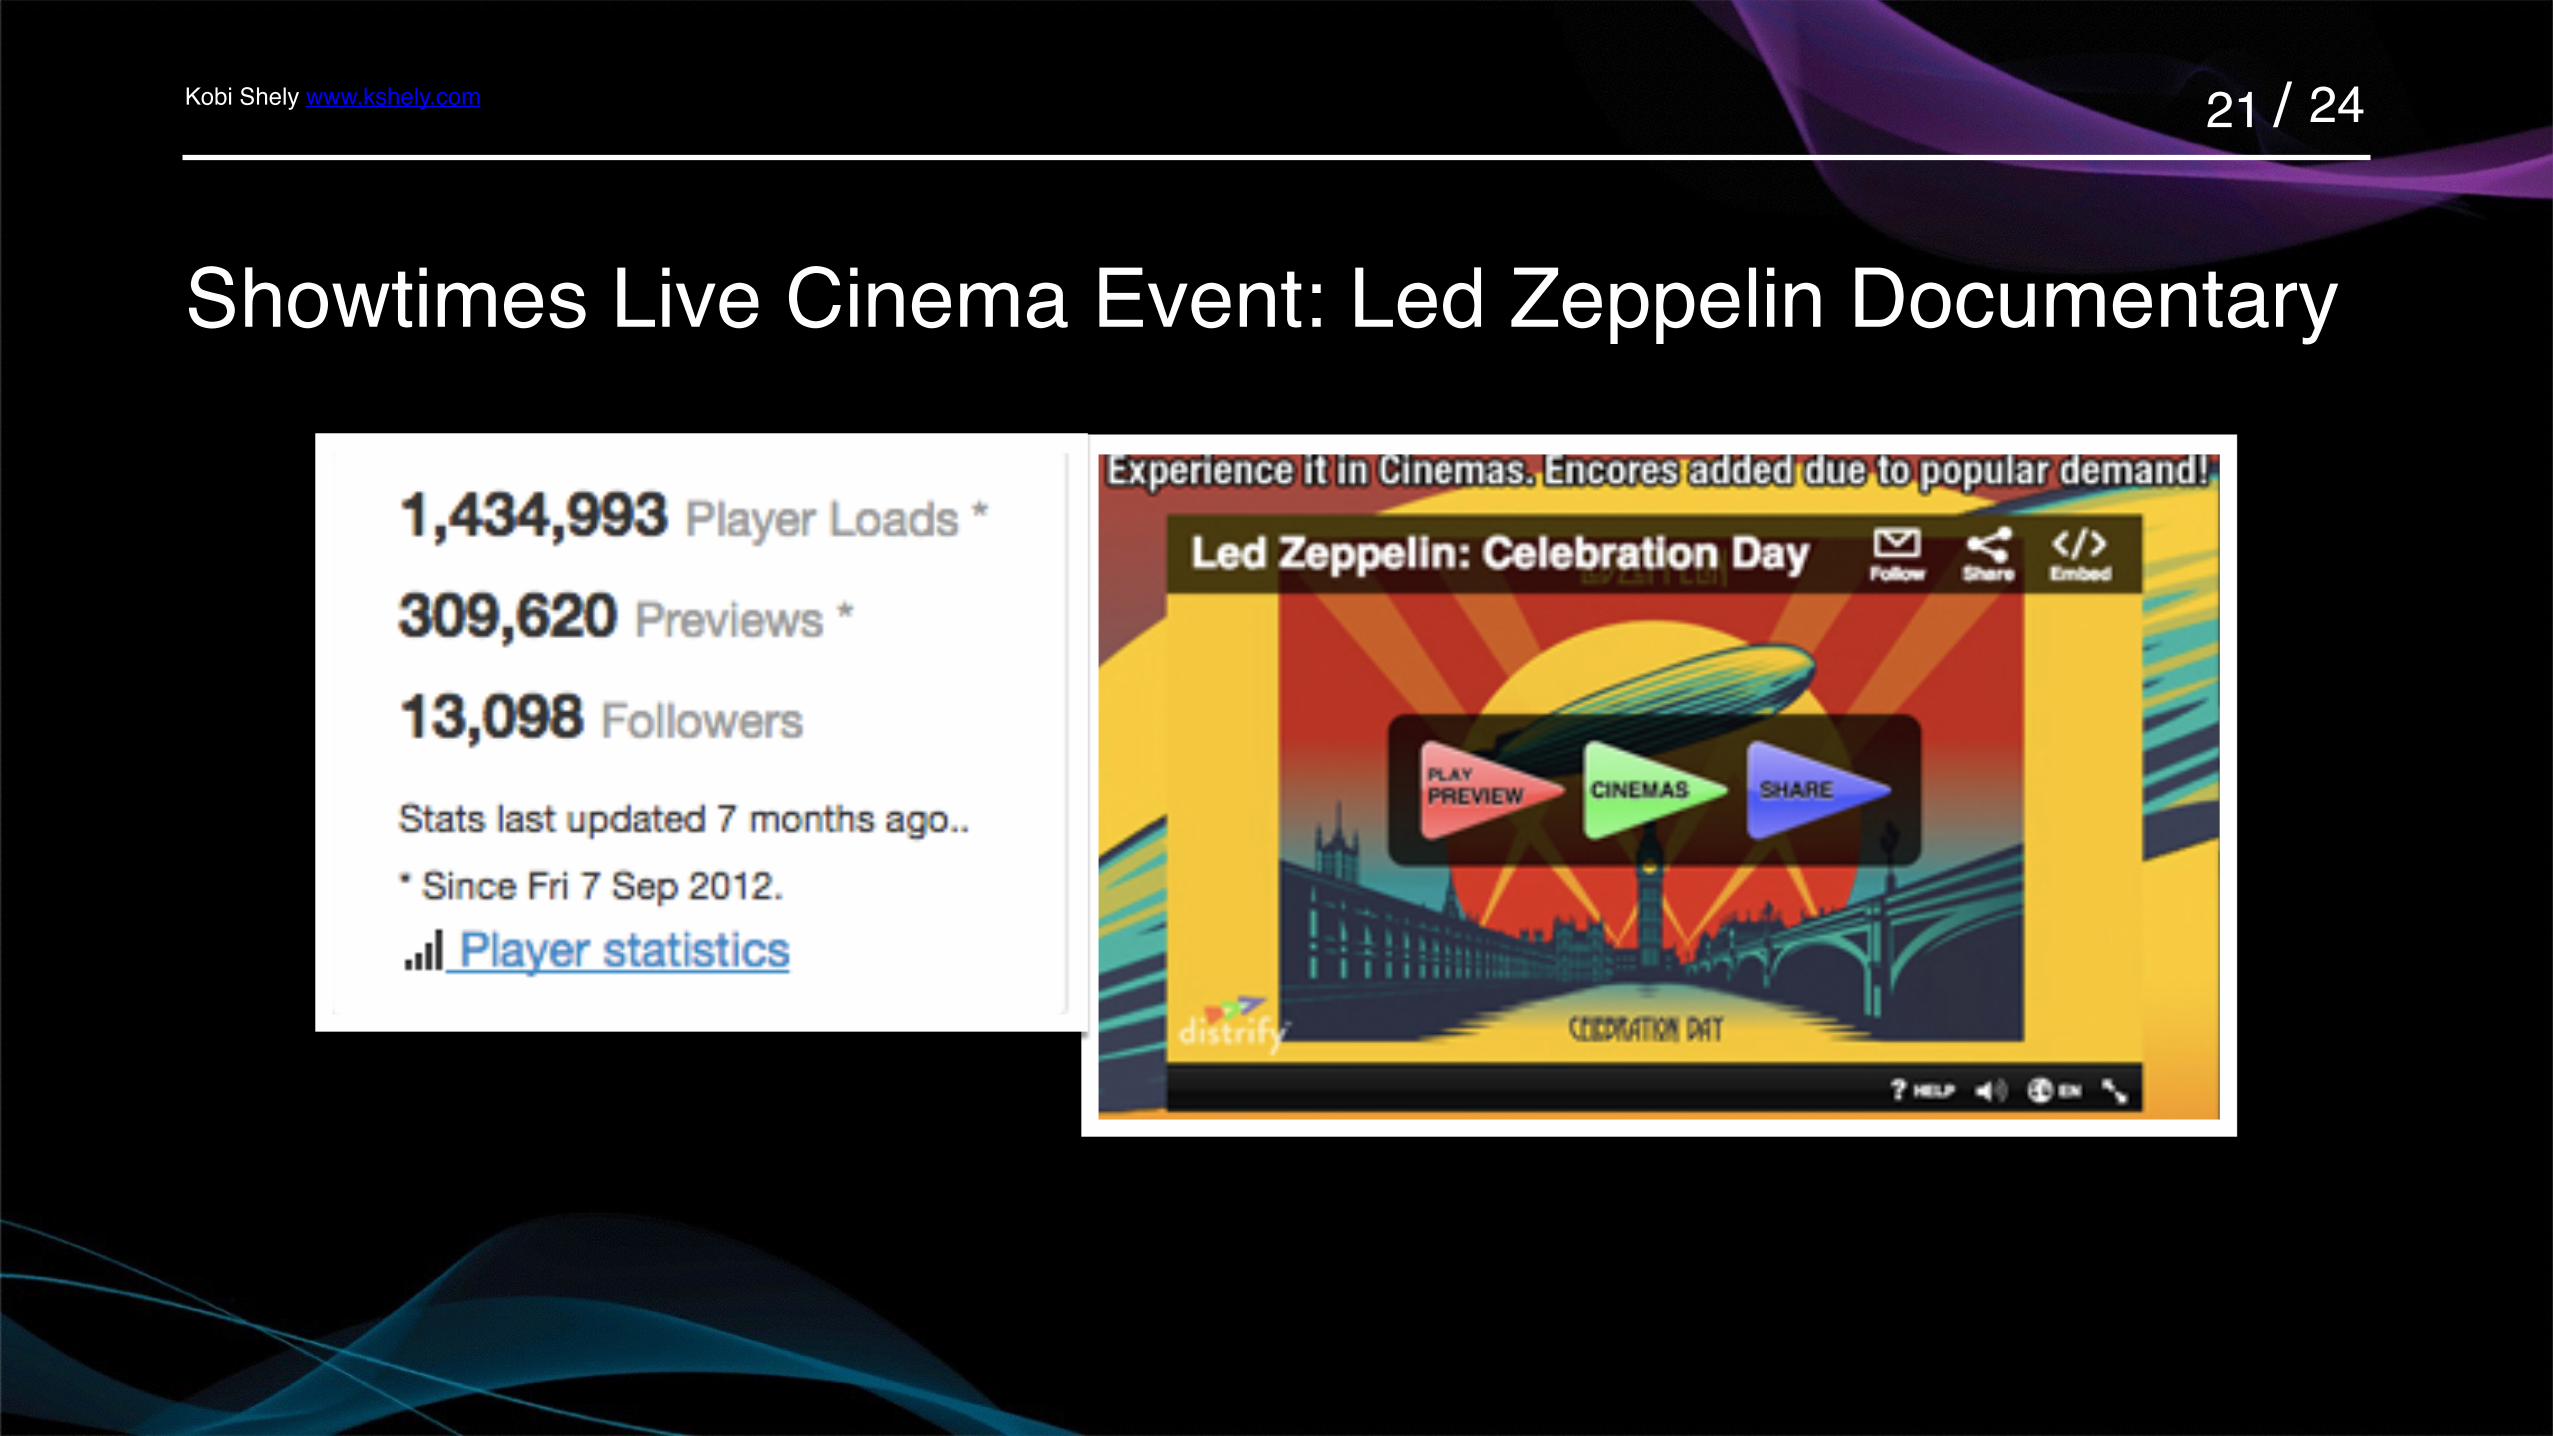
Showtimes Live Cinema Event: Led Zeppelin Documentary
Kobi Shely www.kshely.com / 2422
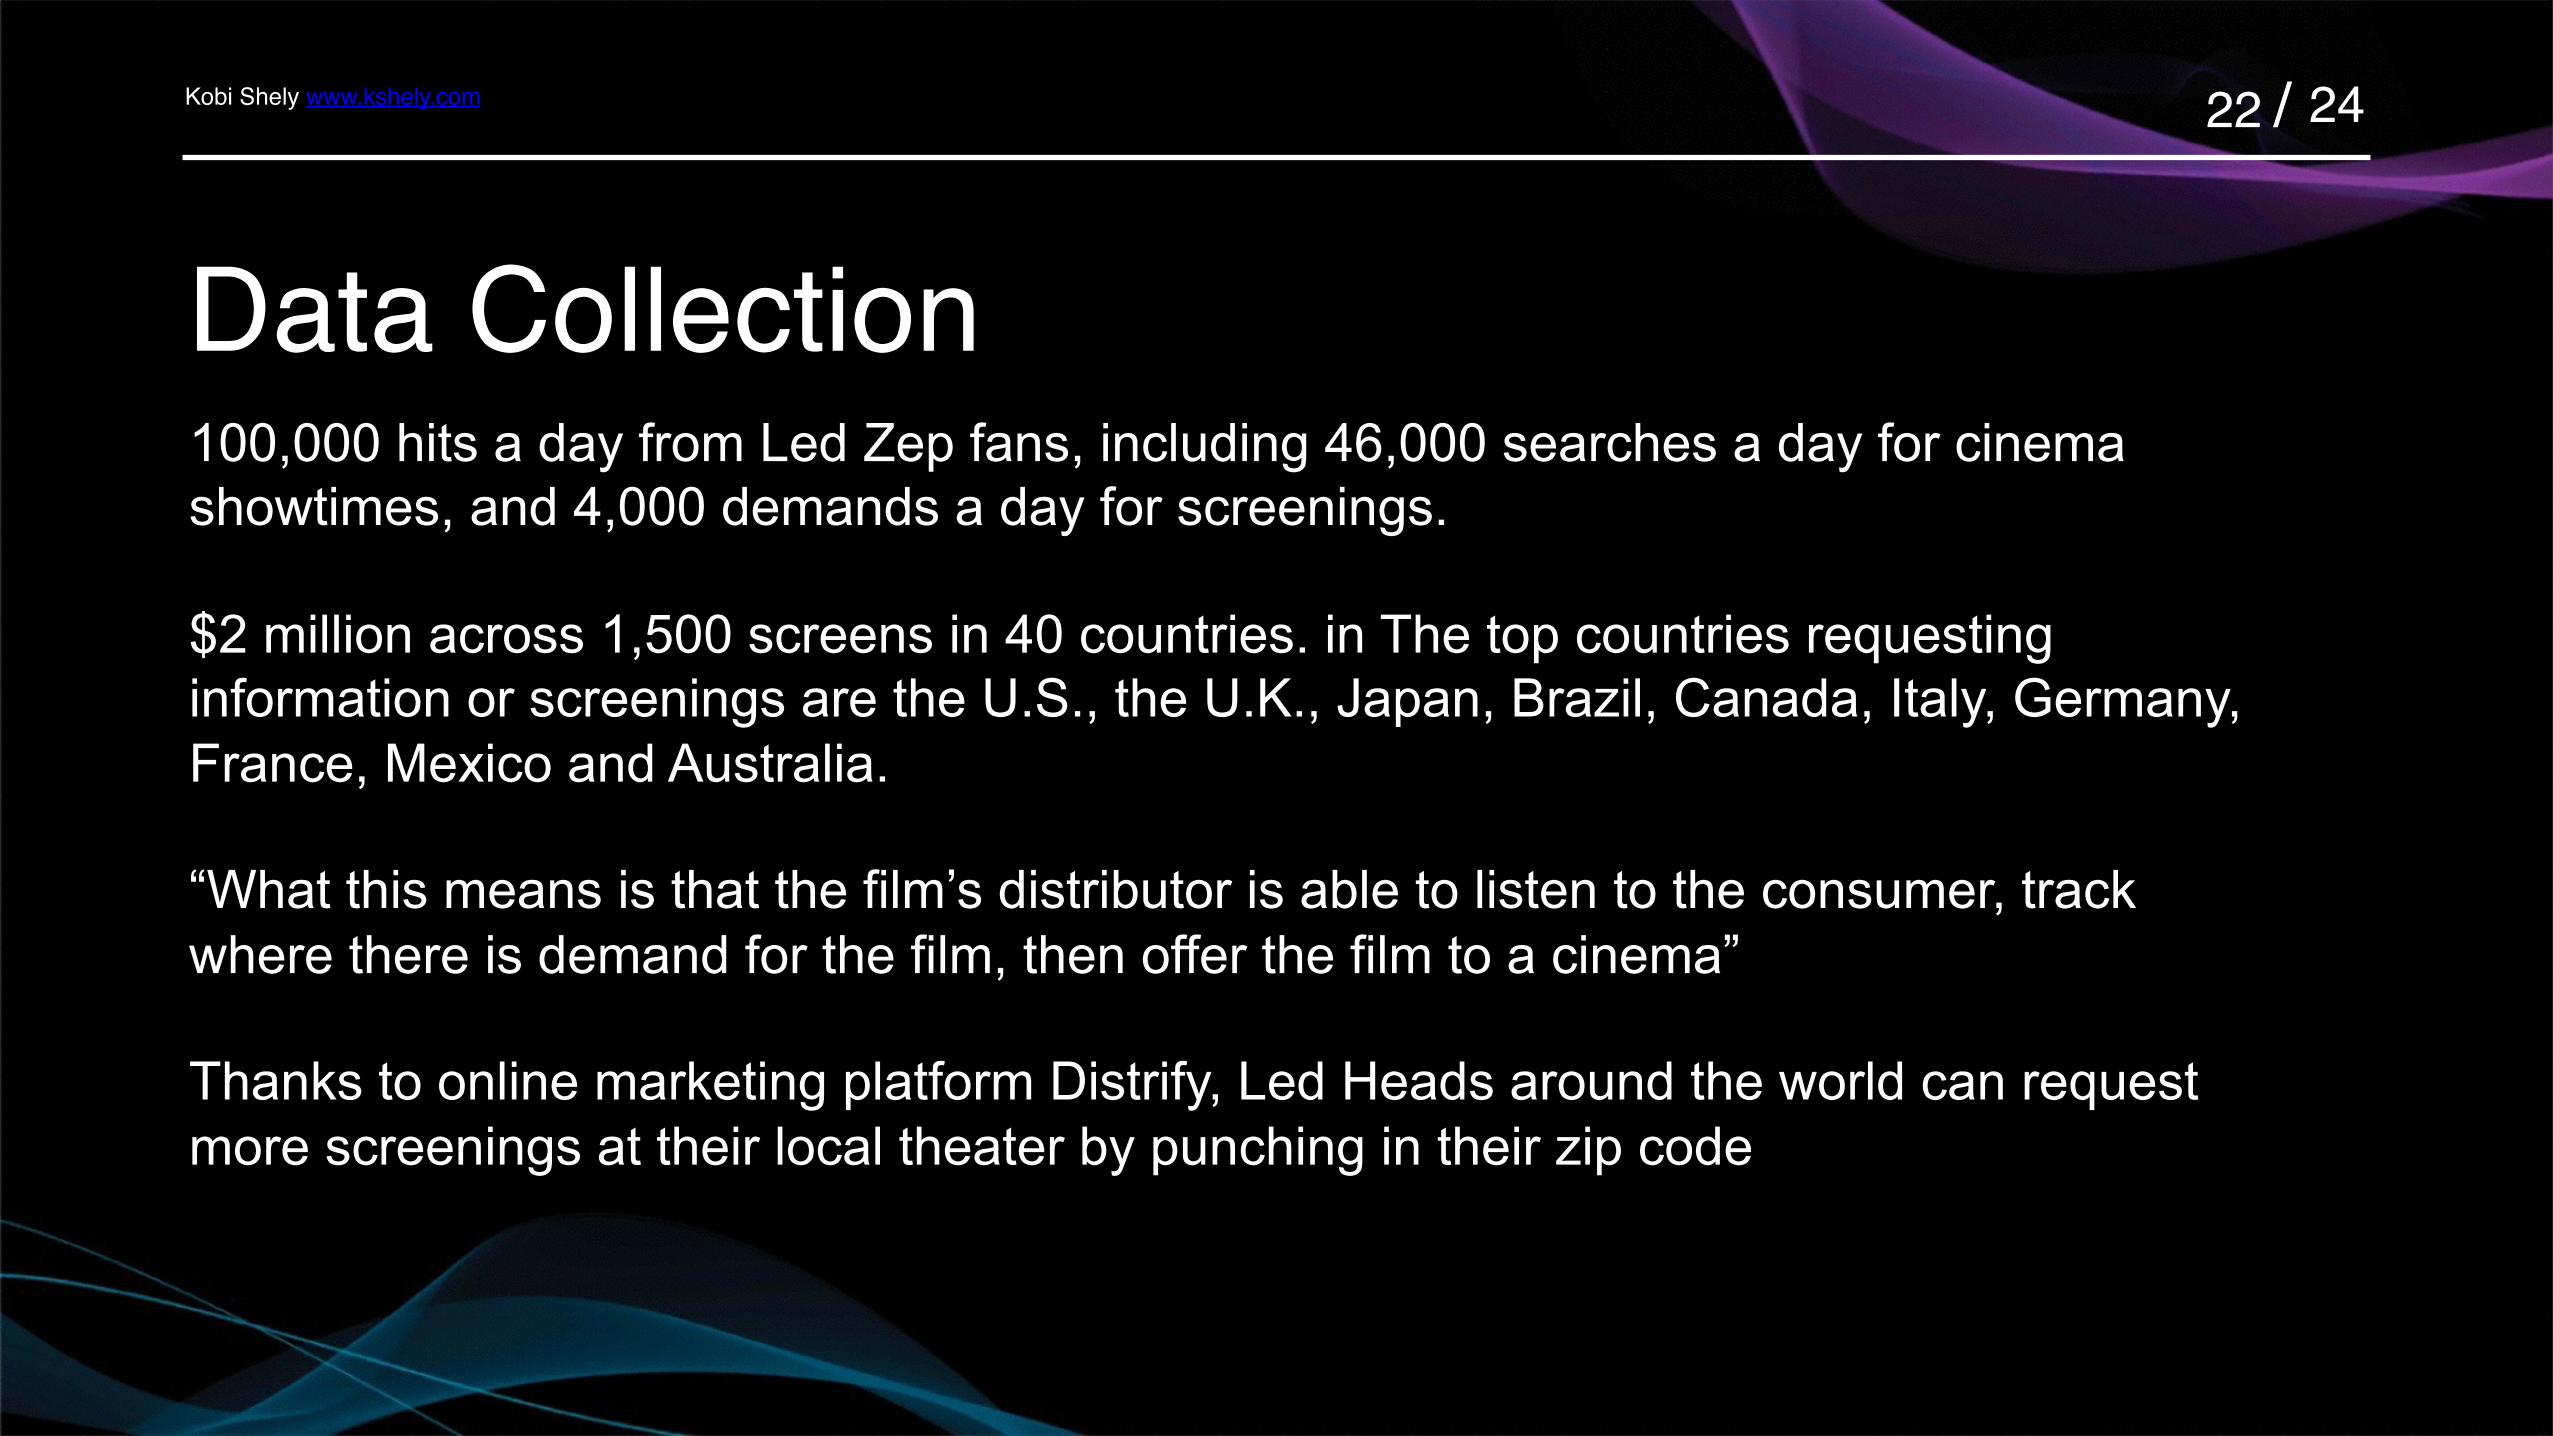
Data Collection100,000 hits a day from Led Zep fans, including 46,000 searches a day for cinema showtimes, and 4,000 demands a day for screenings.
$2 million across 1,500 screens in 40 countries. in The top countries requesting information or screenings are the U.S., the U.K., Japan, Brazil, Canada, Italy, Germany, France, Mexico and Australia.
“What this means is that the film’s distributor is able to listen to the consumer, track where there is demand for the film, then offer the film to a cinema”
Thanks to online marketing platform Distrify, Led Heads around the world can request more screenings at their local theater by punching in their zip code

Kobi Shely www.kshely.com / 2424
Showtimes Data13 Events
5,063,720 - Impressions
732,968 - Trailer Views

Kobi Shely www.kshely.com / 2425
Conversion + The Data We Don’t HaveIf a data's stored as a set of numbers, and you need to calculate sales projections, you must convert it. So the data we don't have, we can recreate it through calculations.

Kobi Shely www.kshely.com / 2426
Basic TermsImpressions - Amount Of Exposure
CTR - Click Through Rate
PC - Post Click
Unique - One user
Kobi Shely www.kshely.com / 2427
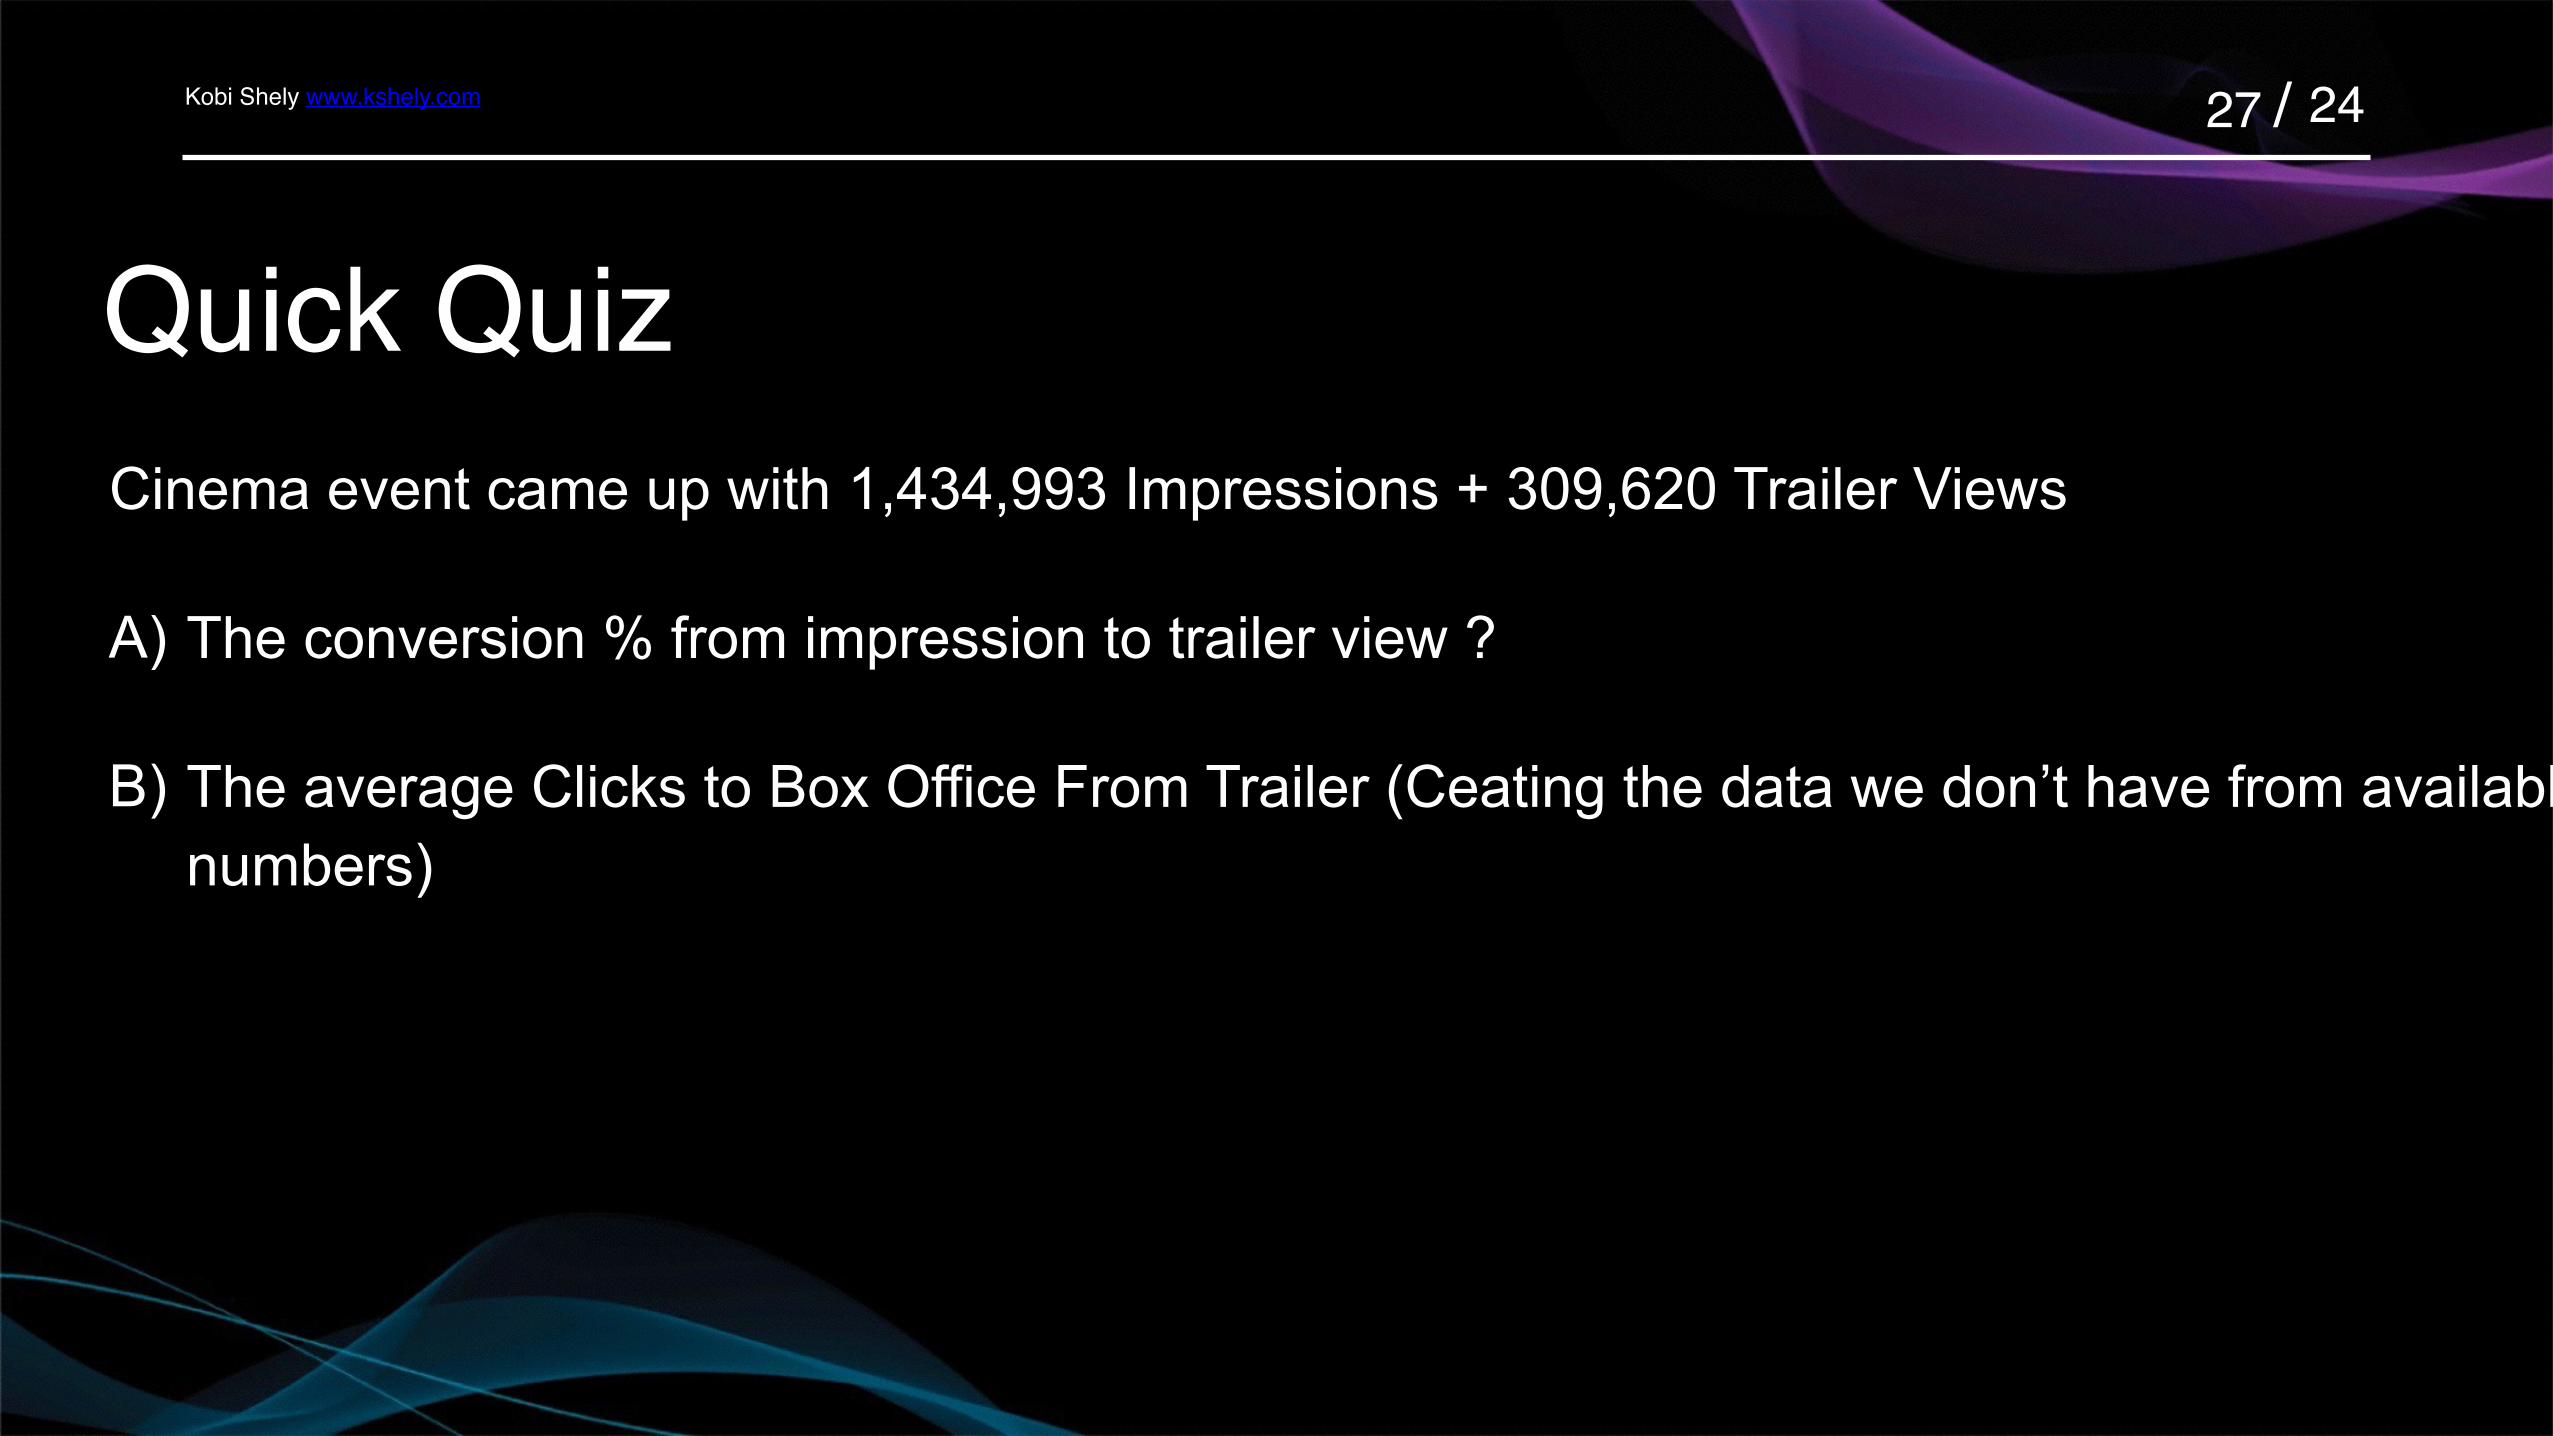
Quick QuizCinema event came up with 1,434,993 Impressions + 309,620 Trailer Views
A) The conversion % from impression to trailer view ?
B) The average Clicks to Box Office From Trailer (Ceating the data we don’t have from available numbers)

Kobi Shely www.kshely.com / 2428
Quick Quiz Solution 309,620 Trailer View
= 21.57%
28% from 309,620 Trailer View
1,434,993 Impressions/
= 86,693
Box Office Clicks Unique

Kobi Shely www.kshely.com / 2429
Trailer Data - Amount of Impressions
- Amount of Trailer Playbacks
- Conversions

Kobi Shely www.kshely.com / 2430
Data Tools To Get You StartedOnline Marketing to provide data collection, measure and optimization.

Kobi Shely www.kshely.com / 2431
Facebook Pixel Tracking Ad ManagerData Collection Available (Among Many Others) : Gender, Age, Country

Kobi Shely www.kshely.com / 2432
Gruvi Player The Film: “The Bride” (dir. Paula Ortiz, 2015)
Territory: Hollywood, Fort Lauderdale and Miami (Florida, US)
Campaign dates: 03 August - 08 August 2016
Film release date: 05 August 2016

Kobi Shely www.kshely.com / 2433
Gruvi Player Testing revealed that the most responsive audience were males and females over the age of 55 year old, and particularly those over 65.
Subsequent targeting in the campaign focused on this group. The learning in the testing were confirmed in the results of the campaign- average CTR testing: 2.41 % VS. average CTR campaign 3.91%. The same audience had a higher CTR and watched more of the video.
Throughout the campaign, another demographic group that responded well were young women (25- 34 y.o.; see table below) Video views spiked the day after the film’s premiere.

Kobi Shely www.kshely.com / 2434
Publishers Network OutbrainSee who’s reading your story
Kobi Shely www.kshely.com / 2435
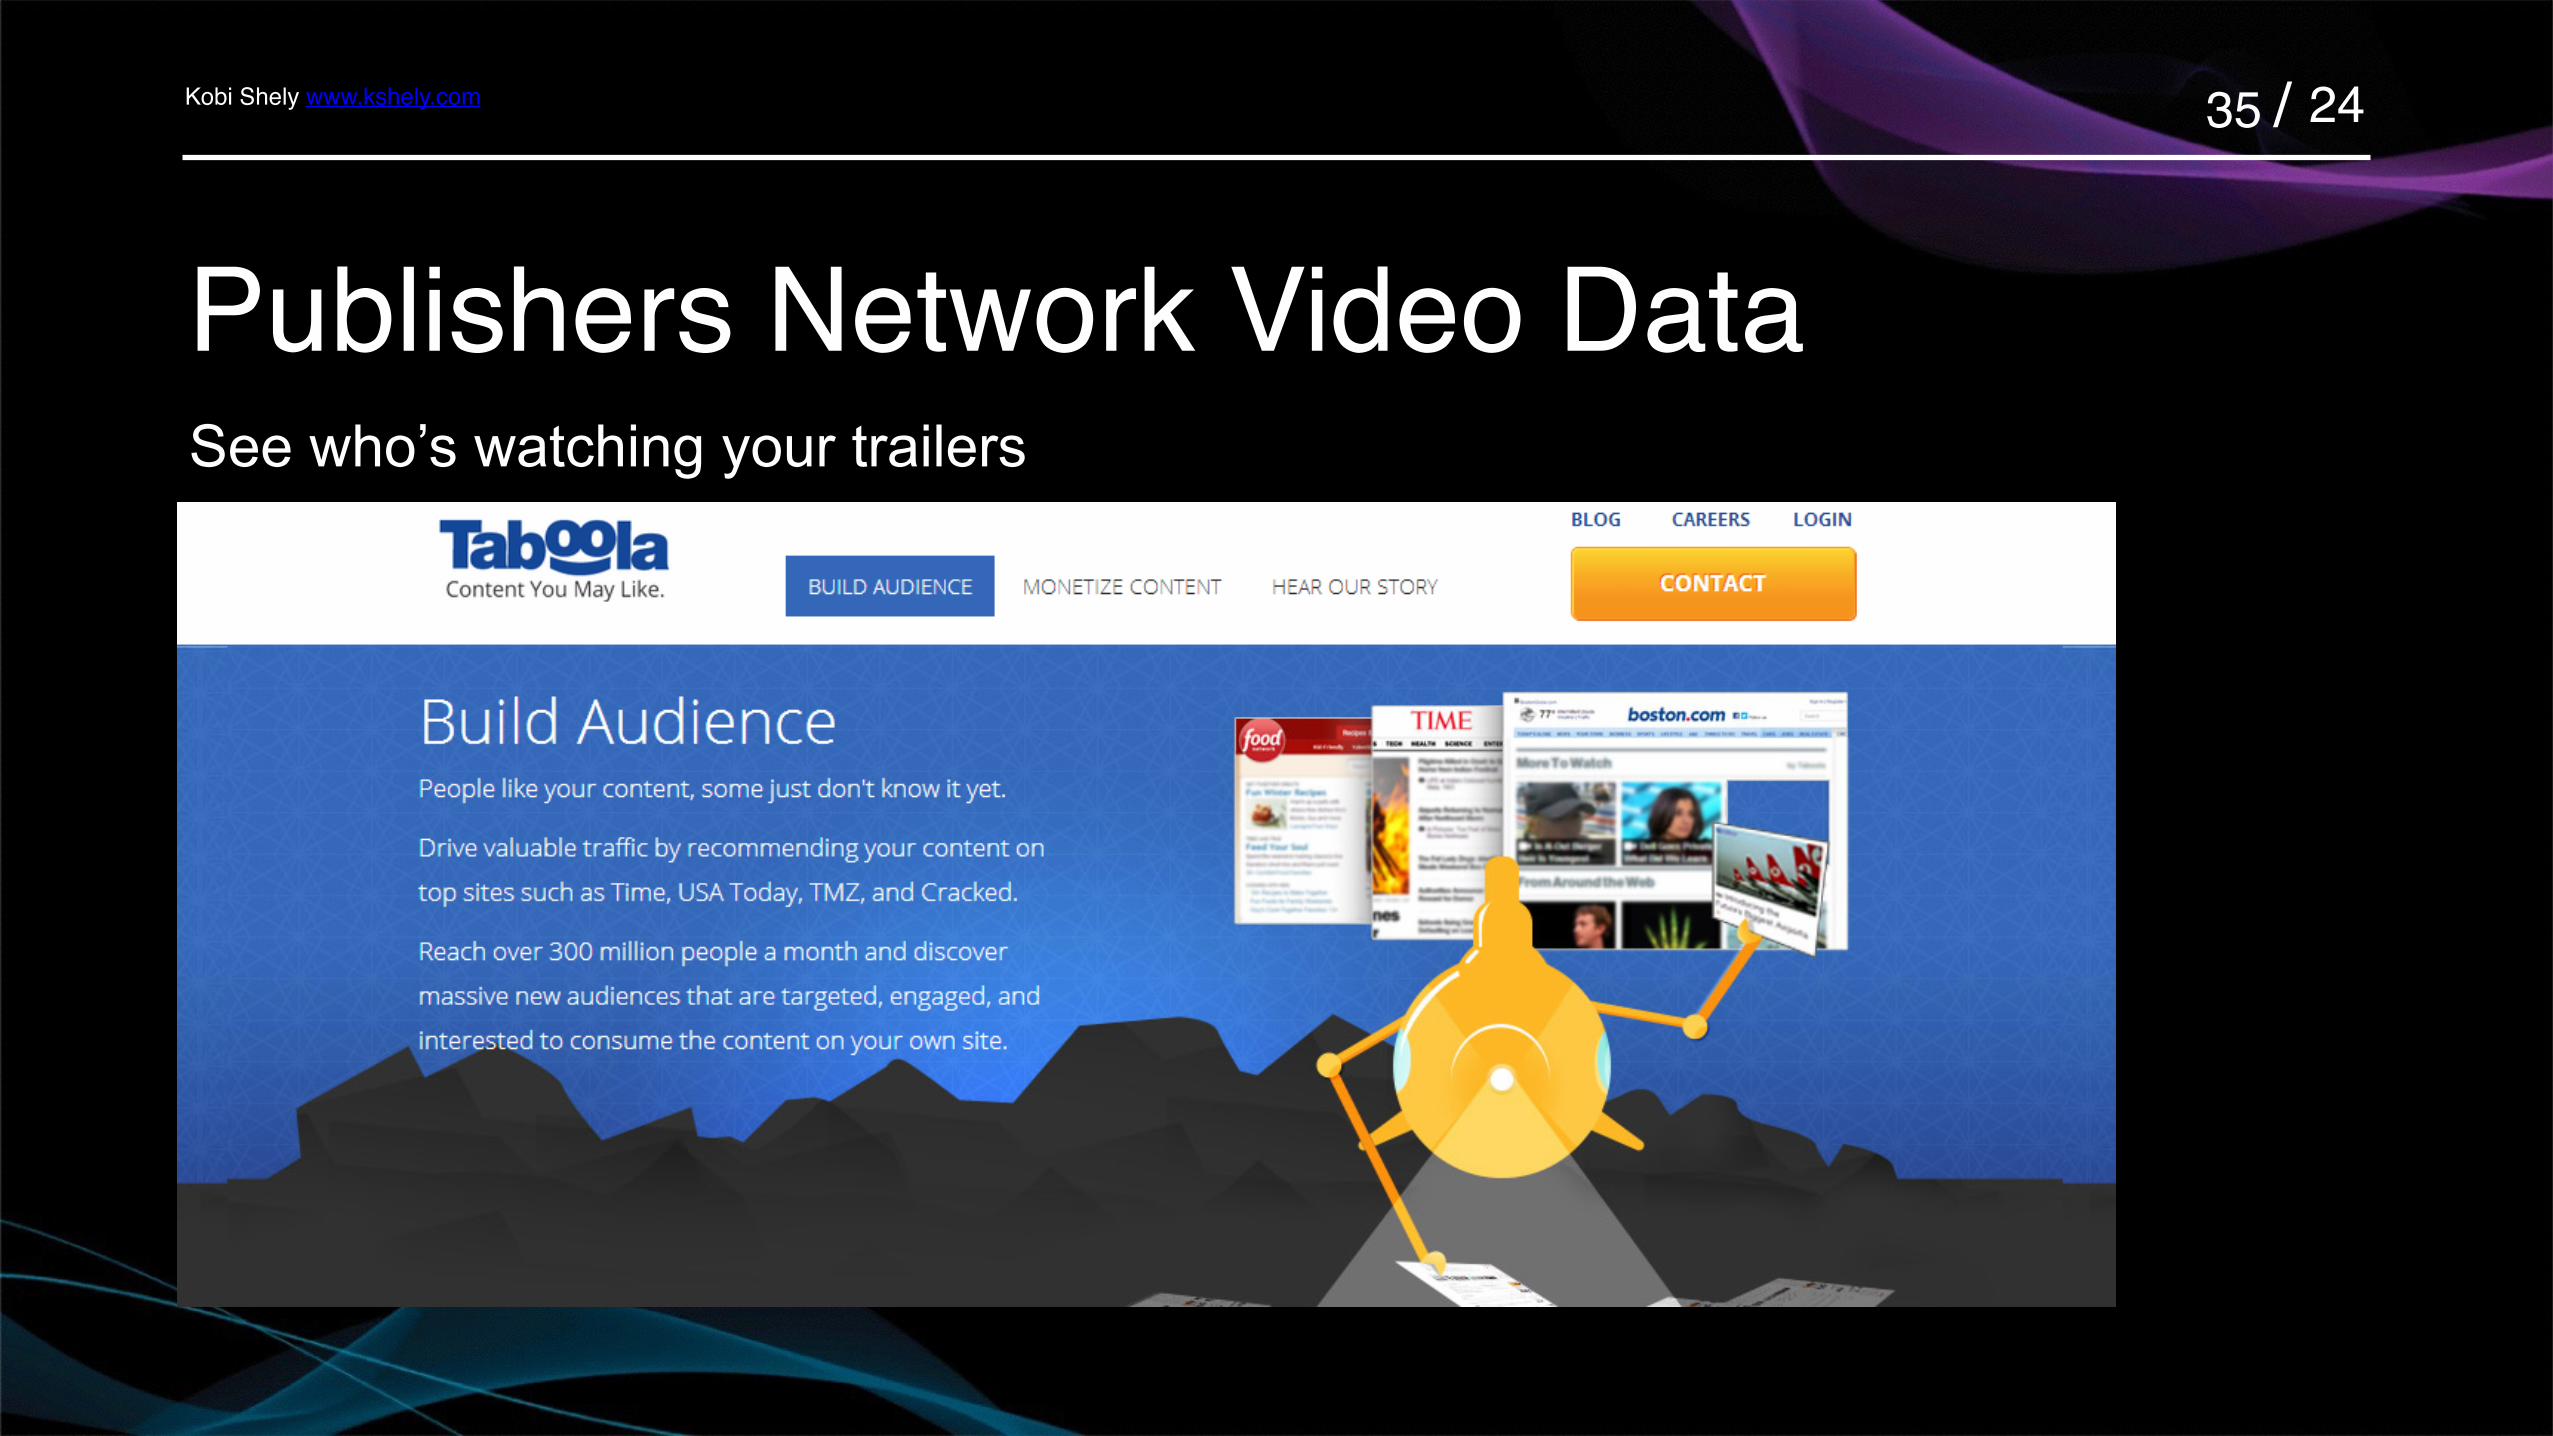
Publishers Network Video DataSee who’s watching your trailers
Kobi Shely www.kshely.com / 2436
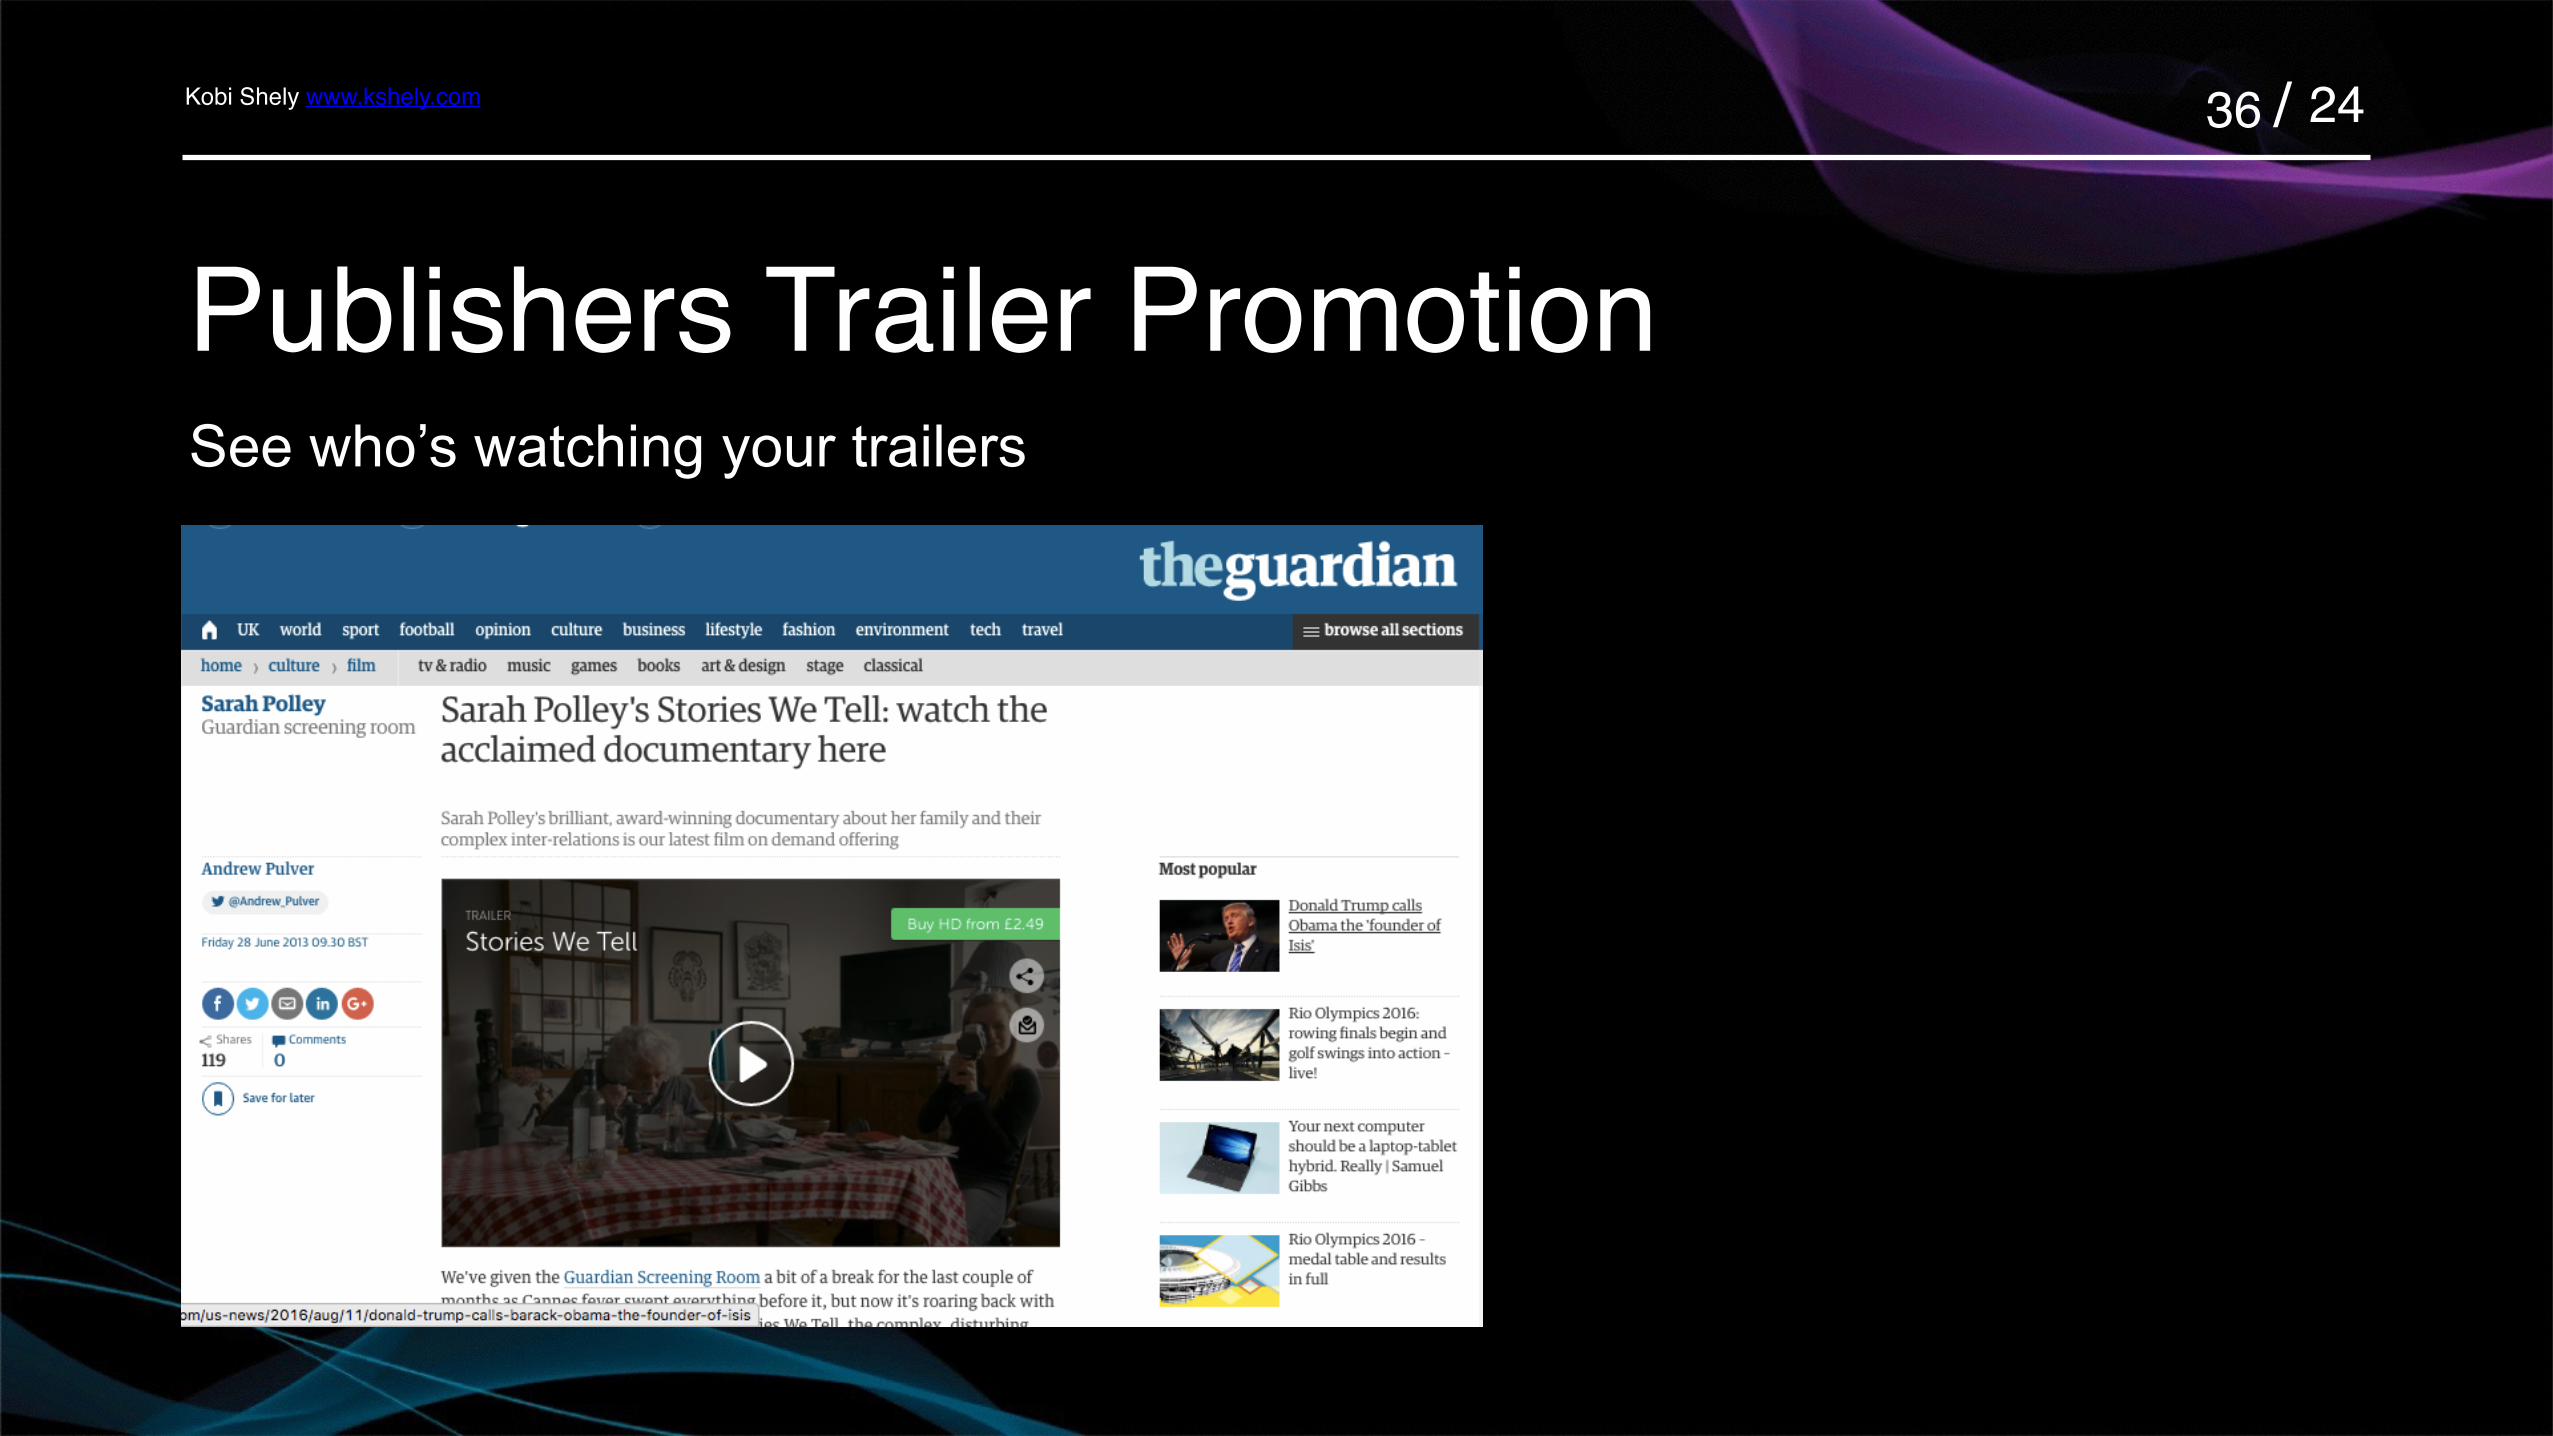
Publishers Trailer Promotion See who’s watching your trailers

Kobi Shely www.kshely.com / 2437
Landing Page For Your Film

Kobi Shely www.kshely.com / 2438
Landing Page For Your Film

Kobi Shely www.kshely.com / 2439
Landing Page For Your Film

Kobi Shely www.kshely.com / 2441
Email MarketingData Collection Available (Among Many Others) : Gender, Age, Country
Kobi Shely www.kshely.com / 2442
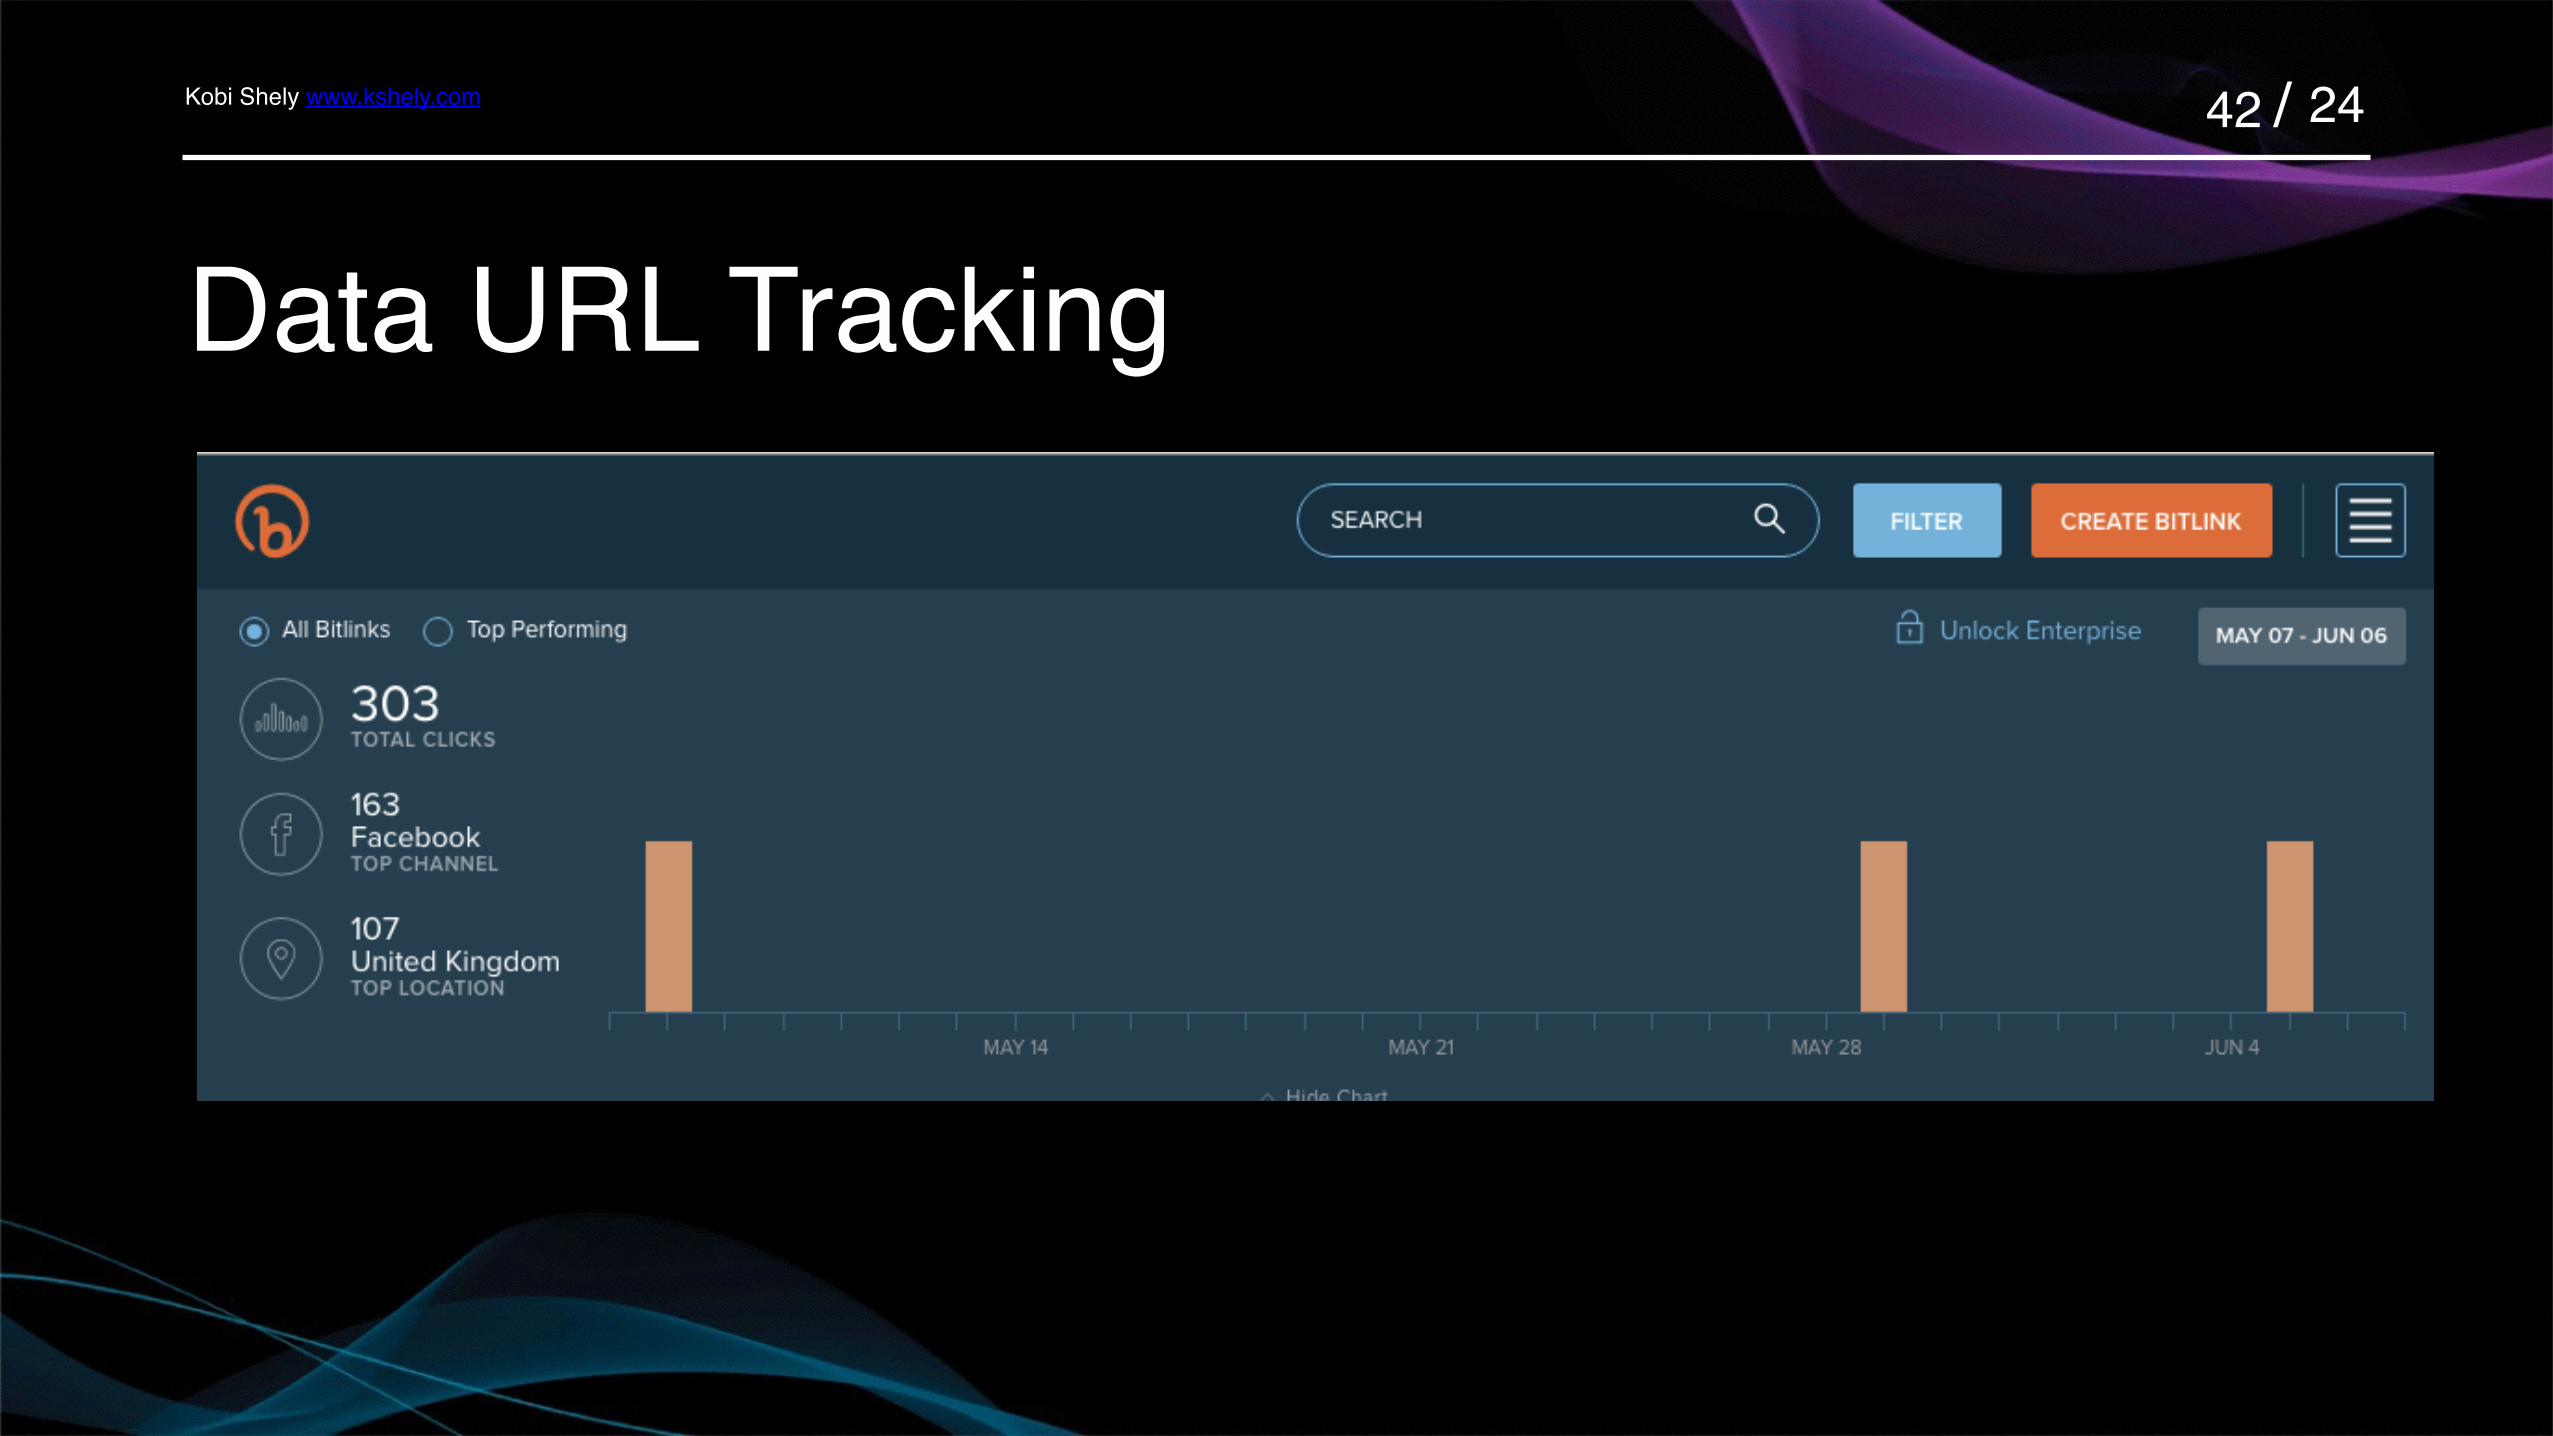
Data URL Tracking

Kobi Shely www.kshely.com / 2445
thank you!for more Informationcontact me @ [email protected]: kobishelySkype: Kobi Shely