Embed Size (px)
Citation preview
Comparing hard-linking (TIMES-MSA) and soft-linking (TIMES-HERMES) methodologies for quantifying economic impacts of mitigation
Maurizio Gargiulo a,b, John Curtis c, James Glynn b, JohnFitzgerald c, Brian Ó’Gallachóir b
a E4SMA Srl, Turin, Italy.
B Environmental Research Institute, University College Cork, Cork, Ireland.
C Economic and Social Research Institute, Dublin, Ireland.
Outline
• Introduction
• Methodological approach
• Results
• Conclusions
• Next steps
2
3
Introduction
• Assess and develop possible linkages between energy and economycomparing different approaches for quantifying the economicimpacts of mitigation.
• The two models are IrishTIMES and HERMES model.
• The analysis takes as a starting point the non-ETS emissionsreduction results (22% below 2005 levels by 2030) for Ireland fromthe EU 2030 Climate and Energy Policy Framework.
• HERMES is a complete structural model of the Irish economy firstdeveloped in the late 1980s – Irish sub-model of EC HERMES project.• Firms minimise their cost of production/maximise profits• Households maximise their utility• World economy exogenous via NIESR’s NiGEM model• More Info: http://www.esri.ie/pubs/WP460.pdf
4
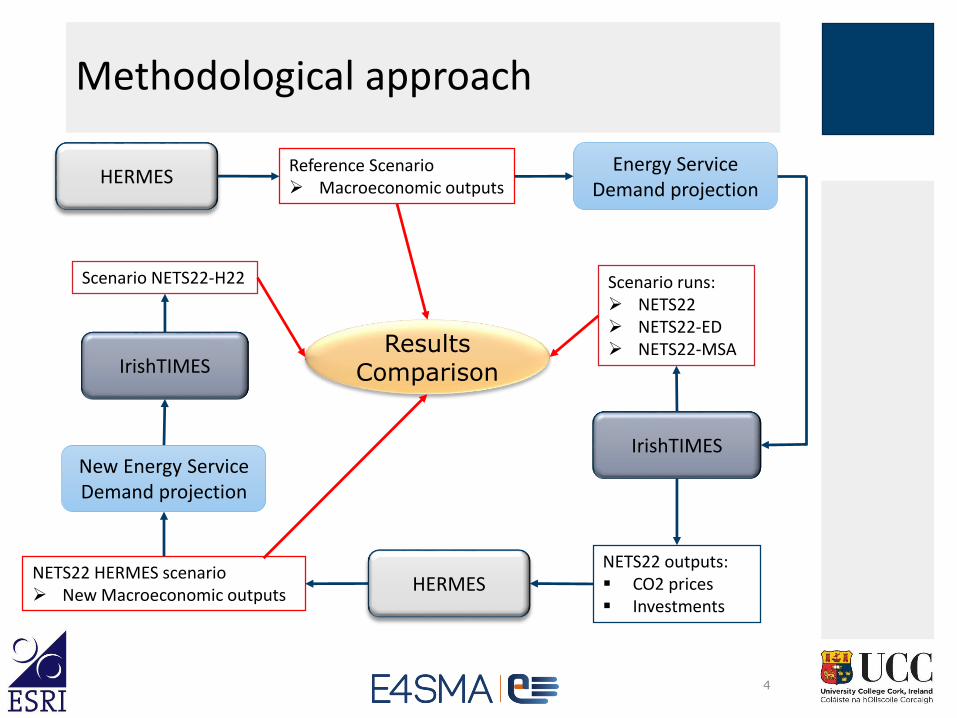
Methodological approach
HERMES Reference Scenario Macroeconomic outputs
IrishTIMES
Energy Service Demand projection
Scenario runs: NETS22 NETS22-ED NETS22-MSA
NETS22 outputs: CO2 prices Investments
NETS22 HERMES scenario New Macroeconomic outputs
New Energy Service Demand projection
HERMES
IrishTIMES
Scenario NETS22-H22
Results Comparison
5
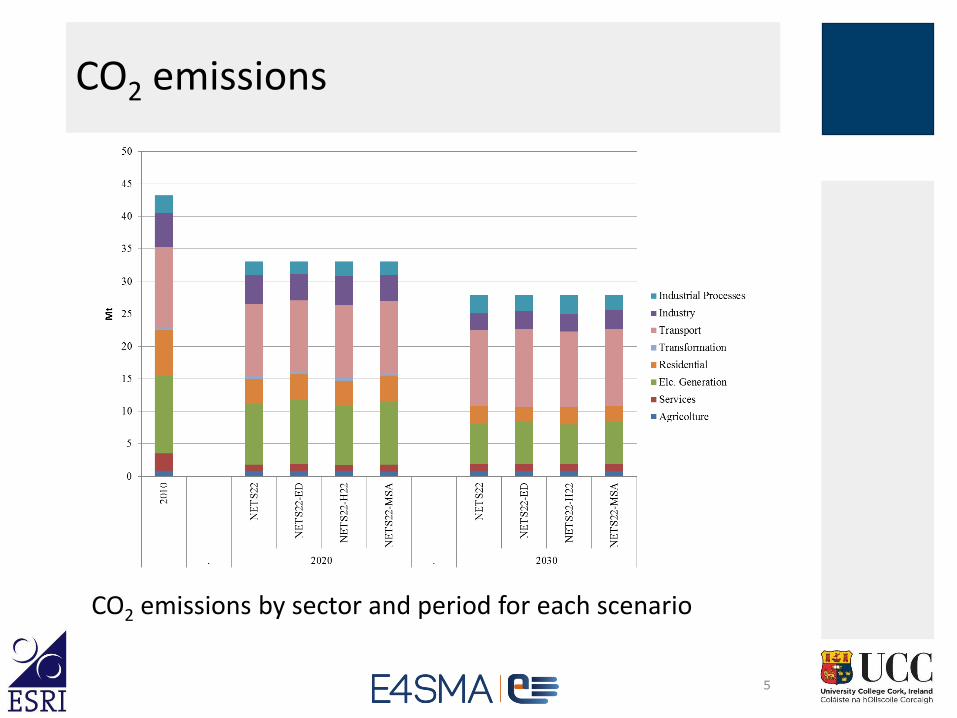
CO2 emissions
CO2 emissions by sector and period for each scenario
6
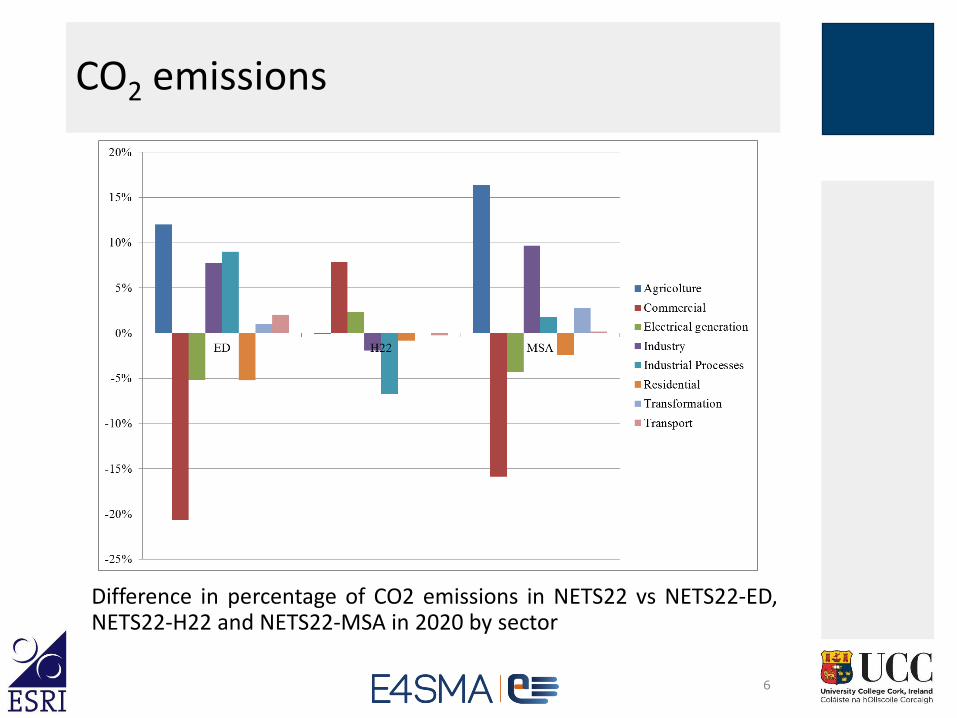
CO2 emissions
Difference in percentage of CO2 emissions in NETS22 vs NETS22-ED,NETS22-H22 and NETS22-MSA in 2020 by sector
7
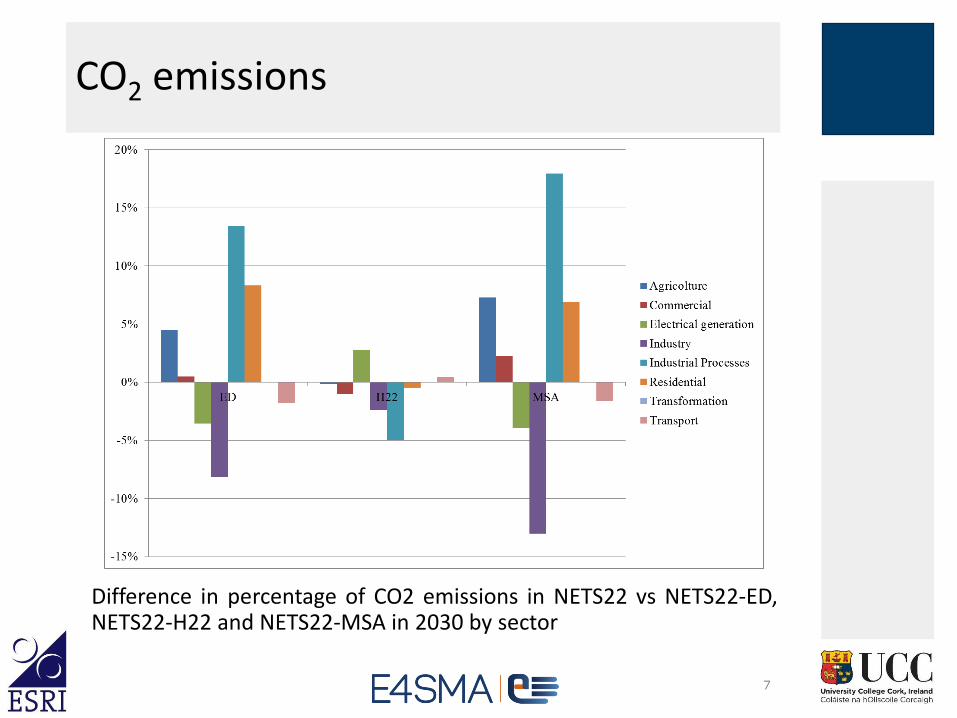
CO2 emissions
Difference in percentage of CO2 emissions in NETS22 vs NETS22-ED,NETS22-H22 and NETS22-MSA in 2030 by sector
8
Energy service demand indexes
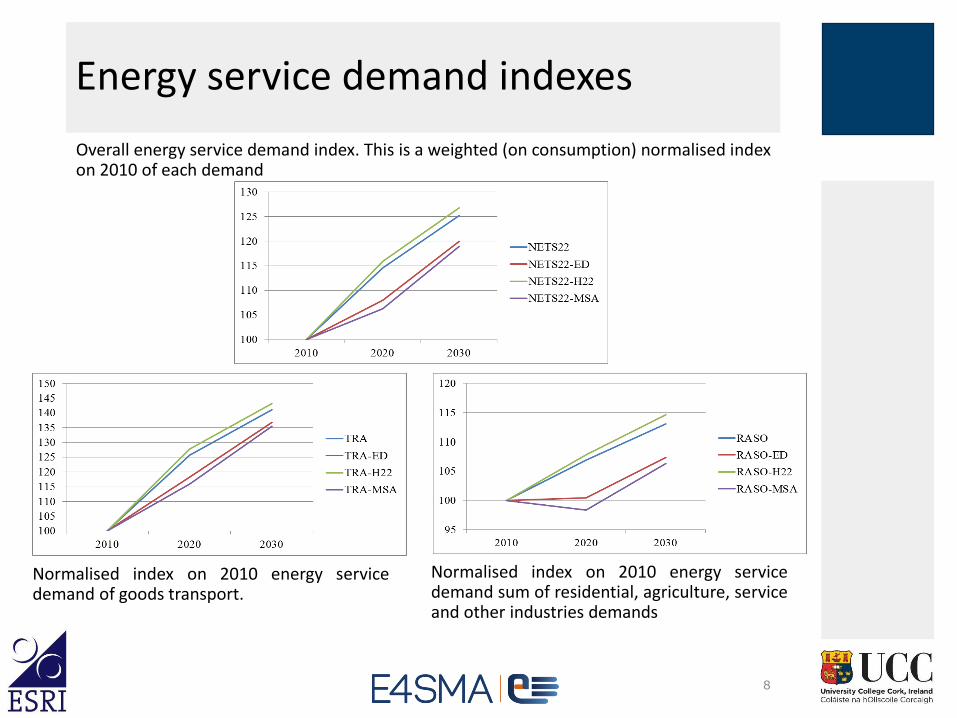
Overall energy service demand index. This is a weighted (on consumption) normalised indexon 2010 of each demand
Normalised index on 2010 energy servicedemand sum of residential, agriculture, serviceand other industries demands
Normalised index on 2010 energy servicedemand of goods transport.
9
Energy system pathway changes
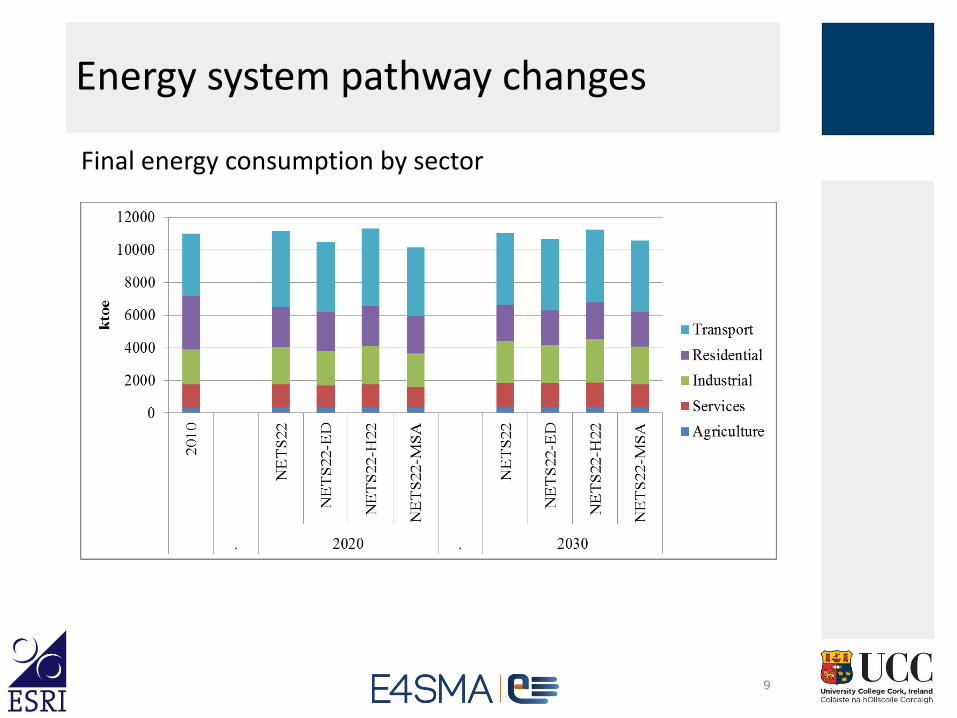
Final energy consumption by sector
10
Energy system pathway changes
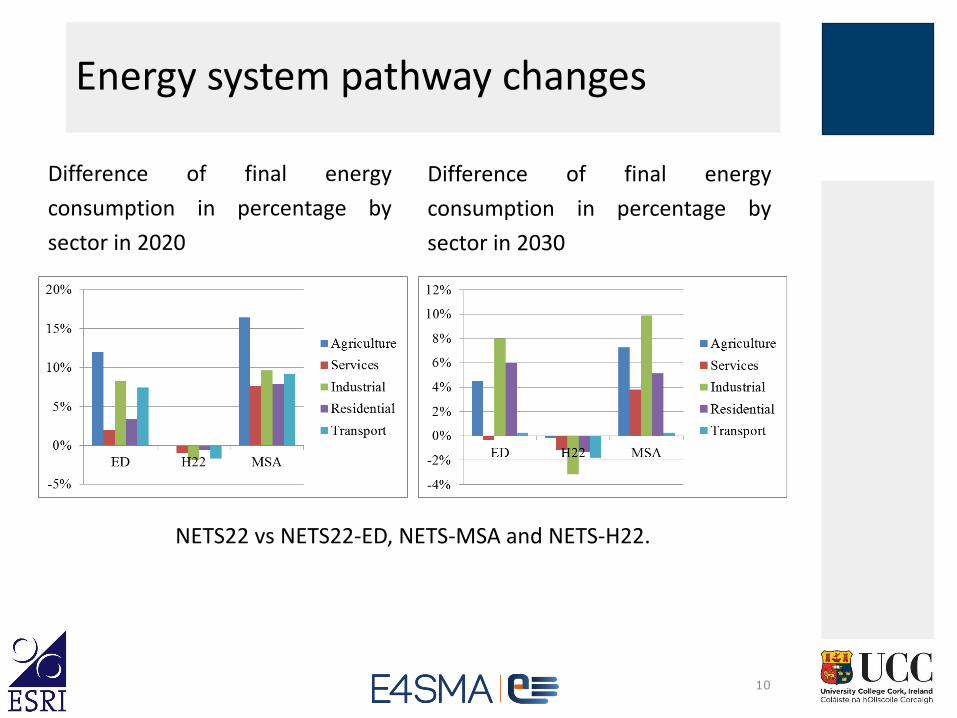
Difference of final energy
consumption in percentage by
sector in 2020
NETS22 vs NETS22-ED, NETS-MSA and NETS-H22.
Difference of final energy
consumption in percentage by
sector in 2030
11
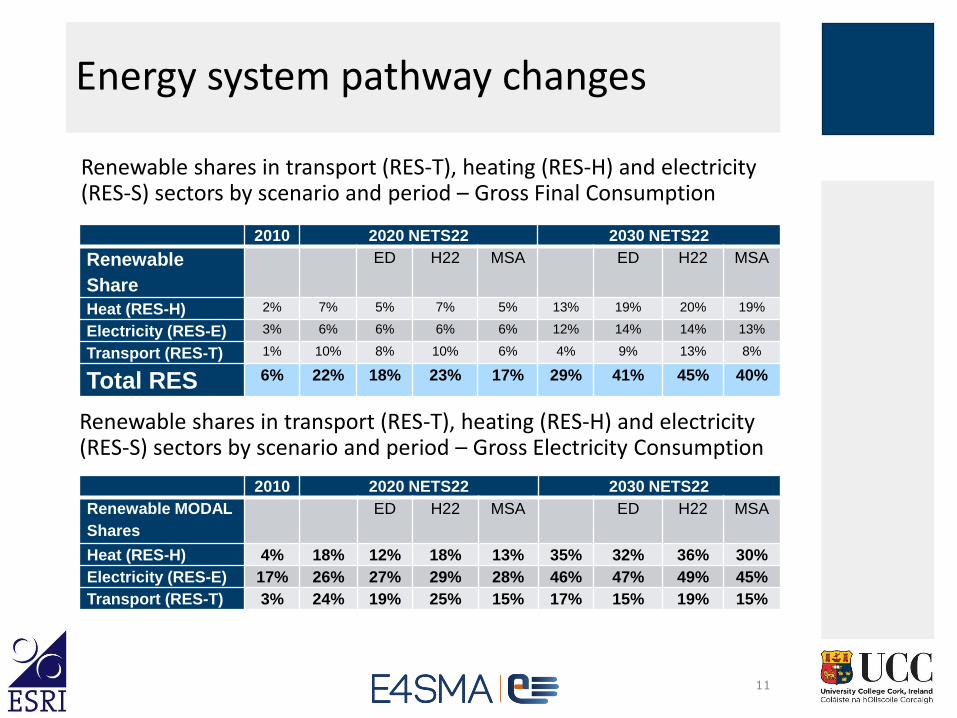
Energy system pathway changes
Renewable shares in transport (RES-T), heating (RES-H) and electricity (RES-S) sectors by scenario and period – Gross Final Consumption
2010 2020 NETS22 2030 NETS22
Renewable
Share
ED H22 MSA ED H22 MSA
Heat (RES-H) 2% 7% 5% 7% 5% 13% 19% 20% 19%
Electricity (RES-E) 3% 6% 6% 6% 6% 12% 14% 14% 13%
Transport (RES-T) 1% 10% 8% 10% 6% 4% 9% 13% 8%
Total RES 6% 22% 18% 23% 17% 29% 41% 45% 40%
Renewable shares in transport (RES-T), heating (RES-H) and electricity (RES-S) sectors by scenario and period – Gross Electricity Consumption
2010 2020 NETS22 2030 NETS22
Renewable MODAL
Shares
ED H22 MSA ED H22 MSA
Heat (RES-H) 4% 18% 12% 18% 13% 35% 32% 36% 30%
Electricity (RES-E) 17% 26% 27% 29% 28% 46% 47% 49% 45%
Transport (RES-T) 3% 24% 19% 25% 15% 17% 15% 19% 15%
12
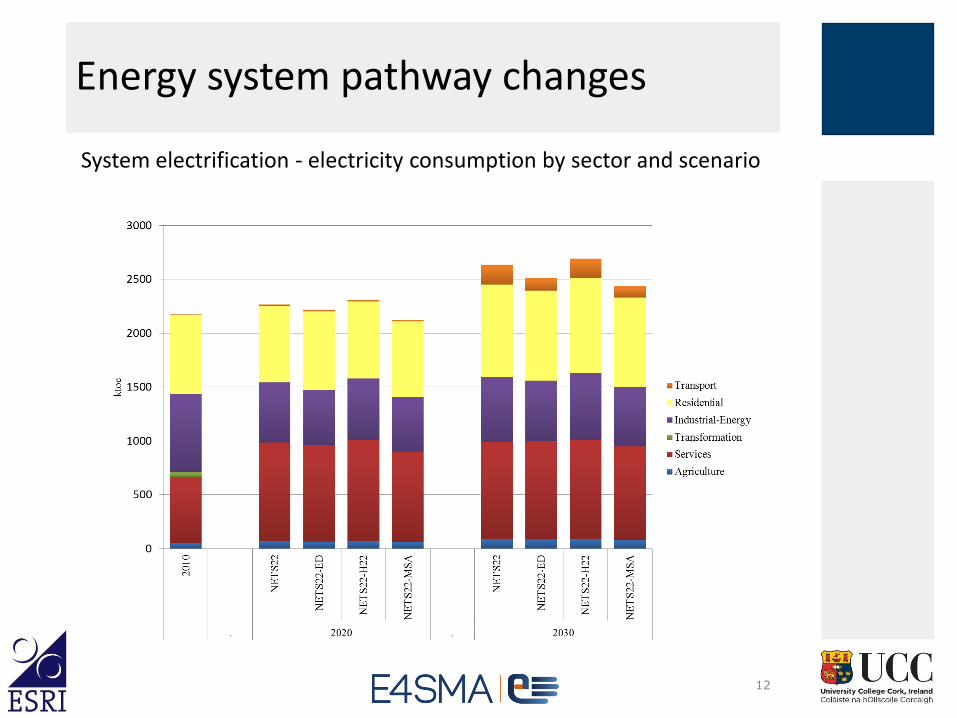
Energy system pathway changes
System electrification - electricity consumption by sector and scenario
13
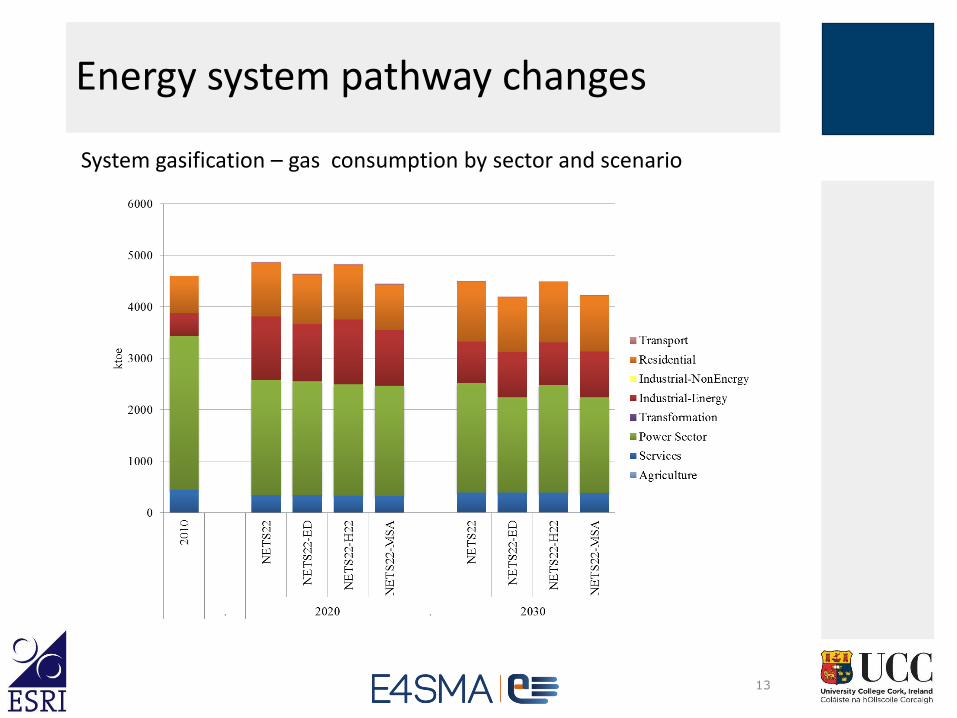
Energy system pathway changes
System gasification – gas consumption by sector and scenario
14
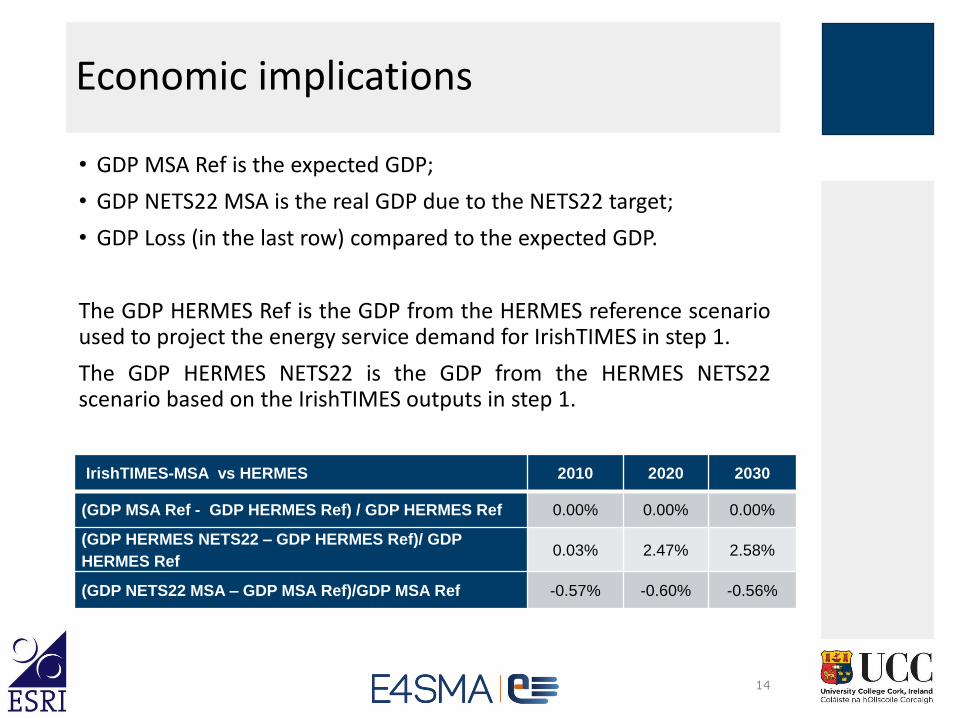
Economic implications
• GDP MSA Ref is the expected GDP;
• GDP NETS22 MSA is the real GDP due to the NETS22 target;
• GDP Loss (in the last row) compared to the expected GDP.
The GDP HERMES Ref is the GDP from the HERMES reference scenarioused to project the energy service demand for IrishTIMES in step 1.
The GDP HERMES NETS22 is the GDP from the HERMES NETS22scenario based on the IrishTIMES outputs in step 1.
IrishTIMES-MSA vs HERMES 2010 2020 2030
(GDP MSA Ref - GDP HERMES Ref) / GDP HERMES Ref 0.00% 0.00% 0.00%
(GDP HERMES NETS22 – GDP HERMES Ref)/ GDP
HERMES Ref0.03% 2.47% 2.58%
(GDP NETS22 MSA – GDP MSA Ref)/GDP MSA Ref -0.57% -0.60% -0.56%
15
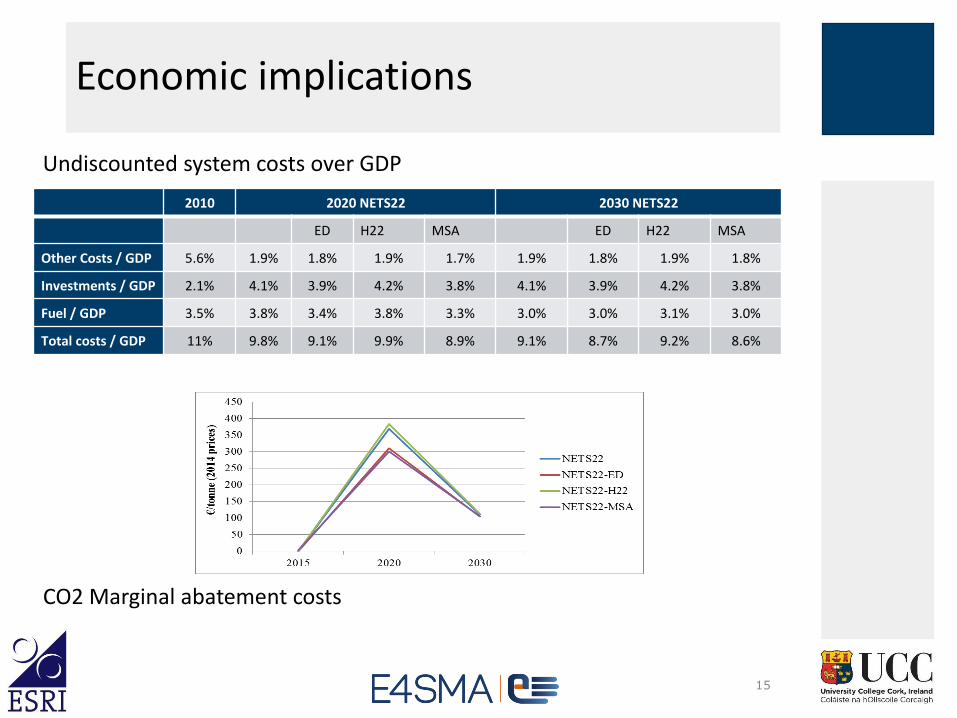
Economic implications
Undiscounted system costs over GDP
2010 2020 NETS22 2030 NETS22
ED H22 MSA ED H22 MSA
Other Costs / GDP 5.6% 1.9% 1.8% 1.9% 1.7% 1.9% 1.8% 1.9% 1.8%
Investments / GDP 2.1% 4.1% 3.9% 4.2% 3.8% 4.1% 3.9% 4.2% 3.8%
Fuel / GDP 3.5% 3.8% 3.4% 3.8% 3.3% 3.0% 3.0% 3.1% 3.0%
Total costs / GDP 11% 9.8% 9.1% 9.9% 8.9% 9.1% 8.7% 9.2% 8.6%
CO2 Marginal abatement costs
Conclusions
• The results presented show energy service demands areaffected by: Price response - Irish TIMES-ED and
Full macroeconomic feedback - Irish TIMES-MSA and IrishTIMES-HERMES.
• The results show the different impacts on GDP generatedby Irish TIMES-MSA and Irish TIMES-HERMES.
In particular: Irish TIMES-MSA models a GDP contraction associated
with mitigation,
Irish TIMES-HERMES models a GDP growth due economicstimulus provided by revenue recycling of the carbon taxto reduce labour taxes.
16
Next Steps
• The next Steps will include new runs with HERMES model
variants (e.g. labour tax offset).
• Better understanding of MSA results VS HERMES/COSMOS
Ireland has low energy intensity per Gross value added in
both industry and services relative to other EU countries.
A structural model (like HERMES/COSMO) may give
greater insight that a production function model (MSA) ??
17
Thank You
www.ucc.ie/energypolicy
18
E4SMA S.r.l., www.e4sma.com
www.linkedin.com/company/e4sma https://twitter.com/E4SMAsrl


![[Hermes] Corpus Hermeticum](https://img.pdfslide.us/doc/110x75/55cf993f550346d0339c5f29/hermes-corpus-hermeticum.jpg)