Embed Size (px)
Citation preview
Clustering: A Scikit-Learn TutorialDamian Mingle
About Me
• Chief Data Scientist, WPC Healthcare• Speaker• Researcher• Writer
Outline• What is k-means clustering?
• How does it work?• When is it appropriate to use it?
• K-means clustering in scikit-learn• Basic• Basic with adjustments
Clustering• It is unsupervised learning (inferring a function to describe not so obvious structures from unlabeled data)
• Groups data objects• Measures distance between data points• Helps in examining the data
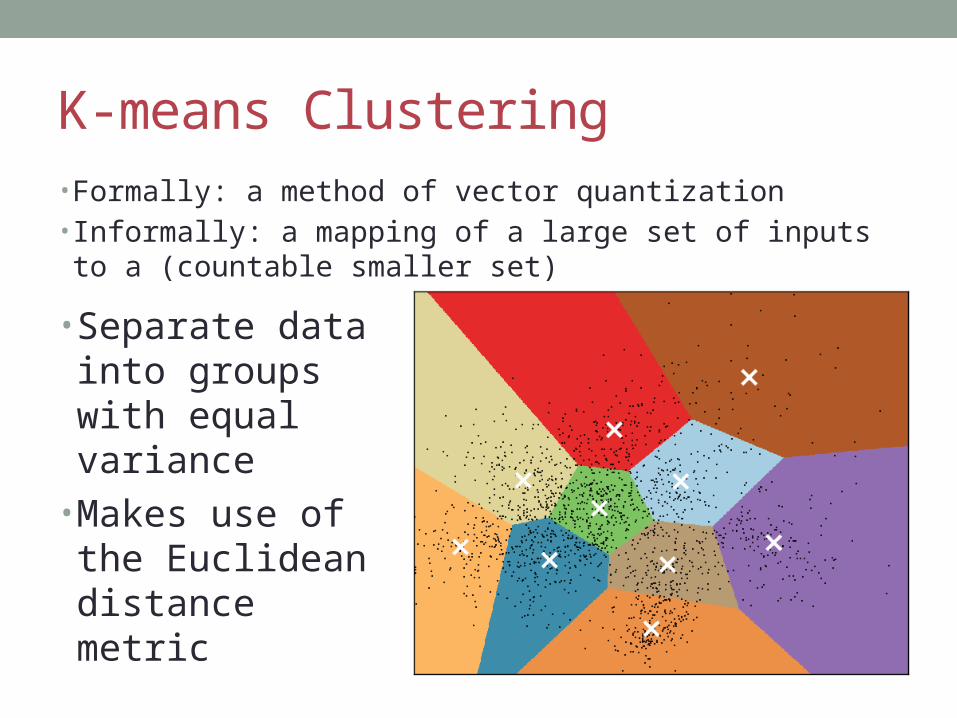
K-means Clustering• Formally: a method of vector quantization• Informally: a mapping of a large set of inputs to a (countable
smaller set)
• Separate data into groups with equal variance
• Makes use of the Euclidean distance metric
K-means ClusteringRepeats refinement
Three basic steps:• Step 1: Choose k (how many groups)• Repeat over:
• Step 2: Assignment (labeling data as part of a group)• Step 3: Update
This process continues until its goal is reached
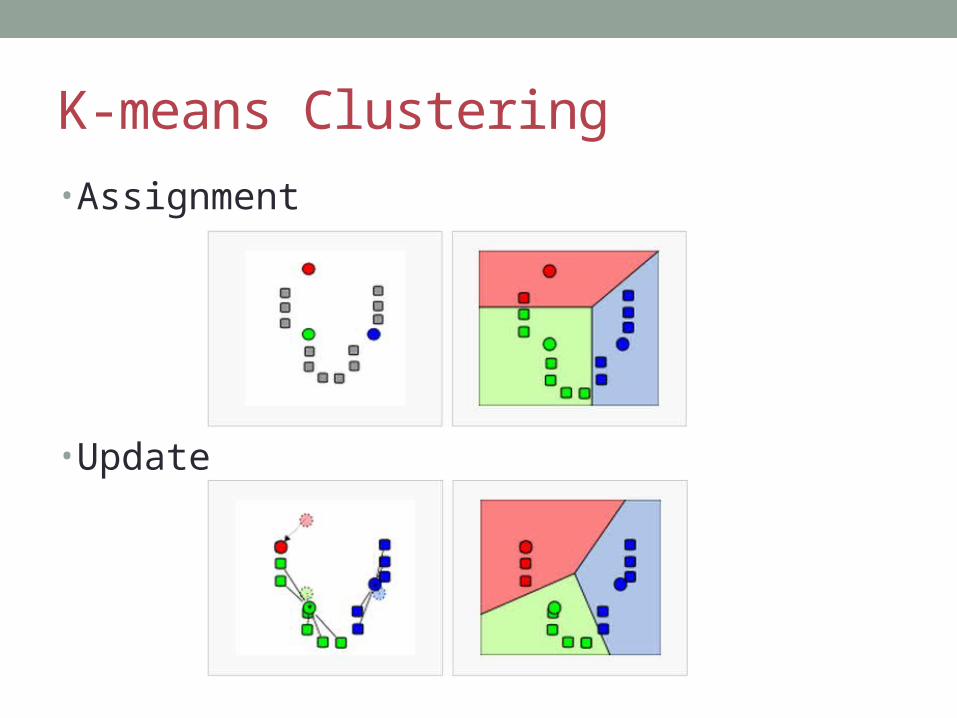
K-means Clustering• Assignment
• Update
K-means Clustering• Advantages
• Large data accepted• Fast• Will always find a solution
• Disadvantages• Choosing the wrong number of groups• You reach a local optima not a global
K-means Clustering• When to use
• Normally distributed data• Large number of samples• Not too many clusters• Distance can be measured in a linear fashion
Scikit-Learn• Python • Open-source machine learning library• Very well documented
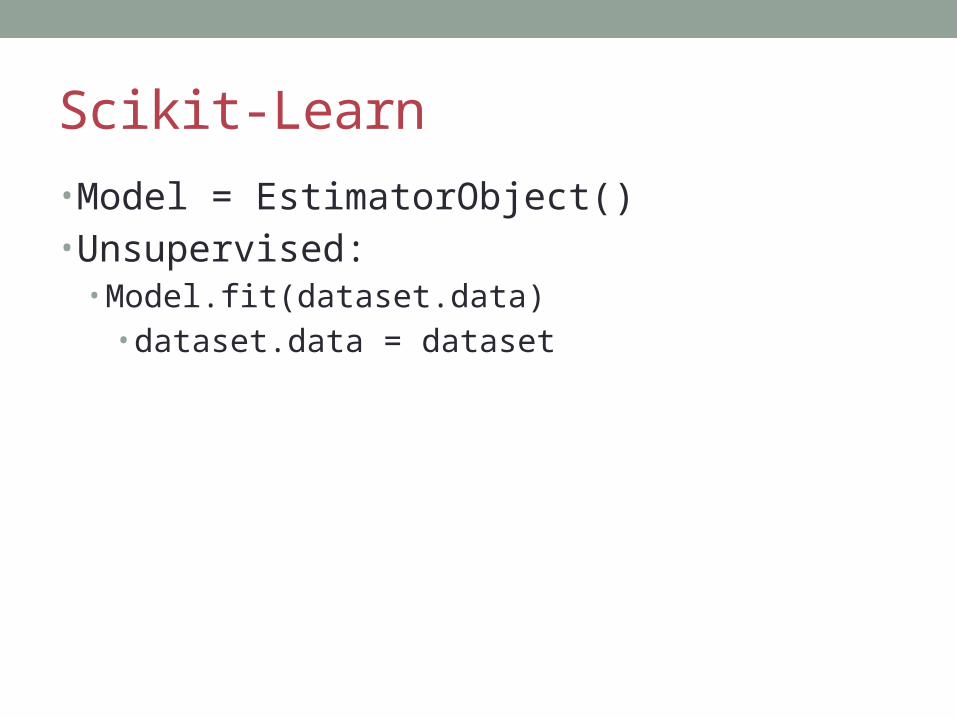
Scikit-Learn• Model = EstimatorObject()• Unsupervised:
• Model.fit(dataset.data)• dataset.data = dataset
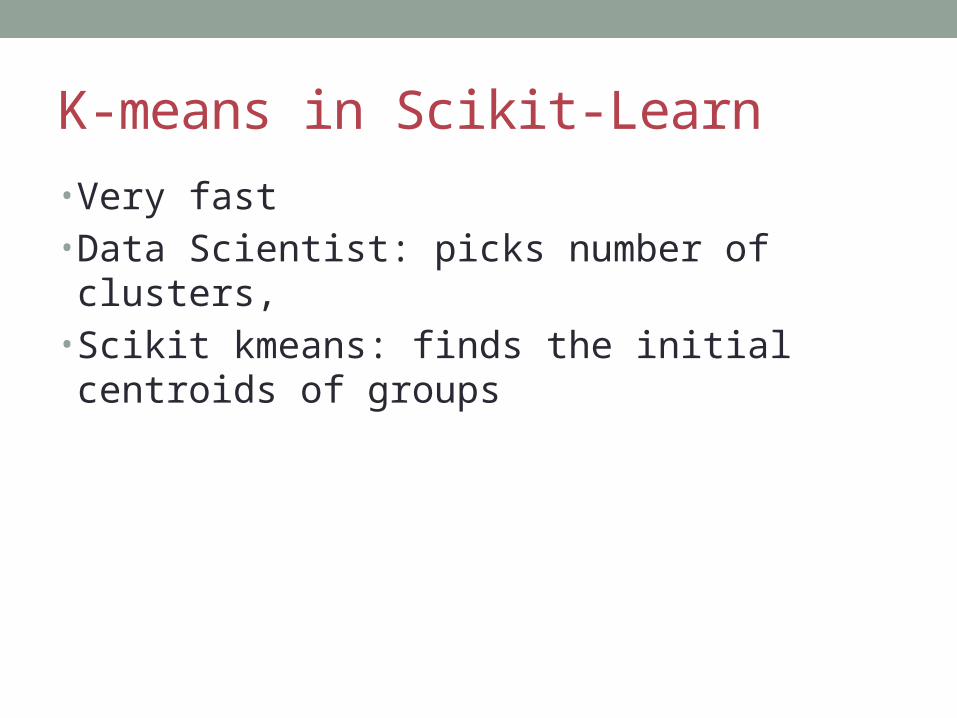
K-means in Scikit-Learn• Very fast• Data Scientist: picks number of clusters, • Scikit kmeans: finds the initial centroids of groups
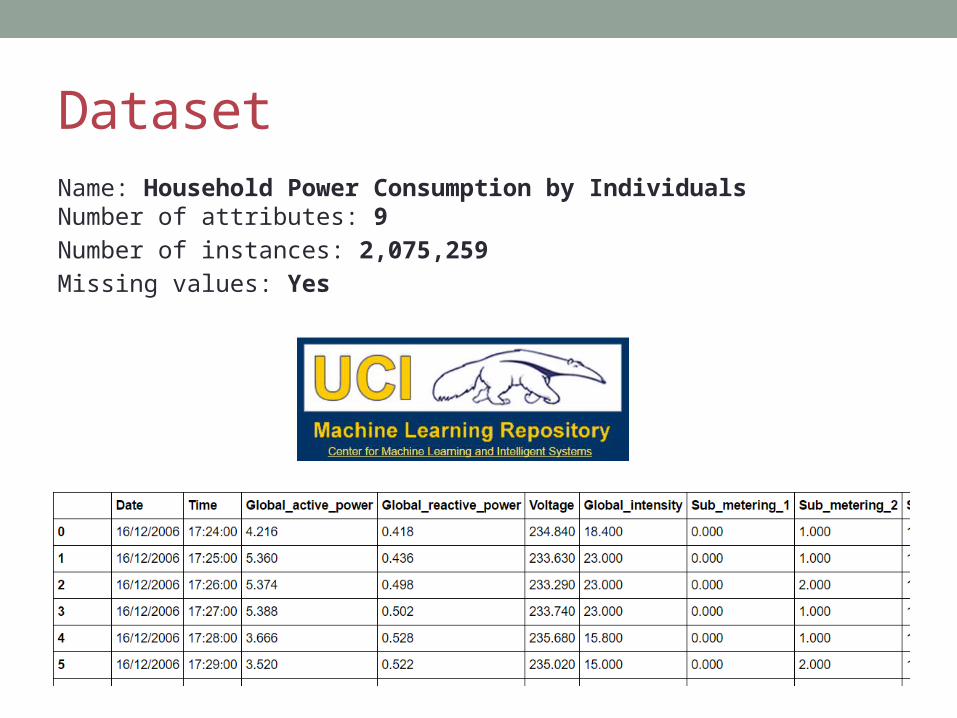
DatasetName: Household Power Consumption by IndividualsNumber of attributes: 9Number of instances: 2,075,259Missing values: Yes
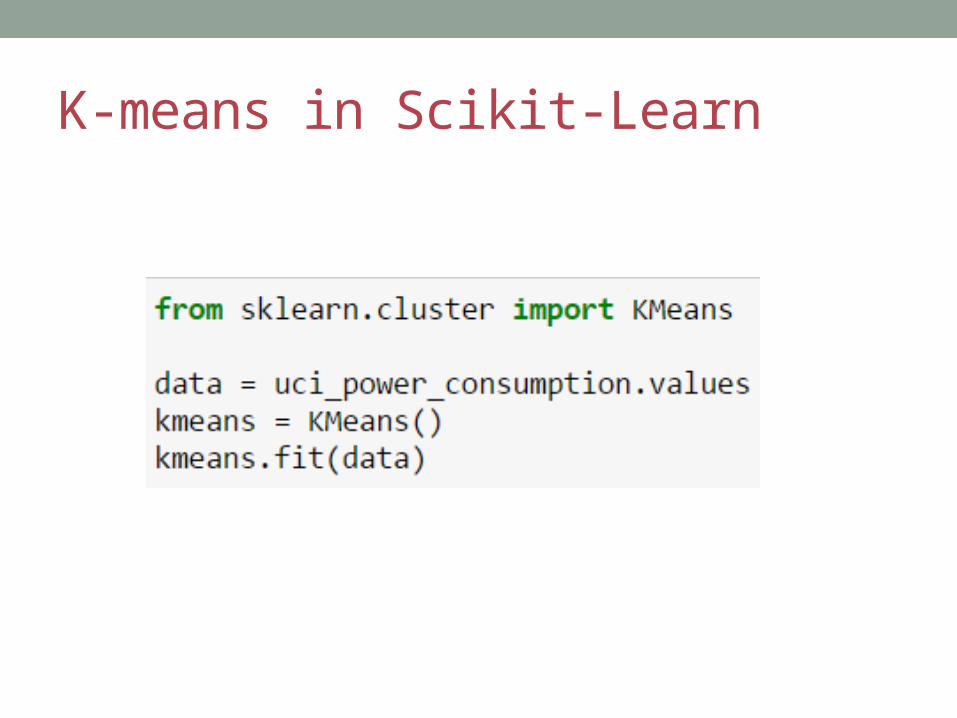
K-means in Scikit-Learn
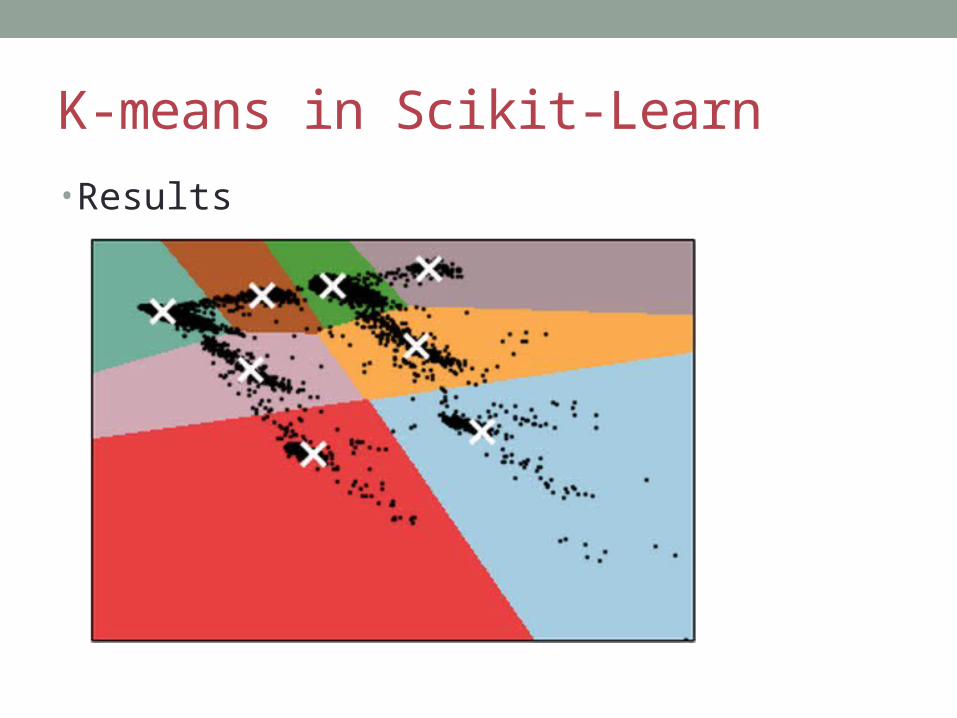
K-means in Scikit-Learn• Results
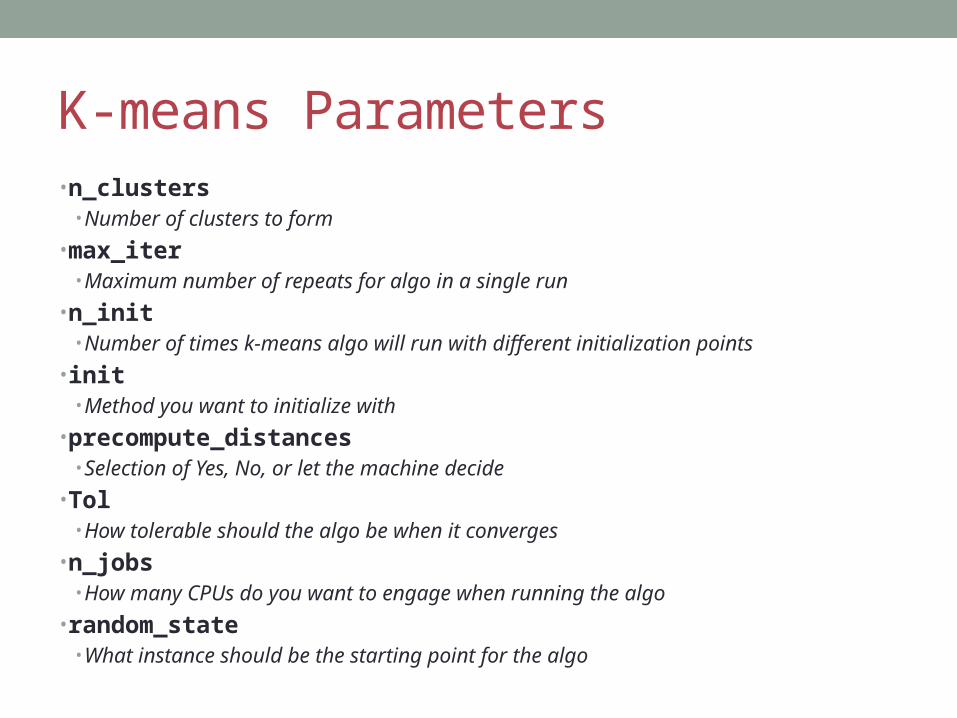
K-means Parameters• n_clusters
• Number of clusters to form• max_iter
• Maximum number of repeats for algo in a single run• n_init
• Number of times k-means algo will run with different initialization points• init
• Method you want to initialize with• precompute_distances
• Selection of Yes, No, or let the machine decide• Tol
• How tolerable should the algo be when it converges• n_jobs
• How many CPUs do you want to engage when running the algo• random_state
• What instance should be the starting point for the algo
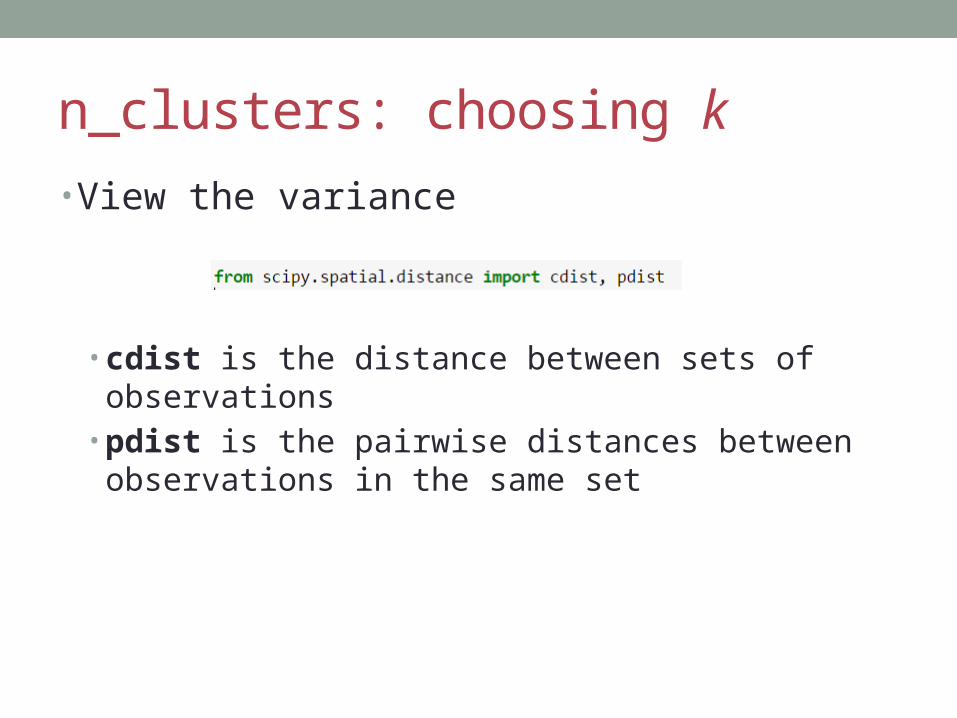
n_clusters: choosing k• View the variance
• cdist is the distance between sets of observations• pdist is the pairwise distances between observations in
the same set

n_clusters: choosing kStep 1: Determine your k rangeStep 2: Fit the k-means model for each n_clusters = kStep 3: Pull out the cluster centers for each model
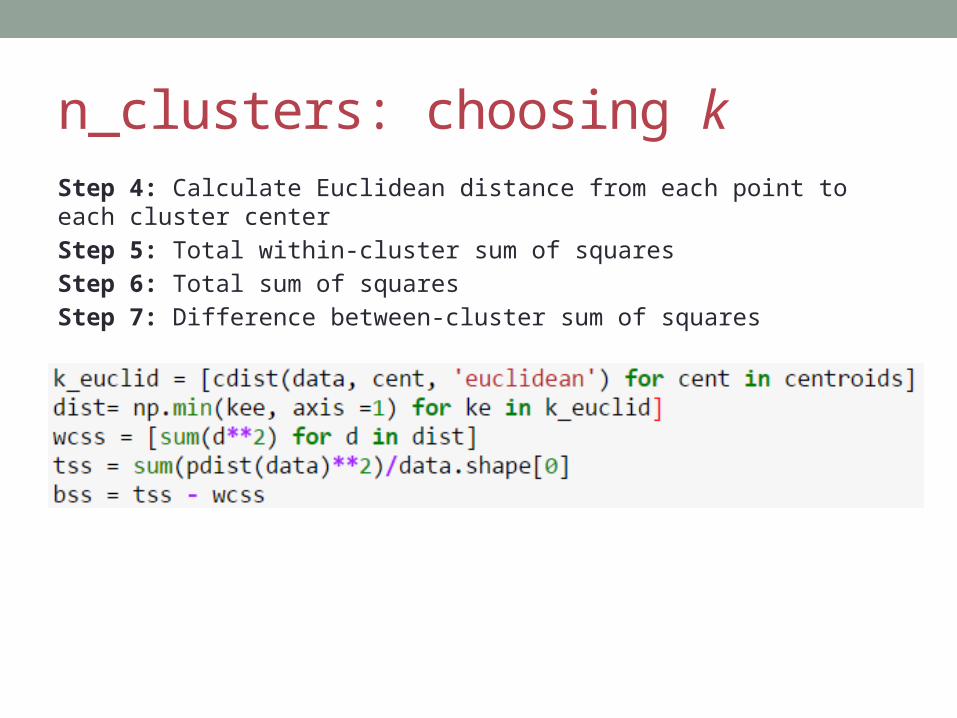
n_clusters: choosing kStep 4: Calculate Euclidean distance from each point to each cluster centerStep 5: Total within-cluster sum of squaresStep 6: Total sum of squaresStep 7: Difference between-cluster sum of squares
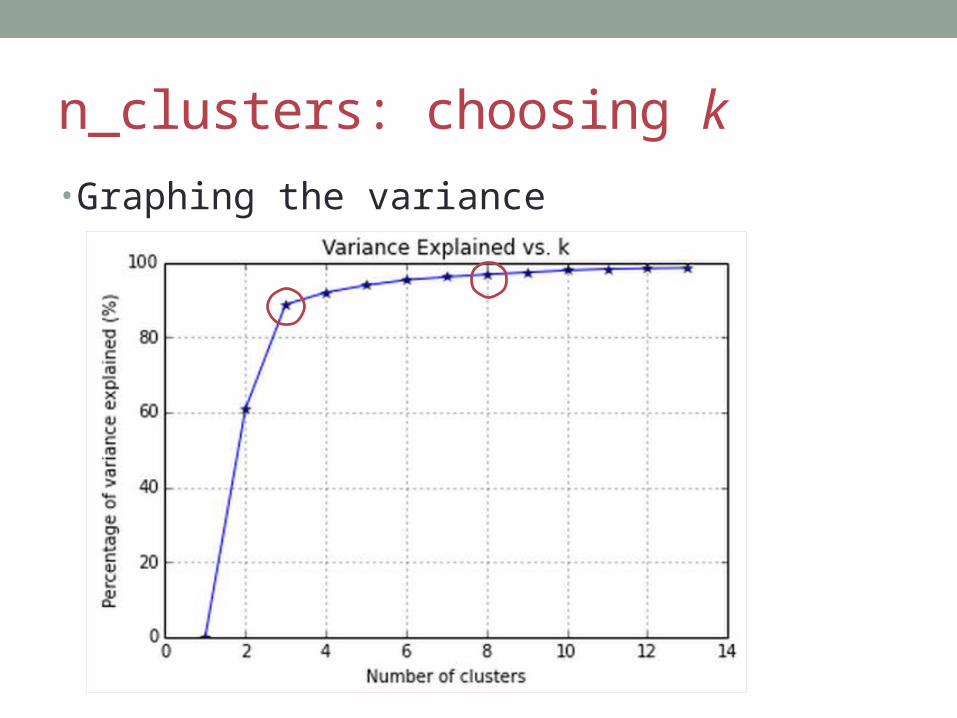
n_clusters: choosing k• Graphing the variance
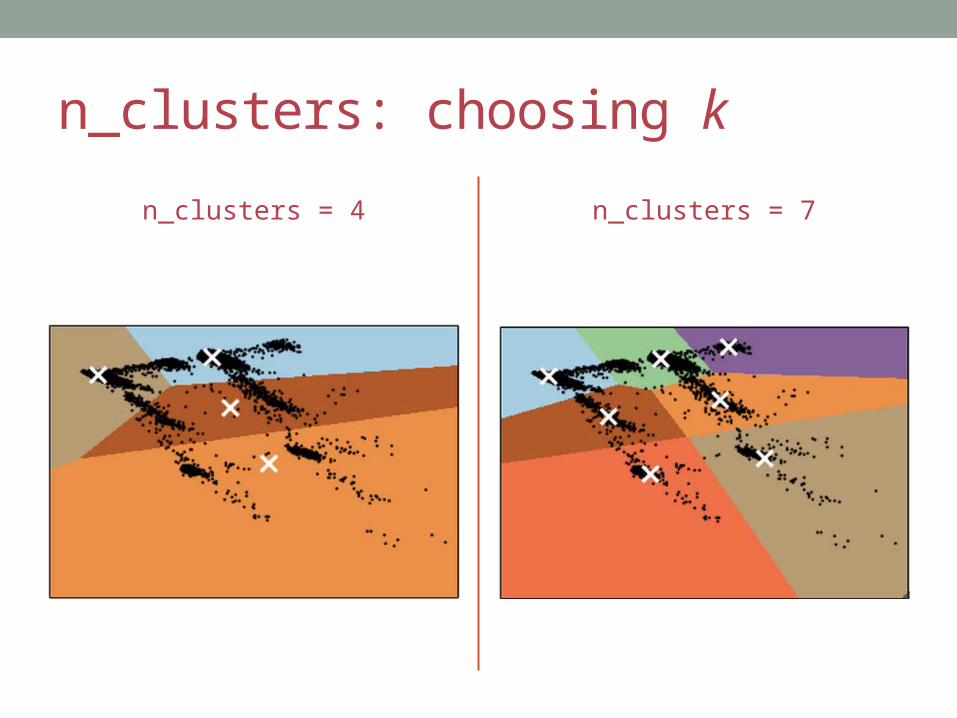
n_clusters: choosing k
n_clusters = 4 n_clusters = 7
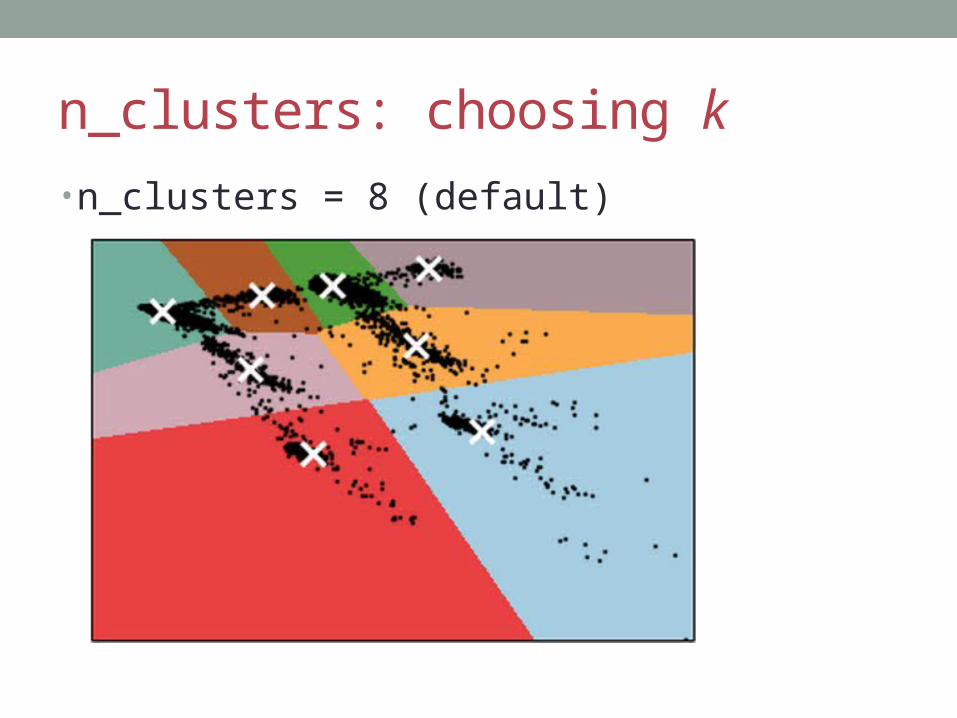
n_clusters: choosing k• n_clusters = 8 (default)
initMethods and their meaning:• k-means++
• Selects initial clusters in a way that speeds up convergence
• random• Choose k rows at random for initial centroids
• Ndarray that gives initial centers• (n_clusters, n_features)
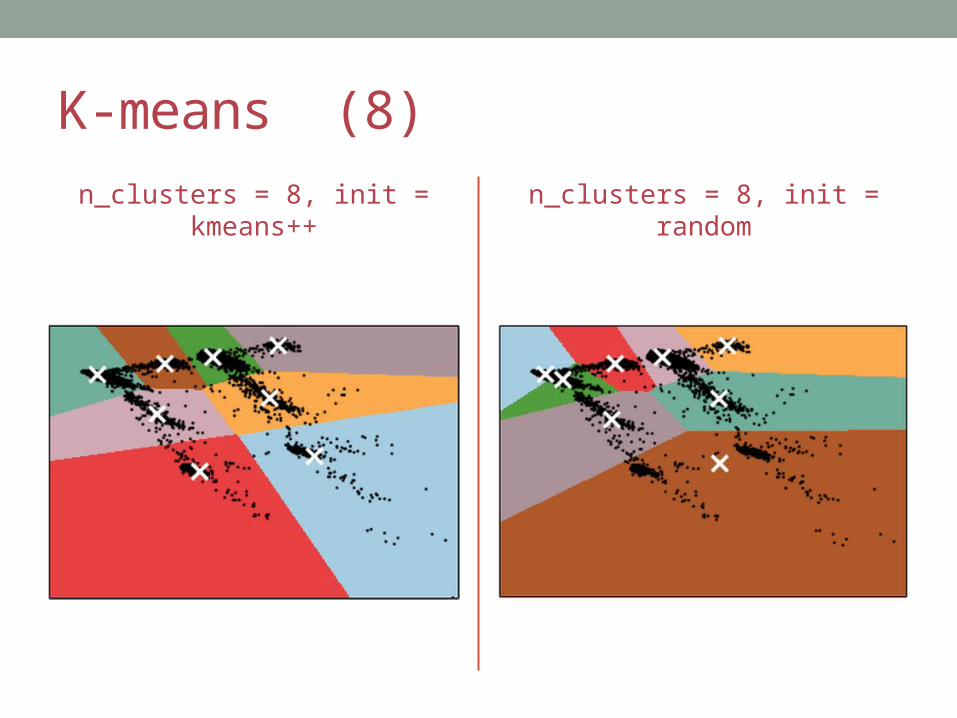
K-means (8)
n_clusters = 8, init = kmeans++ n_clusters = 8, init = random
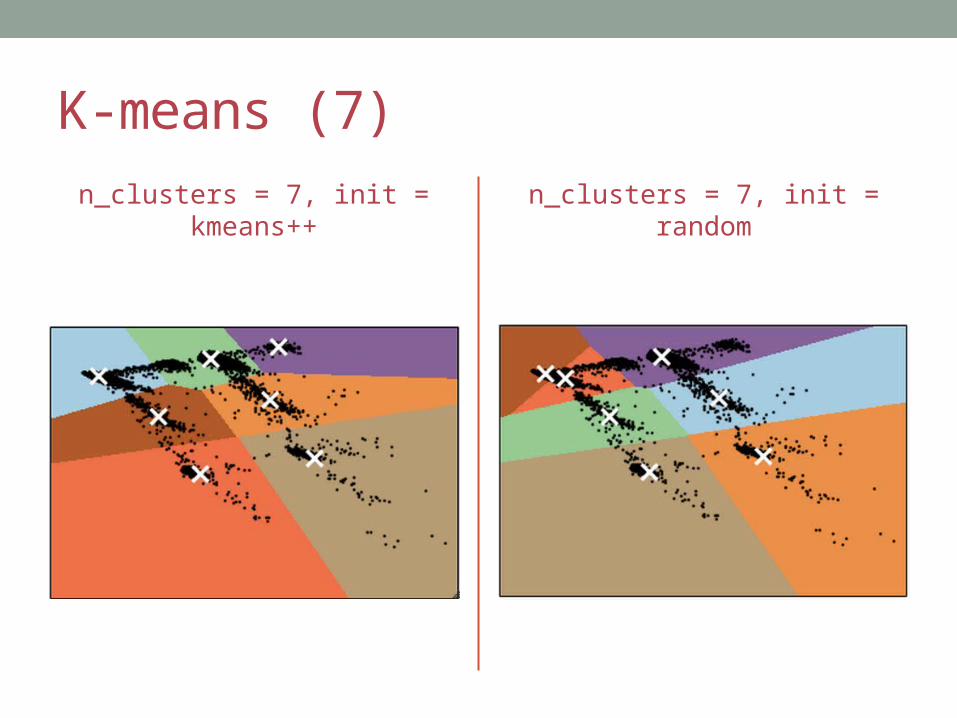
K-means (7)
n_clusters = 7, init = kmeans++ n_clusters = 7, init = random
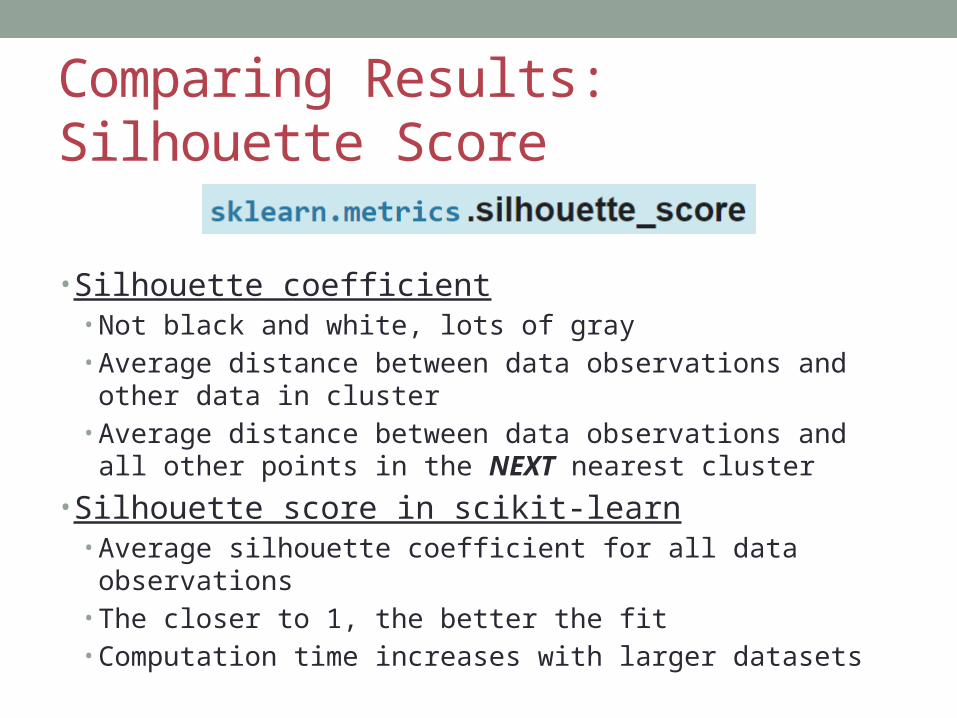
Comparing Results: Silhouette Score
• Silhouette coefficient• Not black and white, lots of gray• Average distance between data observations and other data
in cluster• Average distance between data observations and all other
points in the NEXT nearest cluster• Silhouette score in scikit-learn
• Average silhouette coefficient for all data observations• The closer to 1, the better the fit• Computation time increases with larger datasets
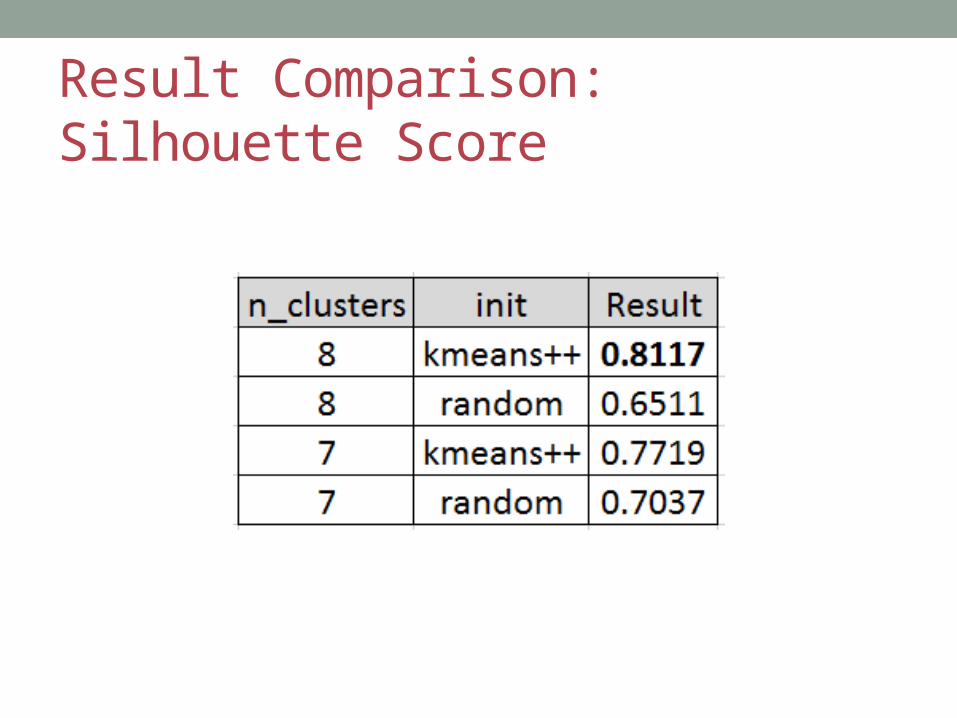
Result Comparison: Silhouette Score
What Do the Results Say?• Data patterns may in fact exist• Similar observations can be grouped• We need additional discovery
A Few Hacks• Clustering is a great way to explore your data and develop intution
• Too many features create a problem for understanding• Use dimensionality reduction
• Use clustering with other methods

Let’s Connect• Twitter: @DamianMingle• LinkedIn: DamianRMingle• Sign-up for Data Science Hacks


![Faculty of Computer Science, Electronics and ... · clustering algorithms are integrated from the scikit-learn such as K-means clustering [9] and DBScan clustering, a density-based](https://img.pdfslide.us/doc/110x75/60a41a41676f8d046f20c8dd/faculty-of-computer-science-electronics-and-clustering-algorithms-are-integrated.jpg)