Embed Size (px)
Citation preview

Chapter 7Analyzing System Process Requirements
Modern Systems Analysisand Design

© 2011 Pearson Education, Inc. 2Chapter 7
Learning Objectives
Understand the logical modeling of processes by studying examples of data flow diagrams (DFDs).
Draw data flow diagrams following specific rules and guidelines that lead to accurate and well-structured process models.
Decompose data flow diagrams into lower-level diagrams.
Balance higher-level and lower-level data flow diagrams.

© 2011 Pearson Education, Inc. 3Chapter 7
Learning Objectives (Cont.)
Use data flow diagrams as a tool to support the analysis of information systems.
Discuss process modeling for electronic commerce applications.
Use decision tables to represent the logic of choice in conditional statements.

© 2011 Pearson Education, Inc.
Process Modeling
4Chapter 7
FIGURE 7-1Systems development life cycle with the analysis phase highlighted

© 2011 Pearson Education, Inc. 5Chapter 7
Process Modeling (Cont.)
Graphically represent the processes that capture, manipulate, store, and distribute data between a system and its environment and among system components.

© 2011 Pearson Education, Inc. 6Chapter 7
Process Modeling (Cont.)
Utilize information gathered during requirements determination.
Processes and data structures are modeled.
© 2011 Pearson Education, Inc. 7Chapter 7
Deliverables and Outcomes
Context data flow diagram (DFD)Scope of system
DFDs of current physical systemAdequate (enough) detail only
DFDs of current logical systemEnables analysts to understand current
system

© 2011 Pearson Education, Inc. 8Chapter 7
Deliverables and Outcomes (Cont.)
DFDs of new logical systemTechnology independentShow data flows, structure, and
functional requirements of new system Thorough description of each DFD
component

© 2011 Pearson Education, Inc. 9Chapter 7
Data Flow Diagramming Mechanics
Represent both physical and logical information systems
Only four symbols are used

© 2011 Pearson Education, Inc. 10Chapter 7
Data Flow Diagramming Mechanics (Cont.) Useful for depicting purely logical
information flows DFDs that detail physical systems
differ from system flowcharts which depict details of physical computing equipment

© 2011 Pearson Education, Inc. 11Chapter 7
Definitions and Symbols
FIGURE 7-2Comparison of DeMarco and Yourdon and Gane and Sarson DFD symbol sets

© 2011 Pearson Education, Inc. 12Chapter 7
Definitions and Symbols (Cont.)
Process: work or actions performed on data (inside the system)
Data store: data at rest (inside the system)

© 2011 Pearson Education, Inc. 13Chapter 7
Definitions and Symbols (Cont.)
Source/sink: external entity that is origin or destination of data (outside the system)
Data flow: arrows depicting movement of data

© 2011 Pearson Education, Inc.
Developing DFDs
Context diagram is an overview of an organizational system that shows: the system boundaries.external entities that interact with the system.major information flows between the entities
and the system.Note: only one process symbol, and no data
stores shown
14Chapter 7

© 2011 Pearson Education, Inc.
Context Diagram
15Chapter 7
FIGURE 7-4Context diagram of Hoosier Burger’s food-ordering system

© 2011 Pearson Education, Inc.
Developing DFDs (Cont.)
Level-0 diagram is a data flow diagram that represents a system’s major processes, data flows, and data stores at a high level of detail.Processes are labeled 1.0, 2.0, etc. These will
be decomposed into more primitive (lower-level) DFDs.
16Chapter 7

© 2011 Pearson Education, Inc.
Level-0 Diagram
17Chapter 7
FIGURE 7-5Level-0 DFD of Hoosier Burger’s food-ordering system

© 2011 Pearson Education, Inc. 18Chapter 7
Data Flow Diagramming Rules
There are two DFD guidelines that apply:The inputs to a process are different from the
outputs of that process. Processes purpose is to transform inputs into
outputs.
Objects on a DFD have unique names. Every process has a unique name.

© 2011 Pearson Education, Inc.
Data Flow Diagramming Rules (Cont.)
19Chapter 7
TABLE 7-2 Rules Governing Data Flow Diagramming

© 2011 Pearson Education, Inc.
Data Flow Diagramming Rules (Cont.)
20Chapter 7
TABLE 7-2 Rules Governing Data Flow Diagramming (cont.)

© 2011 Pearson Education, Inc. 21Chapter 7
Decomposition of DFDs
Functional decomposition is an iterative process of breaking a system description down into detail.Creates a set of charts in which one process
on a given chart is explained in greater detail on another chart.
Continues until no sub-process can logically be broken down any further.

© 2011 Pearson Education, Inc. 22Chapter 7
Decomposition of DFDs (Cont.)
Primitive DFD is the lowest level of a DFD. Level-1 diagram results from
decomposition of Level-0 diagram. Level-n diagram is a DFD diagram that is
the result of n nested decompositions from a process on a level-0 diagram.

© 2011 Pearson Education, Inc. 23Chapter 7
Level-1 DFD
Level-1 DFD shows the sub-processes of one of the processes in the Level-0 DFD.
This is a Level-1 DFD for Process 4.0.
Processes are labeled 4.1, 4.2, etc. These can be further decomposed in more primitive (lower-level) DFDs if necessary.
FIGURE 7-8Level-1 diagram showing the decomposition of Process 4.0 from the level-0 diagram for Hoosier Burger’s food-ordering system

© 2011 Pearson Education, Inc. 24Chapter 7
Level-n DFD
Level-n DFD shows the sub-processes of one of the processes in the Level n-1 DFD.
This is a Level-2 DFD for Process 4.3.
Processes are labeled 4.3.1, 4.3.2, etc. If this is the lowest level of the hierarchy, it is called a primitive DFD.
FIGURE 7-9Level-2 diagram showing the decomposition of Process 4.3 from the level-1 diagram for Process 4.0 for Hoosier Burger’s food-ordering system

© 2011 Pearson Education, Inc. 25Chapter 7
Balancing DFDs
Conservation Principle: conserve inputs and outputs to a process at the next level of decomposition
Balancing: conservation of inputs and outputs to a data flow diagram process when that process is decomposed to a lower level

© 2011 Pearson Education, Inc. 26Chapter 7
Balancing DFDs (Cont.)
Balanced means:Number of inputs to lower level DFD
equals number of inputs to associated process of higher-level DFD
Number of outputs to lower level DFD equals number of outputs to associated process of higher-level DFD

© 2011 Pearson Education, Inc. 27Chapter 7
Balancing DFDs (Cont.)
This is unbalanced because the process of the context diagram has only one input but the Level-0 diagram has two inputs.
1 input1 output
2 inputs1 output
FIGURE 7-10 An unbalanced set of data flow diagrams
(a) Context diagram
(b) Level-0 diagram

© 2011 Pearson Education, Inc. 28Chapter 7
Balancing DFDs (Cont.)
Data flow splitting is when a composite data flow at a higher level is split and different parts go to different processes in the lower level DFD.
The DFD remains balanced because the same data is involved, but split into two parts.

© 2011 Pearson Education, Inc.
Balancing DFDs (Cont.)
29Chapter 7
FIGURE 7-11Example of data flow splitting
(a) Composite data flow
(b) Disaggregated data flows

© 2011 Pearson Education, Inc. 30Chapter 7
Balancing DFDs: More DFD Rules
© 2011 Pearson Education, Inc. 31Chapter 7
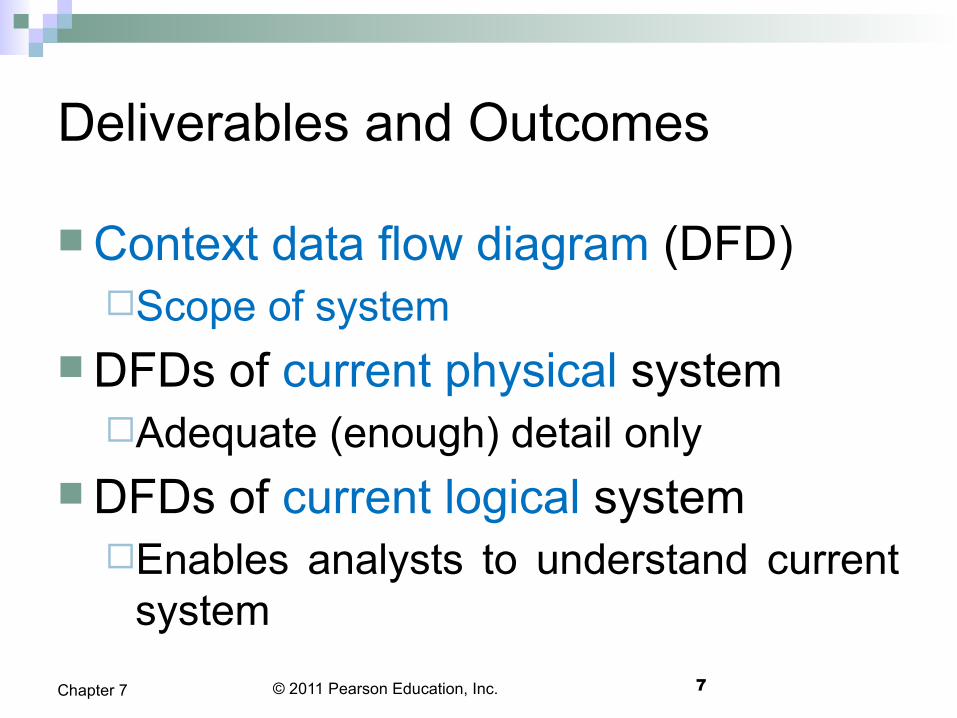
Four Different Types of DFDs
Current Physical Process labels identify technology (people or
systems) used to process the data. Data flows and data stores identify actual name of the
physical media. Current Logical
Physical aspects of system are removed as much as possible.
Current system is reduced to data and processes that transform them.

© 2011 Pearson Education, Inc. 32Chapter 7
Four Different Types of DFDs (Cont.)
New Logical Includes additional functions.Obsolete functions are removed. Inefficient data flows are reorganized.
New PhysicalRepresents the physical implementation of
the new system.

© 2011 Pearson Education, Inc. 33Chapter 7
Guidelines for Drawing DFDs
CompletenessDFD must include all components necessary
for system.Each component must be fully described in
the project dictionary or CASE repository. Consistency
The extent to which information contained on one level of a set of nested DFDs is also included on other levels

© 2011 Pearson Education, Inc. 34Chapter 7
Guidelines for Drawing DFDs (Cont.)
TimingTime is not represented well on DFDs.
Iterative DevelopmentAnalyst should expect to redraw diagram
several times before reaching the closest approximation to the system being modeled.

© 2011 Pearson Education, Inc. 35Chapter 7
Guidelines for Drawing DFDs (Cont.)
Primitive DFDsLowest logical level of decompositionDecision has to be made when to stop
decomposition

© 2011 Pearson Education, Inc. 36Chapter 7
Guidelines for Drawing DFDs (Cont.)
Rules for stopping decompositionWhen each process has been reduced
to a single decision, calculation or database operation
When each data store represents data about a single entity

© 2011 Pearson Education, Inc. 37Chapter 7
Guidelines for Drawing DFDs (Cont.)
Rules for stopping decomposition, cont.When the system user does not care to
see any more detailWhen every data flow does not need to
be split further to show that data are handled in various ways

© 2011 Pearson Education, Inc. 38Chapter 7
Guidelines for Drawing DFDs (Cont.)
Rules for stopping decomposition, cont.When you believe that you have shown
each business form or transaction, online display and report as a single data flow
When you believe that there is a separate process for each choice on all lowest-level menu options

© 2011 Pearson Education, Inc. 39Chapter 7
Using DFDs as Analysis Tools
Gap Analysis is the process of discovering variance between two or more sets of DFD or variance within a single DFD.
Inefficiencies in a system can often be identified through DFDs.

© 2011 Pearson Education, Inc.
Using DFDs in Business Process Re-Engineering BPR
40Chapter 7
FIGURE 7-16IBM Credit Corporation’s primary work process before BPR(Source: Based on Hammer and Champy, 1993.)

© 2011 Pearson Education, Inc.
Using DFDs in BPR (Cont.)
41Chapter 7
FIGURE 7-17IBM Credit Corporation’s primary work process after BPR(Source: Based on Hammer and Champy, 1993.)

© 2011 Pearson Education, Inc. 42Chapter 7
Modeling Logic with Decision Tables Decision table: a matrix representation of
the logic of a decision which specifies the possible conditions for the decision and the resulting actions.
Best used for complicated decision logic.
© 2011 Pearson Education, Inc. 43Chapter 7
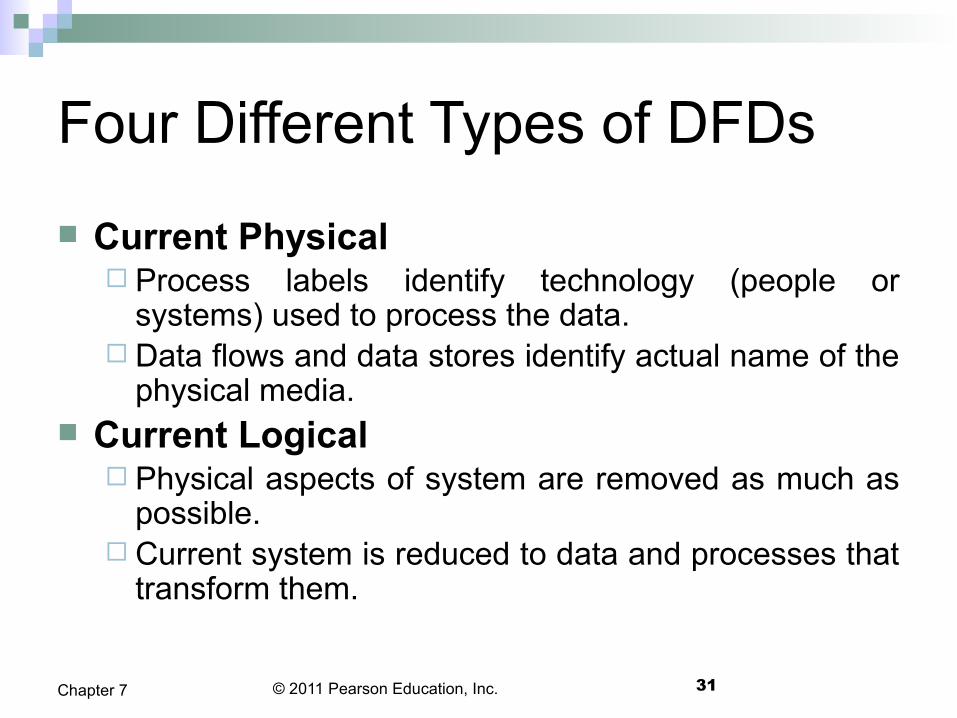
Modeling Logic with Decision Tables (Cont.)
FIGURE 7-18Complete decision table for payroll system example
Employee Type: “S,” stands for salaried, and “H,” which stands for hourly

© 2011 Pearson Education, Inc. 44Chapter 7
Modeling Logic with Decision Tables (Cont.) Condition stubs: that part of a decision
table that lists the conditions relevant to the decision
Action stubs: that part of a decision table that lists the actions that result for a given set of conditions

© 2011 Pearson Education, Inc. 45Chapter 7
Modeling Logic with Decision Tables (Cont.) Rules: that part of a decision table that
specifies which actions are to be followed for a given set of conditions
Indifferent condition: in a decision table, a condition whose value does not affect which actions are taken for two or more rules

© 2011 Pearson Education, Inc. 46Chapter 7
Modeling Logic with Decision Tables (Cont.) Procedure for Creating Decision Tables
Name the condition and the values that each condition can assume.
Name all possible actions that can occur.List all possible rules.Define the actions for each rule.Simplify the table.

© 2011 Pearson Education, Inc. 47Chapter 7
Modeling Logic with Decision Tables (Cont.)
FIGURE 7-19Reduced decision table for payroll system example

© 2011 Pearson Education, Inc.
Electronic Commerce Application: Process Modeling using Data Flow Diagrams
48Chapter 7
FIGURE 7-22Level-0 data flow diagram for theWebStore

© 2011 Pearson Education, Inc.
Assignments
49Chapter 7
1. All Problems and Exercises.
2. Case Problems

© 2011 Pearson Education, Inc.
Thanks
50Chapter 7