Embed Size (px)
Citation preview

BUSINESS INTELLIGENCE ANDOLAP PRACTICE
Tatiana Ivanova

SUPPLEMENTAL READING ONE: MINING PURCHASING SEQUENCE DATA FOR ONLINE CUSTOMER SEGMENTATION
METHODS AND LIMITATIONS
• Measuring Time Series, ARMA method
• Not relevant when time is not a useful static reference dimension
• Powerless with multiple dependent variables and non-numerical sequence pattern analysis
• The Association Distance Measure (ADM) method
• The order of elements is not important
• The Sequence Alignment Method (SAM)
• The general formula for distance calculation is over simplified for a real case
• The time measure in the sequence is missing
• Weblog data mining methods
• Ignore the explicit time measure in the weblog, thus are not suitable for data mining apps where
the explicit time measure is a critical factor

SUPPLEMENTAL READING ONE: MINING PURCHASING SEQUENCE DATA FOR ONLINE CUSTOMER SEGMENTATION
OPS DATA MINING METHOD
• Online Purchasing Sequences (OPS)
• Are a specific type of web navigation sequence data
• Are a major source of online purchasing behaviors
• Are not typical time series and treat time as a spontaneous reference factor
• OPS data mining method
• Matches OPS against SOPS
• Takes into account time, numerical and non-numerical pattern variables
• Reveals customer segments
• Appears to be the most promising method for e-commerce customer management
• Nutrition product store case revealed:
• Sensitivity of purchase values and times in terms of segmentation
• Dynamics of customer segments
• A sophisticated base for marketing strategy

SUPPLEMENTAL READING TWO: MINING INCOMPLETE SURVEY DATA THROUGH CLASSIFICATION
OBJECTIVES AND ALGORITHM • The major objective is to reveal meaningful patterns of missing data, which
would be applicable in decision-making process
• Phase 1: providing classification reference information based on complete data set
• Step 1: selecting a data set with complete data and split it into Train and Test sub-sets
• Step 2: Choosing Classifier, train it and test it. (test must show that Classifier is optimal
for observation by higher percent of accuracy)
• Phase 2: mining of incomplete data against the reference information obtained from complete
data set
• Step 1: selecting observations with missing data
• Step 2: making artificial complete observations by generating artificial imputation values
• Step 3: testing artificial complete data with trained Classifier from Phase 1
• Step 4: developing knowledge in a specific convenient context

SUPPLEMENTAL READING TWO: MINING INCOMPLETE SURVEY DATA THROUGH CLASSIFICATION
APPLICATION AND CONCLUSION
• The case study of home mortgage loan in Dallas County revealed:
• The race factor plays roles in the home loan approval process
• Most applicants who omitted the race value were Hispanic
• Even when all other variable values were equal, changing the race value could result in
significantly different outcome of the home loan application
• The technique of data mining with incomplete data
• Can be a powerful tool for understanding the complicated social, political, and business
decision making processes
• Faces a challenge of subject analysis of decision context at the application level
• Requires a meaningful classification context that is related to the patterns of missing
data

BUSINESS INTELLIGENCE
AUTOMATED DECISION SYSTEMS
• Rule-based system that provides solutions for one functional area;
• Appears to be a great promise for a huge range of industries: banking, insurance, airlines,
supermarkets, energy, transportation, consulting, and etc;
• Now, when the systems are finally taking of, they include a variety of sophisticated
component technologies*:
• Rule Engines process a series of business rules that use conditional statements to
address logical questions (ILog, Pegasystems, Fair Isaac)
• Industry-specific Packages make automated decisions for questions faced by companies
in a particular industry ( CSC, Lending Tree)
• Statistical Or Numeric Algorithms process quantitative data to arrive at an optimal
target, such as a price or a loan amount (SAS, SPSS)
• Workflow Applications enable information-intensive business processes (FileNet Corp)
• Enterprise Systems automate, connect and manage information flows and transaction
processes in complex organizations (SAP, Oracle)

BUSINESS INTELLIGENCE
REAL-TIME DATA WAREHOUSING, ANALYTICS, AND VISUALIZATION
• ADW/RDW is the process of loading and providing data that empowers people, who
interact directly with customers and suppliers with information-based decision making,
which positively affects customer service, SCM, logistics, and etc.
• RDW provides blended tactical and strategic data on demand
• In a RDW context, real-time analytics supports unpredictable, ad hoc queries against large
data sets. E.g*. in CRM, real-time analytics can provide up-to-the-minute information
about an enterprise's customers and present it so that better and quicker business
decisions can be made (sometimes within the time span of a customer interaction)
• The most effective real-time data visualizations are informative and compelling at the
same time. They work to break down aspects of the whole picture in a way that words
sometimes cannot, squeezing big ideas into small, embeddable packages, and putting the
fast-paced nature of the processes into perspective.
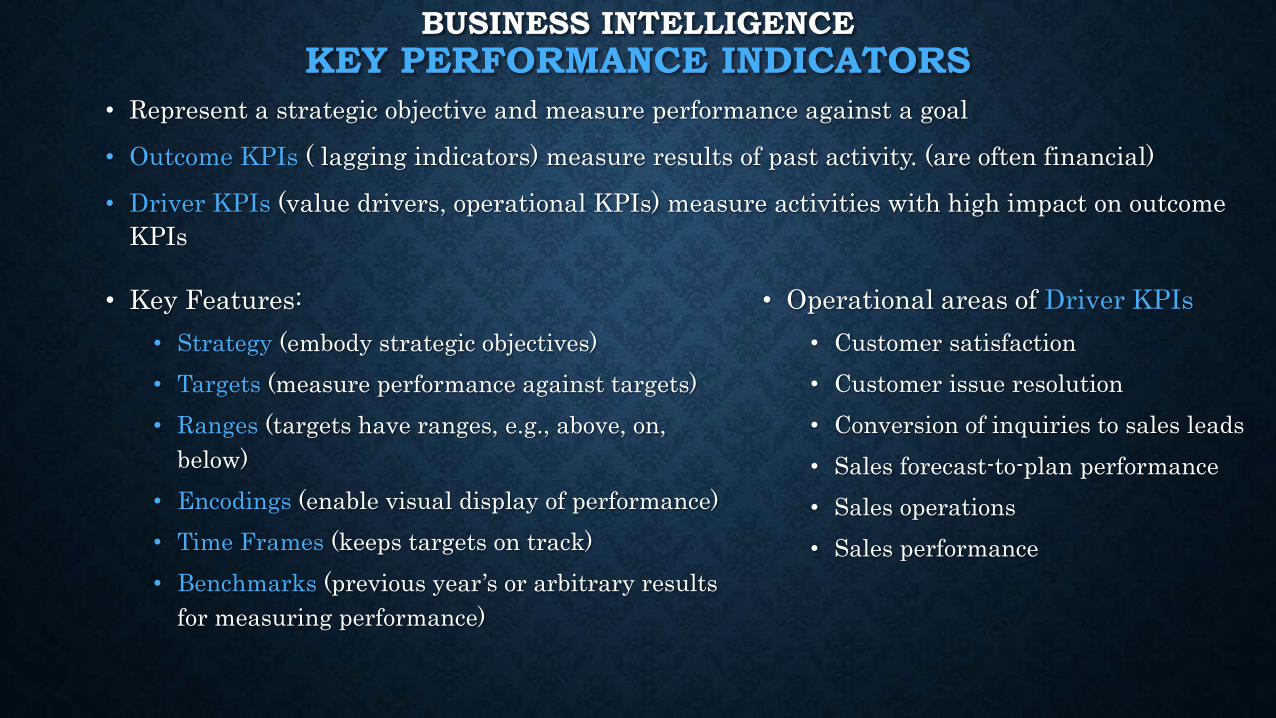
• Represent a strategic objective and measure performance against a goal
• Outcome KPIs ( lagging indicators) measure results of past activity. (are often financial)
• Driver KPIs (value drivers, operational KPIs) measure activities with high impact on outcome
KPIs
BUSINESS INTELLIGENCE
KEY PERFORMANCE INDICATORS
• Key Features:
• Strategy (embody strategic objectives)
• Targets (measure performance against targets)
• Ranges (targets have ranges, e.g., above, on,
below)
• Encodings (enable visual display of performance)
• Time Frames (keeps targets on track)
• Benchmarks (previous year’s or arbitrary results
for measuring performance)
• Operational areas of Driver KPIs
• Customer satisfaction
• Customer issue resolution
• Conversion of inquiries to sales leads
• Sales forecast-to-plan performance
• Sales operations
• Sales performance

BUSINESS INTELLIGENCE
SIX SIGMA
• Strategy designed to improve the quality of a process outputs through statistical analysis of the
processes and use of some lean techniques.
• Minimizes variations in the manufacturing and business processes
• Leads to identifying and removing errors in the process
• Results in improvements in profits, quality of the product, customer retention, and continuous
improvements in business processes.
Requirements
• Formations of Cross-functional Teams
• Widespread employee training
• Four weeks of advanced training for process improvement specialists (Black Belts)
• Use of DMAIC Process
• Define – Select a process for improvement
• Measure – The quality variables valued buy the customer and goals for improvements
• Analyze – Find Root Cause for the current defect level and review alternatives for process changes
• Improve – Implement changes in the process and checked for improvements
• Control – Ensure the process improvements are not lost over time

BUSINESS INTELLIGENCE
SIX SIGMA AND LEAN APPROACH IN 3M*
1. Infrastructure
Common language
Common software
Common measures
Tools
Active Strategy
EFM system
CTQ tree
Business process mapping
Results:
Collaboration
Efficient work process
Time reduction
Quality improvement
2. Training
“Professionalizing”
Project based approach
Tools
Belt ranking
Right Results approach
Results:
Transferable skills
Increased business performance
Quality improvement
3. Process
Simple and straightforward model
Result oriented
High quality standards
Tools
Lean approach
DMAIC model
Results:
Waste reduction
Quality improvement

OLAP
• A technology that is used to organize large business databases and support business
intelligence
• A category of software tools that provides analysis of data stored in a database
• Enable users to analyze different dimensions of multidimensional data.
• The chief component is the OLAP server, which sits between a client and a database
management systems (DBMS)
• Since OLAP servers are based on multidimensional view of data, here is the list of OLAP
operations in multidimensional data:
• Roll-up
• Drill-down
• Slice and dice
• Pivot (rotate)
NORTHWIND TRADERS
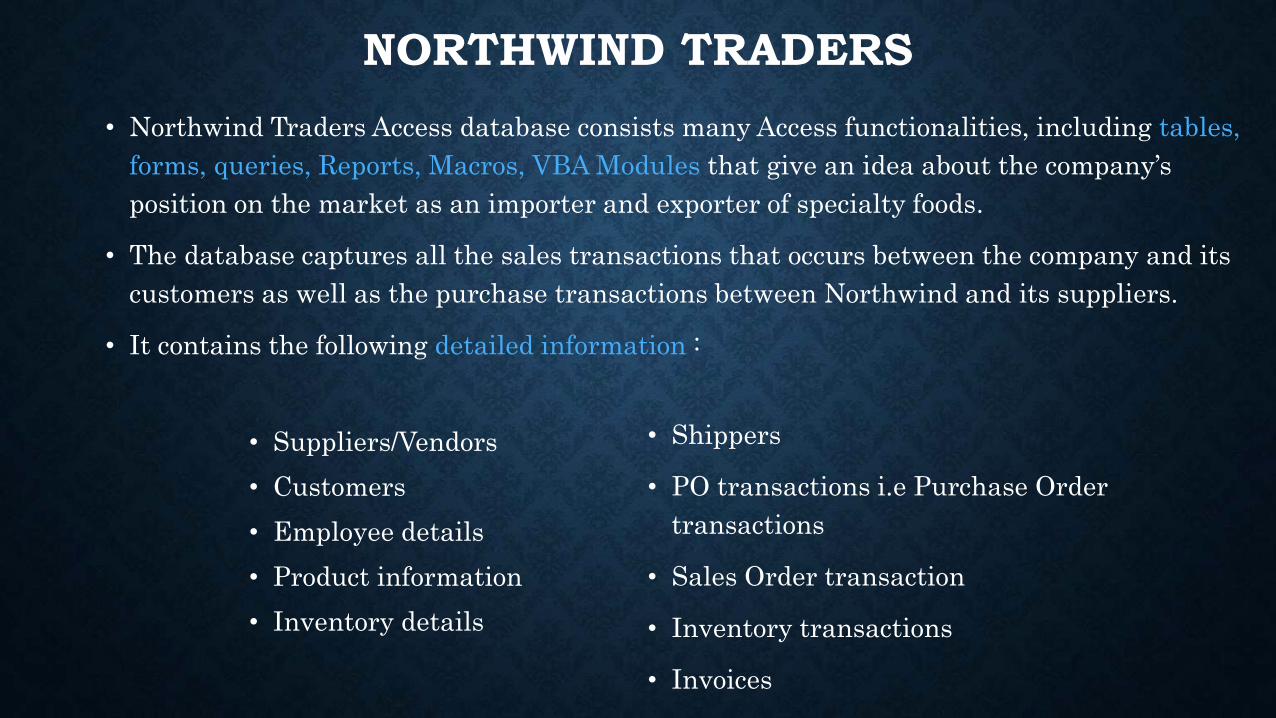
• Northwind Traders Access database consists many Access functionalities, including tables,
forms, queries, Reports, Macros, VBA Modules that give an idea about the company’s
position on the market as an importer and exporter of specialty foods.
• The database captures all the sales transactions that occurs between the company and its
customers as well as the purchase transactions between Northwind and its suppliers.
• It contains the following detailed information :
• Suppliers/Vendors
• Customers
• Employee details
• Product information
• Inventory details
• Shippers
• PO transactions i.e Purchase Order
transactions
• Sales Order transaction
• Inventory transactions
• Invoices
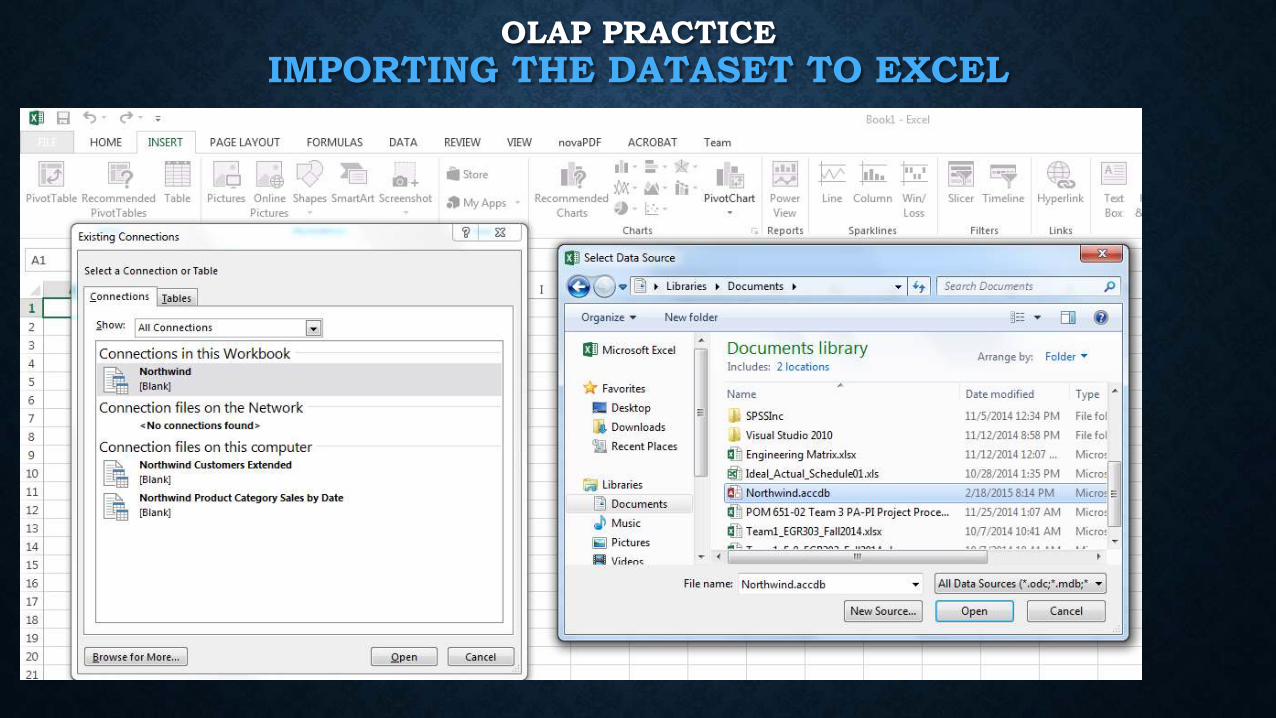
OLAP PRACTICE
IMPORTING THE DATASET TO EXCEL
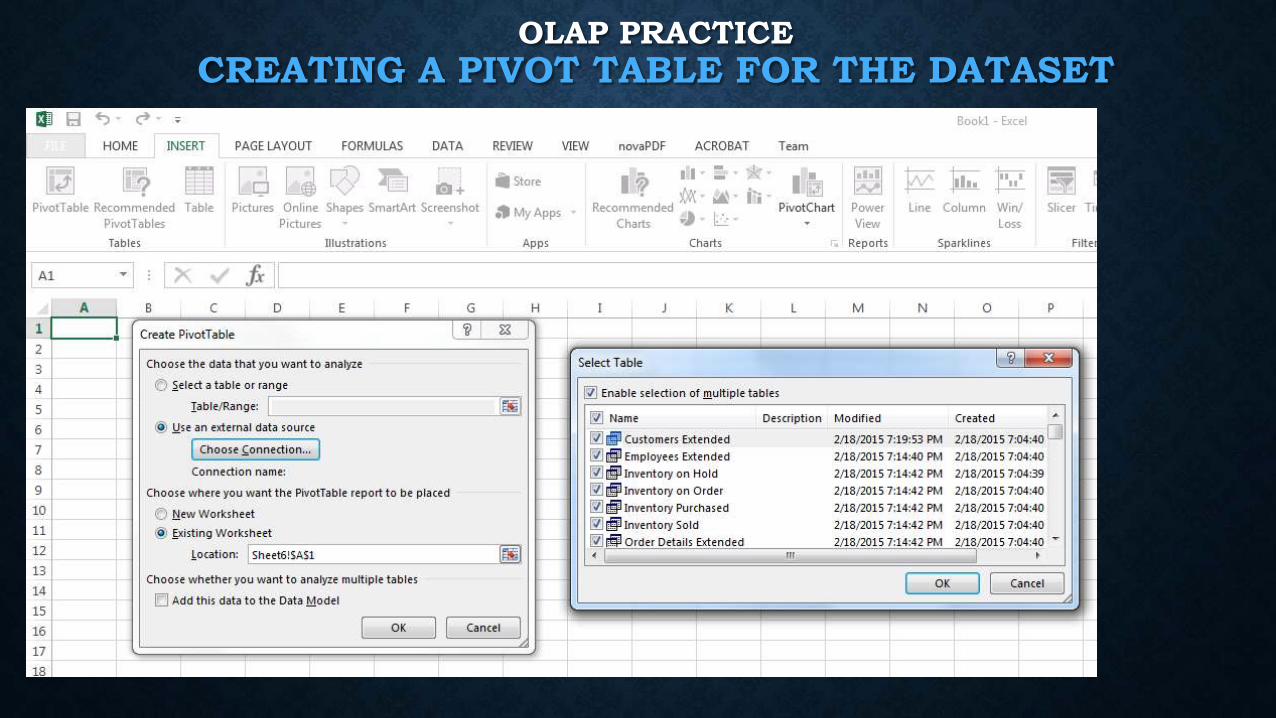
OLAP PRACTICE
CREATING A PIVOT TABLE FOR THE DATASET

OLAP PRACTICE
PIVOT TABLE WITH RELEVANT DATA
• Employee Name, Product, Sales, and Month Name fields for
analyzing Employee performance

OLAP PRACTICE
SLICING, DICING AND DRILL-DOWN
• Sorting and displaying the data by relevance (by employee)

OLAP PRACTICE
T-TEST: PAIRED TWO SAMPLE FOR MEANS
Performing t-Test to compare Sales of two employees

OLAP PRACTICE
VISUALIZATION WITH LINE CHART
Simplifying Product Names for better visualization
Defining legend entries and axis labels
Making the meaningful chart

OPAL PRACTICE
T-TEST: PAIRED TWO SAMPLE FOR MEANS
Performing t-Test for comparing other two employees

OLAP PRACTICE
EMPLOYEE PERFORMANCE
• One of the most critical factors of the business is its workforce
• The key indicators when considering employee performance is sales revenue per worker
• The choice of employees is crucial long-term decision that should be carefully considered,
and if there is technical tool for proper analysis that could help to make this decision, it
should be definitely applied in the best possible way
• Focus of OLAP strategy: who sold? what was sold? when was sold? (Sales Analysis)
• Conclusion: In order to get knowledge that would be truly useful for real decision making
regarding the employees’ performance, the same criteria should be applied when comparing
the candidates. In the particular database we cannot fully analyze usefulness of each
employee using OLAP.

OLAP PRACTICE
EMPLOYEE PERFORMANCE
• For effective analysis of employee performance, next criteria should be
taken into account:
• Sales of the same product
• Sales during the same period of time
• Sales in the same (or equal in terms of demand) location
• Sales of employees with equal experience within the company


![OLAP Theory-English version On-Line Analytical processing (Buisness Intelligence) [Ing.Skorkovský,CSc] KPH_ESF_MU](https://img.pdfslide.us/doc/110x75/56649e235503460f94b10d0d/olap-theory-english-version-on-line-analytical-processing-buisness-intelligence.jpg)


![OLAP Theory-English version On-Line Analytical processing (Business Intelligence) [Ing.J.Skorkovský,CSc.] Department of corporate economy](https://img.pdfslide.us/doc/110x75/56649e9d5503460f94b9e6c8/olap-theory-english-version-on-line-analytical-processing-business-intelligence.jpg)