Embed Size (px)
Citation preview

Building a Data Warehouse for Business Analytics using Spark SQL
Copyright Edmunds.com, Inc. (the “Company”). Edmunds and the Edmunds.com logo are registered trademarks of the Company. This document contains proprietary and/or confidential information of the Company. No part of this document or the information it contains may be used, or disclosed to any person or entity, for any purpose other than advancing the best interests of the Company, and any such disclosure requires the express approval of the Company.
Blagoy Kaloferov Software Engineer
06/15/2015

About me: Blagoy Kaloferov Big Data Software Engineer
About my company: Edmunds.com is a car buying platform
18M+ unique visitors each month
Today’s talk

“It’s about time!”
Agenda
1. Introduction and Architecture
2. Building Next Gen DWH
3. Automating Ad Revenue using Spark SQL
4. Conclusion

Business Analytics at Edmunds.com
Divisions: DWH Engineers
Business Analysts Statistics team
Two major groups: Map Reduce / Spark developers
Analysts with advanced SQL skills

Spark SQL :
• Simplified ETL and enhanced Visualization tools
• Allows anyone in BA to quickly build new Data marts • Enabled a scalable POC to Production process for our
projects
Proposition

Data Ingestions / ETL
Architecture for Analytics
Raw Data Clickstream Inventory Dealer Lead Transaction
HDFS aggregates
Map Reduce jobs
DWH Developers Business Analyst
Hadoop Cluster

Data Ingestions / ETL Reporting Ad Hoc / Dashboards
Architecture for Analytics
Raw Data Clickstream Inventory Dealer Lead Transaction
HDFS aggregates
Map Reduce jobs
Database Redshift
Business Intelligence
Tools
Platfora Tableau
DWH Developers Business Analysts
Hadoop Cluster

Data Ingestions / ETL Reporting Ad Hoc / Dashboards
Architecture for Analytics
Raw Data Clickstream Inventory Dealer Lead Transaction
HDFS aggregates
Map Reduce jobs
Database Redshift
Business Intelligence
Tools
Platfora Tableau
DWH Developers Business Analysts
Hadoop Cluster
Spark Spark SQL
Databricks

Data Ingestions / ETL Reporting Ad Hoc / Dashboards
Architecture for Analytics
Raw Data Clickstream Inventory Dealer Lead Transaction
HDFS aggregates
Map Reduce jobs
Database Redshift
Business Intelligence
Tools
Platfora Tableau
DWH Developers Business Analysts
Hadoop Cluster
Spark Spark SQL

Data Ingestions / ETL Reporting Ad Hoc / Dashboards
Architecture for Analytics
Raw Data Clickstream Inventory Dealer Lead Transaction
HDFS aggregates
Map Reduce jobs
Database Redshift
Business Intelligence
Tools
Platfora Tableau
DWH Developers Business Analysts
Hadoop Cluster
Spark Spark SQL
ETL

Our approach: o Spark SQL tables similar to
existing our Redshift tables
o Best fit for us are Hive tables pointing to S3 delimited data
o Exposed hundreds of Spark SQL tables
Exposing S3 data via Spark SQL

• S3 Datasets have thousands of directories: ( location /year/month/day/hour ) • Every new S3 directory for each dataset has to be registered
Adding Latest Table Partitions
Adding Latest Table Partitions
Spark SQL tables
S3 dataset
S3 dataset
S3 dataset S3 dataset
S3 dataset S3 dataset
S3 dataset
2015/05/31/01 2015/05/31/02
Spark SQL table
partitions

Utilities to for Spark SQL tables and S3:
• Register valid partitions of Spark SQL tables with spark Hive Metastore • Create Last_X_ Days copy of any Spark SQL table in memory
Scheduled jobs:
• Registers latest available directories for all Spark SQL tables programmatically
• Updates Last_3_ Days of core datasets in memory
Adding Latest Table Partitions Spark SQL tables

“It’s about time!”
S3 and Spark SQL potential
o Now that all S3 data is easily accessible, there are a lot of opportunities !
o Anyone can ETL on prefixed
aggregates and create new Data Marts
Spark Cluster
Spark SQL tables Last_3_days Tables
Utilities and UDF’s
Business Intelligence
Tools
Faster Pipeline Better Insights

Platfora Dashboards Pipeline Optimization
o Platfora is a Visualization Analytics Tool o Provides More than 200 dashboards for BA
o Uses MapReduce to load aggregates
Source Dataset Build / Update Lens Dashboards
HDFS S3
Joined Datasets
MapReduce jobs
Platfora Dashboards Pipeline Optimization
Limitations: o We can not optimize the Platfora Map Reduce jobs o Defined Data Marts not available elsewhere
Source Dataset Build / Update Lens Dashboards
HDFS S3
Joined Datasets
MapReduce jobs
Join on lead_id , inventory_id, visitor_id, dealer_id …

Platfora Dealer Leads dataset Use Case
o Dealer Leads: Lead Submitter insights dataset o More than 40 Visual Dashboards are using Dealer Leads
Lead Submitter Data
Region Info
Transaction Data
Vehicle Info
Dealer Info
Dealer Leads Joined Dataset
Lead Categorization
Lead Submitter Insights
join

“It’s about time!”
Optimizing Dealer Leads Dataset
Dealer Leads Platfora Dataset stats: o 300+ attributes
o Usually takes 2-3 hours to build lens o Scheduled to build daily

“It’s about time!”
Optimizing Dealer Leads Dataset
How do we optimize it?
“It’s about time!”
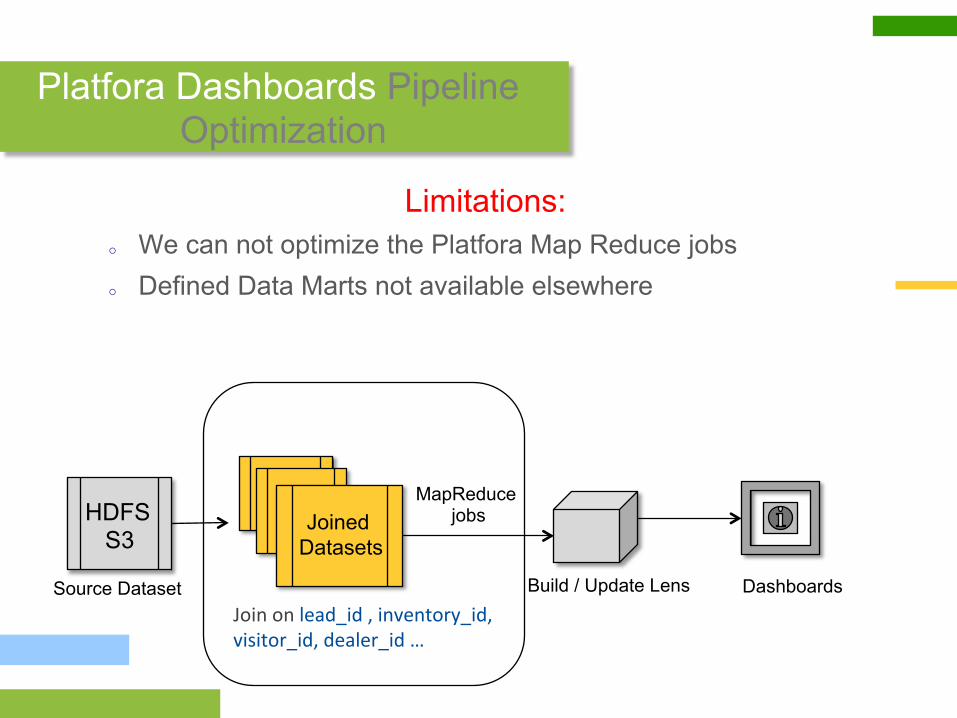
Optimizing Dealer Leads Dataset
How do we optimize it?
1. Have Spark SQL do the work! o All required datasets are exposed as Spark SQL tables o Add new useful attributes
2. Make the ETL easy for anyone in Business Analytics to do it themselves
o Provide utilities and UDF’s so that aggregated data can be exposed to Visualization tools

Dealer Leads Using Spark SQL Demo
Dealer Leads Data Mart using Spark SQL Demo
Expose all original 300+ attributes Enhance: Join with site_traffic
Dealer Leads Dataset
Traffic Data Lead submitter journey
Entry page, page views, device …
aggregate_traffic_spark_sql

Dealer Leads Using Spark SQL results
o Spark SQL aggregation in 10 minutes. o Adds dimension attributes that were not available before
o Platfora does not need to join aggregates o Significantly reduced latency
o Dashboard refreshed every 2 hours instead of once per day.
Spark SQL Dealer Leads
Lens
10 minutes 10 minutes
Dashboards

ETL and Visualization takeaway
o Now anyone in BA can perform and support ETL on their own o New Data marts can be exported to RDBMS
S3 New Data Marts Using Spark SQL Redshift
Platfora
Tableau
Spark Cluster Spark SQL tables
Last N days Tables Utilities
Spark SQL connector
ETL
load

Usual POC process
o Business Analyst Project Prototype in SQL o Not scalable. Takes Ad Hoc resources from RDBMS
o SQL to Map Reduce o Transition from two very different frameworks o MR do not always fit complicated business logic. o Supported only by Developers
POC with Spark SQL vision

“It’s about time!”
POC with Spark SQL vision
new POC process using Spark
o A developer and BA can work together on the same platform and collaborate using Spark
o Its scalable o No need to switch frameworks when productionalizing

Ad Revenue Billing Use Case
Definitions: Impression, CPM Line Item, Order
Introduction
OEM Advertising on website

Introduction
OEM Advertising on website
Ad Revenue computed at the end of the month
using OEM provided impression data
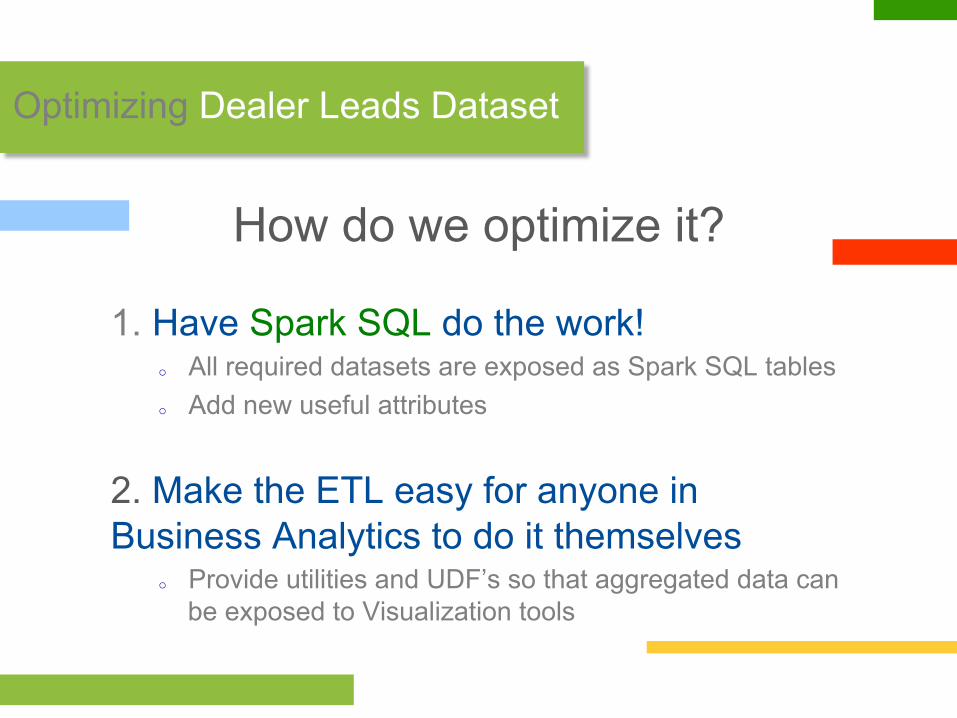
Ad Revenue Billing Use Case
Impressions served * CPM != actual revenue
o There are billing adjustment rules! o Each OEM has a set of unique rules that
determine the actual revenue. o Adjusting revenue numbers requires manual
user inputs from OEM’s Account Manager
Ad Revenue End of Month billing

• Line Item groupings
Line Item adjustments’ examples Box representing each example
ORIGINAL Line Item | CPM | impressions | a?ributes

• Line Item groupings
Line Item adjustments’ examples Box representing each example
ORIGINAL Line Item | CPM | impressions | a?ributes
SUPPORT Line Item | CPM | impressions

• Line Item groupings
Line Item adjustments’ examples Box representing each example
MERGED | CPM | NEW_impressions | a?ributes
Combine data

• Line Item groupings
• Capping / Adjustments
Line Item adjustments’ examples Box representing each example
MERGED | CPM | NEW_impressions | a?ributes
impressions_served > Contract ?
Line Item | impressions| Contract

• Line Item groupings
• Capping / Adjustments
Line Item adjustments’ examples Box representing each example
MERGED | CPM | NEW_impressions | a?ributes
Line Item | CAPPED_impressions| Contract
Cap impression!
impressions_served > Contract ?

• Line Item groupings
• Capping / Adjustments
Line Item adjustments’ examples Box representing each example
MERGED | CPM | NEW_impressions | a?ributes
impressions_served > (X% * Contract) ?
Line Item | impressions| Contract

• Line Item groupings
• Capping / Adjustments
Line Item adjustments’ examples Box representing each example
MERGED | CPM | NEW_impressions | a?ributes
impressions_served > (X% * Contract) ?
Adjust impression!
Line Item | ADJUSTED_impressions| Contract
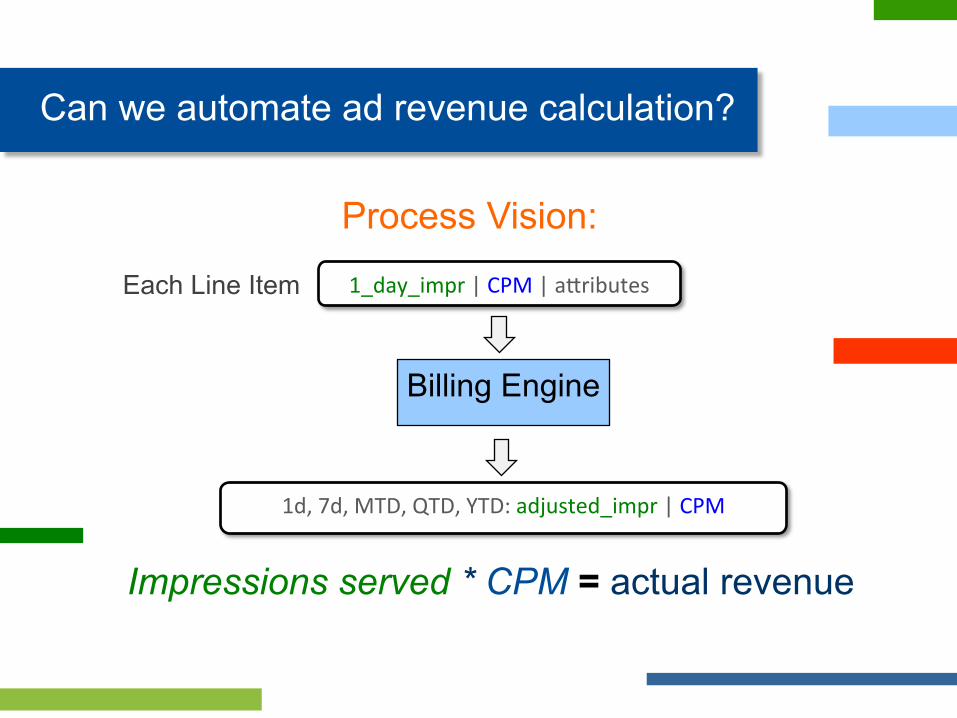
1_day_impr | CPM | a?ributes
1d, 7d, MTD, QTD, YTD: adjusted_impr | CPM
Billing Engine
Each Line Item
Process Vision:
Impressions served * CPM = actual revenue
Can we automate ad revenue calculation?

Automation Challenges
o Many rules , user defined inputs, the logic changes o Need for scalable unified platform o Need for tight collaboration between OEM team,
Business Analysts and DWH developers
Can we automate ad revenue calculation?

Billing Rules Modeling Project
How do we develop it?

Ad Revenue
Billing Rules Modeling Project
How do we develop it?
Spark + Spark SQL approach
BA + Developers + OEM Account Team collaboration
Goal is an Ad Performance Dashboard
Adjusted Billing Ad Revenue
OEM:

Project Architecture in Spark
Sum / Transform / Join Rows
Processing separated in phases where input / outputs are Spark SQL tables
1_day_impr | CPM | a?ributes Spark SQL Row Each Line Item =
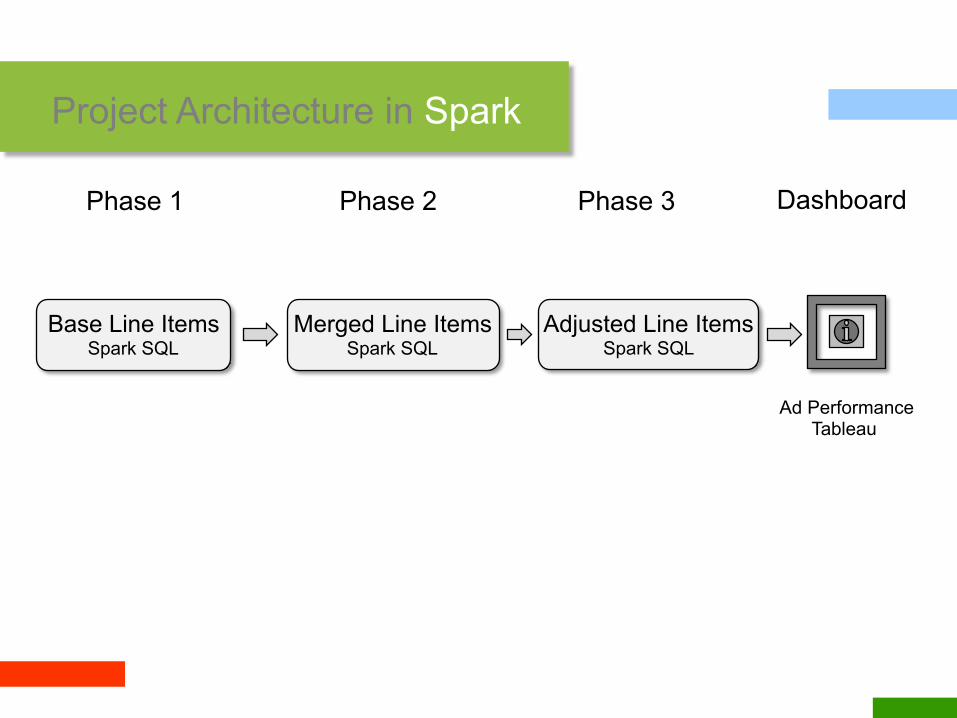
Project Architecture in Spark
Base Line Items Spark SQL
Merged Line Items Spark SQL
Adjusted Line Items Spark SQL
Phase 1 Phase 2 Phase 3
Ad Performance Tableau
Dashboard

Spark SQL
Project Architecture in Spark
Business Analysts
DFP / Other Impressions
Line Item Dimensions
Base Line Items Spark SQL
join aggregate
Phase 1
Merged Line Items Spark SQL
Adjusted Line Items Spark SQL
Phase 2 Phase 3
Ad Performance Tableau
Dashboard

Spark SQL
Project Architecture in Spark
Business Analysts BA + Developer
DFP / Other Impressions
Line Item Dimensions
- Manual Groupings - Other Inputs
Spark SQL
Line Item Merging Engine
OEM Account Managers
Base Line Items Spark SQL
Merged Line Items Spark SQL
join aggregate
Phase 1 Phase 2
Adjusted Line Items Spark SQL
Phase 3
Ad Performance Tableau
Dashboard

Spark SQL
Billing Rules Engine
Project Architecture in Spark
Business Analysts BA + Developer
DFP / Other Impressions
Line Item Dimensions
- Manual Groupings - Other Inputs
Spark SQL
Line Item Merging Engine
Ad Performance Tableau
Business Analysts
OEM Account Managers
Base Line Items Spark SQL
Merged Line Items Spark SQL
Adjusted Line Items Spark SQL
join aggregate
Phase 1 Phase 2 Phase 3 Dashboard

“It’s about time!”
Billing Rules Modeling Achievements
o Increased accuracy of revenue forecasts for BA o Cost savings by not having a dedicated team doing
manual adjustments o Monitor ad delivery rate for orders
o Allows us to detect abnormalities in ad serving
o Collaboration between BA and DWH Developers